




Introduction
Antibiotic stewardship programs are a requirement for all US hospitals, but there are no globally accepted metrics to help these programs benchmark their antibiotic use to other hospitals. One potential metric for benchmarking is the standardized antimicrobial administration ratio (SAAR). The SAAR is a ratio comparing observed to predicted antibiotic use, as estimated from a statistical model that incorporates certain hospital and location-specific factors. Reference van Santen, Edwards and Webb2 The SAAR has been endorsed by the National Quality Forum and is being implemented across US hospitals. Reference Edwards and Srinivasan1
However, it is unclear if the SAAR aligns with the quality of antibiotic use at a hospital, in part because it lacks patient-level risk adjustment. Prior studies have shown that patient-level factors (e.g., patient age, comorbidities, types of infections) are major drivers of variation in antibiotic use across hospitals. Reference Kanerva, Ollgren, Lyytikainen and Finnish Prevalence Survey Study3–Reference Goodman, Pineles and Magder9 Adjusting for patient-level variables when comparing hospitals on their antibiotic use is meant to adjust for patient characteristics that increase the likelihood of needing any antibiotic therapy, an extended duration of antibiotic therapy, or broad-spectrum antibiotic therapy.
An additional limitation of the SAAR is that it is based on days of therapy (DOT). When counting by DOT, every antibiotic is assigned the same DOT, regardless of its spectrum of activity and its likelihood to cause antibiotic resistance. For example, if a patient is prescribed a narrow-spectrum antibiotic like penicillin or a broad-spectrum antibiotic like meropenem, the DOT for each day of antibiotic therapy is still one. In addition, there are many examples of combination antibiotic regimens (e.g., ceftriaxone plus metronidazole) that count for twice the amount of DOT as a single agent (e.g., ertapenem) with a comparable spectrum of activity. Furthermore, by weighting each antibiotic equally, counting by DOT fails to capture de-escalation, which is one of the major activities of antibiotic stewardship programs. Reference Lesprit, Landelle and Brun-Buisson10,Reference Livorsi, O’Leary and Pierce11
To capture de-escalation, several different systems to score antibiotic-spectrum have been proposed. Reference Ilges, Tande and Stevens12 The days of antibiotic spectrum coverage (DASC) metric is one such scoring system; it rates antibiotics on their coverage of 11 wild-type bacterial organisms without acquired resistance and 5 specific resistance mechanisms. Reference Kakiuchi, Livorsi and Perencevich13 Any given antibiotic has a score from 1 to 16 with broader-spectrum agents having higher scores than narrow-spectrum agents. One strength of the DASC compared to other spectrum scores is its inclusion of more antibiotic agents and more organism weighting categories. Several studies suggest that monitoring the DASC metric provides a more comprehensive assessment of inpatient antibiotic stewardship activities than tracking DOT alone. Reference Suzuki, Heintz, Livorsi, Perencevich and Goto14,Reference Murakami, Akazawa and Honda15
Developing stewardship metrics that adjust for differences in patient case-mix when making inter-hospital comparisons and consider spectrum of antibiotic activity may provide more useful tools for benchmarking hospitals on their antibiotic use. Adjusting for case-mix may also improve the acceptability and face validity of stewardship metrics. In this study, we sought to develop risk-standardized metrics for DOT and DASC.
Methods
We performed a mixed-methods study to build risk-standardized metrics for inpatient antibiotic use across all 121 Veterans Health Administration (VHA) hospitals. The study involved leveraging a modified Delphi process, which integrated expert-driven (step 1) and data-driven (step 2) strategies to identify non-modifiable risk factors associated with appropriate inpatient antibiotic use. These non-modifiable risk factors may vary across hospitals and would need to be adjusted for by any attempt to “level the playing field” for benchmarking. To this end, the risk factors we identified were then used to risk-standardize metrics for DOT and DASC. The institutional Review Board (IRB) of the University of Iowa and Iowa City Veterans Health Care System approved this study.
Step 1: deciding which variables to include in our risk-adjustment models
Overview
We used a modified Delphi approach to determine non-modifiable factors directly or indirectly associated with appropriate antibiotic use for inclusion in our risk-adjustment models for the new metrics. The Delphi method is a structured, iterative process for achieving expert consensus when empirical evidence is limited. Reference Dalkey and Helmer16 Consensus is established through multiple rounds of anonymous ratings by content experts (panelists), with opportunities for panelists to review and revise their responses across iterations. Delphi methods have been successfully used to achieve consensus on a wide range of health-related topics. Reference Niederberger and Spranger17–Reference Ebriani, Santiago-Soltero and Anshelevich20 Our modified approach included an initial literature review to generate candidate variables, two rounds of structured blinded expert electronic surveys, plus interim and final panel discussions to refine ratings and finalize variable selection. The process was not entirely blinded, which is in line with prior reports; Reference khodyakov, Grant and Kroger21,Reference Boulkedid, Abdoul, Loustau, Sibony and Alberti22 we wanted to ensure consistent interpretation of variables before disseminating the surveys; we also wanted to provide anonymized group-level feedback to enable iterative refinement.
Literature review
D.J.L. and M.G. reviewed the primary literature to identify potential variables that are readily available in claims data or that hospitals are already collecting for other purposes. Reference Kanerva, Ollgren, Lyytikainen and Finnish Prevalence Survey Study3–Reference Goodman, Pineles and Magder9 Based on this literature review, a set of eligible variables was identified, including facility-level characteristics, patient demographics, types of hospital care provided, discharge diagnoses, chronic conditions, and procedures performed 24–48 hours before admission and during the hospital stay itself.
To classify discharge diagnoses, we identified a three-tiered system that groups diagnoses into those that always, sometimes, and never require antibiotics. Reference King, Tsay, Hicks, Bizune, Hersh and Fleming-Dutra23 To define chronic conditions, we used version 24 (2023 payment year) of the Center for Medicare and Medicaid Services (CMS)’s Hierarchical Condition Category (HCC) codes; HCC codes group over 150,000 ICD-10 codes into 86 categories. To define procedures, we used the Agency for Healthcare Research and Quality (AHRQ)’s Clinical Classification Software (CCS) codes, which group 77,000 procedures into 224 categories. D.J.L. and M.G. eliminated HCC and CCS codes that, based on their clinical expertise, could not be remotely considered to be associated with appropriate antibiotic use. All remaining HCC (n = 56) and CCS (n = 42) codes were moved forward to the Delphi process.
Delphi process
We invited a geographically diverse group of eight Infectious Disease (ID) physicians and two ID pharmacists to participate in the Delphi process. One ID physician opted out after agreeing to participate, so the final panel had nine members; eight panel members are co-authors (T.F.B., S.C., D.D., K.E., M.B.G., K.H., K.M., L.T.). All ID specialists had additional expertise in antibiotic stewardship. Participants were not compensated for their time.
After an introductory virtual meeting in September 2023 to orient panelists to the study, we invited members of the panel to complete a REDCap survey (round 1) that presented a list of 94 variables and asked whether each variable should be considered or excluded from risk-adjustment. Variables were grouped into categories. Participants were also asked for their opinion on whether variables included in the metric for DOT could also be included in the metric for DASC. For each item, space was included for participants to provide written comments. All 9 panelists responded to the survey, and we used ≥7 concordant responses to define consensus. Reference Diamond, Grant and Feldman24 Based on this first survey, there was consensus on how approximately half of the potential risk-adjustment variables should be treated. There was also consensus that the variables included in the metric for DOT can also be included in the metric for DASC.
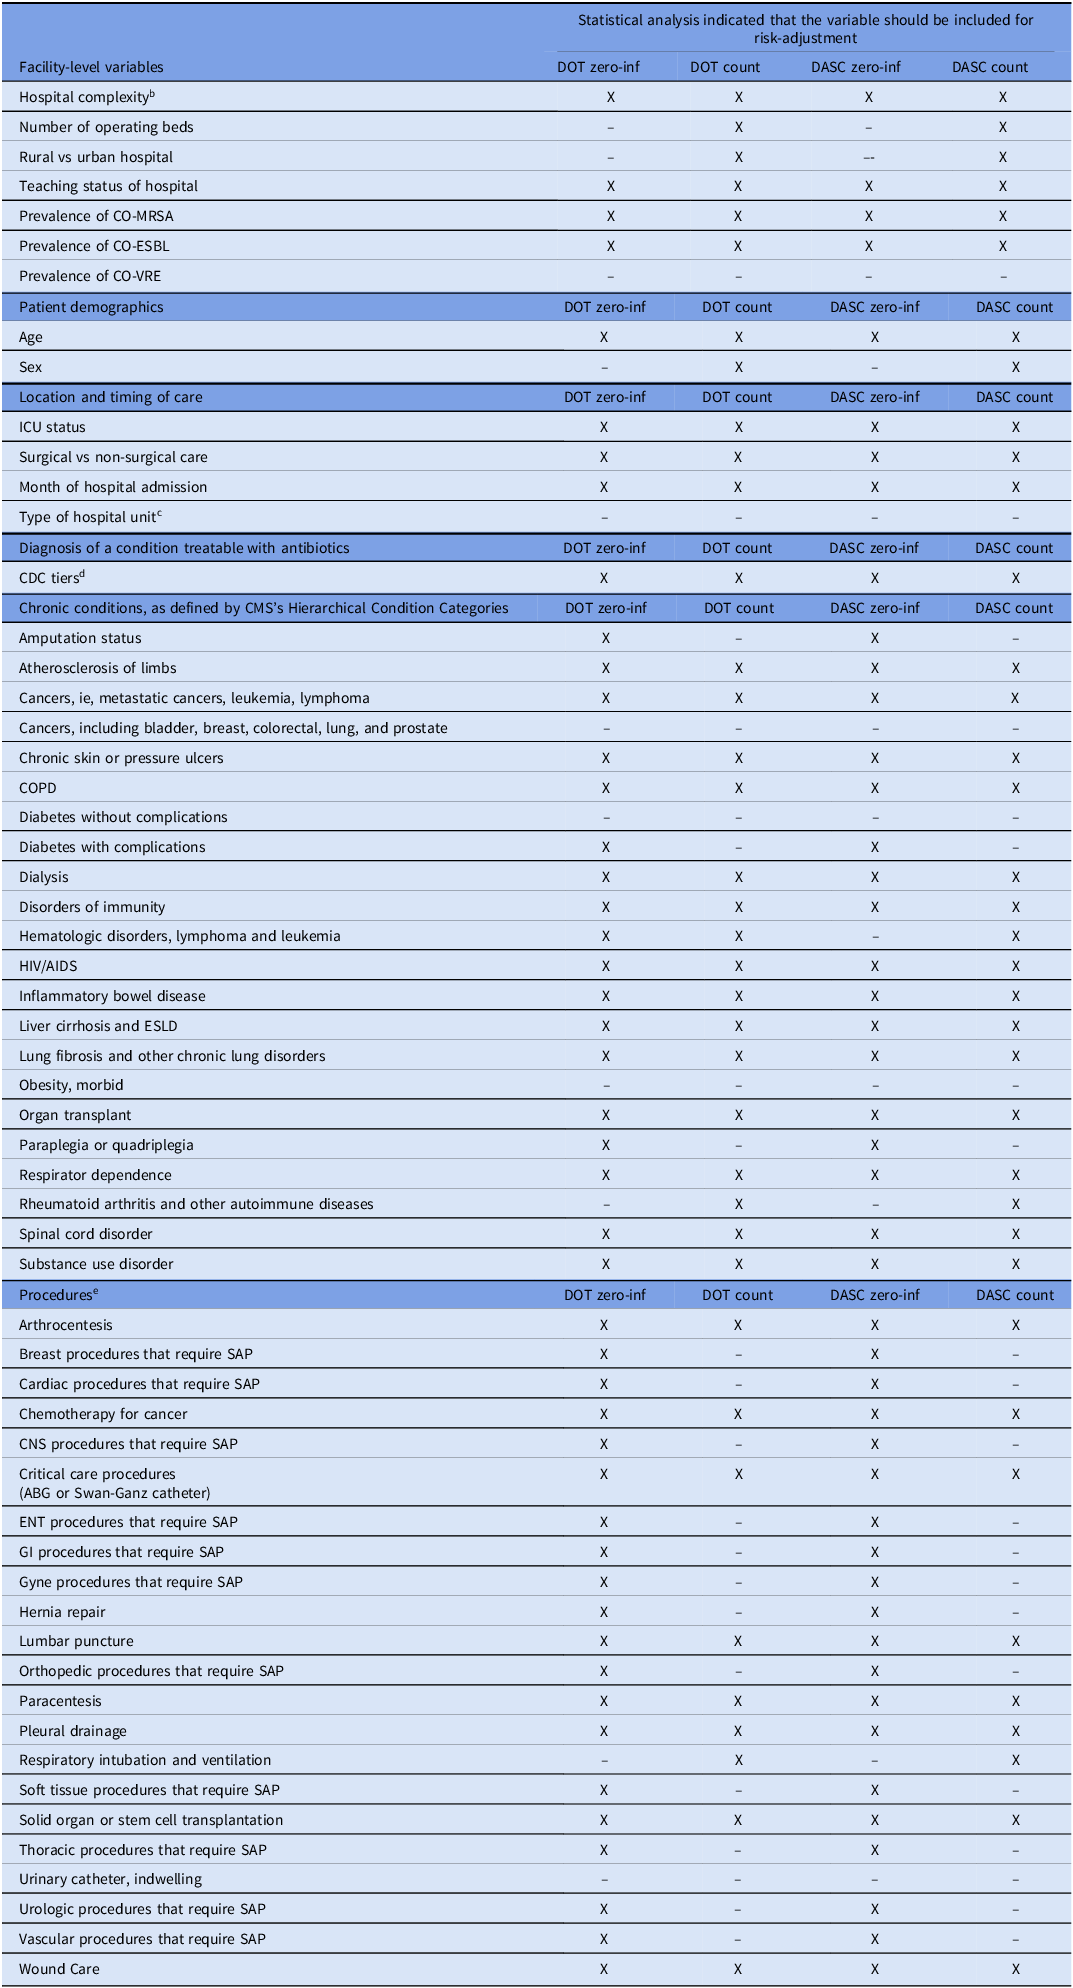
In November 2023, we presented the findings of the first survey via a virtual meeting to the 9 panelists who participated. During this call, the panel reviewed the survey findings and discussed the free-text comments that had been entered. Multiple variables were combined based on the panelists’ feedback while 8 other variables were added. To achieve consensus on the remaining variables, a second REDCap survey was distributed to the same 9 panelists. The combined results of both surveys are shown in Table 1. Of the 89 unique variables included (after variables were combined), there was consensus to further consider 50, exclude 30; no consensus was reached for the remaining 9 variables. All variables for which there was consensus to consider (n = 50) or for which consensus could not be reached (n = 9) were moved forward to step 2.
Candidate variables considered by the modified Delphi process to identify non-modifiable risk factors for appropriate inpatient antibiotic use

ABG, arterial blood gas; CDC, Centers for Disease Control and Prevention; CMS, Centers for Medicare and Medicaid Services; CNS, central nervous system; CMS, Centers for Medicare and Medicaid Services; CO, community-onset; COPD, chronic obstructive pulmonary disease; DASC, days of antibiotic spectrum coverage; DOT, days of therapy; ENT, ear, nose and throat; ESBL, extended spectrum beta-lactamase-producing Enterobacteriaceae; ESLD, end-stage liver disease; GI, gastrointestinal; Gyne, gynecologic; HCC, Hierarchical Condition Categories; ICU, intensive care unit; MRSA, methicillin resistant Staphylococcus aureus; SAP, surgical antibiotic prophylaxis; VRE, vancomycin resistance Enterococcus; zero-inf, zero-inflated.
a Facility complexity scores are created by the VHA Healthcare Analysis and Information Group and reflect several characteristics of a hospital: its patient population, clinical services (eg, intensive care unit [ICU] and surgery services), education and research. A score of 1a is most complex while a score of 3 is least complex.
b Hospital units could be classified as either Medicine, Surgery, or both. Because this same information was being captured by the specialty caring for the patient, we decided not to use hospital unit.
c Discharge diagnoses from each admission were classified as tier 1 (always warrant antibiotics), Tier 2 (sometimes warrant antibiotics), and tier 3 (never require antibiotics, based on the following publication: King LM, Tsay SV, Hicks LA, Bizune D, Hersh AL, Fleming-Dutra K. Changes in outpatient antibiotic prescribing for acute respiratory illnesses, 2011 to 2018. Antimicrob Steward Healthc Epidemiol 2021;1(1):1–8. When multiple diagnoses were coded, only the diagnosis with the lowest number was applied to the patient’s hospital stay.
d Cystic fibrosis was excluded from the risk-adjustment process because it occurred so rarely in the VHA population.
e Clinical Classification Software (CCS) codes for each listed procedure are described in Supplemental Table 2.
Candidate variables for non-modifiable risk factors for appropriate inpatient antibiotic use that were carried forward from the Delphi process to the data-driven selection strategy a

ABG, arterial blood gas; CDC, Centers for Disease Control and Prevention; CMS, Centers for Medicare and Medicaid Services; CNS, central nervous system; CMS, centers for medicare and medicaid services; CO, community-onset; COPD, chronic obstructive pulmonary disease; DASC, days of antibiotic spectrum coverage; DOT, days of therapy; ENT, ear, nose and throat; ESBL, extended spectrum beta-lactamase-producing Enterobacteriaceae; ESLD, end-stage liver disease; GI, gastrointestinal; Gyne, gynecologic; HCC, Hierarchical Condition Categories; ICU, intensive care unit; MRSA, methicillin resistant Staphylococcus aureus; SAP, surgical antibiotic prophylaxis; VRE, vancomycin resistance Enterococcus; zero-inf, zero-inflated.
a Variables excluded by the statistical modeling process have a “–” symbol in at least one of the four columns. Variables marked with an X in at least one of the four columns were included in the risk-adjustment process.
b Facility complexity scores are created by the VHA Healthcare Analysis and Information Group and reflect several characteristics of a hospital: its patient population, clinical services (eg, intensive care unit [ICU] and surgery services), education and research. A score of 1a is most complex while a score of 3 is least complex.
c Hospital units could be classified as either Medicine, Surgery, or both. Because this same information was being captured by the specialty caring for the patient, we decided not to use hospital unit.
d Discharge diagnoses from each admission were classified as tier 1 (always warrant antibiotics), Tier 2 (sometimes warrant antibiotics), and tier 3 (never require antibiotics, based on the following publication: King LM, Tsay SV, Hicks LA, Bizune D, Hersh AL, Fleming-Dutra K. Changes in outpatient antibiotic prescribing for acute respiratory illnesses, 2011 to 2018. Antimicrob Steward Healthc Epidemiol 2021;1(1):1–8. When multiple diagnoses were coded, only the diagnosis with the lowest number was applied to the patient’s hospital stay.
e Clinical Classification Software (CCS) codes for each listed procedure are described in Supplemental Table 2.
Step 2: constructing the risk-adjustment metrics
All analyses were conducted through the VHA Informatics and Computing Infrastructure (VINCI). All data for patient-level predictors, antibiotic use, bed utilization, and antibiotic resistance were extracted from the VHA Corporate Data Warehouse (CDW). For each patient-admission, we collected data on all antibacterials (hereafter “antibiotics”) included in the NHSN’s Antimicrobial Use Protocol. 25 This included inpatient antibiotics administered via the following routes: intravenous, intramuscular, digestive tract (eg., oral), or respiratory tract. Bed utilization was quantified by days-present (DP), a metric used by the NHSN that equates to all patients receiving care in a location for any length of time in each 24-hour period. 25
Variable selection was performed using a two-stage procedure on VHA administrative data from FY2016-2022. In stage 1, we ran zero-inflated negative binomial models on 20 subsets of the full data set (subset size range: 232,565–232,569 admissions), with individuals randomly assigned to subsets. Within each subset, we performed 5-fold cross-validation and applied lasso penalization to both components of the model. In line with our prior work, this subset-based approach was used to improve computational feasibility, assess the stability of selected predictors, and to preserve the benefits of LASSO while increasing generalizability. Reference Goto, Cho and Merchant26 The optimal lambda path for the count (negative binomial) and zero-inflated (logit) components was found using 5-fold cross-validation using the mpath package (v. 0.4.−2.26) in R (Supplemental Table 1); variables with non-zero coefficients in at least 16 of the 20 (ie, 80%) count or zero-inflated components of the penalized subset models were included in the final model for that component. The 80% threshold was selected as a pragmatic and relatively conservative rule to identify variables that were stably selected across subsets. DP was included a priori in both model components (ie, it was not subject to variable selection) due to its importance in modeling antibiotic exposure. Specifically, an offset variable of log(days present) was used to account for length of exposure in the count component of the model, while log(days present) was included as a covariate in the zero-inflated component to account for the possible effect of length of stay on non-zero DOT or DASC value. The same procedure was performed separately for the DOT and DASC outcomes, meaning that the four predictor sets (DOT count, DOT zero-inflated, DASC count, DASC zero-inflated) could differ from one another. A list of variables included in each of the four predictors sets is shown in Table 2. Supplemental Table 2 shows how often eligible variables were selected.
In stage 2, we refit a non-penalized zero-inflated negative binomial (ZINB) mixed-effects model for each outcome using the predictors retained from stage 1, including a facility-specific random intercept for medical center to account for clustering of admissions within facilities (glmmTMB package in R; Supplemental Table 1). Reference Brooks, Kristensen and van Benthem27
Predicted values for individuals in the ZINB model were calculated based on the expected value of a non-zero value (derived from the count component) multiplied by the probability of a non-zero value (derived from the zero-inflated component). Two versions of predicted values were calculated: 1) an individual-level estimate, based on the fixed effects and the predicted random intercepts (BLUPs) for both the zero-inflated and count components of the model, and 2) a population-level estimate, based on the fixed effects alone (ie, with random effects in both components set to zero). These predicted individual values for DOT and DASC were then grouped by medical center and summed to arrive at medical center-level predictions. A risk-standardized ratio (RSR) for DOT was calculated for each facility by dividing their predicted amount of antibiotic use, or the actual risk-adjusted amount of antibiotic use, at that hospital by the expected amount of antibiotic use, or the amount of antibiotic use expected if the hospital’s patients were instead treated at a standardized hospital. A RSR was also calculated for DASC.
To approximate the CDC’s SAAR, we also calculated an observed-to-predicted ratio using only hospital-level data. Reference van Santen, Edwards and Webb2 The amount of predicted DOT at each facility was informed by a negative binomial model that adjusted for the following hospital-level characteristics: teaching status, number of operating beds, presence of an ICU, types of wards, average length of stay, and VHA complexity level. Facility complexity scores are created by the VHA Healthcare Analysis and Information Group. Hospitals are scored according to their patient population, clinical services (e.g., intensive care unit and surgery services), education and research. A score of 1a is the most complex while a score of 3 is the least complex. We assessed for multicollinearity using variance inflation factors (VIF) and all variables had VIF < 5, indicating low to moderate multicollinearity. As a further check, predicted values were compared from the full model and models with individual predictors removed. Correlation between the predicted values with and without individual predictors was high for all variables (>99.9%), indicating that the effect of potential multicollinearity on predicted values was negligible. For these reasons, all variables were retained in the SAAR-like model.
The Kendall’s tau was used to assess the correlation between how a hospital performed on different metrics. For each pairwise comparison, the ranks of each hospital’s metrics were compared to determine the overall strength of the relationship. Kendall’s tau is a non-parametric test of rank correlation and was chosen due to its ability to detect a potential non-linear correlation between variables. It ranges from −1 to +1 with +1 indicating perfect agreement in the ranks and −1 indicating perfect disagreement.
The study team presented final versions of the risk-adjusted metrics to the expert panel in June 2024 (RSR for DOT, or RSR-DOT) and January 2025 (RSR for DASC, or RSR-DASC).
Results
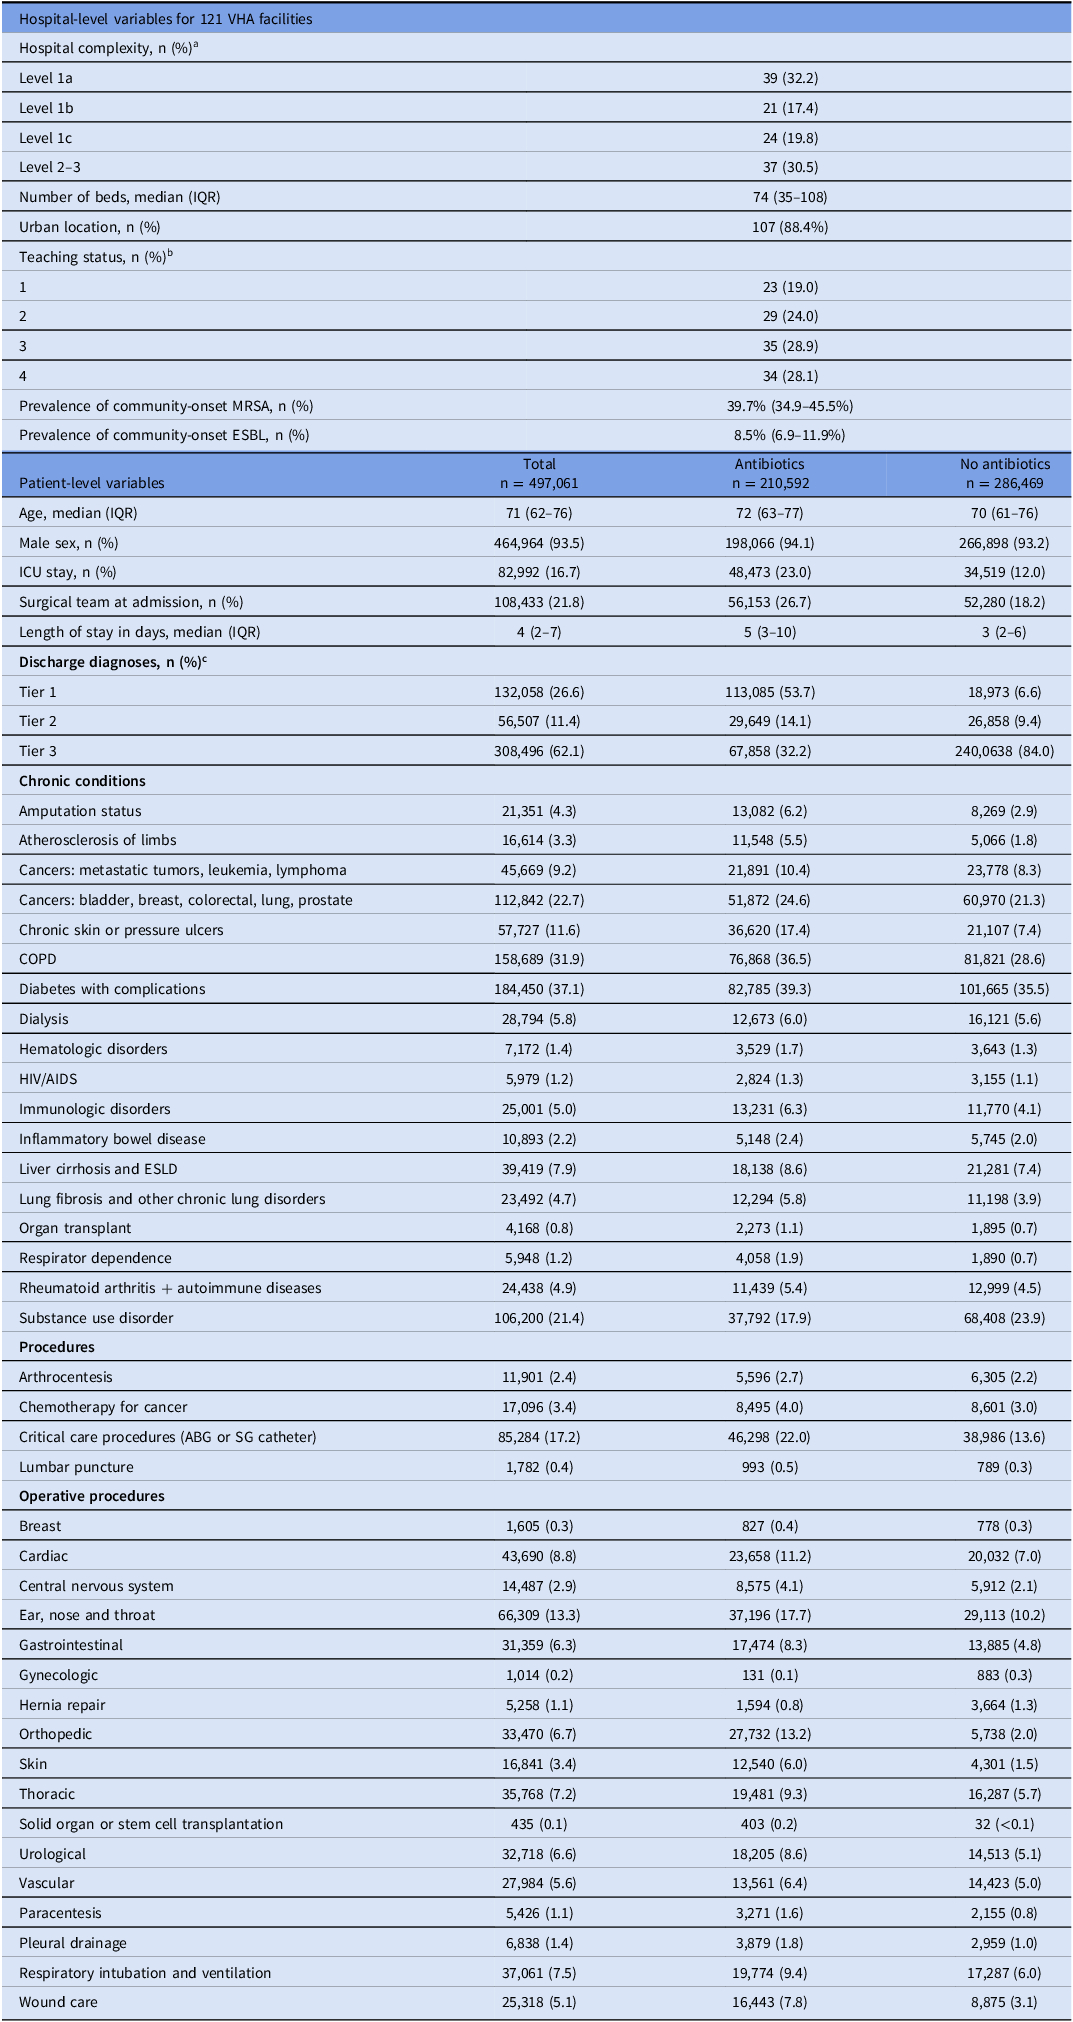
During fiscal year 2021, there were 497,061 unique patient-admissions across 121 VHA hospitals. Hospitals had a median of 344 admissions per month (interquartile range (IQR) 141–499). The median patient age was 71 years (IQR 62–76), and 464,964 patient-admissions (93.5%) were male (Table 3). There were 210,592 (42.4%) patient-admissions who were administered at least one antibiotic; among these patients, the median inpatient DOT was 4 (IQR 2–9), and the median DASC per admission (among those who received antibiotics) was 55 (IQR 24–138).
Supplemental Table 3 shows the incidence rate ratios from the model for the SAAR. Supplemental Table 4 shows the incidence rate ratios for the fixed effects in the zero-inflated models for DOT and DASC.
The median hospital RSR was 1.00 (IQR 0.95–1.05) for DOT and 1.00 (IQR 0.96–1.04) for DASC; the median ratio for the SAAR-like metric was 0.85 (IQR 0.68–1.03). Supplemental Figures 1, 2 and 3 show how hospital performance on each of these metrics varied after hospitals were ranked, based on their performance, from 1 to 121.
The Kendall’s tau for the comparison of the RSR-DOT and the SAAR-like metric is 0.48 (P value < .001), indicating a moderate correlation. The Kendall’s tau for the comparison of the RSR-DASC and the SAAR-like metric is 0.33 (P value < .001), indicating a weak correlation. The Kendall’s tau for the comparison of the RSR-DOT to the RSR-DASC is 0.48 (P value < .001).
Compared to the SAAR-like metric, 60 (49.6%) and 80 (66.1%) hospitals were ranked in a different quartile for RSR-DOT and RSR-DASC, respectively (Figures 1 and 2). Specifically, compared to their ranking for the SAAR-like metric, 41 (33.9%) hospitals changed 1 quartile when ranked on RSR-DOT, 18 (14.9%) changed 2 quartiles, and 1 (0.8%) changed 3 quartiles. Compared to their ranking for the SAAR-like metric, 58 (47.9%) hospitals changed 1 quartile when ranked on RSR-DASC, 16 (13.2%) changed 2 quartiles, and 6 (5.0%) changed 3 quartiles.
Change in quartile when comparing hospital performance on the SAAR-like metric to performance on the RSR-DOT.

Change in quartile when comparing hospital performance on the SAAR-like metric to performance on the RSR-DASC.

Discussion
We constructed risk-adjusted antibiotic stewardship metrics through an expert and data-driven approach. Hospital performance on the SAAR-like metric was weakly correlated with hospital performance on the RSR-DASC metric, probably because the DASC metric is evaluating an additional dimension of antibiotic stewardship relative to the SAAR. The correlation between the SAAR-like metric and the RSR-DOT was moderate, likely because the unit of measurement (DOT) is the same for both metrics. Both RSRs ranked a large proportion of hospitals differently than ranked by the SAAR-like metric.
It is possible that the inclusion of patient-level data in the RSR metrics will provide more face validity to clinicians who interpret these metrics. In general, metrics that account for differences in case-mix across hospitals have better buy-in from clinicians. Reference Sedman, Bahl and Bunting28 When case-mix is considered, it should be more difficult for clinicians to argue that their patients are exceptional and that a metric, in turn, does not apply to them. Unfortunately, the SAAR does not adjust for patient-level factors even though several studies have shown these factors to be an important driver of differences in antibiotic use across hospitals. Reference Kanerva, Ollgren, Lyytikainen and Finnish Prevalence Survey Study3–Reference Goodman, Pineles and Magder9
While the RSR-DOT does account for patient-level factors, it is still—like the SAAR—based on counting DOT. Every antibiotic is assigned the same DOT unit, regardless of its spectrum of activity and its likelihood to cause resistance. Such crude methods for counting antibiotics may be an insensitive method for tracking the impact of stewardship program activities. The unit of DOT, however, is familiar to stewards, so abandoning the concept entirely would require a carefully selected replacement.
The RSR-DASC provides an additional dimension to measuring a hospital’s antibiotic use. Prior studies have shown that DASC is more responsive than DOT to the intensity of stewardship program activities. Reference Suzuki, Heintz, Livorsi, Perencevich and Goto14,Reference Murakami, Akazawa and Honda15,Reference Oda, Hayashi and Yamamoto29 This makes sense because de-escalating, or narrowing, antibiotics is one of the most common recommendations made by stewardship programs. Reference Lesprit, Landelle and Brun-Buisson10,Reference Livorsi, O’Leary and Pierce11 De-escalation should always decrease DASC, but it may not reduce DOT.
Moehring et al. recently leveraged encounter-level data for risk-adjustment of the SAAR metric. Reference Moehring, Yarrington and Ashley30 In their project, expert adjudication did not yield a different set of influential variables than an agnostic variable selection strategy. Reference Moehring, Yarrington and Ashley30 While a purely data-driven approach may be more efficient, the involvement of experts in variable selection could provide more credibility to the final metric. For example, experts would be better positioned to distinguish which variables are associated with appropriate versus inappropriate antibiotic use. In both Moehring et al. and our approach, the final risk-adjustment included variables such as ICU status, specific procedures, and specific diagnostic codes for infection. Making further comparisons between Moehring et al. and our work is difficult because the sets of eligible variable differed. For example, while our study used AHRQ’s CCS codes and CMS’s HCC codes to capture procedures and comorbidities, respectively, Moehring et al. used AHRQ’s Clinical Classification Software Refined (CCSR). In our prior work, our team has also built risk-adjusted benchmarking stewardship metrics through a purely data-driven approach. Reference Goto, Cho and Merchant26 It is unclear how those “agnostic” metrics we built compare to the ones described here.
Future studies should attempt to validate these new metrics by assessing how well they correlate to other important constructs, such as appropriate antibiotic-prescribing. Future studies should also assess whether key stakeholders perceive these new metrics to be both useful and valid. Without stakeholder buy-in, a new metric alone is unlikely to motivate efforts to improve antibiotic-prescribing.
A major strength of our work is the use of a hybrid approach, which drew on both expert and data-driven strategies, to identify non-modifiable factors to include in the risk-adjusted metrics. We limited ourselves to using data elements that would be readily available from private-sector administrative claims or through other data sources (e.g., NHSN reports). Therefore, it should be feasible to recreate these metrics in real-world settings.
Our work also has several limitations. First, the RSR-DOT and RSR-DASC metrics are not validated yet. Validation is difficult when there is no gold-standard for measuring optimal inpatient antibiotic use on a broad-scale. Second, participants in the modified Delphi panel were all antibiotic stewards, so unique perspectives of frontline prescribers were not captured. While panelists came from different geographic regions, we did not assess other types of diversity (e.g., years of experience, practice setting, etc.). Third, these metrics were constructed using data from VHA hospitals, so our findings may not be generalizable to hospitals outside the VHA system. With that said, the only variable that would not be transferable to a non-VHA setting would be VHA hospital complexity. An approximation of the VHA complexity level score could include elements of NHSN’s teaching hospital classification (ie, major, graduate and undergraduate) and levels of hospital care used in non-VHA settings (e.g., community, tertiary or quaternary hospital).
In conclusion, we have set forth two new metrics (RSR-DOT and RSR-DASC) that were carefully designed through both expert and data-driven strategies. These RSR metrics provided different assessments of hospital performance than the SAAR-like metric. We believe our work represents a step forward in improving the value, meaning and impact of the metrics used in antibiotic stewardship.
Frequencies of key hospital and patient-admissions characteristics, fiscal year 2021 (Oct 1, 2020–Sep 30, 2021)

ABG, arterial blood gas; AIDS, acquired immunodeficiency syndrome; COPD, chronic obstructive pulmonary disease; ESLD, end-stage liver disease; HIV, human immunodeficiency virus; SG, Swan Ganz; IQR, interquartile range; ICU, intensive care unit.
a Facility complexity scores are created by the VA Healthcare Analysis and Information Group and reflect several characteristics of a hospital: its patient population, clinical services (eg, intensive care unit [ICU] and surgery services), education and research. A score of 1a is most complex while a score of 3 is least complex.
b For teaching status, hospitals were ranked into quartiles based on the number of resident physician slots they had in 2020. 4 indicates being in the quartile with the most resident physician slots while 1 indicates being in the quartile with the fewest resident physician slots.
c Discharge diagnoses from each admission were classified as tier 1 (always warrant antibiotics), Tier 2 (sometimes warrant antibiotics), and tier 3 (never require antibiotics, based on the following publication: King LM, Tsay SV, Hicks LA, Bizune D, Hersh AL, Fleming-Dutra K. Changes in outpatient antibiotic prescribing for acute respiratory illnesses, 2011 to 2018. Antimicrob Steward Healthc Epidemiol 2021;1(1):1-8. When multiple diagnoses were coded, only the diagnosis with the lowest number was applied to the patient’s hospital stay.
Supplementary material
The supplementary material for this article can be found at https://doi.org/10.1017/ice.2026.10497.
Data availability statement
Data are not publicly available.
Acknowledgments
This work was supported by an investigator-initiated research (IIR) grant (I01 HX003595) from the United States Department of Veterans Affairs Health Services Research and Development Service (PI: D. Livorsi and M. Goto). We also thank Dr. Arjun Srinivasan for his participation in the Delphi panel.
Competing interests
All authors report no relevant conflicts of interest.
Disclaimer
The views expressed in this article are those of the authors and do not necessarily reflect the position or policy of the Department of Veterans Affairs or the United States Government.





 Open access

