


1. Introduction
The original definition of linkage disequilibrium (LD) was given by Robbins (Reference Robbins1918) in terms of D, the deviation of haplotype frequencies from expectation based on independence of allele frequencies. Hill & Robertson (Reference Hill and Robertson1968) pointed out that D is the covariance of frequencies at the two loci, and introduced the parameter r, the correlation of frequencies.
There is a diploid analogy to the haploid D (Yang, Reference Yang2003). This can be defined as the difference between the joint frequency of heterozygotes at two loci and its expectation based on independence. As is the case for the haploid D, this difference is simply the covariance of heterozygosity, or equivalently the covariance of homozygosity. The ‘covariance of heterozygosity’ term will be used below, rather than the equivalent, but less specific, terms ‘genic disequilibrium’ or ‘zygotic association’.
Specific statistics related to the covariance of heterozygosity were introduced by Haldane (Reference Haldane1949) for the case of inbreeding and linkage, by Bennett & Binet (Reference Bennett and Binet1956) for the case of selfing and unlinked loci, and by Ohta (Reference Ohta1980) for the case of closely linked polymorphisms. Properties of joint heterozygosity have also been discussed more recently (Sabatti & Risch, Reference Sabatti and Risch2002; Yang, Reference Yang2002; Rosenberg & Blum, Reference Rosenberg and Blum2007). It should be noted that a covariance of heterozygosity is implicit in arguments related to the formation of linked gene complexes, e.g. Lewontin & Kojima (Reference Lewontin and Kojima1960), Bodmer & Parsons (Reference Bodmer and Parsons1963), although the discussion at the time these papers were written was in terms of selective maintenance of gene complexes rather than just in terms of covariances.
An extension of the variance of heterozygosity to more than two loci was suggested in Sved (Reference Sved1968) . It was shown that the expected variance of the number of heterozygous loci per individual relates directly to the level of LD summed over all pairs of loci. Avery & Hill (Reference Avery and Hill1979) showed that an equivalent formula could be derived from the earlier more general quantitative formulation of Robinson & Comstock (Reference Robinson and Comstock1955) .
The purpose of the present paper is to present the multiple locus formulation in terms of the covariance of heterozygosity between two blocks of loci. These two blocks can be either linked or unlinked. The methods are used to analyse data from Hapmap.
These methods of analysis are appropriate when dealing with large numbers of closely linked sites. LD coefficients involving closely linked sites are not independent of each other. Should there be disequilibrium between a locus in Block I with a locus in Block II, any site surrounding the locus in Block I can also be expected to be in disequilibrium with any site surrounding the locus in Block II (Weir et al., Reference Weir, Cardon, Anderson, Nielsen and Hill2005). Therefore, it makes more sense to study LD between blocks of genes than to study LD between individual genes. The covariance of heterozygosity provides such a measure. Furthermore, calculation of the covariance is expeditious compared with the calculation of multiple LD coefficients.
2. Materials and methods
(i) Two loci
In a random mating population, the expected variance of the number of heterozygotes at two loci, which can take the value 0, 1 or 2, is (Hill, Reference Hill1975; Brown et al., Reference Brown, Feldman and Nevo1980)

where V(H 1) and V(H 2) are the variances at locus 1 and 2, respectively, among individuals in the population, m 1 and m 2 are the number of alleles at the two loci, p 1h and p 2k are allele frequencies at the two loci and D 1h2k is the LD coefficient between allele h at locus 1 and allele k at locus 2, and is equal to P 1h2k−p 1h⋅p 2k. It should be emphasized that this variance calculation and the covariance calculations that follow are expectations based on the assumption of random mating. Under this assumption, V(H 1) is equal to N∑p 1i2[1−∑p 1i2], where the entire population of size N is sampled.
The overall variance may be written in terms of variances and covariances as

Cov(H 1, H 2) is the covariance of the number of heterozygotes at locus 1 and the number of heterozygotes at locus 2, each of which can take the value 0 or 1.

As all data in Hapmap involve only two alleles at each site, it is convenient to continue using only the two-allele forms of (1) and (2). A single LD coefficient, D 12, between locus 1 and locus 2 suffices in this case, while allele frequencies at the two loci may be represented simply as p 1 and p 2, respectively. The sign of the LD coefficient is arbitrary, depending on which pair of alleles is chosen. The equations simplify to

and

(ii) Multiple loci
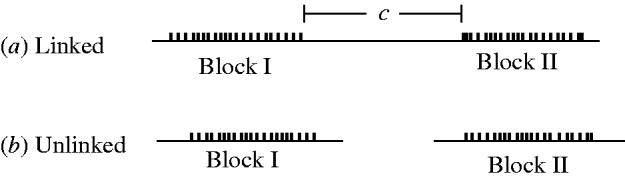
Figure 1 shows the situations considered in this paper. Multiple loci/sites are involved, but the specific interest is in the covariance of the total heterozygosity of Block I with the total heterozygosity of Block II.
Block structure for linked (recombination frequency =c) and unlinked blocks.
The variance in heterozygosity of the overall set of loci, including loci from both Block I and Block II, is (Sved, Reference Sved1968)
![\eqalign{V\lpar H\rpar \equals \tab \mathop \sum\limits_{i \equals \setnum{1}}^{n} \,V\lpar H_{i} \rpar \plus \mathop \sum\limits_{i \equals \setnum{1}}^{n} \,\mathop \sum\limits_{j \ne i} \cr \tab \left[ {8D_{ij}^{\setnum{2}} \plus 16\left( {{1 \over 2} \minus p_{i} } \right)\left( {{1 \over 2} \minus p_{j} } \right)\,D_{ij} } \right]\comma \cr }](https://static.cambridge.org/binary/version/id/urn:cambridge.org:id:binary:20160920235906199-0920:S0016672311000255:S0016672311000255_eqn6.gif?pub-status=live)
where each individual can be heterozygous at 0, 1, 2, … n loci, n being the total number of loci in Block I and Block II. The double summation is over all pairs of loci.
This variance may be expressed in the form

where V(H I) represents the variances of the sum of loci in Block I, V(H II) is the equivalent for loci in Block II, and Cov(H I, H II) is the covariance between overall heterozygosity in Block I (between 0 and n I per individual), and in Block II. Then, noting that the variance terms in (6) and (7) are equivalent,
![\eqalign{{\rm Cov}\lpar H_{\rm I} \comma H_{{\rm II}} \rpar \equals \tab \mathop \sum\limits_{i \equals \setnum{1}}^{n_{{\rm I}} } \mathop\sum\limits_{j \equals \setnum{1}}^{n_{{{\rm II}}} } \left[ {4D_{ij}^{\setnum{2}} \plus 8\left( {{1 \over 2} \minus p_{i} } \right)\left( {{1 \over 2} \minus p_{j} } \right)D_{ij} } \right].\cr}](https://static.cambridge.org/binary/version/id/urn:cambridge.org:id:binary:20160920235906199-0920:S0016672311000255:S0016672311000255_eqn8.gif?pub-status=live)
Equation (8) is the multiple-locus equivalents of the two-locus eq (5). Note that only LD terms involving one locus in Block I and one locus in Block II are involved in the covariance expectation.
It is convenient to normalize the covariance by using the correlation coefficient, calculated as

Note that V(H I) and V(H II) are calculated from the data, and are usually much higher than expected from V(H) values of individual loci because of the covariance term in (6). The correlation reduces the covariance calculations to a common scale, −1 to +1. However, the correlation coefficient has no simple expectation in terms of LD coefficients, except that zero LD makes the correlation zero. A r 2(Het) coefficient could also be used, although this also has no obvious LD coefficient expectation.
(iii) Departures from random mating
Departures from random mating can be taken into account using the coefficient of inbreeding F. Noting that the frequencies of genotypes heterozygous at one or both loci are uniformly reduced in frequency by the factor (1−F), it can be shown that the covariance of heterozygosity as given in eq (8) is modified slightly, becoming approximately
![\eqalign{\!{\rm Cov}\lpar H_{\rm I} \comma H_{{\rm II}} \rpar \equals \tab \lpar 1 \minus F\rpar \mathop \sum\limits_{i \equals \setnum{1}}^{n_{{\rm I}} } \,\mathop \sum\limits_{j \equals \setnum{1}}^{n_{{{\rm II}}} } {\left[{ 4D_{ij}^{\setnum{2}} \plus 8\left( {{1 \over 2} \minus p_{i} } \right)}\right }\cr \tab\! \times\!{\left \left( {{1 \over 2} \minus p_{j} } \right)D_{ij} \plus 4Fp_{i} p_{j} \left( {1 \minus p_{i} } \right)\left( {\lpar 1 \minus p_{j} } \right)} \right]. \cr}](https://static.cambridge.org/binary/version/id/urn:cambridge.org:id:binary:20160920235906199-0920:S0016672311000255:S0016672311000255_eqn10.gif?pub-status=live)
The important aspect of this equation is that the covariance does not asymptote to zero in the absence of LD, e.g. for unlinked loci (Benett & Binet, Reference Bennett and Binet1956). This conclusion in terms of the inbreeding coefficient also applies to population subdivision.
(iv) HapMap data and recombination values
The data analysed below are unphased single nucleotide polymorphism (SNP) data from HapMap phase 3 release #3 (NCBI build 36, downloaded in PLINK format from http://hapmap.ncbi.nlm.nih.gov/downloads/index.html.en). Four populations were analysed: YRI (Yoruba, Nigeria), CHB (Chinese, Beijing), JPT (Japanese, Tokyo) and CEU (European, CEPH). Only unrelated parents were used from the YRI and CEU families. No additional data from other sources were used.
For the study of LD within chromosomes, an estimate of the recombination frequency is required, and recombination frequencies from the Oxstat map (Myers et al., Reference Myers, Bottolo, Freeman, McVean and Donnelly2005) were used. All possible pairs of blocks were tested. Intervals between blocks are never exact multiples of 0·1 cM (see Fig. 2), and the position of the distal block was chosen to give a recombination frequency minimally greater than the required interval.
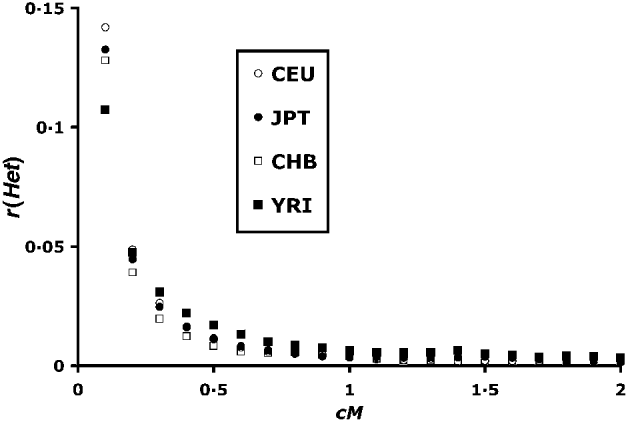
Correlation of heterozygosity between linked blocks of loci. Recombination values (c) are between ends of blocks as shown for linked loci in Fig. 1. Blocks are of size 50, and each point is based on 250 000–300 000 pairs.
(v) Size of blocks
Choice of optimal block size is empirical. Small block sizes are more subject to chance fluctuation, and also increase the amount of calculation, which can be important when considering all possible combinations between chromosomes. On the other hand, a large block size runs the risk that levels of LD will be low between loci at the ends. Block sizes of 20, 50 and 100 were evaluated, and their utility was determined by examining the shape of the curve connecting map distance and r(Het). The level of variability around the curve was found to be higher at block size 20, and a block size of 50 was used in calculations reported here.
The distribution of loci in Hapmap is not uniform over the genome, and some argument could be made for using a fixed map length to define the block rather than a fixed block size. In practice this did not seem to reduce the variability or to sharpen the curve connecting map distance and r(Het).
It might be advantageous to use a sliding window in the calculations. However, this adds significantly to the computation time. Therefore, fixed intervals were used, so that, for example, the first block was located at 1–50, then 51–100, 101–150, etc. The residual end block was ignored.
3. Results
(i) Within chromosomes
Figure 2 summarizes the mean correlation in heterozygosity up to 2 cM distance. The YRI (African) population has the lowest r(Het) at the lowest recombination values. This difference is consistent with higher historical effective population sizes of African populations as previously found by Tenesa et al. (Reference Tenesa, Navarro, Hayes, Duffy, Clarke, Goddard and Visscher2007) . Above 0·04 cM, however, the situation is reversed, with higher YRI r(Het) values, consistent with lower population sizes in more recent times. Hayes et al. (Reference Hayes, Visscher, McPartlan and Goddard2003) showed that LD levels tend to reflect population sizes 1/2 c generations in the past, which implies a smaller African population size for up to 1000 generations in the past.
The r(Het) values asymptote to a value close to zero in Fig. 2. However, a closer look at higher scale (Fig. 3) at the region above 2 cM shows that, although r(Het) values are small, LD can be detected up till around 10 cM. This is in contrast to calculated values of r 2, where a signal is difficult to detect over 0·5 cM (Tenesa et al., Reference Tenesa, Navarro, Hayes, Duffy, Clarke, Goddard and Visscher2007).
Mean correlations for larger map distances – continuation of Fig. 2 at a higher scale.

(ii) Between chromosomes
The distribution of r(Het) values for the YRI population is shown in Fig. 4. The key indicator of significant associations between genes on different chromosomes would be the existence of extreme positive values. While there are cases of high r(Het) values, greater than 0·5, a notable feature of Fig. 4 is the symmetry of the distribution, including extreme negative values as discrepant as the positive values.
Number of occurrences of r(Het) values for YRI population. Class size for the r(Het) values is 0·001, and observed numbers in the classes are cumulated over all pairs of chromosomes.

A permutation test of significance for high positive values could be produced by permuting one or other locus (SNP) between different individuals within a population. Although eq (8) suggests that the expectation of r(Het) should be positive, it is clear that negative values are equally likely as positive ones in the absence of any association, a conclusion in agreement with Rosenberg & Blum (Reference Rosenberg and Blum2007) . The symmetry of Fig. 4 indicates the non-significance of any high associations, and makes a permutation test unnecessary. The results for the remaining Hapmap samples, CHB, JPT and CEU, were similarly negative, and are not shown.
Despite the apparent symmetry of Fig. 4, there is a slight bias towards positive values. The first data column of Table 1 summarizes the overall r(Het) values. There is a bias towards positive values for the CEU, JPT and YRI populations, and a non-significant negative mean for the CHB population. These values are plotted adjacent to the within-chromosome values in Fig. 3, and are in good agreement with the asymptotic values for higher map distances.
Mean r(Het) values (column 1) and numbers of chromosome pairs with positive and negative mean r(Het) values (columns 2, 3). *** Significant at 0.1% level

Table 1 also shows a non-parametric test of the significance of the departure of r(Het) from zero. Each chromosome pair has been considered separately, and r(Het) values have been summed over the chromosome pair. There are (22×21)/2=231 such pairs. Values are then summarized as either positive or negative. The table shows a small bias towards positive values, which is significant at the 0·1% level in three of the four populations as shown by the χ2 values of column 5. The negative value for the CHB population is not significant, and in fact arises from an excess of positive values. As indicated in the Methods section, the significant positive bias is likely to be indicative of departure from random mating, e.g. with some subdivision within the populations.
4. Discussion
There are significant advantages to the use of r(Het) as a measure of LD. The primary advantage is that the statistic can be extended from the case of a single locus pair to the calculation of LD between blocks of loci. The HapMap calculations within chromosomes have shown that significant levels of LD can be detected at up to 10 cM distance.
It is possible that single locus pair r 2 calculations could be used to derive similar conclusions. As shown in eq (8), the covariance between blocks is closely related to the sum of D 2 values of all locus pairs over the two blocks. An analogous statistic could thus be calculated from averaging all r 2 values between the two blocks, albeit in a more time-consuming calculation.
One difficulty of the r 2 value is that it is subject to a correction for sample size of order 1/n, where n is the sample size (Hill, Reference Hill1981). This correction can overwhelm low population LD values. In contrast, the covariance or correlation of heterozygosity is unbiased by sample size. It is clear that negative and positive covariance values are equally likely when there is no LD, e.g. for unlinked genes where there are no selection or segregation distortions, giving an overall expectation of zero regardless of sample size. It is unclear from Fig. 3 as to whether the value of r(Het) actually asymptotes to zero or to some small positive value. The same conclusion can also be drawn from the significant excess of r(Het) values from unlinked locus blocks as summarized in Table 1. A small positive value can be expected due to deviations from random mating (eq (10)). Some bias in r 2 values might also be expected due to non-random mating in the form of population mixing (Nei & Li, Reference Nei and Li1973).
A further theoretical disadvantage of the r 2 calculation is that it requires haploid data that are rarely available. In contrast, the covariance or correlation of heterozygosity requires only diploid data. In practice, in place of r 2, the ‘composite LD measure’ (Weir, Reference Weir1979) can be calculated from diploid data with little loss of accuracy in applying the results to haploid LD measures.
With reference to unlinked loci, it is perhaps not clear as to why significant LD values should be expected. However, one such case for a single unlinked locus pair has recently been uncovered (Rohlfs et al., Reference Rohlfs, Swanson and Weir2010), based on high gametic selection interaction.
The primary motivation for studying LD between chromosomes in the present study has been to look for the possibility of co-segregation of unlinked markers through some meiotic mechanism, a phenomenon given the name ‘affinity’ (Mitchie, Reference Mitchie1953). Various models of chromosomal spatial organization have been put forward, such as the ‘Immortal DNA Strand Hypothesis’ and the ‘Lark Hypothesis’ (see http://en.wikipedia.org/wiki/Immortal_DNA_strand_hypothesis for a discussion of such hypotheses). Under such hypotheses, the segregation of different chromosomes would not necessarily be random. There has, to date, been no large-scale test for such a possibility. This would best be done using family data (Kong et al., Reference Kong, Thorleifsson, Gudbjartsson, Masson, Sigurdsson, Jonasdottir, Walters, Jonasdottir, Gylfason, Kristinsson, Gudjonsson, Frigge, Helgason, Thorsteinsdottir and Stefansson2010). However, a positive signal of LD in the absence of selective interactions would provide evidence for such co-segregation. No such signal has been detected in the present study (Fig. 4).
I am grateful for a number of comments and suggestions from Bill Hill during the writing of this paper.



