1. Introduction: Repression by the nucleosome and relief of repression by chromatin-remodeling complexes
The fundamental principle of eukaryotic gene expression is genome-wide repression, with relief from repression for genes required in a particular cell state or tissue. Repression begins with the wrapping of gene DNA around histones in the nucleosome, and relief from repression involves unwrapping of the DNA by chromatin-remodeling complexes. Repression by nucleosomes extends beyond transcription to most DNA transactions. Similarly, the importance of chromatin-remodeling complexes is widespread, with many complexes serving specific functional roles. Nucleosomes and remodeling complexes represent only the beginning; both repression and relief from repression involve many additional factors. We focus here on the most abundant and essential remodeling complex, termed RSC in yeast, with homologs in higher organisms, including Drosophila PBAP and human PBAF complexes.
RSC is involved in many chromosomal DNA transactions. Most is known about RSC in transcription, and the mechanistic insights thus far derived are doubtless applicable to RSC in other processes. We concentrate here upon the multiple roles of RSC in transcription and upon the structural and mechanistic basis. More general summaries of chromatin-remodeling complexes may be found elsewhere (Clapier & Cairns, Reference Clapier and Cairns2009; Langst & Manelyte, Reference Langst and Manelyte2015; Tang et al. Reference Tang, Nogales and Ciferri2010; van Vugt et al. Reference van Vugt, Ranes, Campsteijn and Logie2007).
2. Repression by the nucleosome
2.1 Inhibition of transcription initiation
A nucleosome precisely placed on the TATA box and transcription start site (TSS) of the adenoviral major late promoter prevents the initiation of transcription by purified RNA polymerase II and a set of purified general transcription factors (Lorch et al. Reference Lorch, LaPointe and Kornberg1987). (In previous studies, nucleosomes were deposited at random (Knezetic & Luse, Reference Knezetic and Luse1986; Williamson & Felsenfeld, Reference Williamson and Felsenfeld1978), and inhibition of initiation could not be distinguished from interference with RNA chain elongation.) A corresponding effect of nucleosomes on transcription in vivo was shown by shutdown of histone synthesis in yeast (Han & Grunstein, Reference Han and Grunstein1988). The resulting depletion of nucleosomes led to the activation of transcription of repressed genes. It was concluded that nucleosomes caused repression. As with all in vivo studies, it could be asked whether the effect was direct, upon every promoter, or indirect, for example through activation or repression of a master gene or small number of genes. The block on initiation in vitro pointed to a direct effect, and from the combination of the two results there emerged the prevailing view that the nucleosome serves as a general gene repressor.
2.2 Transcription through nucleosomes and displacement of histones
It may be asked whether the inhibition of transcription by the nucleosome in vitro was due to nonspecific interference by basic proteins binding to the DNA. This possibility was ruled out by the demonstration that RNA polymerases engaged in transcription are capable of reading through a nucleosome (Lorch et al. Reference Lorch, LaPointe and Kornberg1987). Moreover, read-through transcription can displace the histones from the DNA. Read-through and displacement were suggested to occur by means of the dissociation–reassociation equilibrium of the nucleosomal DNA; dissociation begins at the points of entry and exit of DNA in the nucleosome, and allows RNA polymerase engaged in transcription to invade the nucleosome (Lorch et al. Reference Lorch, LaPointe and Kornberg1987). Subsequent work confirmed and extended this hypothesis. The rate of spontaneous dissociation of nucleosomal DNA was shown to be similar to or faster than the rate of transcription (Li et al. Reference Li, Levitus, Bustamante and Widom2005). The displacement of DNA was initially controversial: in the original study, RNA polymerase II initiated transcription on a C-tailed nucleosome, transcribed through the nucleosome, and converted it entirely to naked DNA (Lorch et al. Reference Lorch, LaPointe and Kornberg1987); in a subsequent report, a bacteriophage RNA polymerase initiated transcription on a promoter ligated to a nucleosome, and read-through transcription had no apparent effect on the nucleosome (Losa & Brown, Reference Losa and Brown1987). It was later shown that nucleosomal DNA is always displaced from the histone octamer core during transcription, but DNA behind the transcribing polymerase can rebind to the octamer, forming a loop that moves around the nucleosome as transcription proceeds (Clark & Felsenfeld, Reference Clark and Felsenfeld1992; Kulaeva et al. Reference Kulaeva, Hsieh, Chang, Luse and Studitsky2013a, Reference Kulaeva, Malyuchenko, Nikitin, Demidenko, Chertkov, Efimova, Kirpichnikov and Studitskyb; Studitsky et al. Reference Studitsky, Clark and Felsenfeld1994). Evidence for such transient displacement of DNA came from the finding that the position of the nucleosome was shifted backwards along the DNA with respect to the direction of transcription (Studitsky et al. Reference Studitsky, Clark and Felsenfeld1994). The original study with a C-tailed nucleosome revealed the displacement of DNA because transcription of a tailed template fails to dislodge the RNA product from the DNA template {Kadesch & Chamberlin, Reference Kadesch and Chamberlin1982 #904}. A DNA–RNA hybrid persists, which is incapable of association with a histone octamer, so the nucleosome does not reform, and the octamer is ejected into solution.
Nucleosomes repress the initiation of transcription not only at promoters, but also at cryptic initiation sites throughout the genome. For example, spt6 mutants of yeast exhibit transcription initiation from sites within open reading frames (Kaplan et al. Reference Kaplan, Laprade and Winston2003). Nucleosomes are depleted in spt6 mutants and restored by inactivation of RNA polymerase II. Spt6 protein interacts with H3 and behaves as a histone chaperone, supporting nucleosome assembly (Bortvin & Winston, Reference Bortvin and Winston1996). It was suggested that Spt6 is involved in the reassembly of nucleosomes in the wake of a transcribing polymerase, and that the nucleosomes repress transcription from cryptic initiation sites within open reading frames. Similar findings were made and similar conclusions drawn from studies of the histone chaperone FACT, which interacts with H2A/H2B dimers (Mason & Struhl, Reference Mason and Struhl2003).
3. Relief of repression by chromatin remodeling
The first insight into the relief of repression caused by histones came from studies of Hershkowitz and coworkers of genes required for expression of the HO endonuclease of yeast. The gene products were proposed to associate in a ‘SWI/SNF’ complex (Peterson & Herskowitz, Reference Peterson and Herskowitz1992), important for transcription of many promoters (Winston & Carlson, Reference Winston and Carlson1992). A suppressor of mutations in SWI and SNF genes, termed sin2, proved to encode histone H3 (Kruger & Herskowitz, Reference Kruger and Herskowitz1991; Kruger et al. Reference Kruger, Peterson, Sil, Coburn, Arents, Moudrianakis and Herskowitz1995), leading to the idea that the SWI/SNF complex relieves repression by the nucleosome.
The existence of the SWI/SNF complex and its interaction with the nucleosome were shown by isolation (Cairns et al. Reference Cairns, Kim, Sayre, Laurent and Kornberg1994; Peterson et al. Reference Peterson, Dingwall and Scott1994) and by the demonstration of ATP-dependent exposure of nucleosomal DNA to endonuclease digestion (Cote et al. Reference Cote, Quinn, Workman and Peterson1994; Kwon et al. Reference Kwon, Imbalzano, Khavari, Kingston and Green1994; Owen-Hughes et al. Reference Owen-Hughes, Utley, Coté, Peterson and Workman1996; Tsukiyama et al. Reference Tsukiyama, Becker and Wu1994; Varga-Weisz et al. Reference Varga-Weisz, Wilm, Bonte, Dumas, Mann and Becker1997). The largest subunit of the complex, Swi2/Snf2, contains a DNA-dependent ATPase motif, and recombinant Swi2/Snf2p harbors such an activity (Cairns et al. Reference Cairns, Kim, Sayre, Laurent and Kornberg1994; Cote et al. Reference Cote, Quinn, Workman and Peterson1994; Laurent et al. Reference Laurent, Treich and Carlson1993). Yeast encode a homolog of Swi2/Snf2, termed Sth1, and also a homolog of another one of the 11 polypeptides of the SWI/SNF complex. These two homologs were found to copurify through a series of chromatographic steps, leading to the isolation of a 17-protein complex termed RSC (Cairns et al. Reference Cairns, Lorch, Li, Zhang, Lacomis, Erdjument-Bromage, Tempst, Du, Laurent and Kornberg1996; Table 1). The SWI/SNF and RSC complexes share two identical subunits, and have four homologous subunits (Tang et al. Reference Tang, Nogales and Ciferri2010). The Swi2/Snf2 and Sth1 subunits include domains conserved with other families of remodeling complexes, and the Snf5 subunit is often defective or lost in human cancers (Clapier & Cairns, Reference Clapier and Cairns2009). SWI/SNF is nonessential for mitotic growth; RSC is essential and at least tenfold more abundant than SWI/SNF (Cairns et al. Reference Cairns, Lorch, Li, Zhang, Lacomis, Erdjument-Bromage, Tempst, Du, Laurent and Kornberg1996), doubtless due to its general role in transcription, described below.
SWI/SNF family of chromatin remodeling complexes (homologs or identical proteins along each line)

RSC occurs in two alternative forms, with either Rsc1 or Rsc 2 subunits (Cairns et al. Reference Cairns, Schlichter, Erdjument-Bromage, Tempst, Kornberg and Winston1999). Approximately 90% of RSC in yeast is in the form of the Rsc2 complex. The two subunits share 45% identity and 62% similarity of amino acid sequence. Neither RSC1 nor RSC2 is required for growth, but deletion of both is lethal. There are many lines of evidence for distinct functions of the two forms. It was shown early on that rsc1Δ and rsc2Δ mutants exhibit different growth phenotypes. More recently it emerged that Rsc1 but not Rsc2 is required for the induction of autophagy (Yu et al. Reference Yu, Imamura, Ueno, Suzuki, Ohsumi, Yukawa and Tsuchiya2015). The Rsc1–RSC complex plays an essential role in the transcriptional activation of a number of autophagy genes. In addition, both Rsc1 and Rsc2 are required for double-strand DNA break (DSB) repair, but at different stages of the process (Shim et al. Reference Shim, Hong, Oum, Yanez, Zhang and Lee2007), as further discussed below. Other such unique requirements for the Rsc1 and Rsc2 subunits will doubtless emerge.
Although it is generally assumed that SWI/SNF and RSC relieve repression of transcription by the nucleosome, much of the evidence comes from genetic analysis, and is therefore circumstantial. Biochemical studies are required for definitive conclusions, and such studies have resulted in a complex and still incomplete picture. The genetic evidence begins with the mutations in SWI/SNF genes, mentioned above, that interfere with transcription (Peterson & Herskowitz, Reference Peterson and Herskowitz1992), and the mutations in histone genes that suppress SWI/SNF defects (Kruger & Herskowitz, Reference Kruger and Herskowitz1991; Kruger et al. Reference Kruger, Peterson, Sil, Coburn, Arents, Moudrianakis and Herskowitz1995). The SWI/SNF complex evidently exerts a positive effect and the histones a negative effect upon transcription, but it could not be determined from these findings whether the effects were direct. The biochemical studies mentioned above established the role of the histones: the discovery of repression by nucleosome on a promoter in vitro (Lorch et al. Reference Lorch, LaPointe and Kornberg1987) left no doubt regarding the basis for the negative effect of the histones in vivo. The finding that the SWI/SNF complex could expose nucleosomal DNA in an ATP-dependent manner in vitro did not, however, prove a direct effect upon transcription or even upon nucleosomes in vivo. More recent work, especially on RSC, has begun to address these questions.
4. RSC in transcription
4.1 Chromatin immunoprecipitation (ChIP) and genetic analysis
One line of evidence for a direct role of RSC in transcription comes from guilt by association. ChIP has shown an association of RSC with about 10% of all yeast promoters, including both tRNA promoters and those transcribed by pol II (Ng et al. Reference Ng, Robert, Young and Struhl2002). RSC was detected at pol II promoters of both active and inactive genes. It rose in abundance at promoters of carbohydrate metabolism genes upon induction by change in carbon source, whereas it was found at the negative regulatory element of histone genes in a manner dependent on the presence of the repressor proteins that function through the element.
Genetic analyses have supported the functional relevance of RSC association with tRNA genes and pol II promoters. A temperature-sensitive mutation in the Rsc9 subunit impaired both activation and repression of genes in the TOR pathway (Damelin et al. Reference Damelin, Simon, Moy, Wilson, Komili, Tempst, Roth, Young, Cairns and Silver2002). Destruction of Sth1, the catalytic subunit of RSC, resulted in a virtual cessation of synthesis by all three RNA polymerases, I, II, and III (Parnell et al. Reference Parnell, Huff and Cairns2008). In the case of pol III genes, characterized by a low occupancy by nucleosomes, the loss of Sth1 resulted in both a marked increase in the level of nucleosomes and a diminished level of pol III. In the case of pol II genes, the loss of Sth1 had little effect upon the level of nucleosomes, although subtle differences in the locations of promoter nucleosomes were noted.
4.2 Nucleosome-free regions (NFRs)
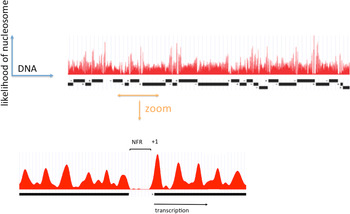
A clearer picture of the role of RSC at pol II genes came from investigations of pol II promoter chromatin structure. Two different modes of action emerged, one relating to the removal of promoter nucleosomes, and the other, to the perturbation of promoter nucleosome structure. The removal of promoter nucleosomes is apparent from mapping the locations of nucleosomes, both genome-wide in yeast, and at specific promoters. Mapping by digestion with micrococcal nuclease, isolation of nucleosome monomer DNA fragments of about 146 bp, and deep sequencing to identify the points of cleavage between nucleosomes, revealed a pattern (Yuan et al. Reference Yuan, Liu, Dion, Slack, Wu, Altschuler and Rando2005): a monotonous array of nucleosomes, interrupted by gaps at the 5′-ends of genes, termed NFRs, where the absence of a single nucleosome exposes regulatory sequences (Fig. 1). The NFR is flanked by strongly positioned nucleosomes, termed +1 and −1 nucleosomes, both highly enriched for the histone variant H2A.Z (Raisner et al. Reference Raisner, Hartley, Meneghini, Bao, Liu, Schreiber, Rando and Madhani2005). The TSSs of transcribed genes typically reside within the +1 nucleosome, 10–15 bp downstream of the NFR. Loss of Sth1 leads to the reoccupation of the majority of NFRs by nucleosomes, pointing to the involvement of RSC in the removal of nucleosomes to form and maintain NFRs (Hartley & Madhani, Reference Hartley and Madhani2009).
The distribution of nucleosomes across a region of yeast chromosome VI (by courtesy of Kyle Eagen). The frequency of occurrence of sequences in nucleosome monomer DNA, following micrococcal nuclease digestion and deep sequencing, is plotted against location in the genome. Open reading frames of genes are indicated by black bars, with transcription initiation at ends marked ‘+’ and termination at ends marked ‘−’. Upper panel shows a region of approximately 50 kb. Lower panel shows an expanded view of approximately 1500 bp, with a nucleosome-free region (NFR) in the middle, and a +1 nucleosome at the boundary of the NFR indicated.

4.3 Stable RSC–nucleosome complexes
Similar mapping by digestion with micrococcal nuclease and deep sequencing, except with the analysis of shorter DNA fragments and of the time course of digestion, revealed three additional, unexpected structural states of chromatin related to RSC. UAS G , a regulatory DNA element responsible for the induction of transcription of the GAL1 and GAL10 genes (Floer et al. Reference Floer, Wang, Prabhu, Berrozpe, Narayan, Spagna, Alvarez, Kendall, Krasnitz, Stepansky, Hicks, Bryant and Ptashne2010), was shown to reside within a nucleosome that protects a DNA fragment of about 135 bp from digestion. Genome-wide analysis revealed over 4000 nucleosomes protecting DNA lengths <146 bp, pointing to the generality of the result. UAS G contains three copies of a G/C motif that bind the Rsc3 subunit (Angus-Hill et al. Reference Angus-Hill, Schlichter, Roberts, Erdjument-Bromage, Tempst and Cairns2001; Badis et al. Reference Badis, Chan, van Bakel, Pena-Castillo, Tillo, Tsui, Carlson, Gossett, Hasinoff, Warren, Gebbia, Talukder, Yang, Mnaimneh, Terterov, Coburn, Li Yeo, Yeo, Clarke, Lieb, Ansari, Nislow and Hughes2008). ChIP revealed an association of UAS G with RSC, which disappeared in an rsc3ts mutant at a restrictive temperature. The 135 bp UAS G fragment also disappeared, as micrococcal nuclease digestion became more or less at random across the region, in both rsc3ts and sth1ts mutants at restrictive temperatures. These and additional findings led to the proposal that RSC binds, positions, and partially unravels a nucleosome on UAS G , in a manner that exposes recognition sites for the Gal4 protein responsible for the induction of GAL gene transcription.
A second example of the perturbation of nucleosome structure by RSC in vivo came from histone–DNA interaction mapping, both with the use of a DNA-cleavage reagent on the H4 amino terminal tail (Ramachandran et al. Reference Ramachandran, Zentner and Henikoff2015), and with the use of formaldehyde cross-linking (Rhee et al. Reference Rhee, Bataille, Zhang and Pugh2014). Both methods revealed nucleosomes with stronger histone–DNA interactions on one side than the other. Such asymmetry was especially notable for the two nucleosomes flanking NFRs, especially the +1 nucleosomes that harbor TSSs. The asymmetry was accompanied by enhanced accessibility to cleavage by micrococcal nuclease, and by correlations with H2A.Z occupancy, with histone acetylation, and with histone ubiquitylation. The results with the DNA-cleavage reagent on the H4 tail suggested higher accessibility on the side of the nucleosome harboring the TSS. ChIP revealed RSC but not other remodeling complexes associated with asymmetric +1 and −1 nucleosomes, and depletion of RSC resulted in a loss of positioned +1 and −1 nucleosomes. These findings led to the conclusion that, as in the case of UAS G , RSC binds, positions, and partially unravels +1 and −1 nucleosomes.
The kinetics of micrococcal nuclease digestion also pointed to an association of RSC with partially unraveled nucleosomes, especially in relation to NFRs (Kubik et al. Reference Kubik, Bruzzone, Jacquet, Falcone, Rougemont and Shore2015). DNA fragments as small as about 100 bp were produced from particles that were transient and disappeared upon extensive digestion, in contrast with fragments of 140 bp or more, derived from typical, stable particles, including +1 nucleosomes. The small unstable particles, termed fragile nucleosomes, were derived from the region immediately upstream of the +1 nucleosome of some 2000 yeast genes, and were therefore referred to as −1 nucleosomes, although they clearly differ in origin and function from the −1 nucleosomes flanking NFRs. The formation of fragile nucleosomes is a property of the DNA sequence, and depends especially upon two DNA sequence motifs shown previously to promote RSC activity (see above and below), an oligo dA:dT tract of most often 7 bp, and a G/C motif the same as or similar to that for binding Rsc3. Depletion of Sth1 caused a decrease in occupancy or complete disappearance of fragile nucleosomes. A notable feature of many fragile nucleosomes is the occurrence of a binding site for an abundant, essential transcription factor, centered on the dyad axis of the nucleosome. These transcription factors include Reb1 and Abf1, shown previously to play a role in NFR formation (see below). Depletion of Reb1 or Abf1 resulted in the disappearance of fragile nucleosomes and the apparent formation, instead, of stable particles. We suggest that such fragile nucleosomes represent intermediates in the removal of histones by RSC and their replacement by abundant transcription factors. Stable nucleosomes cannot be formed when transcription factors are bound (see below). An NFR would be protected against the reformation of a nucleosome by the presence of a transcription factor bound anywhere in the 150 bp region, because the length of naked DNA remaining would be too small for assembly of a nucleosome.
5. RSC in the formation of NFRs, and the role of dA:dT sequences
The results from genetic analysis, from ChIP, and from DNA cleavage by various means, thus implicate RSC in the removal of nucleosomes to create NFRs, and in the interaction with UAS elements and +1 nucleosomes of active genes to create an altered structure conducive to transcription. As mentioned above, the key questions of function and mechanism remain. Does RSC act directly upon NFRs, UAS elements, and +1 nucleosomes or does it act through an intermediary factor(s)? And how does RSC exert its effects? Such questions can only be addressed by studies in vitro.
Support for a direct role of RSC in the removal of promoter nucleosomes came from the remodeling of PHO5 promoter chromatin. Two promoter nucleosomes are removed in the course of transcriptional activation of PHO5 in vivo (Korber & Barbaric, Reference Korber and Barbaric2014; Fig. 2). Similarly, two nucleosomes were removed when the PHO5 gene was isolated in the form of chromatin in the repressed state and treated with RSC and ATP in vitro (Lorch et al. Reference Lorch, Griesenbeck, Boeger, Maier-Davis and Kornberg2011). These two nucleosomes evidently came from the promoter region, because the same treatment of PHO5 chromatin lacking the promoter resulted in no loss of nucleosomes.
Chromatin structure of the yeast PHO5 promoter in repressed and transcriptionally activated states (from Boeger et al. Reference Boeger, Griesenbeck, Strattan and Kornberg2003). Nucleosomes are symbolized by gray-filled ovals, or by dashed lines following removal, or with solid black boundaries due to sliding in the direction of the black arrow upon transcriptional activation. Sites of binding the regulatory proteins UAS1p and UAS2p, and of the TATA box, are indicated by black-filled circles. The location of a dA:dT-rich sequence shown to promote nucleosome removal by RSC (Lorch et al. Reference Lorch, Maier-Davis and Kornberg2014) is indicated by a yellow-filled circle. Rightward-pointing red arrows indicate the transcription start site and direction of transcription.

What is the basis for specificity in the removal of promoter nucleosomes? It has been repeatedly noted that NFRs are rich in dA:dT-containing sequences (Hughes et al. Reference Hughes, Jin, Rando and Struhl2012; Wu & Li, Reference Wu and Li2010; Yuan et al. Reference Yuan, Liu, Dion, Slack, Wu, Altschuler and Rando2005). Poly dA:dT DNA is known to be refractory to nucleosome formation (Kunkel & Martinson, Reference Kunkel and Martinson1981; Prunell, Reference Prunell1982), and oligo dA:dT tracts of seven residues or longer are excluded from the central regions of nucleosomes in vivo (Satchwell et al. Reference Satchwell, Drew and Travers1986). The possibility has therefore been considered that NFRs arise from the instability of nucleosomes on NFR DNA. This possibility was ruled out by measurement of affinities of the histone octamer for NFR DNAs (Lorch et al. Reference Lorch, Maier-Davis and Kornberg2014). All affinities were nearly as great as that of a strong histone-binding DNA sequence. Moreover, the affinity was not much affected by introduction of an oligo dA:dT tract of up to 14 bp at any point in the strong histone-binding DNA sequence. Evidently, the occurrence of NFRs cannot be attributed to a failure of nucleosomes to form or to persist on dA:dT-rich sequences. NFRs do not arise by a passive mechanism.
Rather, genetic and biochemical studies have shown that NFRs result from the action of RSC. A deletion analysis (Raisner et al. Reference Raisner, Hartley, Meneghini, Bao, Liu, Schreiber, Rando and Madhani2005) narrowed the region responsible for NFR formation to 22 bp comprising a binding site for the transcription factor Reb1 (Chasman et al. Reference Chasman, Lue, Buchman, LaPointe, Lorch and Kornberg1990; Fedor et al. Reference Fedor, Lue and Kornberg1988; Ju et al. Reference Ju, Morrow and Warner1990) and a (dA:dT)7 tract. Insertion of this 22 bp DNA segment at an arbitrary site in an inactive gene gave rise to an NFR flanked by two H2A.Z-containing nucleosomes (Raisner et al. Reference Raisner, Hartley, Meneghini, Bao, Liu, Schreiber, Rando and Madhani2005). Reb1-binding sites occur in many NFRs, as do binding sites for the abundant yeast transcription factor, Abf1 (Buchman & Kornberg, Reference Buchman and Kornberg1990), and additional transcription factors may perform similar roles at other NFRs (Raisner et al. Reference Raisner, Hartley, Meneghini, Bao, Liu, Schreiber, Rando and Madhani2005). Reb1 has been suggested to interact with RSC (Gavin et al. Reference Gavin, Bosche, Krause, Grandi, Marzioch, Bauer, Schultz, Rick, Michon, Cruciat, Remor, Hofert, Schelder, Brajenovic, Ruffner, Merino, Klein, Hudak, Dickson, Rudi, Gnau, Bauch, Bastuck, Huhse, Leutwein, Heurtier, Copley, Edelmann, Querfurth, Rybin, Drewes, Raida, Bouwmeester, Bork, Seraphin, Kuster, Neubauer and Superti-Furga2002). The role of the (dA:dT)7 tract also relates to RSC. As detailed below, RSC removes the histone octamer from a nucleosome in the presence of the histone chaperone NAP1, in an ATP-dependent manner, in vitro. The reaction is stimulated by dA:dT-rich sequences in the nucleosome, and is competitively inhibited by dA:dT-rich oligonucleotides (Lorch et al. Reference Lorch, Maier-Davis and Kornberg2014). The rate of removal of the octamer from the strong histone-binding sequence mentioned above is enhanced by orders of magnitude by the insertion of a (dA:dT)7 tract, and similar rapid rates of removal are obtained for NFR DNAs containing dA:dT tracts of 7 bp or more. These findings may explain the prevalence of dA:dT-rich sequences in NFRs.
6. RSC structure and mechanism
6.1 DNA translocation – twist diffusion or loop translocation?
RSC catalyzes DNA translocation: the ATPase subunit Sth1 draws DNA in from one side of the nucleosome and expels it on the other (Saha et al. Reference Saha, Wittmeyer and Cairns2005; Zofall et al. Reference Zofall, Persinger, Kassabov and Bartholomew2006). Evidence for translocation has come from the exposure of nucleosomal DNA to cleavage by restriction endonucleases. DNA on one side of the nucleosome must be drawn in, and is therefore required, for exposure of restriction sites on the other side. Translocation stops when the end of the DNA drawn in reaches about 20 bp from the dyad of the nucleosome, indicative of Sth1–DNA interaction at this point on the nucleosome.
DNA translocation has two consequences, the movement of the histone octamer and thus ‘sliding’ of the nucleosome along the DNA (Lorch et al. Reference Lorch, Zhang and Kornberg2001), and removal of the histone octamer (Lorch et al. Reference Lorch, Zhang and Kornberg1999), which may be a consequence of sliding. Removal of the octamer occurs with transfer to another DNA molecule or to a histone chaperone. The chaperone NAP1 is effective, whereas the chaperone Asf1 is not. In the case of a nucleosome monomer particle, the reaction has been shown to occur stepwise, with removal of H2A/H2B, followed by H3/H4 (Lorch et al. Reference Lorch, Zhang and Kornberg1999). Stepwise removal is a natural consequence of translocation, as DNA drawn in from one end of the monomer particle will first expose H2A/H2B, which may dissociate before subsequent exposure of H3/H4.
The challenge for understanding the RSC mechanism is the question of how DNA can be drawn across the histone surface of the nucleosome. DNA is bound to the histones through multiple interactions every ten residues along each strand. These interactions are strong enough to enforce bending and thus wrapping of the DNA on the small radius of curvature of the nucleosome. Translocation of the DNA by sliding across the histone surface is evidently impossible, because it would require the simultaneous disruption of all the many DNA–histone contacts. Two proposals have been made for the solution of the problem, ‘twist diffusion’ and ‘loop translocation,’ both of which involve a local perturbation that propagates through the nucleosome (for discussion and references, see Saha et al. Reference Saha, Wittmeyer and Cairns2005). DNA translocases such as Sth1 impart twist as they track along the double helix, typically 1 bp at a time. It is proposed that twisting by 1 bp may disrupt only one or a few DNA–histone contacts, which then reform as the disruption is passed from 1 bp to the next, enabling movement of 1 bp through the nucleosome. Similarly, it has been imagined that translocation of one or a small number of bp may create a loop, ‘bulge,’ or ‘wave,’ disrupting only local DNA–histone contacts, followed by wave-like movement through the nucleosome.
Strong arguments may be advanced against both twist diffusion and loop translocation. A nick in one DNA strand has no effect on the rate of DNA translocation (Lorch et al. Reference Lorch, Davis and Kornberg2005). A nick serves to relax twisting strain, and would prevent its propagation through the nucleosome. Twist diffusion is therefore unlikely to play a role in the RSC mechanism.
A gap of up to five residues in one DNA strand, introduced ‘downstream’ (with respect to the direction of translocation from upstream to downstream), had no effect on the rate of DNA translocation (Lorch et al. Reference Lorch, Davis and Kornberg2005). A gap would be expected to interfere with the propagation of bending strain, due to the flexibility of a single-stranded region. Loop translocation is therefore unlikely to play a role in the RSC mechanism.
6.2 RSC–nucleosome structure
If neither DNA bending nor twisting solves the problem of DNA sliding across the histone octamer, then what is the basis for RSC action on the nucleosome? A surprising answer has emerged from structural studies of a RSC–nucleosome complex. The result goes beyond the mechanism of DNA translocation to explain the formation of both stable and unstable complexes of RSC with UAS and +1/−1 nucleosomes as well.
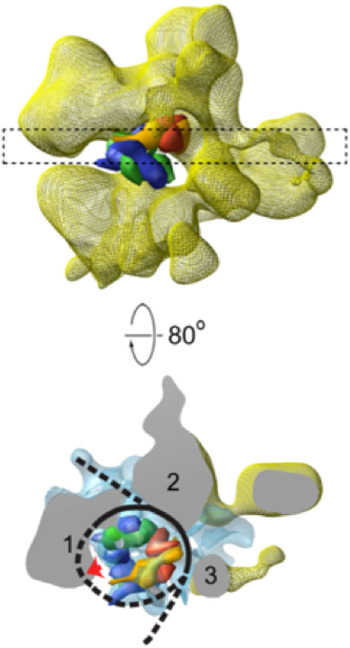
Three-dimensional structures of RSC–nucleosome complexes have been determined by electron microscopy and image processing (Asturias et al. Reference Asturias, Chung, Kornberg and Lorch2002; Chaban et al. Reference Chaban, Ezeokonkwo, Chung, Zhang, Kornberg, Maier-Davis, Lorch and Asturias2008; Leschziner et al. Reference Leschziner, Saha, Wittmeyer, Zhang, Bustamante, Cairns and Nogales2007). RSC, about five times the mass of the nucleosome, has a large central cavity, within which it binds and largely envelops the nucleosome. The key insight came from cryo-electron microscopy, at about 25 Å resolution (Fig. 3), which revealed major conformational changes in the nucleosome (Chaban et al. Reference Chaban, Ezeokonkwo, Chung, Zhang, Kornberg, Maier-Davis, Lorch and Asturias2008). Difference electron density between the RSC–nucleosome complex and RSC alone was almost entirely confined to the central cavity. There was little, if any, conformational change of RSC. The density in the central cavity was clearly consistent with the X-ray crystal structure of the nucleosome (Luger et al. Reference Luger, Mader, Richmond, Sargent and Richmond1997), with two striking differences. First, there was a close fit to the structure of the histone octamer, except that there was only partial density for one H2A/H2B dimer, suggesting displacement of the dimer. Second, there was little density attributable to DNA. Inasmuch as cryo-electron microscopy of isolated nucleosomes at this resolution shows clear electron density for DNA, entirely surrounding the histone octamer, the DNA must be largely displaced from the histones in the RSC–nucleosome complex. The DNA may be mobile or in close contact with RSC and not resolved from the protein surface (dashed line in Fig. 3). It was furthermore possible to estimate the location of the active center of Sth1 (red arrow in Fig. 4) on the basis of two observations: the fit of the X-ray crystal structure of a homolog of Sth1, complexed with DNA, to a region of RSC protein density adjacent to the location of nucleosomal DNA; and the orientation of the histone octamer, indicating the location of the site about 20 bp from the dyad of the nucleosome where Sth–DNA interaction is thought to occur (see above).
Cryo-electron microscope structure (cryo-EM) structure of RSC–nucleosome complex (from Chaban et al. Reference Chaban, Ezeokonkwo, Chung, Zhang, Kornberg, Maier-Davis, Lorch and Asturias2008). (Upper panel) Electron density map of RSC from cryo-EM (yellow mesh), with X-ray structure of histone hexamer (histone octamer lacking one H2A–H2B dimer) docked to the central cavity. The histone hexamer (H2A yellow, H2B red, H3 blue, H4 green) is shown in space-filling representation, calculated at 25 Å resolution from the X-ray structure of the nucleosome (Luger et al. Reference Luger, Mader, Richmond, Sargent and Richmond1997). (Lower panel) A slab of electron density indicated by the dashed rectangle in the upper panel, rotated nearly 90°, with difference density between cryo-EM maps of RSC–nucleosome complex and RSC alone shown in blue mesh. RSC protein densities in close contact with the nucleosome are designated 1–3. Density (1) likely corresponds to the position of the Sth1 ATPase subunit, for the reasons explained in the text, with a lack of DNA density adjacent to this location (red arrow) possibly due to binding to Sth1. DNA is represented by a black line, with regions where no DNA density is apparent indicated by dashed lines.

Inferred basis of RSC action. (Upper panel) DNA (black line) may be bound to the histones (gray disc) in a RSC (yellow)–nucleosome complex, or it may dissociate (blue arrow) and bind to the positively charged (+ signs) RSC cavity (based on Lorch et al. Reference Lorch, Maier-Davis and Kornberg2010). (Lower panel) Sites every ten residues along the nucleosomal DNA optimally exposed to DNase digestion (blue arrows) are protected from digestion when bound to RSC (black x's), whereas sites halfway in between (red arrows) are protected in the nucleosome and exposed when bound to RSC.

The inferences from cryo-electron microscopy regarding the location of DNA in the RSC–nucleosome complex were supported by results of nuclease digestion (Lorch et al. Reference Lorch, Maier-Davis and Kornberg2010). DNA bound to the surface of the histone octamer is alternately protected and exposed to attack by DNase I from solution, with the 10 bp periodicity of the double helix. Interaction with RSC results in partial exposure to DNase I halfway between the sites of cleavage on the surface of the nucleosome (Fig. 4). The resulting pattern of cleavage every 5 bp can be explained by a superposition of two patterns, that of the nucleosome alone, and that of the RSC–nucleosome complex, in which the opposite side of the DNA double helix is exposed to attack by DNase I.
An equilibrium between two states of DNA in the RSC–nucleosome complex, one with the DNA mostly bound to RSC, and the other with the DNA mostly remaining on the nucleosome, is plausible for two reasons. First, transient unwrapping of nucleosomal DNA from the ends, mentioned above, has been well documented by kinetic studies of restriction endonuclease digestion (Anderson & Widom, Reference Anderson and Widom2000; Polach & Widom, Reference Polach and Widom1995) and by single molecule analysis (Li et al. Reference Li, Levitus, Bustamante and Widom2005). Second, RSC binds naked DNA as tightly as a nucleosome (Lorch et al. Reference Lorch, Cairns, Zhang and Kornberg1998). The RSC cavity must be lined with positively charged residues, resulting in a large surface for interaction with negatively charged DNA. Transient unwrapping of nucleosomal DNA is favored by interaction with RSC. There is a balance between energy loss due to DNA bending and energy gain due to binding the histones in the nucleosomal state; the balance is tipped toward unwrapping by the energy gain due to interaction with RSC in the unwrapped state. The preferential action of RSC on AT-rich sequences may be due, in part, to the comparative rigidity of dA:dT-DNA and greater gain in energy by unbending in the unwrapped state.
6.3 An alternative to twist diffusion and loop translocation
The results of cryo-electron microscopy and nuclease digestion suggest an alternative to twist diffusion and loop translocation for the RSC mechanism. The results afford, at the same time, a structural explanation for the UAS G RSC–nucleosome complex, for asymmetric +1/−1 RSC–nucleosome complexes, and for fragile nucleosomes. The key finding is that RSC binding to a nucleosome results in a conformational change, with the transient dissociation of most of the nucleosomal DNA from the histone octamer and its interaction instead with RSC (Fig. 4). The DNA is liberated from the strong interactions with the histones every ten residues along both strands. Rather the DNA is loosely associated with RSC, and therefore freer to twist, bend, and slide. The impediment to DNA translocation across the surface of the nucleosome is diminished in the RSC-associated state. Impediments to protein–DNA interaction are also diminished in the RSC-associated state, for example protein binding to UAS sequences, and in the case of the +1 nucleosome, protein binding to TSSs 10–15 from the ends of the nucleosomal DNA. The DNA is furthermore accessible to nucleases, resulting in smaller protected fragments; and the inherent asymmetry of the RSC–nucleosome complex, with the Sth1 active center 20 bp from the dyad of the nucleosome, explains the asymmetry of +1 nucleosomes (see above).
The displacement of an H2A/H2B dimer in the RSC–nucleosome structure may be relevant not only to transcription initiation but also to transcript elongation. ChIP analyses have demonstrated an association of RSC with the open reading frames of transcribed genes (Spain et al. Reference Spain, Ansari, Pathak, Palumbo, Morse and Govind2014). RNA polymerase II alone can transcribe through a nucleosome (Lorch et al. Reference Lorch, LaPointe and Kornberg1987), with the retention of the histone octamer, the loss of an H2A/H2B dimer (Kulaeva & Studitsky, Reference Kulaeva and Studitsky2010; Kulaeva et al. Reference Kulaeva, Hsieh and Studitsky2010), or the loss of the entire octamer (Lorch et al. Reference Lorch, LaPointe and Kornberg1987), depending on the transcription rate (Bintu et al. Reference Bintu, Kopaczynska, Hodges, Lubkowska, Kashlev and Bustamante2011). RSC, in the presence of the histone chaperone NAP1, facilitates transcription through nucleosomes in vitro, with the loss of an H2A/H2B dimer (Kuryan et al. Reference Kuryan, Kim, Tran, Lombardo, Venkatesh, Workman and Carey2012). The resulting ‘hexamer’ nucleosome is retained on the template through multiple rounds of transcription. Similarly, the histone chaperone FACT is reported to enhance transcription through nucleosomes by the displacement of an H2A/H2B dimer (Belotserkovskaya et al. Reference Belotserkovskaya, Oh, Bondarenko, Orphanides, Studitsky and Reinberg2003; Pavri et al. Reference Pavri, Zhu, Li, Trojer, Mandal, Shilatifard and Reinberg2006). FACT is associated with transcribed genes in vivo (Saunders et al. Reference Saunders, Werner, Andrulis, Nakayama, Hirose, Reinberg and Lis2003), and is required for the retention of H3 and H4 on transcribed genes, so presumably also retention of a hexamer nucleosome, in vivo (Jamai et al. Reference Jamai, Puglisi and Strubin2009). Thus, the absence of an H2A/H2B dimer from the RSC–nucleosome structure may reflect the involvement of a hexamer nucleosome in transcript elongation. RSC may promote the formation or maintenance of a hexamer nucleosome, conducive to transcript elongation and to the retention of histones on transcribed DNA.
7. RSC in other chromosomal DNA transactions
7.1 Replication and repair
The mechanism of RSC activity in transcription doubtless underlies the roles of RSC in other chromosomal DNA transactions. We briefly describe some of these additional roles, mostly revealed by genetic analysis in yeast. RSC has been implicated in DNA replication and repair. The essential DNA replication protein PCNA is ubiquitinated at sites of DNA damage, leading to the recruitment of specialized translesion synthesis DNA polymerases, which possess ubiquitin-binding motifs (Niimi et al. Reference Niimi, Chambers, Downs and Lehmann2012). Rsc2, but not Rsc1, is required for ubiquitylation of PCNA. ChIP experiments have shown an association of Rsc2 with replication forks more generally, in the absence of DNA damage.
Mutation of Sth1 results in sensitivity to various DNA damaging agents (Koyama et al. Reference Koyama, Itoh, Miyahara and Tsuchiya2002). A study focusing on a double strand break (DSB) introduced by the HO endonuclease in the mating locus, showed that RSC was recruited to both sides of the DSB within 10 min after DSB induction (Chai et al. Reference Chai, Huang, Cairns and Laurent2005). The SWI/SNF complex also appeared at the site but much later. In rsc2Δ and snf5Δ strains, DSB repair was interrupted either early or late in the process. Subsequent studies (Liang et al. Reference Liang, Qiu, Ratnakumar and Laurent2007; Shim et al. Reference Shim, Hong, Oum, Yanez, Zhang and Lee2007) showed RSC was required for recruitment of the MRN complex, which binds to DSBs, leading to the entry of the Tel1/ATM and Mec1/ATR protein kinases, involved in checkpoint activation. DSB induction is followed by chromatin reorganization, with the removal or sliding of nucleosomes away from the double strand ends, exposing several hundred bp of DNA. Rsc1 is required for sliding (Chambers et al. Reference Chambers, Brownlee, Durley, Beacham, Kent and Downs2012), whereas Rsc2 is important for removal of nucleosomes and interaction with repair proteins (Shim et al. Reference Shim, Ma, Oum, Yanez and Lee2005, Reference Shim, Hong, Oum, Yanez, Zhang and Lee2007). Depletion of Sth1 or deletion of RSC2 impairs the recruitment of the MRN complex and the entry of the checkpoint kinases. RSC evidently plays multiple roles in the remodeling of DSB chromatin.
7.2 Centromere function
The STH1 gene was implicated in centromere function before the discovery of RSC (Tsuchiya et al. Reference Tsuchiya, Uno, Kiguchi, Masuoka, Kanemori, Okabe and Mikayawa1992). Depletion of Sth1 was shown to arrest cells in G2/M phase. A temperature-sensitive mutant allele of STH1 was similarly shown to cause arrest in G2/M and to result in an altered structure of centromeric chromatin at the restrictive temperature (Tsuchiya et al. Reference Tsuchiya, Hosotani and Miyakawa1998). DNase cutting sites within the CEN DNA region, normally protected against digestion, become exposed in the mutant at the restrictive temperature (Hsu et al. Reference Hsu, Huang, Meluh and Laurent2003; Tsuchiya et al. Reference Tsuchiya, Hosotani and Miyakawa1998). A screen for additional genes involved in centromere function was performed with a strain bearing a mutation in CTF13, which encodes a member of the multiprotein kinetochore complex that binds to CEN DNA (Baetz et al. Reference Baetz, Krogan, Emili, Greenblatt and Hieter2004). A (ctf13/CTF13) diploid strain was mated with a deletion mutant array and screened for sensitivity to temperature or microtubule-destabilizing agents. One of the genes isolated from the screen was RSC2, and rsc2 mutants exhibited defects in both sister chromatid cohesion and chromosome segregation. Additional RSC genes exhibited such defects, but to a lesser extent. Although RSC2 was identified by virtue of a synthetic phenotype with a kinetochore mutation, rsc2 mutants were not defective in kinetochore formation. The yeast 2 µm circle plasmid also requires RSC2 for transmission to daughter cells, and does not involve the kinetochore, but rather the STB locus and Rep proteins (Wong et al. Reference Wong, Scott-Drew, Hayes, Howard and Murray2002).
8. Conclusions and outlook
Most is known about the roles of RSC in transcription and the underlying mechanisms. In all likelihood, roles of RSC in other chromosomal transactions are based on the same or similar mechanisms. RSC exposes DNA by unwrapping, sliding, and disrupting nucleosomes. Wherever RSC is required, these perturbations of nucleosomes are likely to be involved. The main findings to date may be summarized as follows:
-
• The nucleosome serves as a general gene repressor. A nucleosome on a TSS prevents the initiation of transcription.
-
• Repression by the nucleosome is relieved by chromatin-remodeling, principally by RSC in yeast and by its counterpart, the PBAF complex, in higher cells.
-
• RSC comprises 17 subunits, several of which are essential for cell growth, and the largest of which, Sth1, is a member of the family of DNA-dependent ATPases common to all chromatin-remodeling complexes.
-
• Depletion of Sth1 diminishes transcription by all cellular polymerases.
-
• Sth1 functions as a DNA translocase, drawing DNA in from one side of the nucleosome and expelling it from the other. A major question has long been how DNA may be mobilized in the face of strong interactions with the histones every 10 residues along both strands.
-
• DNA translocation results in nucleosome sliding; in the presence of a histone acceptor, it leads to histone octamer transfer, and thus to nucleosome removal.
-
• RSC removes a nucleosome upstream of a TSS, creating a NFR of about 150 bp, flanked by strongly positioned ‘+1’ and ‘−1’ nucleosomes, with the TSS typically 10–15 bp inside the border of the +1 nucleosome.
-
• Activity of RSC at an NFR is due, in part, to oligo dA:dT tracts, and to binding sites for general transcription factors. Once an NFR is formed, binding of a transcription factor anywhere in the region will suffice to prevent nucleosome reassembly.
-
• RSC is stably bound to +1 nucleosomes in vivo, accompanied by the disruption of histone–DNA interactions on one half of the nucleosome.
-
• RSC is stably bound to UAS (enhancer) elements, which also exhibit a partial disruption of histone–DNA interactions.
-
• The structure of a RSC–nucleosome complex reveals a remarkable disruption of the nucleosome, with one H2A/H2B dimer displaced, and with the DNA likely in a dynamic equilibrium between two states, one entirely wrapped around the histone octamer, and the other extensively unwrapped and associated with RSC. The perturbation of nucleosome structure answers the longstanding question of how DNA can be drawn across the surface of the histone octamer, and offers an explanation for the unexpected features of UAS and +1 nucleosomes.
-
• The same RSC mechanism may be at work in such diverse chromosomal transactions as DNA repair and chromosome segregation.
Questions for the future include the following:
-
• What is the complete mechanism of NFR formation, including both the removal of a nucleosome from the exposed region by RSC and the establishment of +1 and −1 nucleosomes, with variant histones, post-translational modifications, and interaction with RSC? A start has been made in genome-wide studies (Krietenstein et al. Reference Krietenstein, Wal, Watanabe, Park, Peterson, Pugh and Korber2016). The analysis must be extended to individual promoters and pursued in detail.
-
• Where are the missing H2A/H2B dimer and nucleosomal DNA located in the RSC–nucleosome complex? Extension of the structure to higher resolution is needed.
-
• Does the RSC–nucleosome structure indeed reveal the basis for alteration of +1 nucleosome structure, and what is the reason for stability of the +1 nucleosome structure (why does it persist in a complex with RSC in the presence of ATP)? The complex of RSC complex with the +1 nucleosome must be elucidated in detail.
-
• What are the roles of the 17 subunits of RSC? Genetic analyses of Rsc1- and Rsc2–RSC (see above), of an Arp7–Arp9 module (Szerlong et al. Reference Szerlong, Saha and Cairns2003), and of a Rsc3–Rsc7–Rsc14–Rsc30–Htl1 module (Wilson et al. Reference Wilson, Erdjument-Bromage, Tempst and Cairns2006), represent the beginning of unraveling the complexity of RSC.
Acknowledgement
Our research is supported by NIH grant RO1 GM36659.