


1. Introduction
1.1. The 2015/2016 El Niño in southern and eastern Africa
El Niño teleconnections – warm phases of the El Niño–Southern Oscillation (ENSO) – present every 2–7 years on average. But no two El Niño events are the same and their magnitude varies considerably. ENSO is just one of the factors governing regional weather variability (e.g. Saji et al., Reference Saji, Goswami, Vinayachandran and Yamagata1999; Behera & Yamagata, Reference Behera and Yamagata2001; Nicholson et al., Reference Nicholson, Leposo and Grist2001; Richard & Anthony, Reference Richard and Anthony2006; Levine & McPhaden, Reference Levine and McPhaden2016) and teleconnections remain capricious and exhibit decadal variability (Wang et al., Reference Wang, Wang and Zhou2009). Nevertheless, the spatial and temporal patterns of precipitation anomalies associated with phases of ENSO are well established at global scales (Ropelewski & Halpert, Reference Ropelewski and Halpert1987) and ENSO teleconnections are strongly manifest in Africa, representing the dominant mode of interannual climate variability over eastern and southern Africa (Nicholson & Kim, Reference Nicholson and Kim1997). El Niño teleconnections tend to be associated with below normal precipitation in parts of southern Africa (during the wet season from November to March) and above average precipitation in eastern Africa (during October to December, short rains). Yet, the way in which each El Niño manifests at a regional level also varies and El Niño does not always produce the same climate outcome (Nicholson & Kim, Reference Nicholson and Kim1997). In eastern Africa, extreme precipitation during the 1997/1998 El Niño caused ‘devastating’, widespread flooding, with associated losses to life, crops, livestock, food security, buildings and infrastructure (CARE International, 1998; Maina, Reference Maina2016), as well as notable lake level rise (Conway et al., Reference Conway, Allison, Felstead and Goulden2005) and groundwater recharge (Taylor et al., Reference Taylor, Todd, Kongola, Maurice, Nahozya, Sanga and MacDonald2013). In southern Africa, meanwhile, precipitation was close to normal during the 1997/1998 El Niño event (Lyon & Mason, Reference Lyon and Mason2007). While notable El Niño events in southern Africa occurred in 1982/1983 and 1991/1992, both involving extensive drought (Rouault & Richard, Reference Rouault and Richard2003).
By most measures the 2015/2016 El Niño event was one of the strongestFootnote i since at least 1950 (L'Heureux et al., Reference L'Heureux, Takahashi, Watkins, Barnston, Becker, Di Liberto, Gamble, Gottschalck, Halpert, Huang, Mosquera-Vásquez and Wittenberg2016). Developing in spring 2015, and lasting through the year, El Niño brought a general increase in the hydrologic cycle and enhanced precipitation variability globally (Blunden et al., Reference Blunden and Arndt2016). In eastern Africa, however, impacts of the 2015/2016 El Niño on rainfall were fairly mild. During December–February 2015/2016, some parts of the region, especially Tanzania and parts of Kenya, recorded 110–150% of normal precipitation, but much of the region recorded below-normal precipitation (Mengistu Tsidu & Kelem, Reference Mengistu Tsidu and Kelem2017). While still experiencing spatial variability, most of southern Africa meanwhile, did record well below-normal precipitation during September–November 2015 (a key part of the rainy season) (Mengistu Tsidu, Reference Mengistu Tsidu2016 b) and December–February 2016 (Mengistu Tsidu et al., Reference Mengistu Tsidu, Kruger and McBride2017; Blamey et al., Reference Blamey, Kolusu, Mahlalela, Todd and Reason2018). Heat waves were also a notable feature over much of the region (Mengistu Tsidu, Reference Mengistu Tsidu2016 b).
This paper considers socio-economic disruption linked to hydrological variability during the 2015/2016 El Niño, among micro, small and medium enterprise (MSMEs) in the capital cities of Nairobi, Kenya, Gaborone, Botswana and Lusaka, Zambia. Hydrological shocks are thought to have the potential to spread especially widely through relatively more developed economies in Africa (Benson & Clay, Reference Benson and Clay1994). And these three middle- (Botswana) and lower middle- (Kenya and Zambia) income countries, with diversely structured economies, have historically experienced varying and severe impacts during El Niño events, and have well established strong El Niño teleconnection patterns. In 2015/2016, parts of all three countries, including the catchment areas around the capital cities where business activity is concentrated, recorded precipitation anomalies consistent with dominant El Niño teleconnection patterns (Mengistu Tsidu, Reference Mengistu Tsidu2016 a; Mengistu Tsidu, Reference Mengistu Tsidu2016 b; Siderius et al., Reference Siderius, Gannon, Ndiyoi, Opere, Batisani, Olago, Pardoe and Conway2018); although these precipitation anomalies were less pronounced in Nairobi than they were in Gaborone or Lusaka (Figure 1). Contributing to literatures on private sector adaptation, in this paper we focus on MSME experience of hydrological disruption associated with the 2015/2016 El Niño in the capital regions of Botswana, Zambia and Kenya. We do this through three case studies which consider hydroelectric load shedding (Lusaka), water supply disruption (Gaborone) and flooding (Nairobi).
Seasonal (January until June and July until December) precipitation anomalies over Kenya (a), and seasonal precipitation anomalies over the upstream contributing areas, and lake level of Lake Kariba (Zambia, b) and Lake Gaborone (Botswana, c). Grey shading indicates the three very strong El Niño episodes over the past 35 years.

1.2. Precipitation anomalies and hydrological impact pathways in Botswana, Zambia and Kenya
During the 2015/2016 El Niño, Kenya experienced heavy precipitation and episodic flooding during both its short (October to November 2015) and long rains (March to May 2016), but followed patterns broadly similar to, or even drier than, non-El Niño years. In contrast to the 1997/1998 El Niño, where extreme precipitation affected more than three quarters of the country, in 2015/2016 only a fraction of Kenya, mostly in the far west, experienced very wet to extremely wet conditions (Weighted Anomaly Standardized Precipitation (WASP) >2), while moderately wet areas (WASP >1) were mainly confined to small pockets, including around Nairobi (Siderius et al., Reference Siderius, Gannon, Ndiyoi, Opere, Batisani, Olago, Pardoe and Conway2018). This generally resulted in more localized impacts, concentrated in southern and central regions. Increased urbanization has nevertheless changed the nature of hazard exposure in the region, with the prevalence of informal settlements and the expansion of impermeable surface areas increasing urban flood risk (Muller, Reference Muller2007; Africa Collaborative Centre for Earth Systems Science (ACCESS) & Institute for Climate Change and Adaptation (ICCA), 2016; Mulligan et al., Reference Mulligan, Harper, Kipkemboi, Ngobi and Collins2016). Much of the property, buildings and other key infrastructure that were damaged by heavy precipitation during the 2015/2016 El Niño, were located in Nairobi. This resulted in population displacement and major disruption to transport systems (International Federation of Red Cross and Red Crescent Societies, 2016).
Even in Gaborone and Lusaka, precipitation anomalies were not extreme considering the strength of the El Niño event (Siderius et al., Reference Siderius, Gannon, Ndiyoi, Opere, Batisani, Olago, Pardoe and Conway2018). Prior to the 2015/2016 El Niño, Botswana had experienced a multi-year drought that began with the moderate El Niño of 2009. 2014/2015 was considered a ‘near-miss’ in El Niño terms (Archer et al., Reference Archer, Landman, Tadross, Malherbe, Weepener, Maluleke and Marumbwa2017) and precipitation across most of southern Africa in 2014/2015 was below normal (Mengistu Tsidu, Reference Mengistu Tsidu2016 b; Archer et al., Reference Archer, Landman, Tadross, Malherbe, Weepener, Maluleke and Marumbwa2017). At Lake Gaborone, precipitation in 2014/2015 was at its lowest for more than 20 years, while precipitation anomalies were milder in 2015/2016 when El Niño was present (Figure 1). Zambia was also experiencing dry conditions at the onset of El Niño, with more severe precipitation anomalies recorded at Lake Kariba in 2014/2015 than in 2015/2016. But dry conditions leading up to the El Niño were less severe in duration and magnitude than in Gaborone (Figure 1).
In southern Africa, El Niño events have typically been associated with agricultural drought and food insecurity and the governments of Zambia and Botswana took various steps to prepare for and manage impacts of El Niño related drought on agriculture (Siderius et al., Reference Siderius, Gannon, Ndiyoi, Opere, Batisani, Olago, Pardoe and Conway2018). Agricultural drought did manifest in 2015/2016 across much of Southern Africa (European Commission, 2016; Food and Agriculture Organization of the United Nations, 2016; Archer et al., Reference Archer, Landman, Tadross, Malherbe, Weepener, Maluleke and Marumbwa2017). However, resource managers in Botswana and Zambia often characterized the 2015/2016 El Niño in terms of relatively novel drought challenges for the region: water supply disruption in Gaborone and hydroelectric load shedding in Lusaka (Siderius et al., Reference Siderius, Gannon, Ndiyoi, Opere, Batisani, Olago, Pardoe and Conway2018).
Poor planning, underinvestment and limited integration of hydrological models into decision-making often exacerbate urban water shortages (Muller, Reference Muller2018). And indeed low lake levels, as well as subsequent water supply disruption in Gaborone and electricity supply disruption in Lusaka, were shaped by complex management and antecedent factors (Siderius et al., Reference Siderius, Gannon, Ndiyoi, Opere, Batisani, Olago, Pardoe and Conway2018). Nevertheless, low inflows combined with continuous high abstraction in both the Gaborone and Kariba dams contributed to disruption to water and electricity supplies (Figure 1). Gaborone Dam supplies piped water to Gaborone and, reflecting dry antecedent conditions, at the start of the El Niño Gaborone Reservoir levels were already 10 meters below the long-term average water level (Siderius et al., Reference Siderius, Gannon, Ndiyoi, Opere, Batisani, Olago, Pardoe and Conway2018). Gaborone had been experiencing water usage restrictions since 2013, as well as increasing disruption to its water supply. Another year of reduced inflows in 2015/2016 further reduced lake levels in Gaborone Dam and by the end of 2015, demand in the Greater Gaborone Area was estimated to surpass supply by 32.9 million litres a day (Water Utilities Corporation, 2015). In the autumn of 2015, unreliable water supply moved to first position in the challenges that businesses reported in the bi-annual Bank of Botswana Business Expectations Survey (Bank of Botswana, 2015).
The drop in Lake Kariba levels occurred during an 18-month dry period (Figure 1). Hydropower accounts for 94% of national installed electricity generation capacity and following rapid expansion of industry, urbanization and domestic connection, Zambia is experiencing rising demand for power (Energy Regulation Board, 2015). To meet this demand, installed hydropower capacity has been increased in recent years at Lake Kariba and, if operated at full capacity, turbines on Lake Kariba would now require more water than the average inflow, making it possible to empty the live storage of Lake Kariba in a single year of drought (Siderius et al., Reference Siderius, Gannon, Ndiyoi, Opere, Batisani, Olago, Pardoe and Conway2018). Low water levels at the Kariba Dam contributed to a national power deficit, estimated at 985 megawatts in October 2015 (Pricewaterhouse Coopers (PWC), 2015) and in 2015 Zambia experienced a 7% decline in national electricity generation from 2014 levels (Energy Regulation Board, 2015). ‘Unprecedented’ daily load shedding occurred, particularly within Lusaka Province and the Copper Belt, where most electricity is consumed. Alongside a fall in global copper prices and low agricultural output, in 2015, when the electricity-supply deficit was estimated at 40–50% of baseload, real economic growth in Zambia dropped to its lowest rate in more than 15 years (Rasmussen et al., Reference Rasmussen, Zamba and Chirwa2016).
1.3. Economic impacts of El Niño related hydrological disruption: exploring MSME experience of urban flooding, water supply disruption and hydroelectric load shedding
Research suggests that direct and indirect effects of El Niño precipitation and temperature anomalies, and other resulting hydrological impacts such as droughts and floods, can have a strong impact on global GDP growth and commodity prices (Brunner, Reference Brunner2002). Yet, reflecting the heterogeneous ways in which the phenomenon manifests across different locations and climates, macro-economic impacts of El Niño vary significantly globally, producing beneficial, as well as negative effects on economic activity (Laosuthi & Selover, Reference Laosuthi and Selover2007; Cashin et al., Reference Cashin, Mohaddes and Raissi2017). The structure of an economy is key in determining the nature and magnitude of a climate shock (Benson & Clay, Reference Benson and Clay1994; Laosuthi & Selover, Reference Laosuthi and Selover2007; Cashin et al., Reference Cashin, Mohaddes and Raissi2017) and, broadly speaking, impacts of El Niño on growth appear to be more pronounced in countries, including much of sub-Saharan Africa (SSA), with a larger share of GDP or employment in agriculture (Smith & Ubilava, Reference Smith and Ubilava2017).
Agricultural production is far from the only link through which El Niño can impact livelihoods or economic growth, yet the indirect impacts and multiplier effects of El Niño temperature and precipitation anomalies, as well as their impact on other factors of development and on non-agricultural production, is less well studied. The impacts of flooding, water supply disruption and hydroelectric load shedding, as seen in Nairobi, Gaborone and Lusaka, respectively, during the 2015/2016 El Niño, signal priority areas for research in SSA. Flood events present serious concern for economic and social wellbeing in SSA (Grey & Sadoff, Reference Grey and Sadoff2007), yet they have been afforded less scholarly attention than drought (Tarhule, Reference Tarhule2005). Equally, despite water rationing and episodic water supply disruption becoming endemic in a number of SSA's cities, the evidence base considering the quality of water supply and electricity supply in relation to economic activity is similarly slim, especially in developing countries. Work that does exist often draws on World Bank data sets such as the World Bank Enterprise Survey and the Doing Business project (e.g. Arnold et al., Reference Arnold, Mattoo and Narciso2008; Escribano et al., Reference Escribano, Guasch and Pena2010; Scott et al., Reference Scott, Darko, Lemma and Rud2014; Nyanzu & Adarkwah, Reference Nyanzu and Adarkwah2016). Macro-level economic analyses, however, fail to capture impacts of hydrological disruption at micro-scales and can obscure important heterogeneities of impacts among populations. This represents a major limitation to assessing progress towards and designing interventions to support the Paris Agreement commitment to strengthen adaptation action, including for those that are particularly vulnerable to the effects of climate change. Impacts of flooding and of water and electricity supply disruption on livelihoods could also have significant implications for the realization of several Sustainable Development Goals (SDGs), including SDG7 (Affordable and Clean Energy), SDG8 (Decent Work and Economic Growth), SDG9 (Industry, Innovation and Infrastructure) and SDG10 (Reduced Inequalities).
This paper accordingly takes a more micro-focus and contributes to research on the socioeconomic impacts of climate variability and associated resource disruption by profiling three case studies of MSME experience of water supply disruption in Gaborone, load shedding in Lusaka and flooding in Nairobi. This focus allows us to profile impact pathways of hydrological disruption associated with a major El Niño event. But it also offers a near-real time snapshot of firm-level experience of a range of climate-related forms of hydrological and resource disruption, as well as of business adaptation behaviour during climate extremes in SSA. Existing literature on private sector adaptation has tended to focus on larger sized companies in developed countries (Crawford & Seidel, Reference Crawford and Seidel2013; Averchenkova et al., Reference Averchenkova, Crick, Kocornik-Mina, Leck and Surminski2016). However, we focus on MSMEs – businesses with between 1 and 99 employees (World Bank, 2009) – since formal (registered) and informal MSMEs are key drivers of economic growth in SSA and provide most livelihood opportunities, typically accounting for approximately 80% of total employment (Dougherty-Choux et al., Reference Dougherty-Choux, Terpstra, Kammila and Kurukulasuriya2015). Supporting MSMEs is crucial for more inclusive and equitable development (African Development Bank Group (AfDB), 2013; Welsh et al., Reference Welsh, Melimi, Kaciak and Ahmed2013; Atela et al., Reference Atela, Gannon, Crick and Leal Filho2018; Crick et al., 2018 b). Yet MSMEs in SSA face numerous challenges in their business enabling environment, including underdeveloped infrastructure and limited access to finance, technology, markets, skilled labour and information services (Crick et al., 2018 b). This limits adaptive capacity and access to essential services at times of climate-related disruption and leaves MSMEs particularly vulnerable to climate extremes (Agrawala et al., Reference Agrawala, Carraro, Kingsmill, Lanzi and Prudent-Richard2011; Wedawatta & Ingirige, Reference Wedawatta and Ingirige2016). Despite their critical role in SSA economies, understanding of the way in which MSMEs experience and adapt to climate risk is very low – especially in developing countries – yet this likely forms an important prerequisite for designing interventions to support sustainable MSME adaptation.
2. Methods
2.1. A mixed-methods approach
In this research, we generate new evidence on firm-level experience of El Niño related hydrological and resource disruption and on MSME adaptation behaviours through seeking to understand the experience and challenges of El Niño related disruption from the perspective of MSME owners and managers. Through a mixed-methods design that combines key informant interviews with surveys of MSMEs, we employ a semi-structured approach to eliciting business perceptions of the impacts of El Niño related hydrological disruption and to gain insights into adaptive management behaviours. This work builds on complementary analysis of hydrological impact pathways (Siderius et al., Reference Siderius, Gannon, Ndiyoi, Opere, Batisani, Olago, Pardoe and Conway2018) and profiles the three case studies through an assessment of business activity in the months surrounding the 2015/2016 El Niño. We focus specifically on MSMEs located within the capital cities of Gaborone, Lusaka and Nairobi, where business activity is concentrated and where exposure to the impacts of El Niño was high. Our methods are now briefly outlined. A more detailed account of the research design is provided in the Supplementary Material.
2.2. Key informant interviews
Semi-structured interviews were conducted with key organizations and actors in each country. Relevant local and national government departments and NGOs were approached for interview and a snowball approach was used to extend the sample. A total of 41 respondents were consulted across the three case studies, through interviews lasting between 45 minutes and 2 hours (Table 1). Each interview was captured through a transcribed audio recording and/or detailed written notes. Interviews were used to guide the design of the MSME survey and to contextualize and triangulate MSME perceptions of the El Niño event. To help structure the analysis, a coding schedule was iteratively developed in both an inductive and deductive manner and NVivo qualitative analysis software was used to code the data.
Summary table of micro, small and medium enterprise (MSME) and key informant samples.
2.3. MSME survey
Table 1 summarizes the study MSME sample. Analysis focused on nationally salient sectors, refined through selection criteria including: anticipated exposure to disruption (informed by key informant interviews); contribution to the national economy; importance to national economic strategic direction; and contribution to female employment. Following the approach used in the World Bank Enterprise Surveys (World Bank Group, 2017), for each sector in Gaborone and Lusaka a simple random sample was derived from a sample frame of a full list of eligible firms obtained from government agencies that monitor or administer programmes for MSMEs. It was not possible to obtain a list of businesses in Kenya in time to allow near-real time consideration of MSME experience of disruption, so enumerators developed a sample frame of businesses in different areas of the city, to achieve a good geographical distribution.
The MSME survey instrument contained quantitative and qualitative elements and was administered by a team of enumerators in each city, in the months following the 2015/2016 El NiñoFootnote ii. Where possible, surveys were conducted with business owners or with senior business managers. To permit greater comparability, the survey instrument was informed by other related survey tools (e.g. Scott et al., Reference Scott, Darko, Lemma and Rud2014; World Bank Group, 2017). To enrich data interpretation, each survey included a section for enumerator reflections and, following data collection, enumerators also completed a survey about their own perceptions of the disruption. In this paper, analysis of the quantitative dimensions of the survey is presented through descriptive statistics. Qualitative data obtained through the survey were incorporated into the coding schedule described above.
2.4. Hydrological data and night light radiance
Hydrological data sets were also used to inform interpretation of the social science data (Figure 1). ‘Climate Hazards Group InfraRed Precipitation with Station’ (CHIRPS) data, were used to derive seasonal (i.e. 6-monthly; January to June and July to December) precipitation anomalies for the areas of interest (country or upstream catchment area). CHIRPS is a 30+ year quasi-global precipitation dataset at 0.05° resolution, incorporating satellite imagery, infrared Cold Cloud Duration observations, with in-situ station data to create gridded precipitation time series (Funk et al., Reference Funk, Peterson, Landsfeld, Pedreros, Verdin, Shukla, Husak, Rowland, Harrison, Hoell and Michaelson2015). Kariba lake levels are routinely monitored as part of the G-REALM lake level project by the US Department of Agriculture's Foreign Agricultural Service in co-operation with the National Aeronautics and Space Administration and the University of Maryland (Birkett et al., Reference Birkett, Reynolds, Beckley, Doorn, Vignudelli, Kostianoy, Cipollini and Benveniste2011). The Gaborone Reservoir in Botswana is not included in this dataset and hence reservoir levels were obtained from the Botswana Department of Water Affairs. A more detailed analysis of the hydrological impact pathways can be found in Siderius et al. (Reference Siderius, Gannon, Ndiyoi, Opere, Batisani, Olago, Pardoe and Conway2018).
Night light radiance as observed by satellites has proven a useful proxy for economic activity at the national level, explaining cross sectional differences as well as growth rates (Henderson et al., Reference Henderson, Storeygard and Weil2012; Mellander et al., Reference Mellander, Lobo, Stolarick and Matheson2015) and for assessing the short-term economic impact of weather shocks and power outage detection at the more local level (Cole et al., Reference Cole, Wanik, Molthan, Román and Griffin2017; Mohan & Strobl, Reference Mohan and Strobl2017). Monthly average radiance composite images using night-time data from the Visible Infrared Imaging Radiometer Suite (VIIRS) Day/Night Band (DNB) was therefore also used to illustrate the economic impact of power outages over Lusaka. DNB data are filtered to exclude data impacted by stray light, lightning, lunar illumination, and cloud cover, but not lights from aurora, fires, boats, and other temporal lights (Henderson et al., Reference Henderson, Storeygard and Weil2012; Mellander et al., Reference Mellander, Lobo, Stolarick and Matheson2015). Cloud cover is determined using the VIIRS Cloud Mask product (VCM). It is made available at a 15 arc-second resolution. To obtain a robust estimate of average monthly radiance we only used data based on at least eight cloud free days in a month. This excluded fully all monthly images during the rainy season in each year, from November until February and up to 6% of pixels in the remaining images. We further masked for very low radiance values (<1 W cm−2 sr−1).
3. Results
3.1. The scale of disruption experienced by MSMEs
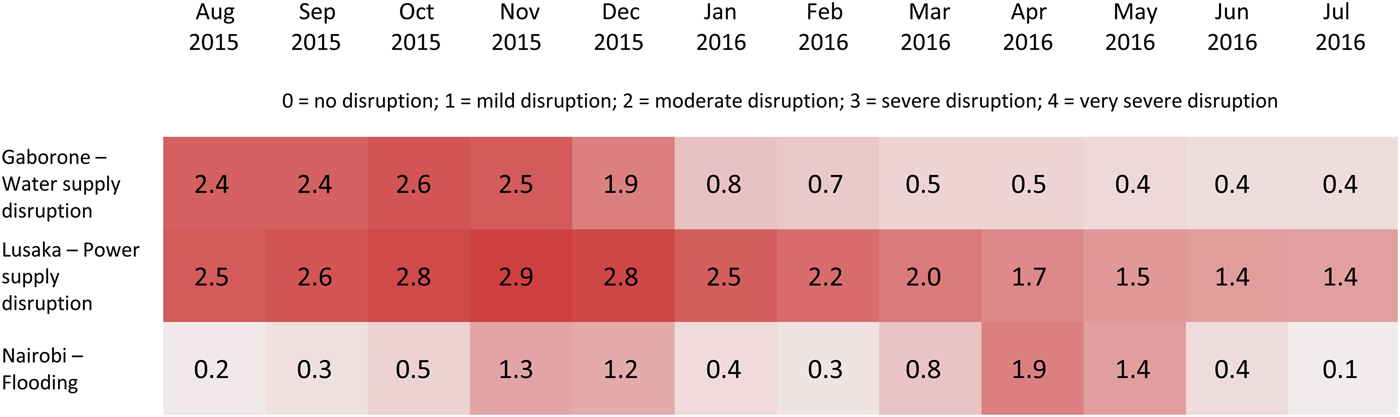
In each case study, results suggest that resource disruption within each of the cities studied was widespread and temporally variable, with shorter episodes of less severe disruption experienced in Nairobi. These characteristics, at least in part, reflect the varying nature of the hazards studied and the scale of precipitation anomaly experienced in each country (Siderius et al., Reference Siderius, Gannon, Ndiyoi, Opere, Batisani, Olago, Pardoe and Conway2018). In Lusaka and Gaborone, MSMEs reported the worst disruption occurred between August and December 2015, while in Nairobi, MSME managers indicated heavy precipitation resulted in mild impacts during the short rains, with a second mild to moderate impact peak in April and May 2016, during the long rains (Figure 2). In Nairobi, 87% of MSMEs surveyed reported being directly or indirectly impacted by flooding during this period. To balance the network, the Zambian power utility ZESCO pursued a policy of strategic load shedding, concentrated in areas of high demand. Key informants described networks surrounding industrial hubs, government buildings and key services being offered greater protection from load shedding. Nevertheless, all businesses surveyed in Lusaka reported experiencing power outages. Water delivery was also strategically prioritized in Gaborone, but again almost all businesses surveyed (97%) reported experiencing supply disruption.
Average monthly disruption score reported by micro, small and medium enterprises (MSMEs). On a five-point scale, respondents ranked the severity of disruption experienced by their business between August 2015 and July 2016.
Across all three countries, MSMEs largely perceived the disruption that their business experienced during the El Niño to be more frequent, and to have lasted longer, than they considered ‘usual’, although this trend was much less stark in Nairobi (Figure 3). Businesses and key informants in Gaborone and Lusaka highlighted the novel nature of the disruption. Indicative of this trend (recognizing there are confounding factors such as the possibility of substituting electricity for lighting), an average 25% reduction in night lights radiation (NLR) was observed over Lusaka during the months of September and October 2015 and April 2016, compared to the average NLR over the 2012–2016 periodFootnote iii (Figure 4). Basic outlier detection signals that these ‘El Niño months’ are clear outliers, with NLR falling at (September and October 2015), or below (April 2016), 1.5 times the interquartile range below the first quartile.
Micro, small and medium enterprise (MSME) perception of increased severity of disruption experienced during the 12 months prior to the survey, as compared to usual conditions (shown as a percentage of MSMEs surveyed). The severity score is the response average of two questions regarding MSME perceptions of increased regularity and duration of disruption: “Over the last 12 months my business has experienced more regular water supply disruption/power outages/flooding than is usual” and “Over the last 12 months the water supply disruption/power outages/flooding that my business has experienced has/have generally lasted longer than is usual”.

Percentage night light radiance (NLR) reduction over Lusaka and surrounding areas during the 2015/2016 El Niño, compared to the average NLR of April 2012 until October 2016. Data obtained from NOAA National Geophysical Data Center (Elvidge et al., Reference Elvidge, Baugh, Zhizhin and Hsu2013). To illustrate the impact of load shedding in the Lusaka metropole area, data are shown for the month nearest to the reported peak of the power outages for which at least 25%, that is, eight cloud free nights could be observed (i.e. September and October 2015 and April 2016). The figure compares nightlight with the average of nightlight over the previous five years (April 2012 until October 2016).

MSMEs and key informants in Nairobi, typically stressed that while the disruption was more pronounced than ‘usual’, heavy precipitation and flooding was significantly less severe than was experienced during the 1997/1998 El Niño. Recalling the extent of disruption in 1997–1998, some MSMEs even expressed disbelief that El Niño had occurred during 2015/2016. Despite this deviation in Kenya, as El Niño drew to a close, MSMEs surveyed in Gaborone, Lusaka and Nairobi reported water supply disruption, power outages and flooding, respectively, to be the greatest obstacles in their business environment (Figure 5). This ranking overtook an inadequately educated workforce, access to finance and practices of the informal sector as the top business environment obstacles recorded in the World Bank Enterprise Surveys.
Average scores of obstacles in the business environment reported by micro, small and medium enterprises (MSMEs) in Gaborone, Lusaka and Nairobi at the start of the survey; that is, before respondents were asked more specific questions about their experience of water supply disruption, electricity supply disruption and flooding. Survey respondents were asked to score each potential obstacle to the operation of their business on a five-point scale. Obstacles are ordered in descending severity according to the most severe score across all countries. Both darker colour and larger size indicate higher scores and thus imply more severe obstacles. The selection of obstacles for inclusion was informed by the World Bank Enterprise Survey results (World Bank Group, 2017).

3.2. Impacts of disruption experienced by MSMEs
Figure 6 summarizes some of the direct and indirect impacts through which MSMEs described experiencing disruption. Suspension of business activities and reduced productivity were among the most commonly reported consequences of the disruption explored in each country. This was most pronounced in Lusaka where, unless able to source alternative power supplies, businesses requiring electricity for their operations often reported their business coming to a ‘stand still’ at times of load shedding. Activities such as water pumping, manufacturing, processing, building, cooling and communications were interrupted, with carpentry tools (e.g. drills and lathes), tools for food and beverage processing (e.g. mixers, slicers, ovens, proofers, packaging and bottling tools) and IT technologies all examples of equipment immobilized from electricity supply disruption. Some manufacturing businesses described additional time lost, as machines took time to restart. In Gaborone, lack of available water for food preparation, for butchery, for irrigation and for laundry, cleaning and sanitation, resulted in restaurants, accommodation enterprises, food preparation and processing businesses and other service industries, such as hairdressers and car washing businesses, being unable to operate, provide services to customers, or maintain hygiene standards. In Nairobi, business operations were often halted among MSMEs that experienced the direct impacts of building inundation and impassable transport networks, with staff absences and disruption to supply chains notable drivers of suspended operations. But losses from non-productive time were also described in Nairobi, as a result of power outages and water supply disruption during heavy precipitation events.
Illustration of impact pathways through which the micro, small and medium enterprises (MSMEs) surveyed perceived experiencing disruption from El Niño related flooding (Nairobi), water supply disruption (Gaborone) and power outages (Lusaka). In this figure, qualitative accounts of impact pathways from MSMEs and key informants are integrated with quantitative survey data, where available, to offer quantified examples of some of the impacts of disruption perceived and reported by MSMEs in each case study country. Percentages for each country are calculated from responses to one, or a combination, of survey questions. This information is provided as a percentage of businesses to report experiencing each impact as a result of El Niño related flooding (Nairobi), water supply disruption (Gaborone) or power outages (Lusaka). Arrows denote the impact pathways and feedback mechanisms described by MSMEs surveyed and should not be understood as a comprehensive depiction of all possible impact pathways. Direct impacts of drought were not explicitly explored through the survey and are not included within this representation.

Damage to business inventory and assets were other common consequences reported by MSMEs. In Nairobi, respondents described loss and damage to buildings, equipment, vehicles, crops, livestock and land from inundation of water, sewage and silt deposits. Perishables and other fresh produce were also lost as a result of disrupted transportation networks and changes in demand, which prevented timely distribution and sales. In Lusaka, losses were especially felt through damage to inventory caused by lack of heating and refrigeration. Poultry businesses in Lusaka, for example, lost chicks through the absence of the reliable heating and lighting needed for rearing. In another example, a bakery business in Lusaka was experiencing a power outage at the time of being surveyed. They feared that if the power did not return quickly, the cake mixture that they had prepared that morning would spoil before they could bake it and would have to be thrown away. MSMEs in Lusaka and Gaborone also cited examples of equipment, such as washing machines, being damaged by unstable water and electricity supplies.
Respondents felt that other disturbances within supply chains, in the form of price fluctuations and issues of access and availability, presented additional implications for firm productivity and profitability. Some businesses in Gaborone reported struggling to access beef products from their suppliers, for example, as a result of insufficient water to slaughter cattle. While in Nairobi, some businesses reported suppliers being unable to deliver inputs or supplies, or delivering goods late, or of a lower quality. And just as suppliers struggled to meet orders on schedule, interruptions to business operations and reductions in business productivity meant that, in each country, more than 50% of the MSMEs surveyed reported that they too had been unable to fulfil obligations to provide goods and services to customers. MSMEs often perceived the resulting customer inconvenience to have had significant impacts on both their short-term profits, as customers demanded refunds or discounts for services or goods, and on their long-term customer base, believing they had permanently lost business to competitors.
MSMEs in all countries reported experiences of suppliers increasing their prices and MSMEs in all countries often highlighted increased costs of operating, as well as costs of acquiring new equipment, making repairs to damaged buildings and equipment and of replacing lost inventory (see section 3.3). These combined pressures contributed to more than half of MSMEs surveyed perceiving lower annual profits. Indeed, 25% of businesses surveyed in Nairobi and almost one third of businesses surveyed in Gaborone and Lusaka (c.f. Akuru & Okoro, Reference Akuru and Okoro2014) believed that their business was at risk of closing down as a result of the disruption. This study did not capture rates of business closure resulting from disruption, however key informants and MSME owners in all three countries suggested high prevalence, with some businesses describing existing plans to close their business.
3.3. Awareness, preparedness and coping
Awareness of El Niño and its likely outcomes varied across our case study countries. In Botswana, Zambia and Kenya, El Niño forecasts are disseminated at a national level through seasonal forecasts issued by the national meteorological departments and produced in collaboration with actors including the World Meteorological Organization and regional climate outlook forums. National seasonal forecasts in all three countries first declared the development of a strong El Niño for the first time in late-August/early-September 2015, when results show some of the most severe impacts of disruption had already begun in Lusaka and Gaborone (Figure 2).
3.3.1. Nairobi anticipated flooding
Reception of the El Niño forecast varied significantly across the case study countries. ‘El Niño’ has penetrated social discourse in Nairobi to an extent not seen in Lusaka or Gaborone due, at least in part, to the 1997/1998 El Niño when Kenya experienced widespread flooding and severe disruption that affected most of the country. “In 1997 everyone was a victim” a key informant in Kenya Meteorological Department explained. Key informants in Nairobi suggested that the term ‘El Niño’ is often used synonymously with ‘flooding' and, at the institutional level, they described a high level of national preparedness for the 2015/2016 El Niño arising from the release of the seasonal forecast and suggested that Kenyans have “learnt from” the 1997/1998 El NiñoFootnote iv. The MSMEs we surveyed expressed contrasting views on the level of national preparedness for the disruption and called for greater government intervention to protect their businesses (e.g. clearing drains). Nevertheless, awareness of El Niño and expectations about its likely impacts was higher among businesses in Nairobi than in Lusaka and GaboroneFootnote v and MSMEs in Nairobi undertook a range of ex-ante strategies to limit the damage that their business experienced from flooding and, in some cases, to maximize opportunities. These included cleaning ditches and drains, deploying flood defences (e.g. trenches and sandbags), temporarily or permanently vacating premises, acquiring spare parts, placing orders earlier, diversifying suppliers, reducing or adjusting business hours, setting aside funds for additional costs, and petitioning local politicians for support. Business diversification was another coping strategy reported by MSMEs. Respondents, for example, described switching to petty trade, selling alternative products not impacted by heavy precipitation and acquiring land for farming, investing in crop planting and converting to farm work during floods to capitalize on the additional water available for irrigation.
3.3.2. Lusaka and Gaborone anticipated agricultural drought and were largely unprepared for load shedding and water supply disruption
El Niño forecasts were also contextualized into their national contexts and disseminated through seasonal forecasts in Botswana and Zambia. Yet seasonal forecasts have tended to be poorly integrated into water management sectors in developing countries (Ziervogel et al., Reference Ziervogel, Johnston, Matthew and Mukheibir2010; Lötter et al., Reference Lötter, Davis, Archer, Vincent, Pardoe, Tadross, Landman, Stuart-Hill and Jewitt2018). Key informants suggested this disconnect was exacerbated in Zambia by the country's history of relative electricity security. The link between drought conditions and reduced hydropower generation is not new in SSA. Yet Zambia has traditionally had an electricity surplus, even selling power to neighbouring countries through the Southern African Power Pool (SAPP) (Hillig et al., Reference Hillig, Cossen and Waitz2016). Moreover, comparable load shedding has not been triggered by previous El Niño events or previous periods of similarly low-lake levels (see Figure 1). As a result, “nobody was sitting under the expectation that we are going to have a sudden gap in energy” a representative of the Ministry of Energy and Water Development explained. Indeed, reflecting the extent to which the country was caught unaware, load shedding was largely absent from the Zambia Vulnerability Assessment Committee In-Depth Vulnerability and Needs Assessment Report published in June 2015, which sought to understand economic impacts of drought on the economy (Zambia Vulnerability Assessment Committee, 2015).
In both countries, advisories were typically concentrated on agriculture, with limited evidence of seasonal forecasts being translated into widely communicated sector-specific risks and vulnerabilities. Lack of user-tailored climate services and lack of capacity to interpret the implications of information for different sectors are often cited factors limiting uptake of forecasts and other climate information in SSA (Dilling & Lemos, Reference Dilling and Lemos2011; Vincent et al., Reference Vincent, Cull, Archer Van Garderen, Conway, Dalin, Deryng, Fallon and Landman2016; Lötter et al., Reference Lötter, Davis, Archer, Vincent, Pardoe, Tadross, Landman, Stuart-Hill and Jewitt2018). Thus, this had implications for supply-side management of water and electricity provision (Siderius et al., Reference Siderius, Gannon, Ndiyoi, Opere, Batisani, Olago, Pardoe and Conway2018). But it also meant that users on the ground were mostly not anticipating the scale of resource disruption and MSMEs in Gaborone and Lusaka often reported receiving the first warnings of enhanced water and electricity supply disruption (through sources such as radio, tv and newspapers) at approximately the same time as the most severe disruption began, giving them minimal lead time to prepare.
Firms in Lusaka were particularly unprepared to insulate themselves from the impacts of load shedding as, unlike in other SSA countries that have faced long-standing, chronic electricity insecurity, generator ownership was comparatively lowFootnote vi. Generators are expensive to run in comparison to grid power and result in their own business losses. But generators are a primary means through which firms in SSA cope with electricity insecurity (Scott et al., Reference Scott, Darko, Lemma and Rud2014) and losses from unreliable power experienced by firms without a generator are overall thought to be much higher (Cole et al., Reference Cole, Elliott, Occhiali and Strobl2018). Water supply disruption was a slower onset challenge in Botswana, with disruption building since 2013, so some businesses had already invested in a range of coping strategies, such as water recycling and storage strategies (e.g. through the purchase of water tanks). Nevertheless, the scale of water supply disruption in Gaborone during 2015/2016 remained unprecedented and MSMEs still generally described low preparedness and a sense of being caught unaware.
3.3.3. Ex-post coping strategies in Lusaka and Gaborone
When disruption began, MSMEs in Gaborone and Lusaka began to employ a range of coping strategies to manage their exposure. MSMEs adjusted business hours, for example, shifting production to hours when power and/or water was available, or extending business hours, to increase opportunities for business operations to remain active, sometimes operating at night. Some businesses described scaling back their business activities, production and orders (e.g. of fresh produce), to reduce losses or to reduce the number of man-hours wasted. With potential wider-reaching and long-term consequences for livelihoods, household incomes and purchasing power, MSMEs in all three countries reported permanent reductions in their workforce, and others reported temporarily dismissing employees at times of disruption. Others relocated their activities, temporarily or permanently, to areas they believed experienced less severe disruption. MSMEs described disruption influencing business investment decisions, such as decisions not to expand their business (including the decision not to take on more employees) or the decision not to invest in or upgrade water or electricity dependent equipment. In addition to investing in alternative energy sources, some businesses in Lusaka invested in manual equipment and in Gaborone alongside investments in tanks and buckets to store water, businesses purchased water from alternative sources, including through water trucking services. Businesses instituted water and electricity efficiency and conservation strategies. In addition, business diversification (including to activities that require less water or power), setting aside funds in anticipation of higher business costs (e.g. purchasing fuel and water), finding alternative suppliers and petitioning water and electricity utilities to change water supply disruption and load shedding schedules were among the other strategies MSMEs in Lusaka and Gaborone reported pursuing to limit the impacts of disruption. Both insurance and loan acquisition were rarely employed coping strategies among the MSMEs surveyed in all three cities.
3.3.4. Winners and losers in complex and diverse impact pathways
Coping strategies adopted by MSMEs in all three cities contributed to complex impact pathways with direct, indirect and multiplier effects (Figure 6). Coping strategies often came at a cost. Accommodation businesses in Gaborone, for example, described taking on additional operating costs from buying water (e.g. through water trucking services) in order to change linens, prepare food, maintain the cleanliness of their facilities and supply guests with flushing toilets and shower facilities. Yet some then found that water quality issues meant that, in addition to lost income through closures and reduced productivity, they still lost customers, who moved on to other establishments with more reliable or satisfactory supplies (c.f. Selelo et al., Reference Selelo, Madigele, Ntaka and Moetedi2017). Similarly, MSMEs in all countries described increased fuel costs: for example, from travelling to collect water in Gaborone, from powering generators in Lusaka and from congested and diverted roads in Nairobi. Coping strategies were also not always sustainable (Crick et al., 2018 a). Strategies such as reductions in workforce and shutting-down or scaling back business operations, for example, may have helped businesses cope in the short term, but, by decreasing productivity and through foregone sales revenue, they also have the potential to have increased future vulnerability and depleted adaptive capacity.
The impacts businesses experienced and their ability to cope was also varied and unevenly distributed, resulting in wins and losses, with potential implications for overall wealth distribution (c.f. Changnon, Reference Changnon1999; Cashin et al., Reference Cashin, Mohaddes and Raissi2017). Kenyan taxi drivers, for example, were said to benefit from additional custom, with road blockages and increased congestion increasing the fares they charged. Meanwhile demand for motorbikes decreased and those who drove buses (matatu) struggled to meet daily quotas, since fares did not increase to compensate for time lost in traffic. Similarly, respondents in Gaborone and Lusaka suggested that those businesses which maintained their water and power supply, or which were able to access alternative sources, were also able to benefit from increased demand for products and services. In all three countries, prices of some goods were said to increase following disruption, with some businesses suggesting that this compensated for their losses.
The diverse nature of different business activities and varying exposure to disruption was partly responsible for the disparity in impacts among MSMEs. Exposure had a strongly geographical component, whereby MSMEs in each city experienced more frequent and severe disruption depending on the area of the city in which they were located. However, MSMEs also described a diverse range of other factors shaping their overall vulnerability to the disruption and their ability to respond to warnings of disruption, when they received them. Indeed, 46% of MSMEs surveyed suggested that, given other barriers to action, receiving a warning of disruption either did not help their business to plan for impacts of disruption, or it would not have done so, had they received it.
Highlighting the African gap in access to and use of finance (Beck & Cull, Reference Beck and Cull2014; Quartey et al., Reference Quartey, Turkson, Abor and Iddrisu2017), and echoing earlier literatures on private sector adaptation in developing countries (Crick et al., Reference Crick, Gannon, Diop and Sow2018 b), MSMEs across all countries identified finance as by far the most significant barrier they faced to adaptation. Indeed, in Lusaka, finance remained a significant barrier to investment in alternative energy resources despite a number of public loan schemes and tax breaks for solar and generator equipment that were developed ex-post, in response to load shedding. The MSMEs we surveyed often felt that they were at a particular disadvantage to accessing resources to support their adaptation compared to larger enterprises (c.f. Fjose et al., Reference Fjose, Grünfeld and Green2010). “Those that have the muscle to put these things in place were able to take advantage of the situation”, a respondent in Lusaka reflected (Runyan, Reference Runyan2006; Wedawatta et al., Reference Wedawatta, Ingirige and Amaratunga2010). Lack of confidence or knowledge to implement strategies was also a notable barrier reported (c.f. Robertson, Reference Robertson2003; Crick et al., Reference Crick, Eskander, Fankhauser and Diop2018 a). And other more specific information gaps emerged as key barriers to adaptation. Businesses in Gaborone and Lusaka reported that uncertainty around the anticipated duration and severity of ongoing water and electricity supply disruption, for example, made it hard to make decisions, such as whether or not to invest in expensive equipment such as generators and water storage equipment. In addition, while businesses suggested that load shedding and water supply disruption timetables would be theoretically useful in allowing them to schedule production, plan for when their workforce should be present and prevent damage to equipment, the accuracy of these timetables, in relation to actual disruption, was often perceived as very low and their use was similarly fairly lowFootnote vii.
4. Discussion and conclusions
This paper highlights some of the important, but under-recognized consequences for economic activity associated with a major El Niño event and contributes to a range of literatures on: El Niño impact pathways in SSA; micro-economic impacts of flooding, water supply disruption and load shedding; and MSME adaptation behaviour in the face of a range of hydrological hazards. Precipitation anomalies associated with the 2015/2016 El Niño were not unprecedented in any of the countries studied, considering the strength of the El Niño event and in the context of other hydrological variability in SSA. This suggests disruption was strongly shaped by existing structural weaknesses in energy, water and urban infrastructure, antecedent conditions and management decisions, which El Niño exacerbated and exposedFootnote viii. In Zambia, for example, it is thought that load shedding was exacerbated by factors including underinvestment and diminishing capacity in Zambia's energy sector to meet increasing demand over decades, alongside continuing high abstraction in the face of declining lake levels and other recent changes in exposure, sensitivity and water management (Siderius et al., Reference Siderius, Gannon, Ndiyoi, Opere, Batisani, Olago, Pardoe and Conway2018). With climate acting as a risk multiplier, this paper reveals that for some MSMEs, even fairly moderate changes in precipitation can contribute to major disruption to enterprise.
Where previously the focus has been on agriculture as the most vulnerable sector to climate variability and change, this research highlights the need to take a broader look at climate risk within SSA economies. This is especially salient in Botswana and Zambia where water supply disruption and load shedding represent fairly novel national adaptation challenges. In Gaborone and Lusaka, governments anticipated and prepared for the agricultural drought that has been typically associated with El Niño. But, despite adopting some ex-post steps to try and support MSMEsFootnote ix, key informants suggested that disruption to water and electricity supplies exceeded the bounds considered in planning previously and governments – and businesses – were largely unprepared. The 2015/2016 El Niño is therefore an important moment for learning in Botswana and Zambia. Indeed, these challenges are unlikely to be unique to our case study countries. Rapid urbanization is occurring across SSA and as more people are moving to cities, they are pursuing alternative livelihood strategies, setting up businesses and connecting – often for the first time – to water and electricity grids, increasing demand. Several African cities have high reliance on water provided by a small number of reservoirs (e.g. Cape Town) and/or rely on a few hydropower dams for a large proportion of their electricity supply. Moreover, ambitious expansion plans for hydropower in eastern and southern Africa will likely increase many countries’ already high reliance on hydropower, and many of these intended plants will be subject to similar patterns of rainfall variability, increasing the risk of concurrent climate-related disruption to production (Conway et al., Reference Conway, Dalin, Landman and Osborn2017). Anthropogenic climate change increases uncertainties (Cai et al., Reference Cai, Borlace, Lengaigne, van Rensch, Collins, Vecchi, Timmermann, Santoso, Mcphaden, Wu, England, Wang, Guilyardi and Jin2014; Niang et al., Reference Niang, Ruppel, Abdrabo, Essel, Lennard, Padgham, Urquhart, Barros, Field, Dokken, Mastrandrea, Mach, Bilir, Chatterjee, Ebi, Estrada, Genova, Girma, Kissel, Levy, MacCracken, Mastrandrea and White2014), particularly in rainfall variability in SSA, and competition for water between different sectors could also increase.
Deeper understanding of the vulnerabilities in existing water, energy and urban infrastructure – and of the effects of increasing urbanization and a potentially broader range of climate variability – is needed across SSA. Opportunities for more coherent integration of seasonal forecasts into water management should also be explored, for example, through tailored, sector-specific products that support decision-makers to move beyond ex-post responses. But clearer communication of potential risks to end users is also urgently needed. This research has highlighted that MSMEs have inherent and existing adaptive capacities and actively respond to risks – including climate and hydrological risks – as they perceive them. MSMEs in all countries took adaptive action that sought to maintain business continuity in the face of El Niño related hydrological disruption and this research provides examples of MSMEs taking ex-ante responses to forecasts and other resource disruption information, in an attempt to buffer their business from the worst impacts. This was especially the case in Nairobi, where businesses had a much clearer understanding of the possible implications of the El Niño forecast. Yet, in all countries studied, there are clear opportunities to improve communication and packaging of climate information and warnings to make them more usable and meaningful to MSMEs. Extensive local consultation and co-production is inevitably required for climate information producers and products to be informed by and meet the needs of the specific contexts and users that they are targeting (Dilling & Lemos, Reference Dilling and Lemos2011; Lötter et al., Reference Lötter, Davis, Archer, Vincent, Pardoe, Tadross, Landman, Stuart-Hill and Jewitt2018). Such approaches should maximize the opportunities presented by both greater private sector consultation in adaptation planning, as well as integration of indigenous knowledge systems to enhance both the reliability and acceptability of adaptation strategies and forecasting mechanisms (Nkomwa et al., Reference Nkomwa, Joshua, Ngongondo, Monjerezi and Chipungu2014; Ebhuoma & Simatele, Reference Ebhuoma and Simatele2017; Fitchett & Ebhuoma, Reference Fitchett and Ebhuoma2018). However, four clear gaps emerged in this research that warrant particular reflection.
Firstly, in Gaborone and Lusaka, the link between the El Niño seasonal forecast and potential risks to hydropower and water supply disruption were not well understood, and the effects were not anticipated by businesses. This contributed to businesses’ lack of preparedness. Secondly, and related to this, when disruption began, MSMEs were unclear how long disruption would continue. This made it harder for businesses to make strategic decisions about whether or not to invest in expensive adaptation strategies. Thirdly, MSME owners reported that water supply and load shedding timetables could theoretically help them to plan for and adapt to disruption when it occurs. Yet unreliability of these timetables was a major barrier to their application, indicating an important role for country policy makers to more effectively and reliably publish and keep to load shedding and water supply disruption schedulesFootnote x. Fourthly, recognizing that trust is key to acceptance and use of forecasts (Dilling & Lemos, Reference Dilling and Lemos2011; Lötter et al., Reference Lötter, Davis, Archer, Vincent, Pardoe, Tadross, Landman, Stuart-Hill and Jewitt2018) and that various anxieties exist around initiating action related to forecasts (Glantz, Reference Glantz1982; Siderius et al., Reference Siderius, Gannon, Ndiyoi, Opere, Batisani, Olago, Pardoe and Conway2018), the relatively milder experience of flooding among MSMEs in Nairobi during 2015/2016, compared to during the 1997/1998 El Niño, highlights the need for greater recognition that every El Niño is different as both an atmospheric phenomenon and in terms of the local impacts and vulnerabilities it exposes.
To develop this fourth point a little further, variability in the characteristics of El Niño teleconnections supports the need for development and communication of more nuanced metrics of El Niño effects (Jacox et al., Reference Jacox, Hazen, Zaba, Rudnick, Edwards, Moore and Bograd2016) and better understanding of the differences between El Niño events, as well as clearer communication of uncertainties. El Niño definitional problems along with context of the forecast and impacts setting have also been shown to be important in a recent 2017 coastal El Niño in Peru (Ramírez & Briones, Reference Ramírez and Briones2017). Each El Niño provides an important opportunity for sharing experiences across agencies and between countries. The magnitude and extensive climate anomalies of the 2015/2016 El Niño makes it an ideal example for synthesizing lessons. Insights from a cross-country study after the 1997/1998 El Niño resonate with our findings: a need for multidisciplinary approaches and an appropriate framework for users to understand the limits of prediction, where providers prioritize what is useful and where scientific information is aligned with decision-making processes (Glantz, Reference Glantz2000). Prompted by the forecasts of El Niño in 2014 that never materialized, Michael Glantz argues that forecasting onset is still in an experimental phase but once onset is confirmed there is value in forecasting (or preparing for) its impacts on climate and society (Glantz, Reference Glantz2015). Nevertheless, our results show that adaptive management, at a public and private level, must also recognize a broader range of potential hydrological impacts with each El Niño, and incorporate review and adjust responses, with more emphasis on planning and contingency than is currently the case. As part of this MSMEs must be supported with the right information products and other capacity building investments to help them manage this uncertainty. The need for such innovation was underscored in Nairobi by key informants who suggested that because the 2015/2016 El Niño did not materialize as expected, Kenyans might be less likely to take a future forecast and preparedness so seriously.
Survey responses, nevertheless, suggest that improvements in forecasting and information services will only get MSMEs so far in terms of enabling adaptation, given other barriers to action. Even if they receive information that is theoretically useful, businesses still require the material means, as well as the necessary incentives, resources, knowledge and skills to respond to this information effectively. Meaningful climate information, forecasts and tailored information about resource disruption are therefore only one element of the enabling conditions that MSMEs require to make the adjustments necessary to respond to climate and hydrological risk. Echoing the findings of wider literatures (Crick et al., 2018 a; Crick et al., 2018 b), access to finance and capacity building, to address lack of knowledge and confidence to implement strategies, appear to be priority areas for supporting MSME adaptation to hydrological disruption. This research, for example, suggests that businesses will benefit from governments seeking to increase access to credit and designing incentives that support businesses to invest in adaptation and coping strategies, such as generator access (c.f. Cole et al., Reference Cole, Elliott, Occhiali and Strobl2018).
More broadly this research highlights that MSMEs cannot respond effectively to climate risk alone, signalling an important role for national governments in SSA, along with their development partners and civil society, to play a wider role in providing enabling conditions and policies that support private sector adaptation to extreme climate events and associated resource disruption (c.f. Gannon et al., Reference Gannon, Crick, Rouhaud, Conway and Fankhauser2018). Results in this paper suggest a varied and uneven distribution of impacts experienced by businesses. At a national level, El Niño in Kenya was described as a non-event, yet moderate flooding had profound impacts on some of the MSMEs we surveyed, suggesting a need to further explore the hypothesis that precipitation anomalies may entrench inequalities (Smith & Ubilava, Reference Smith and Ubilava2017). Overall, our results show that water supply disruption, hydroelectric load shedding and increased frequency of extreme precipitation events have significant potential to disrupt economic activity in SSA and represent major development challenges.
Supplementary material
The supplementary material for this article can be found at https://doi.org/10.1017/sus.2018.14
Author ORCIDs
Kate Elizabeth Gannon: https://orcid.org/0000-0001-6742-8982; Declan Conway: https://orcid.org/0000-0002-4590-6733; Joanna Pardoe: https://orcid.org/0000-0002-4373-6873; Mukelabai Ndiyoi: https://orcid.org/0000-0002-9342-5571; Nnyaladzi Batisani: https://orcid.org/0000-0002-5363-8580; Eric Odada: https://orcid.org/0000-0002-7295-7405; Daniel Olago: https://orcid.org/0000-0001-6080-5802; Christian Siderius: https://orcid.org/0000-0002-2201-9728
Acknowledgments
The authors would like to thank the key informants and survey respondents for their time and valuable insights, as well as the teams of enumerators in Gaborone, Lusaka and Nairobi who collected the MSME survey data. We are also grateful to Sam Fankhauser, Florence Crick and Shaikh Eskander at the Grantham Research Institute on Climate Change and the Environment, London School of Economics and Political Science for insightful discussions that helped shape this work and to Patrick Curran, also at the Grantham Research Institute on Climate Change and the Environment, for his input on the policy implications of this research. Nightlight data were obtained from the Earth Observation Group, NOAA National Geophysical Data Center.
Author contributions
K.G. led the research design, data collection and analysis, interpretation, manuscript writing and revision; D.C. designed the study and contributed to the ideas, interpretation, manuscript writing and revision; J.P. contributed to research design, data analysis and interpretation; C.S. contributed to research design, data interpretation and prepared Figures 1 and 4; M.N., N.B., E.O., D.O., A.O., S.K., M.N. and J.O. contributed to survey design and data collection. All authors discussed and reviewed the manuscript.
Financial support
This work was carried out under the Understanding the Impacts of the Current El Niño Event Programme, funded by the UK Natural Environment Research Council (NERC), grant ref: NE/P004784/1. K.G., D.C., J.P. and C.S. are also supported by funding from the UK Economic and Social Research Council (ESRC) through the Centre for Climate Change Economics and Policy and the Grantham Foundation for the Protection of the Environment. D.C., J.P. and C.S. are also supported through the Future Climate for Africa UMFULA project, with financial support from the UK Natural Environment Research Council (NERC), grant ref: NE/M020398/1, and the UK Government's Department for International Development (DfID).
Conflict of interest
None.
Ethical standards
This research and article complies with Global Sustainability's publishing ethics guidelines.


 Open access