

1. INTRODUCTION
At high latitudes, lakes affect the local climate and weather by modulating the temperature, wind, humidity and precipitation (Bonan, Reference Bonan1995; Ellis and Johnson, Reference Ellis and Johnson2004; Rouse and others, Reference Rouse and Woo2008). Essentially lake ice prevents heat and momentum transfer between the atmosphere and the lake water through its insulating effect from winter to spring. If the lake is covered by snow, this influence is further strengthened due to the lower thermal conductivity of snow. Therefore the duration and growth processes of lake ice are important for understanding the local/regional winter climate. The seasonality of lake ice also influences the lake ecosystem and its biogeochemical properties (Vanderploeg and others, Reference Vanderploeg, Bolsenga, Fahnenstiel, Liebig and Gardner1992; Salonen and others, Reference Salonen, Leppäranta, Viljanen and Gulati2009; Shuter and others, Reference Shuter, Finstad, Helland, Zweimuller and Holker2012). Furthermore, freezing lake-ice winter cover has an effect on social activities (Leppäranta, Reference Leppäranta and George2009). Various fishing techniques with drills on ice-covered lakes have been developed, and lake-ice functions as infrastructure for transportation in winter. Frozen lakes are also used as venues for recreation (e.g. ice fishing, skiing, long-distance skating and ice sailing).
Several recent studies of global warming (IPCC, Reference Houghton2001, Reference Solomon2007, Reference Stocker2013) have reported that lake-ice phenology (freeze up, ice-cover duration, break up) has changed worldwide. The freeze-up date is conventionally defined as the first date when a lake is completely covered by ice, whereas the break-up date is the first date when it is completely ice free (Kirillin and others, Reference Kirillin2012). Magnuson and others (Reference Magnuson2000) showed that the freeze-up date of lakes and rivers in the Northern Hemisphere was 5.8 d (100 a)−1 later, and the break-up date 6.5 d (100 a)−1 earlier, over the period 1846–1995. Similarly, shorter ice-cover duration and ice thinning have been reported in European high-latitude lakes (Bernhardt and others, Reference Bernhardt, Engelhardt, Kirillin and Matschullat2011; Kirillin and others, Reference Kirillin2012; Lei and others, Reference Lei, Leppäranta, Cheng, Heil and Li2012) and North American lakes (Surdu and others, Reference Surdu, Duguay, Brown and Fernández Prieto2014; Paquette and others, Reference Paquette, Fortier, Mueller, Sarrazin and Vincent2015).
These results were obtained mainly at relatively high latitudes. At midlatitude, however, observations have been very limited, and therefore, we postulate here that growth conditions may be quite different. Although the freeze-up date at Lake Suwa, Japan (36°N, 138°E), has been shown to occur 2.0 d (100 a)−1 later over the 550 a record (Magnuson and others, Reference Magnuson2000), the physical properties of the ice have yet to be clarified. To understand the growth processes of mid-latitude lake ice and discuss the influence of climate on a global scale, it is necessary to clarify the properties of lake ice at lower latitudes with different growth conditions. Meteorological conditions (air temperature, precipitation, incoming solar radiation and specific humidity, 1981–2010) of high-latitude and mid-latitude lake regions in the Northern Hemisphere are listed in Table 1, and monthly air temperature and total precipitation in winter are shown in Figure 1. As seen in the table and figure, the climate at mid-latitudes is characterized by relatively (1) moderate air temperature, (2) high-atmospheric water content and a considerable amount of snow, which activates the snow-ice (SI) growth compared with that at high latitudes, and (3) abundant solar radiation even in winter, which works to suppress the congelation ice (CI) growth. This figure also shows that the climate at Lake Abashiri is similar to that around the five Great Lakes of North America (e.g. Holroyd, Reference Holroyd1971; Ellis and Johnson, Reference Ellis and Johnson2004).
Mean air temperature and total precipitation in January 1981–2010 in lake regions. Regions at higher and lower latitudes than ~60°N are shown by triangles (high latitude) and squares (mid-latitude), respectively. Abashiri is shown by a filled black square. (Table 1 shows location details, air temperature and precipitation in other winter months.) Sources: Japan Meteorological Agency (2015); Pirinen and others (Reference Pirinen2012).

Monthly mean air temperature, total precipitation, incoming solar radiation and specific humidity in lake regions (1981–2010) (Pirinen and others, Reference Pirinen2012; Japan Meteorological Agency, 2015; Leppäranta, Reference Leppäranta2015)

In this study, to clarify lake-ice formation processes at midlatitudes, field observations were carried out at Lake Abashiri, located in the northeastern part of Hokkaido, Japan, over the winter of 2012/13. Ice covers the lake seasonally from December to April. Lake-ice samples were collected every month and analyzed, with a focus on the internal structure of the ice. Heat flux within the ice was also measured. Based on these observational data, a 1-D vertical thermodynamic model is investigated to predict the evolution of ice thickness at Lake Abashiri as a representative case study for mid-latitude snow and ice-cover formation processes on the lake in winter.
Up till the 1980s, analytical or semi-empirical models were widely used to predict the thickness evolution of lake ice. At that time, the major input parameters were freezing degree days. Differences in ice type and various other factors were not taken into account. A numerical thermodynamic growth model for sea ice was first developed for Arctic sea ice with a snow layer by Maykut and Untersteiner (Reference Maykut and Untersteiner1971). In their model, ice thickness evolution was calculated by solving the heat conduction equation vertically. Later this model was extended to include the process of SI formation (Leppäranta, Reference Leppäranta1983; Liston and Hall, Reference Liston and Hall1995; Flato and Brown, Reference Flato and Brown1996; Saloranta, Reference Saloranta2000; Menard and others, Reference Menard, Duguay, Flato and Rouse2002; Cheng and others, Reference Cheng, Vihma and Launiainen2003; Duguay and others, Reference Duguay2003; Shirasawa and others, Reference Shirasawa2005). Duguay and others (Reference Duguay2003) presented the Canadian Lake Ice Model, including SI formation from flooded snow and freeze-up date simulation from heat storage during ice-free summer months by mixed-water layer depth parameterization. Saloranta (Reference Saloranta2000) introduced the process of SI formation by snow compaction and slush formation due to flooding and percolation of rain- and snow meltwater for Baltic Sea ice. This model was further applied to fast ice in the Sea of Okhotsk (Shirasawa and others, Reference Shirasawa2005). Recently, a 1-D high-resolution thermodynamic model was developed for lake ice, which shows good agreement with observations in Finnish lakes (Yang and others, Reference Yang, Leppäranta, Cheng and Li2012). However, even with the newest model, a significant discrepancy between calculated and observed ice thickness still exists with the inclusion of SI thickness. This is mainly because the growth processes of lake ice have not yet been fully understood. It is highlighted that, in order to improve accuracy, observations are important, especially for realistic snow-related processes (Leppäranta, Reference Leppäranta1983, Reference Leppäranta and George2009; Saloranta, Reference Saloranta2000; Menard and others, Reference Menard, Duguay, Flato and Rouse2002; Jeffries and others, Reference Jeffries, Morris and Duguay2005). Since the lake-ice formation processes are analyzed with a thermodynamic model focusing on SI thickness growth, based on observations at Lake Abashiri at mid-latitudes where SI formation are enhanced under snow, it is anticipated that this study will contribute to the understanding of a role of snow on the seasonal variability of total ice thickness, which has been unknown quantitatively so far.
The other constituent of total lake ice, CI thickness growth is affected by the heat flux from lake water to ice as well as the conduction heat flux within the ice. The heat flux from water was reported to be 2–5 W m−2 for Finish lakes at high latitudes (Shirasawa and others, Reference Shirasawa, Leppäranta, Kawamura, Ishikawa and Takatsuka2006; Leppäranta, Reference Leppäranta and George2009). Here, Lake Abashiri has a 2-layered structure: an upper freshwater layer with a temperature of 0–2°C affected by river inflow, and a lower layer of brackish water of ~20 psu originating from sea water with a temperature of 7–8°C, even in winter. Therefore, if vertical mixing occurs in the upper layer, it may affect the heat flux from water and thereby the ice growth rate. The heat flux from water was measured from the observations of the actual CI thickness growth and the conductive heat flux within the ice for the model calculation.
The purpose of this study is to investigate SI formation processes at mid-latitudes and to advance an existing numerical model to improve the predictive capability of ice thickness evolution under snow. The vertical structure of lake ice is analyzed, and the conductive heat flux within ice is estimated from direct measurements. Based on these data, a 1-D vertical thermodynamic model focuses on SI thickness growth, because the treatment of SI is essential to reproduce the evolution of ice thickness. The model output is compared with observational data for SI and CI thicknesses, snow depth on ice and break-up date, and the role of snow in the growth processes of lake ice is further discussed quantitatively.
2. OBSERVATION AND ANALYSIS METHODS
2.1. Observation
Lake Abashiri is located in the northeastern part of Hokkaido, Japan (43.97°N, 144.17°E), at a distance of 4 km from the Sea of Okhotsk, to which it is connected by the Abashiri River (Fig. 2). The water depth is ~16 m at its maximum and 7 m on average, and the lake covers 32.3 km2, with dimensions of ~10 km × 3 km.
Locations of observation sites: (a) location map of Lake Abashiri in the southern Sea of Okhotsk; (b) a local-scale map for the six observation sites on the lake; two Japan Meteorological Agency sites, Abashiri Meteorological Observatory and Memanbetsu Airport; and the photograph site at the top of Tento-san mountain.

Six observation sites were set along the line running from upstream (southwest) to downstream (northeast) on Lake Abashiri, and on-site observations were carried out four times between November 2012 and March 2013: on 15–16 November (before freezing), 17–18 January, 18–19 February and 17–18 March (Fig. 2). At each site, vertical profiles in the lake water of salinity, temperature and density, from 15 cm below the surface to the bottom of the lake, were measured with a conductivity/temperature/depth (CTD) profiler (CastAway-CTD from Son Tek/YSI Inc.), and lake ice, lake water and snow on ice were sampled. The positions of the sites were determined by GPS (GPSMAP62SCJ, GARMIN Ltd). To collect samples of lake water and ice, a water sampler of 1300 mL capacity (Rigo, type 5023-A), and a chainsaw or hand auger, respectively, were utilized.
In addition, to estimate the conductive heat flux within ice, the vertical profile of ice temperature was monitored at site 3 from 17 January to 18 March, using thermorecorders RT-32S from ESPEC MIC Corporation, with a measurement accuracy of 0.1°C. Four thermistor probes were installed at depths of 44, 34, 24 and 14 cm from the ice surface (Fig. 3). The sensor at the greatest depth (44 cm) was set in water while the other sensors were embedded in ice. These data are used to estimate sensible heat flux from the underlying water.
A schematic picture of the installation of four thermistor sensors for measuring ice and water temperatures at site 3.

2.2. Sample analysis
To clarify the ice structures with the thickness of each layer and its origin, thick/thin sections of ice samples were analyzed, and the stable oxygen isotopic compositions (δ18O) were measured for samples of ice, snow and water to distinguish meteoric ice from ice of lake water origin. In addition, the salinity of samples for lake water and ice was measured, as this may affect the ice structure and the freezing temperature, the value of which is used in the model calculation.
All samples obtained were processed and analyzed at the Institute of Low Temperature Science, Hokkaido University. In the cold room (−15°C), the ice samples were split lengthwise into two pieces. One piece was used for thick/thin-section analysis; the other was used partly for measuring salinity and stable oxygen isotopic compositions (δ18O), and the rest was archived.
For thick/thin-section analysis, an ice sample was sectioned at 10 cm intervals, then each section was sliced into 5 mm thick sections to observe inclusions within the ice under scattered light. Each section was further sliced to 1 mm thickness with a microtome, to examine crystallographic alignments through crossed polarizers.
The other ice sample was sectioned at 10 cm intervals. Each ice section and snow sample was melted at room temperature for the measurement of δ18O and salinity. δ18O was measured for lake water and the melted samples of snow and ice with a Wavelength-Scanned Cavity Ring-Down Spectroscopy (WS-CRDS; Kerstel and others, Reference Kerstel, van Trigt, Dam, Reuss and Meijer1999; Gupta and others, Reference Gupta, Noone, Galewsky, Sweeney and Vaughn2009) instrument (Picarro, Inc.). The analytical precision of δ18O was estimated to be 0.05‰ from the standard deviation of triple measurements. Salinity was measured for each sample with a salinometer (Guildline Instruments Ltd, Model 8400B AUTOSAL) and for lake water with CTD. The samples were measured against standard water and calibrated using International Association for Physical Sciences of the Ocean standard sea water. The measurement accuracy of salinity was <0.001 psu.
From these analyses, the ice structure and its origin were clarified, and the relative SI portion of the total ice thickness was revealed at this lake along with the freezing temperature of lake water for the model.
3. OBSERVATIONAL RESULTS
3.1. The lake-ice properties
Ice thickness and snow depth at each observation site are shown in Table 2. Ice structure at each site was commonly composed of whitish (upper) and transparent (lower) layers, as shown in Figure 4. The thicknesses of both layers are also shown in Table 2. The origin of each ice layer was examined by the crystal alignments and δ18O analyses. Firstly, thick/thin-section analysis was carried out to investigate the crystal alignments. The vertical structures of crystal alignments obtained from thin-section analysis are shown in Figure 5. These structures can be categorized into three types. The first type consists of a macro-grain layer overlain by a granular ice layer with a clear boundary (S1 type, according to the classification of Michel and Ramseier, Reference Michel and Ramseier1971), as seen at sites 1–3. The second type consists of a columnar ice layer overlain by a granular ice layer, with a clear boundary between them, as seen at site 4. This type is omitted from the Michel and Ramseier (Reference Michel and Ramseier1971) classification, which does not include columnar ice that extends beneath a granular ice layer without a transition layer. The third type consists of a granular ice layer developing into a columnar ice layer through a transition layer of a few cm (S2 type), as seen at sites 5 and 6. In the transition layer, the orientation of the crystal c-axis changes from random to horizontal with increasing depth. Here, note that macro-grained, columnar ice and transition layers, corresponding to transparent layers, are all classified to CI.
The appearance of the ice blocks collected at site 3 on (a) 17 January 2013 (37 cm thick) and (b) 18 February 2013 (42 cm thick).

Vertical cross sections of crystal alignments at sites 1–6 on 18–19 February. Horizontal dashed lines show the boundaries between SI and CI.

Ice thickness and snow depth at each observation site, and snow depths at meteorological observatories

Observations were carried out at sites 1–3 on 17 January and at sites 4–6 on 18 January, and were also carried out at site 3 on 18 February and at sites 1, 2, 4, 5 and 6 on 19 February. Meteorological data were recorded on 18 January and 18 February.
Next, to investigate the origin of each ice layer, the δ18O values of samples for water, ice and snow were measured. Surface lake water had a δ18O value of −11.9 ± 0.1‰ with little spatial or temporal variability during the ice-cover season. This is probably because river inflow is continuously supplied, and distributed widely near the surface of the lake, even in winter. On the other hand, the δ18O value of snow had large variability, from −11 to −17‰, generally much lower than that of lake water, and with little spatial variability. As for ice, the mean δ18O values for whitish layers and macro-grained transparent layers of the first type (sites 1–3) were −12.0 ± 0.5‰ and −9.5 ± 0.1‰, respectively. The mean δ18O values for whitish layers and columnar-grained transparent layers of the second type (site 4) were −11.4 ± 0.5‰ and −9.6 ± 0.0‰, respectively. Table 3 summarizes the δ18O of whitish and transparent ice layers, snow and lake water for three types categorized by vertical textural profiles in February. Whereas δ18O values for whitish layers had a relatively large variability, those of transparent layers were almost the same, irrespective of ice texture. For example, considering the vertical profile of δ18O including all the layers of snow, lake ice and water body at the central site 3 (Fig. 6), it is found that transparent ice layers (−9.4‰) have higher δ18O values than lake water, by 2.4‰. Considering that equilibrium oxygen-isotope fractionation between ice and water is 2.91‰ and this value decreases with the increase in ice growth rates (Lehmann and Siegenthaler, Reference Lehmann and Siegenthaler1991), the increase in δ18O for transparent ice is attributed to fractionation during lake-water freezing. Therefore, it is concluded that the transparent layer is CI that originated from lake water. On the other hand, the δ18O value of the whitish ice layer is between those for transparent ice and snow, indicating that the whitish layer corresponds to SI. A relatively large variation in the δ18O of the whitish layer (Table 3) is probably caused by large variations in snow δ18O.
Vertical profile of δ18O for snow, ice and lake water at site 3 on 18 February. The vertical axis is the depth referenced to the snow/ice interface. The thin solid line, thick solid line and thick dashed line are the δ18O values of snow, ice and water, respectively. The two horizontal dashed lines are the boundaries between CI and SI or water.

δ18O (‰) of ice, snow and surface water for three ice structure types (February)

In addition, to check that the upper water layer is fresh, the salinity of lake water and ice was measured. Salinity profiles of lake water showed a clear two-layered structure. Whereas the salinity of lake water at depths ≳10 m was ~20 psu, that of the surface water was 0.10 ± 0.03 psu at all sites from January to March. As for CI, the salinity was significantly low (0.02 ± 0.01 psu). Thus, it was found that the salinity of upper lake water and ice are considered to be fresh water and pure ice respectively. The corresponding freezing temperature of the surface water is considered to be essentially 0°C (−0.006°C; Maykut, Reference Maykut and Horner1985).
Thus, based on sample analysis, ice structure at each site was found to be commonly composed of whitish and transparent layers, corresponding to SI and CI, respectively. As shown in Table 2, it is found that although the total ice thickness was almost the same in January (33–40 cm) as in February (42–44 cm) except for site 6, which is close to the Abashiri River outlet, the ratio of the two layers is quite different, depending on the site. Whereas the contribution of SI to total ice thickness is ~30% at site 1, it is >50% at sites 4 and 5 and as high as 73% at site 6. This difference will be discussed in Section 5, using a thermodynamic model as an experimental study on the role of snow and SI in lake-ice thickening.
Overall thicker SI relative to the total ice thickness was observed at Lake Abashiri (29–73%), significantly higher than the 10–40% generally observed on Finnish lakes (Leppäranta, Reference Leppäranta and George2009). Thus SI makes a stronger contribution to lake-ice formation at Lake Abashiri, located at midlatitudes, than on Finnish lakes at high latitudes.
3.2. Estimation of the heat flux from lake water to ice
The thickness growth of CI within lake ice is affected by the heat flux from lake water to ice. Therefore, the heat flux value needs to be estimated to establish a thermo-dynamical model. Here, we estimate heat flux by comparing the growth of CI with the vertical temperature gradient measured within ice. The time series of ice temperature monitored at four depths at site 3 is shown in Figure 7. The internal temperature varied almost proportionally to the distance from the surface. The heat flux transferred from lake water to ice (Q w) is given by the heat balance equation at the bottom of the ice:
 $${Q_{\rm w}} = {k_{\rm i}}\displaystyle{{{\rm d}T} \over {{\rm d}z}}-{\rho _{\rm i}}\;L\;\displaystyle{{{\rm d}h} \over {{\rm d}t}}$$
where k i is the thermal conductivity of ice, ρ i is the ice density, L is the heat of fusion of ice, h is the ice thickness and T is the ice temperature. In this equation, the increase in ice thickness is estimated from the observed value of 5.5 cm (23.0–17.5) for CI thickness at site 3 from 17 January (17.5 cm) to 18 February (23.0 cm). Substituting k i = 2.07 W m−2 (Yen, Reference Yen1981) and ρ i = 910 kg m−3 (Palosuo, Reference Palosuo1965) gives the evolution of ice thickness for Q w = 0, 1, 2, 3, 5, 10 W m−2 shown in Figure 8. By examining the optimal value in this figure, Q w is estimated at 2 W m−2.
Time series of lake water and internal ice temperatures at site 3. Line 1 denotes water temperature at 44 cm depth, while Line 2, 3 and 4 denote internal ice temperatures at depths of 34, 24 and 14 cm from the ice surface, respectively (refer to Fig. 3).

The temporal evolution of the change in CI thickness from 17 January at site 3 for Q w = 0, 1, 2, 3, 5 and 10 W m−2. From observation, the thickness of CI increased from 17.5 to 23 cm by 18 February. Note that Q w = 2 W m−2 gives the best fit with the observations.

The validity of this value was checked using a different method. According to the bulk method, Q w is described as
 $${Q_{\rm w}} = {\rho _{\rm w}}{c_{\rm w}}{C_{\rm H}}(T - {T_0}){U_{\rm w}}\comma$$
where ρ w is the density of lake water, c w is the water specific heat, C H is the heat transfer coefficient, T is the water temperature beneath the ice, T 0 is the temperature at the ice bottom and Uw is the water current velocity (Shirasawa and others, Reference Shirasawa, Leppäranta, Kawamura, Ishikawa and Takatsuka2006). At the center of Lake Abashiri, T = 0.4°C (observational result, ~5 cm beneath the ice), T 0 = 0°C, U w = 0.2–1.7 cm s−1 (Ikenaga and others, Reference Ikenaga, Mukouyama, Oshima, Uchijima and Yamada1999), ρ w = 1000 kg m−3, c w = 4.186 × 10³ J (kg K)−1 and C H = 4 × 10⁻⁴ is taken from the value for nearby Lake Saroma (Shirasawa and others, Reference Shirasawa, Leppäranta, Kawamura, Ishikawa and Takatsuka2006). Equation (2) then gives Q w = 1–11 W m−2, showing that our estimation is not unrealistic. In addition, the Q w value of 2 W m−2 is almost the same as the value of 2–5 W m−2 obtained for freshwater lakes under calm conditions in Finland (Shirasawa and others, Reference Shirasawa, Leppäranta, Kawamura, Ishikawa and Takatsuka2006; Leppäranta, Reference Leppäranta and George2009).
4. THERMODYNAMIC ICE GROWTH MODEL
4.1. Model concept
To understand ice growth processes at Lake Abashiri, a 1-D thermodynamic model was developed to calculate ice thickness evolution in the center of the lake (site 3). In the model, the estimated value of the heat flux from water and the meteorological data at the nearby observatories are used, along with the observational results for the density of snow and ice. Then, the snow compression rate during the transformation from snow to SI is parameterized to fit the model outputs to the observational results for SI thickness.
In the model, lake ice is assumed, based on observations, to be a horizontal uniform slab, composed of SI and CI with a snow cover. To calculate the growth of CI, we followed the method of Maykut (Reference Maykut1982), which is designed for relatively young Arctic sea ice, using the meteorological dataset obtained at nearby meteorological observatories. To calculate SI growth, it is ideal from the physical viewpoint to solve the heat conduction equation, as Saloranta (Reference Saloranta2000) did for ice growth in the Baltic Sea. Saloranta (Reference Saloranta2000) included the SI formation process in the model by applying the heat conduction equation to CI, SI and snow, and the heat budget equation to the slush refreezing as well as to the CI growth, assuming values for the density of the slush layer. Although overall model results showed good consistency with observations, a significant difference was found, depending on the year, which was caused by ambiguity in the SI formation process. Given that there is still uncertainty in the freezing process of the slush layer, including the slush formation speed, slush density and water fraction in the slush, here the following three assumptions, following Leppäranta and Kosloff (Reference Leppäranta and Kosloff2000), are introduced.
-
(1) The slush layer freezes to form SI on timescales of a few days and then the freeboard recovers from negative to zero.
-
(2) Snow is compressed in the transformation into SI by a compression rate β, which is defined as the flooded snow layer thickness divided by the produced SI thickness.
-
(3) β is kept constant throughout the season.
In our model, β is a tuning parameter and is determined by fitting the model result to the observed SI thickness. Assumption (3) seems valid, considering the snow depth does not change greatly during an ice season. In addition, since, in the model, snow depth is given not by the in situ data but by the data obtained at the nearby meteorological observatories, the parameter β may include the effect of snow loss due to blowing snow and snow compaction (Sturm and Liston, Reference Sturm and Liston2003; Jeffries and others, Reference Jeffries, Morris and Duguay2005). The justification for a constant value of β is tested by examining the sensitivity of model outputs to β. Further details of the input data and the calculation method are described in the following subsections.
4.2. Input data
For the model input parameters, we used the meteorological datasets observed at the Abashiri Meteorological Observatory and Memanbetsu Airport, which are located about 10 km northeast and 9 km south, respectively, from the central site of Lake Abashiri. Among the observation sites, site 1 is closer to Memanbetsu Airport and site 6 to Abashiri Meteorological Observatory. The central site 3 is approximately midway between these observatories (Fig. 2). While the datasets of T a (air temperature), V a (wind velocity) and H s (snow depth on land) are available at both stations on a daily basis, Q s (incoming solar radiation at the surface), C (cloudiness in tenths), r (relative humidity), and p (surface air pressure) were observed only at the Abashiri Meteorological Observatory. Therefore, to calculate ice thickness growth at site 3, T a, H s and V a were inputted by taking the averages of two meteorological stations, and Q s, C, r and p were given by the data observed at the Abashiri observatory. For H s, the running means for 5 d were used to consider a timescale of a few days of SI formation, based on the assumptions. The sensitivity of the period of the running mean to the result will be discussed at the end of Subsection 4.4. The other input parameters and constants in this model are listed in Table 4.
Model parameters and constants

We denote the thickness by h, density by ρ and thermal conductivity by k using subscripts i, si, ci and s for ice, SI, CI and snow, respectively. γ (Eqn (3)) represents the critical ratio of snow depth to ice thickness that causes flooding of water due to isostasy, and was set to 0.37 from observational results of ρ w = 1000 kg m−3, ρ i (the average of ρ ci and ρ si) = 890 kg m−3, ρ ci = 910 kg m−3, ρ si = 870 kg m−3 and ρ s = 300 kg m−3:
 $$\gamma = \displaystyle{{{\rho _{\rm w}} - {\rho _{\rm i}}} \over {{\rho _{\rm s}}}}$$
4.3. Calculation method
4.3.1. Determination of the freeze-up date and the initial ice thickness
An important factor in calculating this model is the determination of the initial freeze-up date. Since there are no recorded data on this, we determined the freeze-up date from the surface heat budget and Moderate Resolution Imaging Spectroradiometer (MODIS) satellite images. In early winter, the lake surface water is cooled along with vertical convection with the loss of net heat flux to the air. Once the surface temperature reaches 4°C, however, the convection ceases and water surface temperature rapidly decreases to the freezing point. When the heat loss continues further, freezing starts at the water surface. Therefore, a spell of heat loss from the surface at low air temperature can be considered as a good indicator for determining the freeze-up date. The heat budget (Q x) at the surface was calculated by setting surface temperature (T sfc) to the freezing point (0°C):
 $$\eqalign{{Q_{\rm x}} & = ({\rm 1} - \alpha )({\rm 1} - {I_0}){Q_{\rm s}} + {Q_{\rm d}} - {Q_{\rm b}}({T_{{\rm sfc}}}){\rm} + {Q_{\rm h}}({T_{{\rm sfc}}}) \cr & + {Q_{{\rm le}}}({T_{{\rm sfc}}})}$$
 $$\eqalign{{Q_{\rm d}} & = 0.{\rm 7855}\;({\rm 1} + 0.{\rm 2232}\;{{\rm C}^{{\rm 2}.{\rm 75}}})\;{\sigma _{\rm s}}T_{\rm a}^4 \cr & \quad \hbox{(Maykut and Church, 1973)}}$$
 $${Q_{\rm b}} = \varepsilon {\sigma _{\rm s}}T_{{\rm sfc}}^4 $$
 $${Q_{\rm h}} = {\rho _{\rm a}}{C_{\rm a}}{C_{\rm H}}({T_{\rm a}} - {T_{{\rm sfc}}})\;{V_{\rm a}}$$
 $${Q_{{\rm le}}} = \displaystyle{{0.{\rm 622}{\rho _{\rm a}}{L_{\rm V}}\;{C_{\rm E}}\;{V_{\rm a}}\;(r{e_{{\rm sa}}} - {e_{{\rm sssfc}}})} \over p}$$
 $${e_{{\rm sa}}} = {\rm a}T_{\rm a}^4 + {\rm b}T_{\rm a}^3 + {\rm c}T_{\rm a}^2 + {\rm d}{T_{\rm a}} + {\rm e}$$
 $${e_{{\rm ssfc}}} = {\rm a}T_{{\rm sfc}}^4 + {\rm b}T_{{\rm sfc}}^3 + {\rm c}T_{{\rm sfc}}^2 + {\rm d}{T_{{\rm sfc}}} + {\rm e}$$
 $$\eqalign{& a = {\rm 2}.{\rm 77982}0{\rm 2} \times {\rm 1}{0^{ - {\rm 6}}},\quad b = - {\rm 2}.{\rm 6913393} \times {\rm 1}{0^{ - {\rm 3}}}, \cr & c = 0.{\rm 9792}0{\rm 849},\quad d = - {\rm 158}.{\rm 63779},\quad e = {\rm 9653}.{\rm 1925}, \cr & \quad \; \left( {{\rm Maykut},{\rm} 1978} \right)} $$
where α is the surface albedo, I 0 is the portion of solar radiation penetrating below the surface layer, Q s is the incoming solar radiation at the surface, Q d is the incoming longwave radiation, Q b is the outgoing longwave radiation, Q h is the sensible heat flux, Q le is the latent heat flux, e sa is the saturation vapor pressure in the atmosphere, e sssfc is the saturation vapor pressure at the surface, ε is the surface emissivity, ρ a is the air density, C a is the air specific heat, C H is the transfer coefficient for sensible heat, L V is the latent heat of sublimation and C E is the transfer coefficient for the latent heat. Here we set the freezing point as 0°C due to the salinity of the surface water (~0.1 psu).
According to the MODIS optical image (Fig. 9a) and the photographs taken from the top of Tento-san mountain (Elevation 200 m), located near Lake Abashiri (Fig. 2), no sign of freezing was detected on the lake on 7 December, although air temperatures fell below 0°C at both Abashiri and Memanbetsu. On the other hand, according to the MODIS image (Fig. 9b) on 13 December, a large part of the lake was covered with snow, indicating that on that day freeze up had already begun in widespread areas including site 3. Thus it is assumed that the freeze-up date was between 8 and 12 December.
MODIS Images (Terra/Aqua, copyrights: NASA) (a) 7 December 2012 and (b) 13 December 2012. The dashed circles show the location of Lake Abashiri.

The surface heat budget (Q x) during this period was calculated based on these data. The result shows that while Q x was positive (+33 W m−2) on 10 December, it was negative (−32 W m−2) on 11 December, and the air temperature stayed negative until 1 February. Therefore, the freeze-up date was assumed to be 11 December.
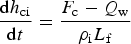
The initial ice growth amount (Δh ci) was estimated from the heat balance equation at the bottom of the ice:
 $$\displaystyle{{{\rm d}{h_{{\rm ci}}}} \over {{\rm d}t}} = \displaystyle{{ - {Q_{\rm x}} - {Q_{\rm w}}} \over {{\rho _{\rm i}}{L_{\rm f}}}},$$
where L f is the latent heat of freezing. At the initial stage, both SI thickness (h si) and snow depth (h s) were set to 0 cm.
4.3.2. CI growth and surface melting
The surface heat budget Q 0 is given by the following equations, assuming the upward conductive heat flux is conserved through the CI, SI and snow layers:
 $$\eqalign{ {Q_0} &= ({\rm 1} - \alpha )({\rm 1} - {I_0}){Q_{\rm s}} + {Q_{\rm d}} - {Q_{\rm b}}({T_{{\rm sfc}}}){\rm} + {Q_{\rm h}}({T_{{\rm sfc}}}) \cr & \quad {\rm} + {Q_{{\rm le}}}({T_{{\rm sfc}}}) + {F_{\rm c}}({T_{{\rm sfc}}}),} $$
 $$Fc = \displaystyle{{T_B - Tsfc} \over {hs/ks + hsi/ksi + hci/kci}}$$
where F c is the conductive heat flux within ice, and T B is the temperature of the ice bottom and is set to the freezing point. From Eqn (6), T sfc is calculated at a daily step by setting Q 0 = 0, assuming that all the heat fluxes are balanced at the surface on a daily timescale.
-
(1) When T sfc < 0°C, CI grows at the bottom.The bottom accretion rate is given by
(8)by substituting the calculated T sfc into Eqn (7) and Q w (=2 W m−2) into Eqn (8). $$\displaystyle{{{\rm d}{h_{{\rm ci}}}} \over {{\rm d}t}} = \displaystyle{{{F_{\rm c}} - {Q_{\rm w}}} \over {{\rho _{\rm i}}{L_{\rm f}}}}$$
-
(2) When T sfc ≥ 0°C, melting occurs at the surface.
The snowmelt rate at the surface is calculated by substituting T sfc = 0°C into Eqn (6):
 $$\displaystyle{{{\rm d}{h_{\rm s}}} \over {{\rm d}t}} = \displaystyle{{ - {Q_0}(0^\circ {\rm C})} \over {{\rho _{\rm s}}{L_{\rm f}}}}$$
After the snow had fully melted, the melting rate of SI and CI at the surface was calculated.
4.3.3. SI growth
As shown in Section 3, SI constitutes a significant part of the total ice thickness at Lake Abashiri, and therefore the treatment of SI formation is essential to reproduce the evolution of ice thickness in the model. SI is formed through refreezing of the slush layer, which is produced by the percolation of flooded lake water, rain or melting snow. Since the air temperature stayed below 0°C at Abashiri throughout most of the winter, we assume the major process producing the slush layer is the flooding of the lake water in this model. For flooding to occur, the freeboard should become negative, i.e. the following inequality should be satisfied:
 $$\displaystyle{{{h_{\rm s}}} \over {{h_{{\rm ci}}} + {h_{{\rm si}}}}} \gt \displaystyle{{{\rho _{\rm w}} - {\rho _{\rm i}}} \over {{\rho _{\rm s}}}} \equiv \gamma. $$
On assumption (1) in Section 4.1, the following isostatic balance equations should hold before (Eqn (10)) and after (Eqn (11)) the daily SI and CI growth:
 $${\rho _{\rm i}}({h_{{\rm ci}}} + {h_{{\rm si}}}) + {\rho _{\rm s}}{h_{\rm s}} = {\rho _{\rm w}}({h_{{\rm ci}}} + {h_{{\rm si}}})$$
 $$\eqalign{& {\rho _{\rm i}}({h_{{\rm ci}}} + {h_{{\rm si}}} + \Delta {h_{{\rm ci}}} + \Delta {h_{{\rm si}}}) + {\rho _{\rm s}}({h_{\rm s}} + \Delta {h_{\rm s}}) \cr & \quad = {\rho _{\rm w}}({h_{{\rm ci}}} + {h_{{\rm si}}} + {\rm} \Delta {h_{{\rm ci}}} + \Delta {h_{{\rm si}}})}$$
where Δh ci, Δh si and Δh s denote the increase in the thicknesses of CI, SI and snow, respectively, on a daily basis. On the other hand, the relation between Δh si and Δh s is expressed by Eqn (12) from assumption (2), (3) in Section 4.1:
 $$\beta = \displaystyle{{\Delta {H_{\rm s}} - {\rm} \Delta {h_{\rm s}}} \over {\Delta {h_{{\rm si}}}}}$$
where ΔH s denotes the increase in the snow depth at meteorological observatories on a daily basis. By solving Eqns (10)–(12), Δh si and Δh s can be expressed by Eqns (13) and (14), respectively:
 $$\Delta{h_{\rm si}} = \displaystyle{1 \over {(\beta + \gamma )}}\Delta {H_{\rm s}} - \displaystyle{\gamma \over {(\beta + \gamma )}}\Delta {h_{\rm ci}}$$
 $$\Delta {h_{\rm s}} = \displaystyle{\gamma \over {(\beta + \gamma )}}\Delta {H_{\rm s}} + \displaystyle{{\beta \;\gamma} \over {(\beta + \gamma )}}\Delta {h_{\rm ci}}.$$
Since Δh ci is calculated by Eqn (8) and ΔH s is given by the data at the meteorological observatories, Δh si and Δh s can be obtained from these equations as a function of β. By integrating these values, SI thickness and snow depth can be estimated.
4.4. Model results
In this model, determination of a tuning parameter β is essential to reproduce the ice thickness evolution. Therefore, the optimal value of β was first sought. While h si and h s decrease with the increase in β, h ci increases due to reduction of the insulating effect of snow. Judging from the fit of the calculated h si to the observational data, β was determined as 2.0, larger than the β value in Finland of ~1.5 (Leppäranta and Kosloff, Reference Leppäranta and Kosloff2000). This may be due to an overestimation of ΔH s. Although ΔH s was calculated from the data obtained at nearby meteorological observatories, in reality it might be reduced on the lake due to snowdrift induced by strong wind. If this is the case, the larger value for β than that used by Leppäranta and Kosloff (Reference Leppäranta and Kosloff2000) appears to be reasonable.
The time series of h i (total ice thickness), h ci, h si and h s calculated at site 3 are shown in Figure 10a and Table 5. Model outputs (observational results) are 17 (17.5) cm and 22 (23) cm for h ci, 16 (19.5) cm and 23 (19) cm for h si, and 15 (18) cm and 17 (26) cm for h s on 17 January and 18 February, respectively. Thus h ci and h si showed good agreement with the observations, with an RMSE of 0.8 and 3.8 cm, respectively, although h s was predicted to be 3–9 cm thinner than the observations, with an RMSE of 7.6 cm. The model predicted 11 April as the break-up date, which almost coincides with the dates between 12 and 14 April speculated from MODIS images and photographs. The slightly earlier model prediction compared with MODIS imagery may be attributed to the fact that the increase in ice thickness due to the refreezing of melted snow was not taken into account, since the refreezing of melted snow might have occurred in late winter or spring.
Model outcomes of the thickness evolution of total ice, SI and snow, with observations shown by triangles (snow depth), squares (SI) and solid circles (total ice thickness) for (a) site 3 and (b) site 6. The thick solid curve indicates the snow depth on land obtained from the daily meteorological snow depth data by taking a 5 d running mean (the day and 4 d ahead). The thin solid curve, dashed curve and dashed-dotted curve show the snow depth on the lake, SI thickness and total ice thickness predicted by the model, respectively. Q w = 2 W m−2, β = 2.0 and γ = 0.37 were used for calculation.

Comparison between model outputs and observational results

Here, an error analysis of model simulations compared with field observations was done for the variability in β (Table 6). For a β value of 1.8, h ci, h si and h s had an RMSE of 1.5, 4.1 and 6.7 cm compared with observations. For β of 2.2, h ci, h is and h s had an RMSE of 0.5, 3.8 and 7.2 cm. Thus the variability in β leads to no significant difference in the estimated ice thickness from the result obtained with an optimal value of 2.0. The break-up date was 13 April for β = 1.8 and 11 April for β = 2.2, almost the same as the model result (11 April) and the real break-up date (13 April). Therefore, the sensitivity of model outputs to β is considered to be small. This supports the optimal constant value (2.0) of β.
Errors of simulation outputs to observation

Difference of break-up date was calculated from 13 April, the middle date of the range speculated from MODIS images.
As shown in Section 3, the ice at site 6 was thinner than at the other sites. To find out why, we examined the effect of different meteorological conditions at site 6 on the ice thickness evolution, using the meteorological data at Abashiri Observatory instead of the average of Abashiri and Memanbetsu datasets. As a result, it was found that if Q w of 2 W m−2 was used for site 6 as for site 3, the calculated h ci showed a significantly larger value than observations (Fig. 10b). This may be because site 6 is situated near the lake output connecting to the sea via a river, which may induce the vertical mixing of lake water and more heat flux transferred from water to ice. If a higher value of Q w (6 W m−2) was used for site 6, the model output (h ci = 9.0 cm) showed much better agreement with observations (8.5 cm) on 18 January.
Finally the sensitivity to the running mean period used for the input parameter of H s is discussed. In this model, H s was obtained from the daily meteorological snow depth data by taking a 5 d running mean (the day and 4 d ahead) to take into account the timescale required for the formation of SI, including the water filtration into snow layer and freezing of slush layer (Saloranta, Reference Saloranta2000). However, since the timescale is expected to depend much on the situation, the validity should be checked. For this purpose, we examined how the outputs change for the periods of 3 and 7 d. As a result, it was confirmed that the calculated total thickness differed by ≤2 cm and the break-up dates were the same as those calculated with a 5 d running mean. These results indicate that running means for 5 d are valid and stable for this practical model simulation.
5. DISCUSSION
Our observations revealed that SI makes a strong contribution to lake-ice formation at Lake Abashiri. Here, the role of snow and SI in lake-ice thickening is discussed, using the model. It is well known that snow has two conflicting properties: while it reduces the growth of CI thickness due to its low thermal conductivity, it can also enhance the growth of ice thickness through SI formation (Leppäranta, Reference Leppäranta1983, Reference Leppäranta and George2009; Vavrus and others, Reference Vavrus, Wynne and Foley1996; Menard and others, Reference Menard, Duguay, Pivot, Flato and Rouse2003; Sturm and Liston, Reference Sturm and Liston2003; Morris and others, Reference Morris, Jeffries and Duguay2005). However, to our knowledge, the relative importance of these effects does not appear to be fully understood. Our observations revealed that snow played a significant role in the ice thickening process through the formation of SI, with its contribution to the total ice thickness ranging from 29 to 73%, depending on the site. Snow depth and SI thickness were significantly different between the upstream (No. 1) and downstream (No. 6) sites, corresponding to the difference in meteorological conditions between Memanbetsu and Abashiri. To observe these characteristics more clearly, the temporal evolution at sites 1, 3 and 6 is shown in Figure 11. SI thicknesses on 18–19 February were 12.5 and 19 cm at sites 1 and 3, respectively, in contrast to 24 cm at site 6. On the other hand, the total ice thickness was greater at site 1 (43 cm) and site 3 (42 cm) than at site 6 (33 cm). Accordingly, the ratio of SI to total lake-ice thickness on 18–19 February was 29% at site 1 and 45% at site 3, but it increased to 73% at site 6. This indicates that the role of snow and SI in the growth process contrasts between these sites. As for meteorological conditions at these sites, the time series of daily mean air temperature and snow depth at meteorological observatories at Abashiri and Memanbetsu are shown in Figure 12. It is seen that air temperature ranged mostly between −15°C and 0°C, with maximum snow depth being ~60 cm during the observation period, and that the overall air temperature was higher and snow depth was greater at Abashiri than at inland Memanbetsu.
The observed thicknesses of SI and CI at sites 1, 3 and 6 on 17–18 January and 18–19 February.

Time series of daily mean air temperature and snow depth at Abashiri Meteorological Observatory and Memanbetsu Airport from December 2012 to April 2013.

A possible mechanism for this contrast of the ratio of SI to total lake-ice thickness between these sites is as follows: The growth amount of CI is less in a warmer condition, leading to a greater amount of SI and accordingly greater reduction in snow depth on ice when snow accumulates on ice enough to lower the snow/ice boundary below the water level. Furthermore, the reduction in snow depth on ice enhances the growth of CI. A schematic picture of this concept is presented in Figure 13. Thus, SI formation is considered to work to moderate the difference in ice thickness caused by warmer conditions.
A schematic picture showing the effect of snow and SI formation on the lake-ice thickness. Note that despite the difference in air temperature, the resulting ice thickness is similar due to the formation of SI.

Here, based on the above hypothesis, the role of snow in the ice-thickening process is examined quantitatively by comparing the ice thicknesses predicted for each site with our practical model. The growth amount of lake ice was calculated at sites 1, 3 and 6 for three cases: (1) snow accumulation with SI formation, (2) snow accumulation without SI formation (i.e. CI only) and (3) no snow accumulation. As in Section 4, the air temperature, snow depth and wind at sites 1 and 6 were given by data from the meteorological observatories at Memanbetsu and Abashiri, respectively, and the averaged data were used for site 3. Overall, air temperature was 2–3°C higher at site 6 than at site 1 during the winter (Table 7). The same values of β, γ and Q w were used at all sites (β = 2, γ = 0.37, Q w = 2 W m−2) to focus on the effects of snow and SI in different meteorological conditions, although a larger value of Q w would provide a better fit to the observational data at site 6, as described in Section 4.3.
Monthly mean air temperature T a (°C) at Abashiri and Memanbetsu during the winter season 2012/13

The calculated maximum ice thickness for each case at sites 1, 3 and 6 are shown in Figure 14. The variation of maximum lake-ice thickness from site to site is much reduced, and this is associated with SI formation. Whereas without snow (case 3) the difference in maximum ice thickness between sites 1 and 6 is 11 (81–70) cm, it is reduced by half (53–48 = 5 cm) due to greater SI formation at site 6 (28 cm) than at site 1 (22 cm) in case 1. Given that the snow insulation effect (case 2) reduces the difference, SI formation is considered to play a role in moderating the variation in maximum lake-ice thickness caused by different meteorological conditions.
Maximum ice thicknesses predicted by the model for sites 1, 3 and 6 under different meteorological conditions for three cases: (1) snow accumulates with SI formation (control run); (2) snow accumulates without SI formation; (3) no snow accumulates. For calculation at sites 1, 6 and 3, the meteorological data were inputted from Memanbetsu Airport, Abashiri Meteorological Observatory and the average between them, respectively. Q w = 2 W m−2, β = 2.0 and γ = 0.37 were used.

The observational results also support this idea. In spite of the different meteorological conditions, total ice thickness at site 3 is approximately equal to that at site 1, by compensating for thinner CI with greater SI formation (Fig. 11; Table 2). The significantly thinner ice observed at site 6 compared with other sites can possibly be attributed to the higher Q w, as discussed in Section 4.4.
Finally this result is extended to the comparison of lake-ice properties between mid-latitude and high latitude. In addition to moderate air temperature, another characteristic of the lakes at mid-latitude is that CI growth is limited by abundant solar radiation in the day time even in winter, as discussed for sea ice by Toyota and Wakatsuchi (Reference Toyota and Wakatsuchi2001). Therefore, CI tends to be thinner at mid-latitudes and for almost the same amount of snowfall the role of SI formation becomes more important compared with lakes at high latitudes.
6. CONCLUSIONS
To clarify the growth processes of lake ice at mid-latitudes with considerable snow fall rates and abundant solar radiation, even in winter, observations at Lake Abashiri were conducted throughout the winter of 2012/13, and a 1-D thermodynamic model was developed based on the observational results. Along with the observations, ice samples were collected at six sites in the lake every month from January to March 2013. The samples were analyzed to show the vertical profiles of crystal alignments, salinity and δ18O. The δ18O analysis was useful for distinguishing meteoric ice from ice of lake water origin because of significant δ18O differences between snow and lake water. As a result, it was shown that:
-
(1) Lake ice composed of two distinct layers: whitish SI, which formed through freezing of flooded snow by lake water, and transparent CI, which formed from ice bottom freezing of lake water.
-
(2) SI occupied as much as 29–73% of the total ice thickness. This is much larger than the value reported for lake ice at high latitudes (10–40% in Finland).
Based on these observational results, a 1-D thermodynamic model was developed, including both growth processes of CI and SI. The growth rate of CI was estimated by the traditional surface heat budget method (Maykut, Reference Maykut1982). The heat flux (Q w) from lake water to ice was estimated at 2 W m−2 from direct measurement of the temperature gradient within the CI layer and the thickness evolution of the CI layer at site 3. On the other hand, the growth rate of SI was calculated based on the assumption that excessive snowfall, leading to a negative freeboard, is converted to SI by a compression rate β after the flooded lake water percolates into the snow layer, following Leppäranta and Kosloff (Reference Leppäranta and Kosloff2000). Here a tuning parameter β was set to 2 as an optimal value. In the model, the inputted meteorological data were air temperature, wind speed, solar radiation, humidity, cloudiness, air pressure and snow depth at the Abashiri Meteorological Observatory and Memanbetsu Airport. The freeze-up date was determined from MODIS imagery, photographs of ice conditions, a spell of low air temperature and negative heat budget at the surface. As a result, it was shown that the model outcome reproduced the observed thicknesses of CI and SI and the break-up date with good accuracy, though the snow depth deviated somewhat from observations.
With this practical model, the effect of snow on the total lake-ice thickness was also examined by applying it to sites 1, 3 and 6 under different meteorological conditions for three cases: (1) snow accumulates with SI formation (control run); (2) snow accumulates without SI formation; and (3) no snow accumulates. Overall, air temperature was 2–3°C higher at site 6 than at site 1 during the winter. It was found that the calculated ice thicknesses for case 1 showed reasonable agreement with observations, whereas without snow (case 3) maximum ice thicknesses for sites 1, 3 and 6 were 81, 76 and 70 cm, respectively, the difference was reduced to half in case 1 due to the greater amount of SI formation at site 6 than at site 1. Thus SI formation is considered to play a role in mitigating the variation in maximum lake-ice thickness caused by different meteorological conditions in this lake.
Although previous studies have shown that snow significantly affects lake-ice thickening processes at high latitudes, this study shows that at mid-latitudes snow has a more important role through SI formation and works to mitigate the difference in CI thickness caused by meteorological conditions. Our practical model succeeded in reproducing the real ice thickness evolution both for CI and SI to some extent. However, it should be kept in mind that the present model includes several assumptions, especially for the SI formation process. To improve understanding of this process, further observation, especially on the freezing process of the slush layer, will be required in the future.
ACKNOWLEDGEMENTS
This study was carried out through a bilateral cooperative agreement between the Institute of Low Temperature Science (ILTS), Hokkaido University, and Abashiri City, and was financially supported partly by a Grant for Joint Research Program of ILTS. We sincerely thank Toshifumi Kawajiri of Nishi-Abashiri Fishermen's Cooperative Association for enormous support throughout the field observations, and the Fisheries Science Center of Abashiri City for kind logistic support. We are very grateful to Sumito Matoba of ILTS for kind arrangements regarding the measurement of δ18O and suggestions for our analysis, and to Kunio Shirasawa for valuable comments and for introducing us to the relevant literature. We also thank Matti Leppäranta, University of Helsinki for useful and inspiring comments. Comments from Chief Editor Jo Jacka, Scientific Editor Cathleen Geiger and anonymous reviewers helped us greatly to improve the manuscript. We also appreciate the help of Takanobu Sawagaki of Hosei University with field observations and Jun Nishioka, Kazuya Ono, Akane Tsushima and. Aiko Murayama of ILTS, who supported the laboratory analysis. We thank Alexander Fraser of ILTS for providing MODIS images of Lake Abashiri and improving the English of our paper. We thank Eisho Kudo of the Okhotsk Ryu-hyo (drift ice) Museum for providing pictures of ice conditions at Lake Abashiri. We are grateful to Kazuhiro Sakayi of the Hokkaido Regional Development Bureau for offering hydrological data for Lake Abashiri and Abashiri River. Students of Hokkaido University who participated in the field observations are thanked for their assistance.


 Open access