

1. Introduction
Dirt cones are mounds of ice- or snow-cored sediment on the surface of some glaciers. They are also known in French as “cônes graveleux des glaciers” (Reference AgassizAgassiz, 1840); “cônes de poussières” (Reference BoutBout, 1956); “cônes de gravier” and “cônes couverts” (Reference LliboutryLliboutry, 1964–65, Tom. 1, p. 377–78); in German as “Schmelzkegeln”, “Sandkegeln” and “Termitenhügeln”; and as “debris-covered ice cones” (Reference SharpSharp, 1949). They range in size from a few centimetres to tens of metres in height (Fig. 1). The basic mode of origin of dirt cones has been understood for many years (Reference SpethmannSpethmann and Bruckner, 1908; Reference LewisLewis, 1940; Reference SwithinbankSwithinbank, 1950; Reference ListerLister, 1953; Reference WilsonWilson, 1953; Reference Streiff-BeckerStreiff-Becker, 1954). Debris resting on a glacier surface protects the underlying ice, differentially, from ablation so that with the more rapid lowering of the surrounding ice surface a mound is produced (Fig. 1).


Despite the common occurrence of cones, particularly on temperate glaciers, and despite the large number of published observations, few quantitative studies have been undertaken. The objects of this study are to present measurements taken on natural ice-cored dirt cones on the glacier Bersaerkerbræ in north-east Greenland (Fig. 2) and from experiments with artificial ice-cored cones. These quantitative observations are used in generating a working model of the thermal and mechanical processes in cone development. The effects of sediment grain-size, debris thickness, cone geometry and heat-flow characteristics in the debris layer are discussed.

The location of dirt cones on Bersaerkerbræ is shown in Figure 2. They are concentrated in the ablation zone at the glacier margins. The debris cover of the cones is derived from a laternal moraine system: fines washed from the moraine are concentrated by surface melt-streams. Dirt cones occur in diverted, dry stream channels where there are thickenings of sediment corresponding to ancient pools and bars (Reference Dibner and ZagorskayaDibner and Zagorskaya, 1958). None of the cones examined appeared to originate from any other mechanism (e.g. upthrusting of debris along shear planes (Reference LewisLewis, 1940) or deflation of dust and volcanic ash onto the ice surface (Reference KrenekKrenek, 1958)).
2. Field measurements—natural dirt cones
Twenty cones were examined in detail. For each cone, maximum dimensions in three orthogonal directions were recorded (coordinate system shown in Figure 3). The slope of the debris was measured, by clinometer, along lines across the cone (Fig. 3). Three random lines were normally selected and between three and six angular measurements taken along each line at regularly spaced intervals up the cone slopes. The debris was subsequently scraped away and ice angles measured at locations corresponding to those at the surface (Figs. 1a, 3). The thickness of the cover, normal to the slope, was recorded at slope measurement positions. Samples were taken for particle-size analysis. The measurements for a sample of ten cones are summarized in Table I.


Cone geometry
The relationship of the maximum and minimum horizontal dimensions of the base (x and y dimensions) indicates that these natural cones are elliptical in plan, approximating x = 1.7y, with elongation clearly attributed in the field to deposition in former stream channels. Average values for the ratio of the maximum to the minimum surface slopes tan α/tan β = (2z/y)/(2z/x) approximate 0.67. Such side-slope asymmetry is partly a function of depositional ellipticity but also due to maximum slope development occurring on those flanks receiving maximum insolation.
Slope angles were recorded on the debris cover (θ d) and at the ice-core/debris interface (θ i) and all measurements were plotted, for comparison, against their relative position, d, on a cone of unit size defined as

where D′ is the height up-slope to a point of angle measurement and D is the height up-slope to the crest (cone slant-length).
There appears to be a broad trend for debris angles to exceed ice angles in the central and upper parts of cones, whilst ice angles are greater in the lower part, especially the basal region (Fig. 4). Care must be taken, however, in interpreting Figure 4 and the values of θ d and θ i in Table I, since slope relationships will vary during the growth of dirt cones. In general terms, early stages of development will be characterized by θ d > θ i, later stages by θ d < θ i, see section 6. The natural dirt cones investigated were of unknown age but were probably in the later stages of the first phase.

Sediment characteristics
The dominant constituent of the moraine-derived sediment is a reddish-brown, iron-stained quartz sand originating from the Late Precambrian quartzites which crop out along the eastern margin of the glacier (Reference FränklFränkl, 1953).
Debris thickness on cone flanks usually varied from 0.5 mm to 20 mm, and was rarely greater than 40 mm (Table I). The predominant particle size in all the cones was between 0.6 mm and 5 mm (coarse sand grade). Most deposits, however, were not well sorted (Fig. 5). The best developed cones were found in fairly well-sorted medium to coarse sand. Although finer-grained sediments were readily available at the glacier surface (e.g. silts and clays from <0.002 mm to 0.06 mm) no cones were developed in these materials nor in the equally abundant coarse gravels and cobbles (10 mm to 200 mm).

3. Experimental dirt cones
The measurements on natural dirt cones suggested that the effect of grain size, debris thickness and plot geometry on cone growth and thermal regime should be further investigated and a series of seven experiments with artificially induced dirt cones was undertaken. Other experiments, to evaluate the effect of debris on the melting behaviour of glacier ice, snow and lake ice, have been carried out by Reference ListerLister (1953), Reference ØstremØstrem (1959, Reference Østrem1965), Reference WijngaardenWijngaarden (1961), Reference MarkinMarkin (in press), and Reference Megahan, Megahan, Meiman and GoodellMegahan and others (1970).
Sediment was deposited on “clean” glacier ice in three rectangular groups (approx. 1.0 m by 0.65 m, 0.50 m by 0.50 m, and 0.30 m by 0.25 m) and in a variety of thicknesses from 10 mm to 125 mm (Fig. 6). Sediment textures varied as indicated in Table II After 14 d, sediment at some of the sites had been left upstanding relative to the ice surface. The situation at the end of the experimental period is summarized in Table III and Figure 6.

Note: h′d = [h d−T s] and h′i = [h d−T f]. These are the height increases of the debris cover and ice core respectively. h d is the final height of the debris crest above the surrounding clean” ice. G a is the total ablation over “clean” ice for the period t.

Experimental dirt cones: Output data

Growth rates
A simple growth factor F has been calculated to indicate the change in the mean elevation, with time, of the ice F i and debris F d crests with respect to ablation over a “clean” ice surface:
where h′ is the height increase of the ice or debris (see Table III) and G a is the total ablation over “clean” ice during the period of cone growth. When F i or F d is equal to 1, the ice or debris growth rate is equal to the ablation rate; with F i or F d equal to 0, there is no growth.
The values of h′, h′d, G a, F i and F d are given with other data in Table III. A number of significant relationships are indicated: (a) growth of experimental cones proceeds at rates of up to about 50% that of ablation over “clean” ice (F < 0.5); (b) cone height and basal cross-sectional area are related in the same manner as for natural dirt cones (see Table I); (c) the fact that F i is invariably greater than F d indicates that debris thins, with time, at the crest. This progressive thinning shows in height differences in Figure 7, and is primarily a response to mass down-slope transfer, spreading sediment over an increasing cone area following continued ablation and slope change. Such a process would account for the debris and ice-slope relations in Figure 4.

Particle size
Cones grew at sites 1, 3, 5 and 6 where there were unimodal deposits greater than 0.6 mm mean grain size. Site 2, a fine, well-sorted sand, produced no cone, the sediment flowing away over the ice surface. A further experiment (site 7) confirmed that this was not a function of plot shape or thickness. The clearest case of saturated flow occurred at site 4 in a medium-grained silt (Fig. 6). The whole sediment mass became mobilized with melt water and moved a distance of 6 m in 14 d. Coarse sediments (pebbles and cobbles), in thicknesses not greater than approximately twice their mean long-axes, did not produce cones.
Figure 8 summarizes the experimental results. The mean particle size of artificial dirt cones is shown against the growth factor F. From these data and field observations it appears that a threshold value of sediment size can be postulated for dirt cone inception in well-sorted, unimodal deposits. According to Figure 8 this is a medium-grained sand (between 0.2 mm and 0.6 mm mean grain size) for a wide range of debris thicknesses (from 10 mm to 125 mm). Comparison with Reference ØstremØstrem’s (1965) results suggest that for greater sediment size an increasing thickness of debris will yield positive growth rates. Between the two limits shown in Figure 8 there is a gradation of cone development. The optimum grain size appears to fall in the coarse sand to fine gravel grade (0.6 mm–5 mm).

Temperature observations
Temperatures were recorded by:
-
(1) A thermograph located 3 m from the experimental dirt-cone site.
-
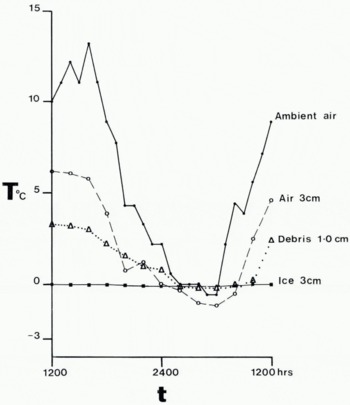
(2) Dry bulb thermometers 300 mm long located: (a) In air, 30 mm from the debris cover and 250 mm above the ice surface (thermometer with a simple radiation shield); (b) 20 mm within a debris cover, 30 mm thick; (c) 30 mm within the dirt-cone ice core.
The maximum error in temperature measurements due to equipment sensitivity and operator variance is about 0.5 deg. Readings were taken every two hours for a 24 h period from 12.00 h (G.M.T.) 14 August 1968. Figure 9 shows the four resulting temperature curves. Although large fluctuations were recorded in both the ambient and localized air temperatures the debris cover changed by only 3.5 deg and the ice core showed little variation from melting point.
4. Thermal processes
The amount of protection afforded by a sedimentary layer, and hence the growth rate of a dirt cone, depends upon the amount of heat transferred through the debris.
The total ablation over adjacent “clean” ice for the experimental period (26 d) was 0.98 m ice (≈0.9 m water equivalent) (see Fig. 7). A mean value for the absorption of heat required to produce this amount of melt is 1.3×10² W m−2. Reference ListerLister (1953, Reference Lister1959) reported values for summer melt over “clean” ice in Iceland which give a mean heat flux density of 3×10² W m−2. The rate of absorption of heat at the ice surface, beneath the debris, for experimental dirt cones can be evaluated from the melt rates as shown in Table IV.

Using these values and the temperature gradient within the debris layer, the thermal conductivity of the material can be estimated by:

where k is the thermal conductivity, Q the heat flow per unit area of cross-section averaged over the period, and ∂T/∂x the average thermal gradient through the debris normal to the surface.
The observed temperatures for site 1 (Fig. 9) are given for a distance approximately 10 mm from the ice-core surface. Assuming that the temperature gradient is constant throughout the debris, ∂T/∂x becomes 150 deg m−1. Substituting into Equation (3) with Q = 85 W m−2 we obtain k ≈ 0.56 W m−1 deg−1. The value of K can be compared with published estimates of thermal conductivities for unconsolidated, dry, sandy accumulations at 0° C given in Table V.

The debris layer of a dirt cone is usually charged with melt water which may have a significant effect on thermal behaviour if the conductivity of the solid is very different from that of water (Reference Carslaw and JaegerCarslaw and Jaeger, 1959). The thermal conductivity of pure water is 0.56 W m−1 deg−1, closely similar to the conductivity for the debris/water mixture. Hence, in this rather special case, water has little effect on the sediment conductivity except to make it appear less porous.
Thermal regime
Figure 10 has been constructed to indicate the temperature distribution in a debris layer, following a sudden change in surface temperature. Although the temperature at the surface may pass below 0° C, melting can still take place at the debris/ice interface because of the time lag required for a cold wave to pass through the debris (Fig. 10). Once the cold wave has passed through the layer, all melting will cease. The time lag (Δτ) between a cyclic change (e.g. daily) in surface temperature (following a sine function) and that at depth within the sediment is given (after Reference Jakob and HawkinsJakob and Hawkins, 1942) by:
where x is the distance from the debris surface, α the thermal diffusivity = k/cρ s where c is the specific heat capacity and ρ s the density of debris, and n is the number of cycles per unit time. For values of α = 3×10⁻⁷ m2 s−1 (based on k = 0.56 W m−1 deg−1) and n = 1.157×10⁻⁵ Hz, x = 0.03 m corresponds to Δτ = 1.2 h, and x = 0.02 m to Δt = 0.9 h.

Such time-lag values provide estimates of the melting regime on dirt cones. At the ice/debris interface for Site 1, melting would continue for a minimum of 1.2 h after the surface temperature had passed through 0° C in response to changes in the local air temperature Similarly the temperature of the debris at a depth of 0.02 m would be in advance of the ice surface by 0.3 h and behind the air/debris interface by 0.9 h. Considering the limitations of the cyclic model in Equation (5) and the experimental errors, the estimated lag between air and debris temperatures is in good agreement with those shown in Figure 9.
5. Mechanical processes
Thermal conductivities for fine sediments (e.g. silt grade) may be no higher than for coarser material but when saturated they become more easily mobilized and incompetent in maintaining a cohesive layer in contact with the ice core. It would appear that it is the consistency limits which are important in determining which materials produce cones.
In silts, the Atterberg liquid limit (the minimum moisture content at which sediment will flow under its own weight (Reference CasagrandeCasagrande, 1947)) is lower than for finer clay sizes (Reference Linell and KaplarLinell and Kaplar, 1959). As the moisture content in such fine-grained sediment is raised, the intergranular water film is thickened and the available pore space filled. This results in a flow velocity which is common to both solid and liquid phases (Reference BagnoldBagnold, 1968). The material having achieved the liquid limit through the continued supply of water from melting ice, will flow away under gravity. Beyond the coarse sand grade, increasing particle size (Fig. 8) for a given debris thickness, results in an increased permeability of the debris providing little opportunity for either saturated flow (except under pressure) see Reference AckermannAckermann (1948[a], Reference Ackermann[b]), or protection due to interstitial air circulation. Such processes provide the basic mechanism whereby only a limited range of sediment sizes (Fig. 8) were observed to produce distinct dirt cones.
Mass transfer, in response to such changes in the mechanical strength of the debris, was observed to be the dominant process operating upon the sediment layer. Failure of the unconsolidated debris occurred in the form of periodic slumping, sliding or avalanching, steepening and thinning the debris slope above and reducing it at the cone base to give the distinctive slope relations shown in Figure 4.
6. Model of Dirt-Cone Development
On the basis of observational and experimental data, a simple, deterministic model of cone dynamics can be suggested in which cone slope angle (tan α = 2 z/y) and cone height (h d) are used as critical indicators of cone growth:
where xy is proportional to the basal cross-sectional area, T c/T m is the ratio of debris thickness at the cone crest to the mid-slope thickness, s is the shear strength of the debris layer, and D a is the differential ablation rate (ratio of melting rate at the ice core to the melting rate over “clean” ice).
During the rapid, positive growth phase D a < 1. The interaction and feedback system at this stage is shown in Figure 11. As the cone increases in height, the slopes steepen (θ d > θ i), retreating towards the incipient apex. The surface area increases and the debris layer becomes thinner (by mass movement), reducing net protection and the ablation differential. But as D a → 1, the interactions change (Fig. 12). Once the debris is reduced to a threshold thickness on the cone crest (Fig. 7) melting of the ice core is accelerated, the cone (as a morphological form) decays and the ablation differential is stabilized.


Dirt-cone growth and form is thus a steady-state process in response to the ablation/protection balance. The overall feedback is negative but characterized by two distinctive phases of waxing and waning development (i.e. cone form) with a change-over threshold related to debris thickness.
7. Conclusions
From the material and discussion outlined in previous sections a number of points have emerged. These are:
-
(1) Natural dirt cones on Bersaerkerbræ resulted from the differential ablation of streamlaid sediment.
-
(2) The material comprising the sediment cover of natural cones was found to lie predominantly within the size range 0.6 mm to 5 mm. Experiments to determine the ability of various particle-size materials to produce dirt cones indicated that a threshold grain size could be postulated at the medium sand grade (0.2 mm to 0.6 mm). Due to the low Atterberg liquid consistency limit of fine, silty-clay materials, no cones developed in such deposits. The permeability of thin layers of coarse debris (10 mm to 200 mm), affording continuous circulation of air within the fabric, probably prevented differential ablation and cone growth. Grain-size, which has not been stressed in previous studies, would seem one of the dominant controls in cone formation, its effect being independent of debris thickness within the range 10 mm to 125 mm.
-
(3) The growth rate of dirt cones varies with plot geometry and sediment thickness: (a) Since cone slope angles show little variation (<10%) cone height is directly related to basal cross-sectional area. (b) For equivalent cross-sectional areas, cone height is a function of debris thickness. (c) Growth of cones proceeds at a rate of up to 50% of the ablation rate over “clean” ice. This implies continuous melting at the ice core crest, so that cone size is a poor gauge of ablation on the surrounding glacier.
-
(4) If the temperature gradient through the debris and the growth rate are known, the average thermal conductivity of the sediment can be computed and the heat transfer in response to a changing air temperature, can be estimated.
-
(5) A simple, deterministic model for cone development is proposed, characterized by negative feedback and describing a steady-state system.
Acknowledgements
The material presented in this report was obtained during the Queen Mary College East Greenland Expedition 1968. The author would like to thank Dr R. J. Palmer and the late Mr T. A. Hird who so readily assisted in the collection of field data. The Royal Geographical Society, Queen Mary College (University of London), the Central Research Fund of the University of London, the Mount Everest Foundation and the Gino Watkins Memorial Fund provided finance and equipment. Dr H. Lister, Dr J. G. Paren and Dr G. de Q. Robin kindly read all or part of the draft and suggested improvements.


