

24.1 Introduction
The present study belongs to a line of research that examines on experimental grounds established claims and methods of rhetoric and media training. Many of such claims and methods have emerged from a combination of experience, intuition, and practical work with coaches. They are implemented on an everyday basis without understanding in detail whether, how, for whom, and under what circumstances they unfold their intended positive effects. By positive effects, we mean that they help learners of public speaking enhance their level of perceived charisma. Charisma is the result of an “emotion-laden leader signaling” (Antonakis et al., Reference Antonakis, Bastardoz and Jacquart2016), or, more specifically, of a signal-based, balanced transmission of competence, self-confidence, and passion, which respectively create trust, motivation, and commitment in people. Based on that, charisma helps speakers gain attention or inspire audiences to take desired actions or opinions (see Michalsky and Niebuhr, Reference Michalsky and Niebuhr2019). The range of signals that can contribute are diverse and include clothing and posture, choice of words and gestures, as well as pronunciation and nonverbal speech characteristics. Our study is about the latter signals and speech prosody in particular – see Arvaniti (Reference Arvaniti2020) for a recent definition of prosody.
So far, previous studies have cast a rather critical light on the validity of established claims and methods of rhetoric and media training. For example, a frequent claim is that rhetorical questions have a positive effect on their users’ charisma. Neitsch and Niebuhr (Reference Neitsch and Niebuhr2022) were able to corroborate this claim for oral presentations (like Tur et al., Reference Tur, Harstad and Antonakis2022, did for written language), however, only in connection with the prototypical prosody of real information-seeking questions. Using the normal prosody of rhetorical questions can even backfire to speakers, according to Neitsch and Niebuhr. A further example is the study of Tschinse et al. (Reference Tschinse, Asadi, Gutnyk and Niebuhr2022), who investigated the claim that smiling boosts a speaker’s perceived charisma and should therefore be applied as often as possible. Tschinse et al. found initial experimental evidence that smiling speech indeed makes speakers more charismatic. However, they also found an overdose threshold for smiling in public speeches that was sex-specific and considerably lower for female than for male speakers. An example for an established method of rhetoric and media training is the much-praised and often time-consumingly trained abdominal “belly” breathing. Niebuhr and Barbosa (Reference Berger, Zellers and Niebuhr2023) investigated whether this actually brings the promised charisma benefits (compared to the typical chest-dominated way of breathing). While their results showed that voices were perceived as more resonant under abdominal breathing, they could not find evidence that abdominal breathing has a positive effect on the perception of speaker charisma. By contrast, charisma increased perceptually only under chest breathing.
Continuing this line of research, the present study is about the so-called cork exercise (CE). The key concept of this exercise is that a wine bottle cork is clamped at about one-third of its length between the upper and lower incisors and held in place by gently biting down. Now the speaker starts reading out loud a specific training text, articulating as clearly as possible “around the cork” (e.g., Alburger, Reference Alburger2014). According to guidebooks on rhetoric and leadership, performing this exercise gives speakers a more “open and vivid articulation” (Khidr, Reference Khidr2017) and, moreover, causes a “remarkable difference in the sound of your voice” (Alburger, Reference Alburger2014). According to Knoppers et al. (Reference Knoppers, Obdeijn and Giessner2021:249), the voice becomes “deeper and fuller” after the CE. Schinko-Fischli (Reference Schinko-Fischli2019) additionally stresses the immediate and robust effect of the exercise by stating that it “is excellent for improving the clarity of your pronunciation in a short time.” More than a hundred years ago already, Rice (Reference Rice1920) had pointed out the effectiveness of the CE (see also Timmermans et al., Reference Timmermans, Coveliers, Wuyts and Van Looy2012).
Unlike for many other claims and methods, there is some experimental evidence to support the guidebook quotations. Timmermans et al. (Reference Timmermans, Coveliers, Wuyts and Van Looy2012), for example, conducted a perception experiment based on a within-subjects before–after comparison with one control group and two test groups of normal and dysarthric speakers. They found that, after the exercise, the non-dysarthric test group was rated to speak more clearly and intelligibly than the control group. Timmermans et al. (Reference Timmermans, De Bodt and Ysenbaert2015) later replicated the positive perceptual effect of the CE with media representatives, that is, journalists and radio hosts. However, they could not find any acoustic correlates of that perceptual improvement, such as changes in the levels of the first- and/or second-formant frequency (F1, F2). Such correlates were found by Leyns et al. (Reference Leyns, Corthals and Cosyns2021), though, who showed that the CE makes third-formant (F3) frequencies increase, albeit not for all vowels and speakers. Yet, these authors reported a robust effect of the exercise on intelligibility.
In summary, the CE has so far been primarily examined with regard to its effect on articulation and intelligibility. If the CE has any effects on prosody is unknown. It is claimed, for example, by Alburger (Reference Alburger2014) and Knoppers et al. (Reference Knoppers, Obdeijn and Giessner2021) that speakers’ vocal (i.e., prosodic) performances also benefit from the CE. Our study addresses this gap. We tested what effect the CE has on vocal performance, specifically on speech rhythm, intonation, timbre, timing, and loudness. Rhythm is operationalized here in terms of both established acoustic measures and a new instrument for measuring jaw-lowering patterns: the MARRYS cap (Erickson et al., Reference Erickson, Niebuhr, Gu, Huang and Geng2021). Jaw-lowering patterns were repeatedly shown across languages to be closely related to degrees of sentence stress (Erickson et al., Reference Erickson, Niebuhr, Gu, Huang and Geng2021), which are a major source of perceived speech rhythm (Kohler, Reference Kohler2009).
Thus, unlike previous studies, our study focuses on the CE’s acoustic rather than perceptual effects. However, the latter can, to some extent, be inferred from the former. It is well known from previous studies that virtually all acoustic vocal-performance measures are positively correlated with perceived charisma and/or related traits (charm, persuasiveness, trustworthiness, enthusiasm, and so on; e.g., Strangert and Gustafson, Reference Strangert and Gustafson2008; Rosenberg and Hirschberg, Reference Rosenberg and Hirschberg2009; Niebuhr and Skarnitzl, Reference Niebuhr and Skarnitzl2019, Reference Niebuhr and Skarnitzl2021). For example, being a more charismatic speaker means to have a higher pitch level, a larger pitch range, a higher tempo, a higher loudness level, and so on (see Rosenberg and Hirschberg, Reference Rosenberg and Hirschberg2009). In addition, Berger et al. (Reference Berger, Zellers and Niebuhr2023) found in accord with Niebuhr et al. (Reference Niebuhr, Brem, Michalsky and Neitsch2020) that the range of the F1 is positively correlated with perceived charisma. The larger the F1 ranges, the more charismatic speech sounds. And since “a lowering of the jaw causes an increased F1” (Mooshammer et al., Reference Mooshammer, Hoole and Geumann2007:171), larger F1 ranges mean more pronounced jaw lowering or, to put it in the words of Erickson and Niebuhr (Reference Niebuhr, Barbosa, Rüdiger and Drayter2023), more pronounced “jaw dancing.”
Thus, if systematic effects of the CE on prosodic acoustics emerge, and if these effects are to be positive for vocal charisma, they must manifest in the form of prosodic-parameter increases and, in the case of rhythm, additionally in increased jaw lowering. Testing this assumption is the main goal of our study.
There are many differences concerning how exactly the CE is implemented. This applies, for example, to the duration of the exercise (see Timmermans et al., Reference Timmermans, Coveliers, Wuyts and Van Looy2012). Instructions also vary considerably. However, many instructions have in common that they raise high expectations among speakers. The speakers are told how much their speech production will improve and how traditional and effective the exercise is (see the guidebook quotations above [Alburger, Reference Alburger2014; Khidr, Reference Khidr2017; Schinko-Fischli, Reference Schinko-Fischli2019; Knoppers et al., Reference Knoppers, Obdeijn and Giessner2021]). In such a setting, it cannot be ruled out that post-exercise changes are only the result of a placebo effect, caused by the praising, effect-oriented instruction. Furthermore, effects of the CE have so far only been found for speech recorded immediately after the CE. Although guidebooks promise a sustainable effect, this sustainability has not been empirically supported up until now.
As a supplement, we include these two open questions as secondary goals. We address them by (1) testing two different instruction videos, a neutral instruction-oriented one and a praising, effect-oriented one that emulates typical guidebook-style instructions and (2) comparing speakers’ pre- and post-exercise performance.
To summarize, the research questions are therefore: Are there significant effects of the CE in the form of differences in the participants’ rhythms and prosodies between pre- and post-exercise vocal performances? If so, (a) is there a significant interaction of these effects with the type of video instruction and (b) do these significant effects persist also after a distractor task?
We explored these questions with an eye to speaker sex. This was primarily because it is well documented that men and women tend to exhibit distinct levels of public-speaking anxiety and display different behavioral responses to such anxiety (Carrillo et al., Reference Carrillo, Moya-Albiol and Gonzalez-Bono2001). Additionally, prior research has identified sex-related variances in articulatory movements and dynamics of lips, jaw, and tongue (Tang et al., Reference Tang, Hannah and Jongman2015; Weirich et al., Reference Weirich, Fuchs, Simpson, Winkler and Perrier2016). This is relevant insofar as a CE intervention could interfere differently with these sex-related variances.
24.2 Method
24.2.1 Participants
A total of 16 participants took part in our experiment. They were randomly assigned to two test conditions, an effect-oriented condition and an instruction-oriented condition – see Section 24.2.2 below. Table 24.1 gives an overview. Participants were German native speakers. All gave formal written consent to participate in the study. (Due to a number of previous related experiments, a separate ethical approval from SDU’s Research Ethics Committee was not required for this study.) None of the participants had heard of the CE before or had any other experience with rhetoric or media training. Thus, they were completely naïve to public-speaking practices.
| Sample | 1 | 2 | 3 | 4 | 5 | 6 | 7 | 8 | |
|---|---|---|---|---|---|---|---|---|---|
| Effect-oriented condition | ID | EF1 | EF2 | EF3 | EM1 | EM2 | EM3 | EM4 | EM5 |
| Sex | female | female | female | male | male | male | male | male | |
| Age | 30–40 | 20–30 | 40–50 | 40–50 | 20–30 | 20–30 | 20–30 | 30–40 | |
| Instruc.-oriented condition | ID | IF1 | IF2 | IF3 | IF4 | IM1 | IM2 | IM3 | IM4 |
| Sex | female | female | female | female | male | male | male | male | |
| Age | 30–40 | 20–30 | 40–50 | 20–30 | 20–30 | 20–30 | 20–30 | 20–30 |
24.2.2 Test Conditions
One goal was to test the extent to which the CE relies on a placebo effect – caused by the fact that books and coaches emphasize how established and successful the exercise is when introducing it to participants. To address that, the sample was divided into two test conditions with eight participants each: the effect-oriented condition and the instruction-oriented condition (see Table 24.1 in Section 24.2.1).
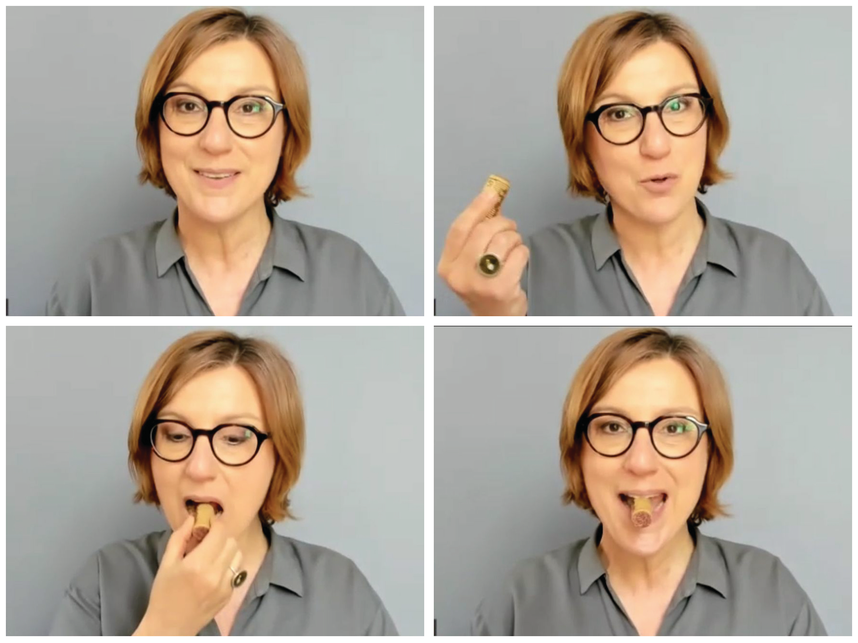
Both conditions were represented by videos kindly produced for us by a professional rhetoric and media trainer, Dr. Katrin Prüfig (KP) – see Figure 24.1. KP recorded the videos while speaking in front of a neutral background.
Individual example frames from the instruction-oriented video produced by KP for the purpose of this study.
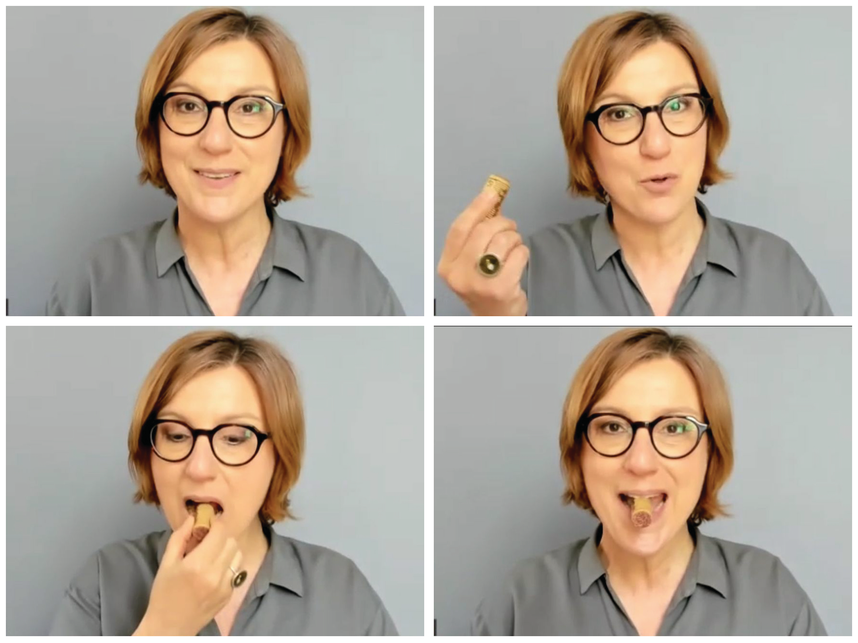
The instruction-oriented video was 1:15 minutes long. It introduced the term cork exercise, showed the cork, and illustrated the method with a short example text that KP performed first with and then without the cork in her mouth. As part of this contrastive performance, KP informed her viewers that the goal should be to articulate clearly and elaborately “around the cork” – and that the method can basically be combined with any text. The video ended with a call to action that encouraged viewers to try out the CE themselves.
The effect-oriented video was about one minute longer, that is, 2:14 minutes in total. It contained exactly the same content. However, in the video’s additional 60 seconds, KP praised the method. She stressed that the CE would be an established, tried-and-trusted exercise among rhetorical trainers and media coaches like herself, and that successful professional keynote speakers and actors would value this exercise for a long time, and they like to apply it right before their performances “on stage.” Moreover, after having read the example text with and without the cork in the mouth, KP explicitly described the beneficial effect on its users, for example, in the form of clearer and more forceful speech production. The video ended in the same call to action as the instruction-oriented video.
24.2.3 Reading Material
For comparing CE effects on participants’ prosodies, we chose the German version of Aesop’s fable North Wind and the Sun. The text was selected for two reasons. First, it is well established in the speech sciences, is repeatedly used for analyzing both sound segments and prosodies, and it represents a standard text for the phonetic documentation of languages by the International Phonetic Association (IPA) (Baird et al., Reference Baird, Evans and Greenhill2022).
Second, and more importantly, it is known from previous studies that North Wind and the Sun can be fluently produced by native speakers of German. It is also roughly known which phrasings (i.e., pause locations) are to be expected – and that the text is basically capable of eliciting a rich, melodic prosody as well as clearly pronounced sentence stresses (pitch-accented words) and speech rhythms (e.g., Trouvain and Grice, Reference Trouvain and Grice1999; Braun et al., Reference Braun and Künzel2003; Andreeva and Dimitrova, Reference Andreeva and Dimitrova2022).
Besides North Wind and the Sun, another elicitation text was used in this study: the German poem “Der Zwölf Elf” (the 12th elf), written by Christian Morgenstern between 1887 and 1914. It consists of 139 words, 12 stanzas, and 24 verses. We used a poem on the assumption that this type of text would particularly well support the CE with regard to prosodic factors such as rhythm, intonation, and melody. Public-speaking trainers such as Bernhardt (Reference Bernhardt2022) explicitly recommend using poems in connection with the CE. Consistent with such recommendations, Rodero et al. (Reference Rodero, Diaz-Rodriguez and Larrea2018) show, for example, that poetry triggers stronger and more frequent stresses, phrasings, and loudness contrasts during public-speaking training compared to normal prose texts. Furthermore, poetry is also known for effectively teaching adult language learners the prosody of a foreign language or for improving children’s reading and speaking fluency (Miccinati, Reference Miccinati1985).
Among suitable poems, we chose “Der Zwölf Elf” for two reasons. Firstly, it represented one of two official cork-speaking exercises in the book by Meisner (Reference Meisner2010). Meisner’s exercises are aimed at Parkinson’s patients. Thus, the exercises should be at least as effective with non-pathological speakers such as our 16 participants. Secondly, “Der Zwölf Elf” resulted in an exercise duration that was similar to those used in previous scientific CE studies (see Timmermans et al., Reference Timmermans, Coveliers, Wuyts and Van Looy2012).
24.2.4 Procedure
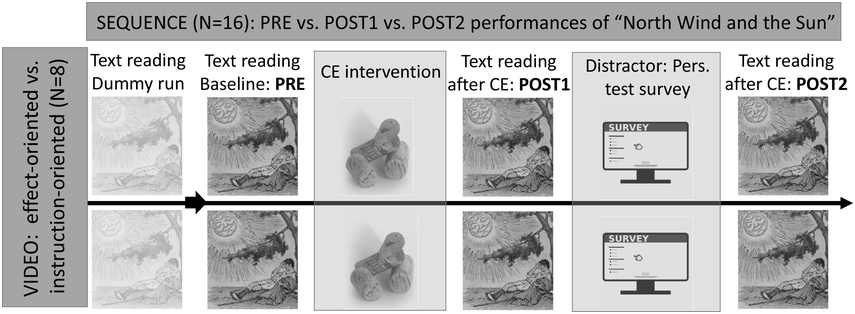
The experiment was carried out based on a mixed-design framework. That is, it included a within-subjects factor and a between-subjects factor – see Figure 24.2, whose images are used here under CC licenses from the following sources: Project Gutenberg (license: public domain, CC0): https://picryl.com/media/the-north-wind-and-the-sun-sun-project-gutenberg-etext-19994-821bd3, corks (license public domain, CC0), www.rawpixel.com/image/6020053/wooden-wine-cork-free-public-domaincc0-photo, survey icon (license public domain, CC0) https://commons.wikimedia.org/wiki/File:Online_Survey_Icon_or_logo.svg. The within-subjects factor was the comparison of North Wind and the Sun reading performances before versus after the CE intervention, henceforth referred to as PRE versus POST1. The factor itself is referred to as SEQUENCE. The factor SEQUENCE also included a distractor task and a further reading task POST2. The rationale for their inclusion is explained below. The two video conditions of the effect-oriented and instruction-oriented videos represented the between-subjects factor VIDEO.
Overview of the experimental procedure and the material provided in each step.
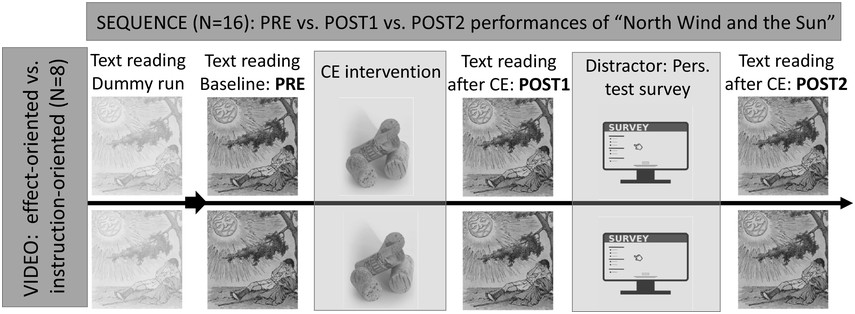
The participants were invited individually to the experiment that took place in the sound-treated recording booth of the CIE Acoustics Lab of the University of Southern Denmark (SDU). Upon arrival, they were only informed that they would take part in a speech-production experiment and that their speech signals and jaw movements during speech production would be recorded to that end. Furthermore, the participants were told that their speech-production data would be collected on the basis of two reading texts.
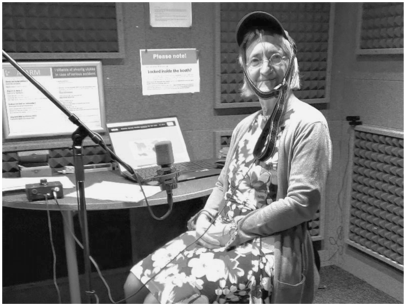
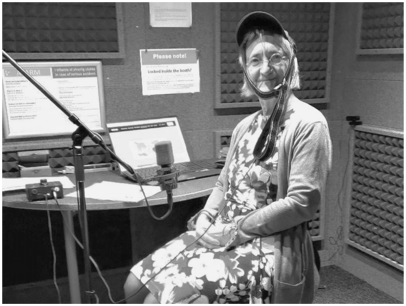
After participants had given consent, they were asked to take a seat in the sound-treated booth. The MARRYS cap was put on to record jaw movements in parallel to audio – see Figure 24.3.Footnote 1 The MARRYS cap is, in short, a new phonetic device that can record jaw lowering via sensor straps on both sides of the head that converge on the chin (see, for further details, Niebuhr and Gutnyk, Reference Niebuhr and Gutnyk2021). The cap achieves a similar precision and resolution as the current gold standard of electro-magnetic articulography, or EMA (Svensson Lundmark et al., Reference Svensson Lundmark, Ericksson, Niebuhr, Tiede and Wei-Rong2023). However, unlike EMA, the MARRYS cap is easy to use and portable, and even allows the recording and analysis of asymmetries in vertical jaw lowering (Niebuhr and Gutnyk, Reference Niebuhr and Gutnyk2021).
Illustration of the recording setting inside the sound-treated booth of the CIE Acoustics Lab.
The speech-production experiment began with the participants having to read North Wind and the Sun twice. The first run was a dummy run, designed to familiarize the participants with the recording situation and the reading text. The second run was used as the baseline production PRE (Figure 24.2).
After the two rounds, participants saw the respective video by KP and were asked to do the CE themselves based on the poem “Der Zwölf Elf.” A cork was handed out to them while they received this instruction (Figure 24.2).
After participants had finished reading the poem, they were asked to remove the cork and read the North Wind and the Sun fable again. Then, they were given a nonverbal task. They were instructed to fill out the Smalley–Trent five-minute personality test on the screen in front of them. The personality test was integrated into the experiment as a distractor element (Figure 24.2). It temporarily distracted participants from the CE and prevented them from internally rehearsing and retaining their immediate experiences and motor memories gained through the exercise.
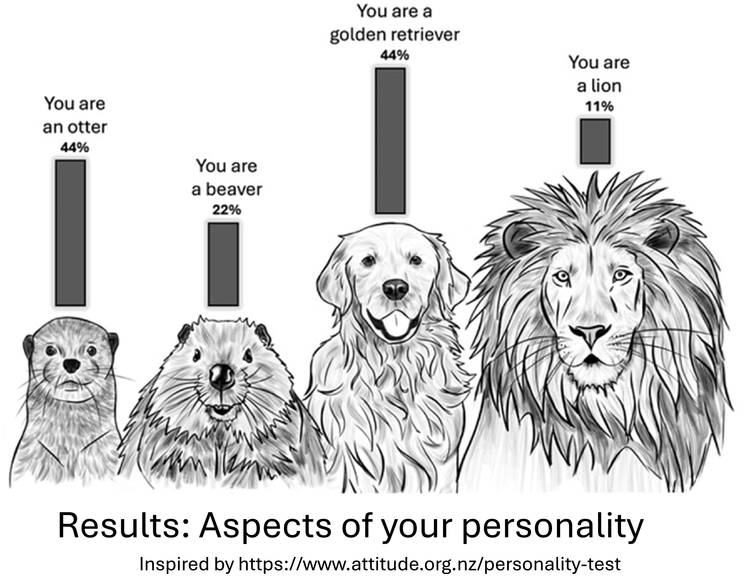
The Smalley–Trent test is also known as the four-animal personality test (Liu et al., Reference Liu, Niu and Carassai2017). It consists of a small set of 18 questions based on which the test gives a graded assessment of the participants’ strengths, weaknesses, and natural inclinations, represented by four animal characters: lion, otter, beaver, and golden retriever – see the example in Figure 24.4.
Illustration of the Smalley–Trent five-minute personality test result.
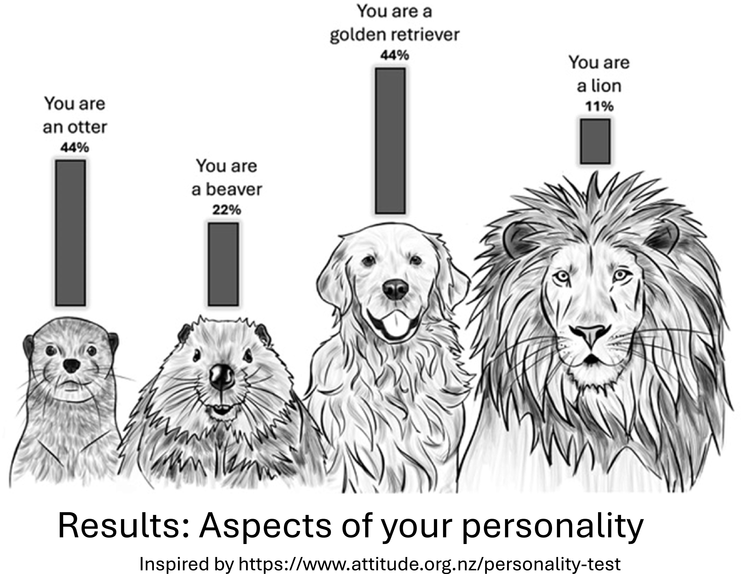
Figure 24.4 Long description
The components are as follows. Top. A graphical representation of a waveform of the sound's amplitude over time. Darker areas indicate louder sound. Middle. A visual representation of a spectrogram of the sound's frequency content over time. Bottom. A textual representation of the speech sounds including symbols like "sil" represent silent, "v" represents a voiced sound, and "c" represents a consonant sound.
After completing the personality test, participants were asked to read the North Wind and the Sun a third time.
So, while there was only one PRE performance of the fable per speaker in the experiment, we included two POST performances, one directly after the CE and one after the distractor (POST1 and POST2; Figure 24.2). While POST1 was to examine whether the CE would have any immediate effects on jaw movements, rhythm, and prosody, POST2 was to investigate whether CE-intervention effects would be robust enough not to disappear after a short distraction. Like PRE and POST1, POST2 is also a part of the within-subjects factor SEQUENCE.
In a final debriefing, the participants were informed about the objectives of the study, including the existence of two video conditions and the condition they had been assigned to. Most of the participants stated that they found the CE exciting and unfamiliar, but also a little strenuous. The majority of participants also estimated that the cork had had no significant effects on their speech production or, if at all, only short-term effects.
A complete experiment session lasted about 15 minutes. Note that the participants were always alone in the sound-treated booth during the individual reading performances. The experimenter only came in to initiate the next step and then left the booth again. Also note that the participants were generally and repeatedly instructed before each North Wind and the Sun round not just to read the text but rather to perform it, for example, as if they were reading it for an audience.
24.2.5 Data Analysis
24.2.5.1 Speech-Rhythm Analysis
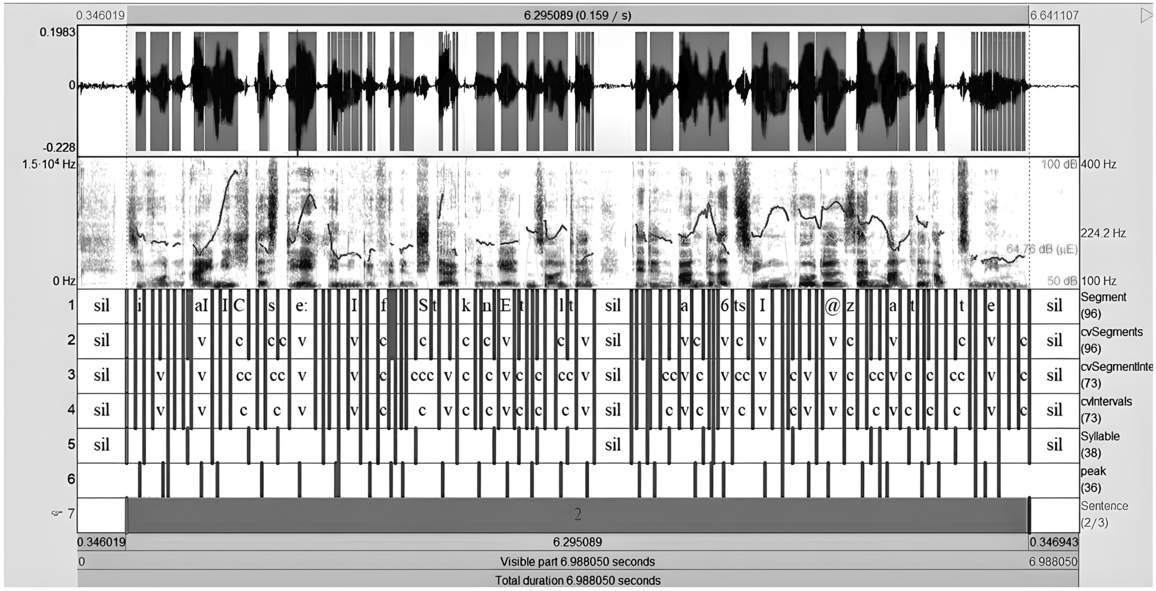
We used the Munich automatic segmentation system (MAUS; Kisler et al., Reference Kisler, Reichel and Schiel2017) with its German linguistic rule set to create Praat TextGrid files in which the North Wind and the Sun readings were broken down into seven types of time-interval tiers. These ranged from a “Segment” tier with individual consonant and vowel boundaries, to a “Syllable” tier with syllable boundaries, and finally to a “Sentence” tier where the beginnings and ends of the text?s six sentences were marked. (see Figure 24.5). All automatically created boundaries were manually checked and, if required, corrected, taking into account the criteria of phonetic segmentation summarized in Machač and Skarnitzl (Reference Machač and Skarnitzl2009).
Example of a Praat TextGrid file in combination with its corresponding sound file.
The figure shows sentence 2 of the fable uttered by the female speaker KF (“Sie wurden einig, dass derjenige für den Stärkeren gelten sollte, der den Wanderer zwingen würde, seinen Mantel abzunehmen”). Vertical bars mark landmarks in the speech signal at six levels, from acoustic energy peaks (level 6) to syllable and individual sound-segment boundaries (levels 5 and 1). The dark gray curve in the spectrogram shows the f0 contour (100–400 Hz); “sil” labels indicate silent (nonspeech) intervals.
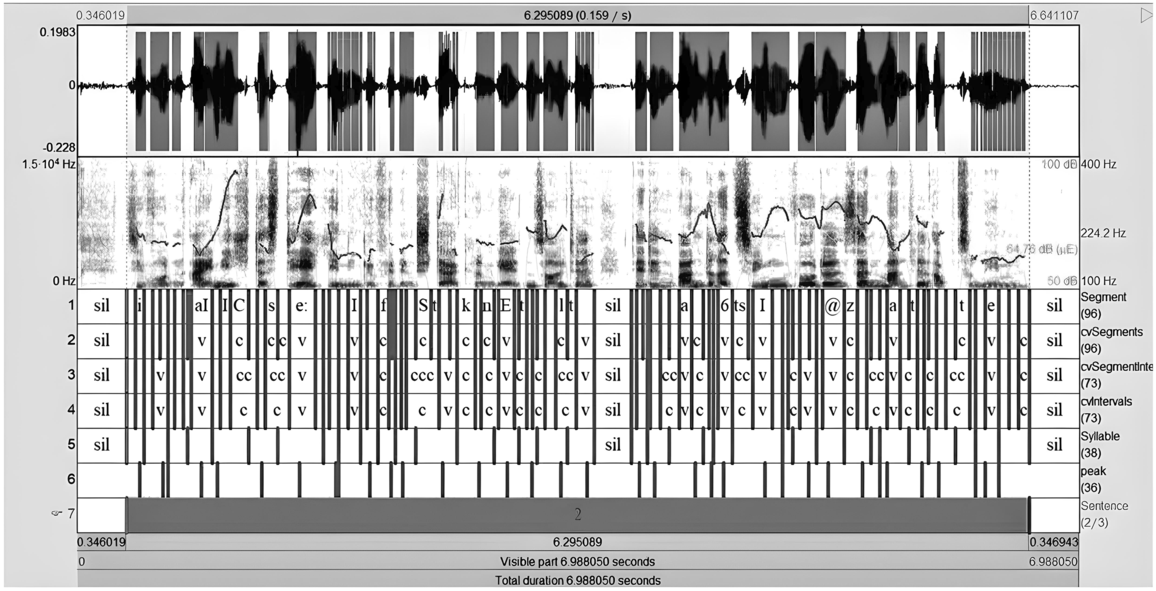
Figure 24.5 Long description
The horizontal axis represents pre, post 1, and post 2. The vertical axis represents the estimated marginal means for male and female speakers. The maximum to minimum mean values of estimated marginal means for female speakers are as follows. Set a. Top. Effect-oriented video; 550, 510, and 500. Instruction-oriented video; 510, 500, and 500. Bottom. Effect-oriented video; 500, 500, and 450. Instruction-oriented video; 510, 500, and 500. Set b. Top. Effect-oriented video; 13, 12, and 12. Instruction-oriented video; 12, 12, and 12. Bottom. Effect-oriented video; 13, 12 and 11. Instruction-oriented video; 11, 10 and 10. The values are estimated.
We used a script written for Praat (Boersma, Reference Boersma, Durand, Gut and Kristoffersen2014) by Volker Dellwo (see Taghva et al., Reference Taghva, Moloodi, Abolhasanizadeh and Tabei2023) to measure, based on the TextGrid files, the most widely employed speech-rhythm parameters proposed by previous works (Ramus et al., Reference Ramus, Nespor and Mehler1999; Grabe and Low, Reference Grabe and Low2002; Dellwo et al., Reference Dellwo, Leemann and Kolly2015). Three types of parameters were measured, all related to the time-interval structures realized by the speakers: (1) mean measures refer to the average duration of a unit’s time interval; (2) delta (∆) measures show the standard deviation of the time-interval durations of a unit; and (3) rPVI (raw pairwise variability index) measures represent the sum of the absolute differences between pairs of consecutive time intervals (either vocalic or consonantal) divided by the number of pairs in the speech sample. Following the argument of Bertini et al. (Reference Bertini, Bertinetto and Zhi2011), we refrained from normalizing these rPVI values (to nPVI values), also for vowels, in order to allow stress or pitch-accent duration changes to show up clearly in PVI values. The three types of measures were taken for the following five units: syllables, consonants, vowels, as well as voiced and unvoiced speech sections as a whole, that is, for example, clusters of unvoiced consonants or sequences of vowels and adjacent sonorant consonants.
24.2.5.2 Analysis of Intonation, Timbre, Timing, and Loudness
Rhythm is an integral part of speech prosody – see Arvaniti (Reference Arvaniti2020). The fact that we have separated the rhythmic-acoustic parameters in Section 24.2.5.1 from the other speech prosody parameters in this section only serves to provide a clearer description. The acoustic analysis of these other prosodic parameters included measures related to intonation, timbre, timing, and loudness. Measurements were taken automatically by means of ProsodyPro (Xu, Reference Xu2013), using the default (recommended) sex-specific analysis settings. All obtained values were manually cross-checked. Implausible values (such as zeros) were either removed or replaced by manually measured values. The following parameters were measured:
Intonation: mean f0 (fundamental frequency) level (Hz), mean f0 minimum (Hz), mean f0 maximum (Hz), and f0 range (difference between minimum and maximum, Hz). The latter three f0 measures were based on values of the 90th percentile in order to exclude measurement outliers.
Timbre: harmonic-amplitude difference h1–h2 (i.e., a source spectral tilt measure, f0-corrected, dB), amplitude differences between the first harmonic and the harmonic closest to the third formant h1–A3 (i.e., spectral tilt measure, f0-corrected, dB), and the mean formant levels (Hz) of F1, F2, and F3.
Timing: pause count, mean pause duration (in ms), and mean speaking rate (syll/s)
Loudness: mean RMS (root mean squared) (dB) and RMS variability (standard deviation, dB)
Note that all acoustic-prosodic measures were taken per sentence. Each speaker was, thus, represented by six measurements per PRE, POST1, and POST2 performance.
24.2.5.3 Analysis of MARRYS Cap Signals
The MARRYS signals were transferred to Audacity for post-processing (Audacity, Reference Audacity2017). For the analysis of the jaw movements, we applied the “MARRYS-Amplitude” script written for Praat by Svensson Lundmark to the TextGrids’ sentence-interval tiers (Svensson Lundmark et al., Reference Svensson Lundmark, Ericksson, Niebuhr, Tiede and Wei-Rong2023). Minimum and maximum amplitudes (in Pascal) were measured on that basis. Amplitude is the stretch of the belt in the MARRYS cap; hence, a higher amplitude equals a bigger displacement of the jaw. As each North Wind and the Sun reading included six sentences, a total of 18 minimum and maximum amplitude measurements were taken per speaker across all three SEQUENCE conditions (PRE, POST1, and POST2). Furthermore, we collected, as reference values, the maximum and minimum amplitudes of the initial sentence of the poem read during the CE with the cork in the mouth. All sentence intervals were manually checked and adjusted prior to running the Praat script to not include any nonspeech jaw movements made prior or after each read sentence.
Furthermore, we used the minimum and maximum amplitude of each sentence to calculate the amplitude range. The range estimated differences in jaw movement within the sentence. Besides the raw values of maximum amplitude and amplitude range, we used the CE reference-amplitude values to normalize the raw measurements such that a 0 measurement would mean that the speaker’s mouth was opened during a North Wind and the Sun sentence just as much as during the CE with the cork inside the mouth. Finally, based on all minimum and maximum values, the average amplitude per sentence was calculated.
24.2.5.4 Inferential Statistics
The measurements were statistically analyzed in terms of mixed-model multivariate analyses of variance (MM-MANOVAs), using SPSS v.28.0. Three MM-MANOVAs were conducted: one on the rhythm measures, one on the (other) prosody measures, and one on the MARRYS cap measures. All three statistical models had a similar makeup. The measures listed in Sections 24.2.5.1, 24.2.5.2, and 24.2.5.3 were the respective dependent variables. The within-subjects independent variable was SEQUENCE. It included the three levels PRE, POST1, and POST2. The between-subjects independent variable was VIDEO with its effect-oriented or instruction-oriented conditions – see Figure 24.2. Speaker SEX was included as an additional between-subject independent variable.
The test statistics reported in the results sections below include partial eta-squared effect-size values. Moreover, if a measure’s results violated the sphericity criterion, we report test statistics based on Greenhouse–Geisser corrections. Multiple-comparisons tests between the three levels of SEQUENCE were conducted. Due to the high number of these pairwise comparisons, the basic risk that one of these tests comes out statistically significant by chance increases. In order to reduce this risk, we corrected p-values and confidence intervals according to Šidák. For our data, in which we can, if at all, assume positively correlated tests, the correction procedure named after the Czech statistician Zbyněk Šidák is considered conservative.
24.3 Results
24.3.1 Rhythm Characteristics
The MM-MANOVA on rhythm characteristics resulted in a significant main effect of SEQUENCE (i.e., PRE versus POST1 versus POST2: F[50,320]= 2.896, p<0.001,  = 0.312). In addition, there were significant interactions of SEQUENCE with both VIDEO (F[50,320] = 1.522, p=0.018,
  = 0.192) and SEX (F[50,320]= 1.419, p=0.040,
  = 0.181). The three-way interaction SEQUENCE*VIDEO*SEX was not significant.
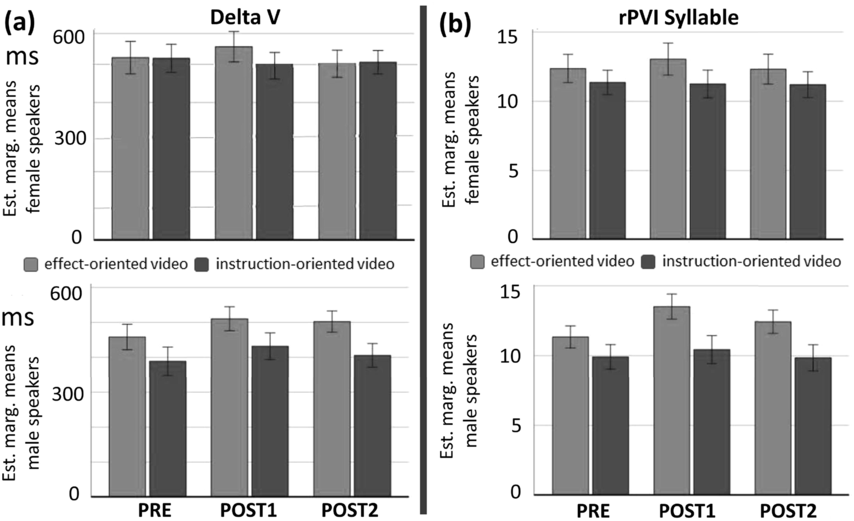
Breaking down the overall statistical model into its univariate elements (and conducting multiple-comparisons tests, with Šidák corrections, between the levels of SEQUENCE) revealed further details that we address below separately for each of the three types of rhythm measures: mean, delta, and rPVI; see also the examples in Figures 24.6(a) and (b).
The CE significantly changed the speakers’ mean duration patterns of all rhythm units, that is, syllables (F[2,184]= 27.635, p<0.001,  = 0.231), consonants (F[2,184]= 7.572, p<0.001,
  = 0.076), vowels (F[2,184]= 19.211, p<0.001,
  = 0.173), voiced intervals (F[2,184]= 12.543, p<0.001,
  = 0.120), and unvoiced intervals (F[2,184]= 7.150, p=0.001,
  = 0.072). The overall effect pattern was the same for all units: Mean durations significantly increased from PRE to POST1, but then significantly decreased again in POST2 to a level that was statistically identical to that of PRE. That is, the mean segmental duration patterns in POST2 were as if the CE intervention had never happened.
Furthermore, significant SEQUENCE*VIDEO interactions were found for the syllables (F[2,184]= 11.042, p<0.001,  = 0.107), for the vowels (F[2,184]= 6.795, p=0.002,
  = 0.069), as well as for the voiced intervals as a whole (F[2,184]= 6.173, p=0.003,
  = 0.063). These interactions reflect that the temporary increases of mean durations in the POST1 performances occurred only in combination with the effect-oriented video. The instruction-oriented video did not associate with significant changes in mean duration patterns. An example can be found in the rPVI syllable patterns in Figure 24.6(b).
Results on rhythm characteristics illustrated by two time-interval parameters.
Estimated marginal means and error bars (95% CI) for (a) the delta V and (b) the syllable-based rPVI. Dark gray bars indicate the effect-oriented and light-gray bars the instruction-oriented video conditions. Top panels show the female speakers’ and bottom panels the male speakers’ results.
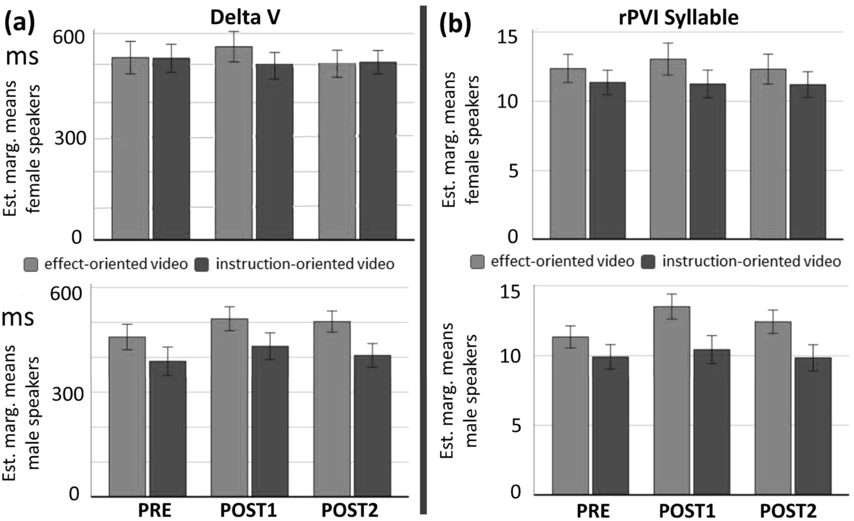
Figure 24.6 Long description
The horizontal axis represents pre, post 1, and post 2. The vertical axis represents the estimated marginal means for male and female speakers. The maximum to minimum mean values of estimated marginal means for female speakers are as follows. Set a. Top. Effect-oriented video; 210 for post 1, 200 for pre, and 202 for post 2. Instruction-oriented video; 180 for post 2, 180 for post 1, and 170 for pre. Bottom. Effect-oriented video; 125 for post 2, 125 for post 1, and 125 for pre. Instruction-oriented video; 125 for pre, 125 for post 1, and 124 for post 2. Set b. Top. Effect-oriented video; 510 for post 1, 510 for post 2, and 510 for pre. Instruction-oriented video; 500 for post 1, 480 for post 2 and 480 for pre. Bottom. Effect-oriented video; 480 for pre, 480 for post 1, and 480 for post 2. Instruction-oriented video; 480 for post 1, 480 for post 2, and 470 for pre. The bars depict similar values in sets c and d. The values are estimated.
As for the second type, that is, the delta measures, we also found significant changes induced by the CE intervention on all rhythm units, that is, syllables (F[2,184]= 4.272, p=0.016,  = 0.045), consonants (F[2,184]= 7.572, p<0.001,
  = 0.076), vowels (F[2,184]= 3.617, p=0.029,
  = 0.038), voiced intervals (F[2,184]= 3.950, p=0.021,
  = 0.041), and unvoiced intervals (F[2,184]= 6.373, p=0.002,
  = 0.065). The nature of these effects is overall similar to that of the mean durations. That is, the delta measurements increased from PRE to POST1, but then decreased again after the distractor task from POST1 to POST2. However, unlike for the mean measures, this decrease did not in most cases lead all the way down again to the delta levels of PRE. Thus, POST2 delta values were, by majority, still significantly higher than their PRE counterparts. This depended on the factors VIDEO and SEX. In the case of the syllable-based delta values, for example, we found significant SEQUENCE*VIDEO (F[2,184]= 3.369, p=0.039,
  = 0.036) and SEQUENCE*SEX interactions (F[2,184]= 4.757, p=0.011,
  = 0.049), reflecting that the increases from PRE to POST1 as well as the degree of maintenance of that POST1 level in POST2 performances were more strongly pronounced both in the effect-oriented video conditions as well as for the male participants. Similarly, for the delta values of consonants and vowels, it was mainly the effect-oriented video condition (consonants: F[2,184]= 3.353, p=0.041,
  = 0.029; vowels: F[2,184]= 3.245, p=0.045,
  = 0.027) and the male speaker group (consonants: F[2,184]= 3.412, p=0.033,
  = 0.038; vowels: F[2,184]= 3.769, p=0.027,
  = 0.040) for which an increase from PRE to POST1 occurred; and only for the male speakers, the delta values at POST2 still remained significantly above those of PRE – see Figure 24.6(a). The same applied to the voiced and unvoiced intervals (voiced: F[2,184]= 4.443, p=0.012,
  = 0.048; unvoiced: F[2,184]= 3.688, p=0.028,
  = 0.038). For the female speakers, there were no delta increases in connection with the instruction-oriented video; and their delta values decreased rather than increased in POST2 relative to the level of PRE.
The rPVI measures also yielded significant effects of SEQUENCE on all rhythm units, that is, syllables (F[2,184]= 6.331, p=0.002,  = 0.064), consonants (F[2,184]= 4.842, p=0.009,
  = 0.050), vowels (F[2,184]= 13.981, p<0.001,
  = 0.132), voiced intervals (F[2,184]= 12.543, p<0.001,
  = 0.120), and unvoiced intervals (F[2,184]= 3.763, p=0.025,
  = 0.039). However, compared to the mean and delta measures above, these rPVI effects proved still more sensitive to the SEX and VIDEO conditions. For example, for the syllable-based rPVI, we found an increase after the CE intervention, that is, from PRE to POST1. But this only applied to the effect-oriented video (SEQUENCE*VIDEO: F[2,184]= 3.279, p=0.040,
  = 0.035), and only male speakers were able to preserve this increase in their POST2 performances (SEQUENCE*SEX: F[2,184]= 3.155, p=0.045,
  = 0.033) – see Figure 24.6(b). That is, the instruction-oriented video was not able to trigger a significant rPVI increase, and, for female speakers, this increase was not robust enough to be carried over from POST1 to POST2 performances (i.e., the PRE versus POST2 difference was not significant).
For the vowel-based rPVI, both sexes behaved similarly. Results showed an increase from the PRE rPVI to the POST1 rPVI, but again only in connection with the effect-oriented video (SEQUENCE*VIDEO: F[2,184]= 7.095, p=0.001,  = 0.072), and at POST2 the increase returned again to the lower rPVI level of the PRE performance. That is, the vowel-based rPVI increase was not robust enough to be preserved until after the distractor task.
For the consonant-based rPVI, results showed a significant increase, but only for the male participants in the effect-oriented video condition (SEQUENCE*SEX: F[2,184]= 2.996, p=0.049,  = 0.028; SEQUENCE*VIDEO: F[2,184]= 3.068, p=0.047,
  = 0.030). Neither did the female speakers show a similar consonant-based rPVI increase, nor was the instruction-oriented video able to trigger such an increase.
For the voiced and unvoiced speech units, the results patterns were overall similar to those of the vowels and consonants, respectively (voiced intervals: SEQUENCE*VIDEO: F[2,184]= 4.202, p=0.016,  = 0.044; unvoiced intervals: SEQUENCE*SEX: F[2,184]= 3.012, p=0.048,
  = 0.029; SEQUENCE*VIDEO: F[2,184]= 3.113, p=0.044,
  = 0.032).
24.3.2 Intonation, Timbre, Timing, and Loudness
The MM-MANOVA on intonation, timbre, timing, and loudness yielded, overall, a significant main effect of SEQUENCE (i.e., PRE versus POST1 versus POST2: F[46,324]= 2.449, p<0.001,  = 0.258) as well as a significant interaction of SEQUENCE and VIDEO (F[46,324]= 1.166, p= 0.018,
  = 0.179). The factor SEX was not significant, but there was a three-way interaction SEQUENCE*VIDEO*SEX (F[46,324]= 2.162, p<0.001,
  = 0.235).
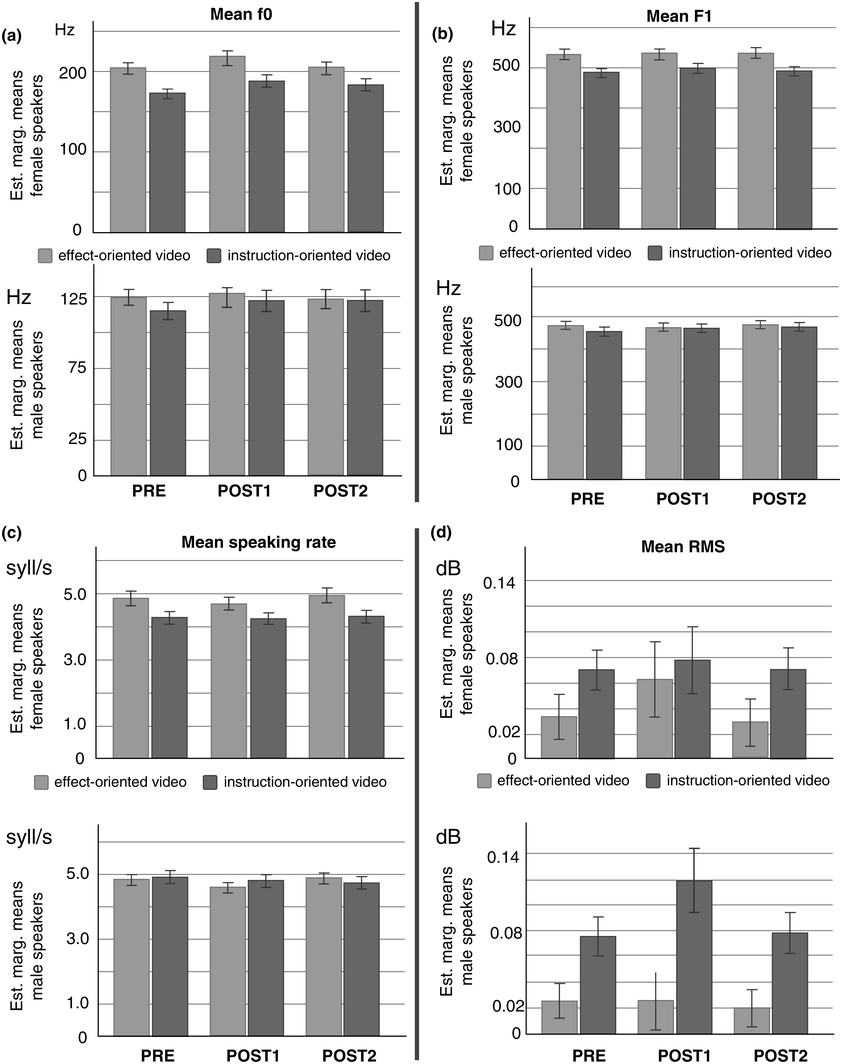
Like for the rhythm results, the effect pattern created by the CE intervention was complex. Moreover, the nature of the effects differed between male and female speakers (i.e., as a function of SEX) as well as between the two VIDEO conditions. We will summarize the overall pattern by addressing the four types of measures one by one below. Figures 24.7(a) and (d) show example results patterns for each type of measurement.
First, as regards intonation, we obtained significant effects of SEQUENCE on mean f0 level (F[2,184]= 10.014, p<0.001,  = 0.098) as well as on f0 minimum (F[2,184]= 5.465, p=0.009,
  = 0.056) and f0 maximum (F[2,184]= 6.329, p=0.003,
  = 0.064). For all measures, the effects of SEQUENCE manifested themselves as an increase in f0, particularly from PRE to POST1 (see Figure 24.6(a) for mean f0). Furthermore, in terms of effect sizes, the increase was stronger for the instruction-oriented VIDEO condition. It was also more robust in this VIDEO condition in the sense that the increase from PRE to POST 1 also remained significant in the PRE versus POST2 comparison, especially for the f0 minimum (mean f0 level: F[2,184]= 2.752, p=0.069,
  = 0.029; f0 minimum: F[2,184]= 3.772, p=0.034,
  = 0.039). Finally, we saw SEQUENCE*SEX interactions for the mean f0 and the minimum f0 (mean f0 level: F[2,184]= 3.962, p=0.022,
  = 0.041; f0 minimum: F[2,184]= 4.800, p=0.015,
  = 0.050). The interactions reflected that the f0 increases induced by the CE were overall more pronounced and robust for the male than for the female speakers (Figure 24.7a).
The results for timbre were in many respects similar to those of intonation. For example, the CE associated with a significant effect of SEQUENCE in the form of an increase in the voice quality measure h1–h2 (F[2,184]= 4.170, p=0.017,  = 0.043). However, the increase mainly relied on one speaker SEX, that is, females (SEQUENCE*SEX: F[2,84]= 3.662, p=0.035,
  = 0.037), and it was more strongly pronounced for the instruction-oriented VIDEO condition (SEQUENCE*VIDEO: F[2,84]= 4.987, p=0.008,
  = 0.051). Likewise, we found increases in the mean levels of the F1 and the F3. These increases were more strongly pronounced for the instruction-oriented VIDEO condition – see Figure 24.7(b) (F1, SEQUENCE*VIDEO: F[2,184]= 3.497, p=0.032,
  = 0.037; F3, SEQUENCE*VIDEO: F[2,184]= 3.006, p=0.050,
  = 0.032). Moreover, the F1 and F3 increases came out significant only for one speaker SEX. Unlike for h1–h2, it was the male speaker group that showed F1 and F3 increases from before to after the CE (F1, SEQUENCE*SEX: F[2,184]= 3.772, p=0.025,
  = 0.039; F3, SEQUENCE*VIDEO: F[2,184]= 5.886, p=0.003,
  = 0.060). This included that the F1 and F3 increases produced after the CE were maintained by male speakers also after the distractor task in the POST2 condition. This was not true for the female speakers.
Results on intonation, timbre, timing, and loudness illustrated by one parameter each.
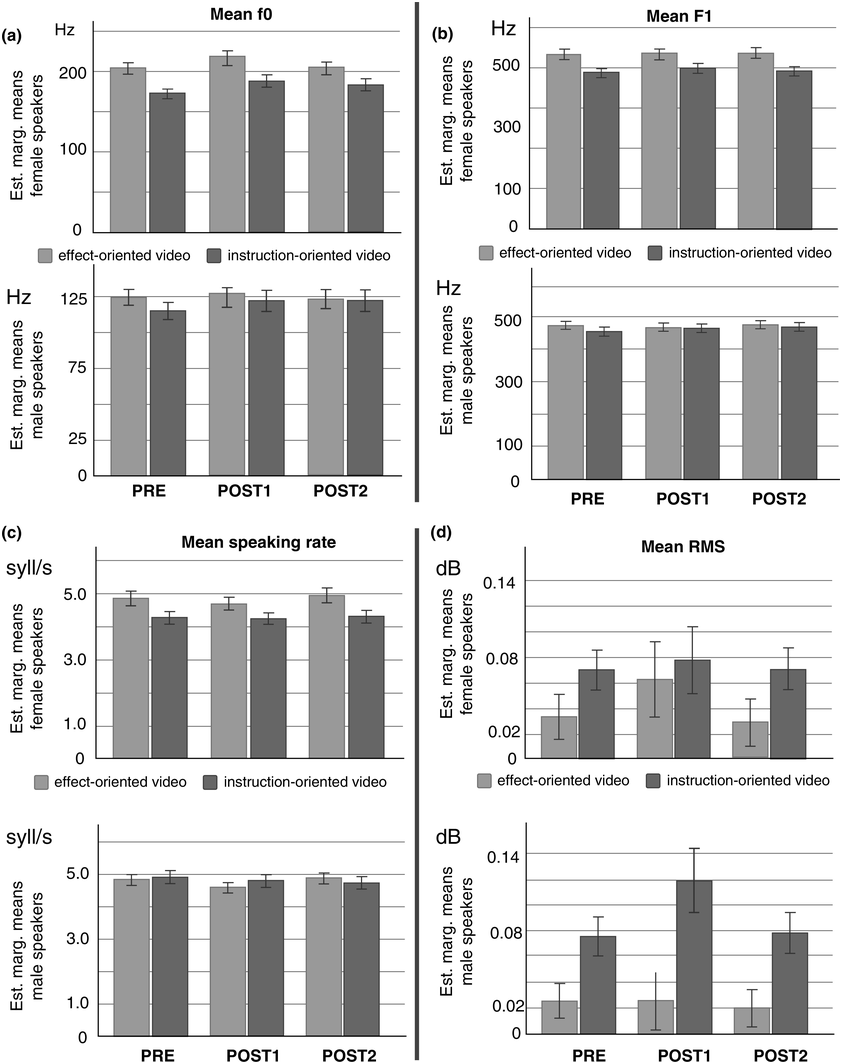
Figure 24.7 Long description
Panel A depicts two bar graphs with error bars. The mean values of estimated marginal means for female speakers are as follows. Set a: Top. Effect-oriented video; 6.5 for post 1, 5.9 for post 2, and 4.8 for pre. Instruction-oriented video; 6.0 for post 1, 4.8 for post 2, and 4.8 for pre. Bottom. Effect-oriented video; 5.0 for post 1, 5.0 for post 2, and 4.5 for pre. Instruction-oriented video; 4.4 for post 1, 4.0 for post 2 and 3.9 for pre. Panel B depicts a bi-directional and an upside-down bar graph with error bars. The mean values of estimated marginal means for female speakers are as follows. Set b: Top. Effect-oriented video; 0.2 for post 2, 0.1 for post 1 and minus 0.5 for pre. Instruction-oriented video; minus 0.5 for pre. minus 0.4 for post 1 and minus 0.38. Bottom. Effect-oriented video; minus 0.58 for pre, minus 0.45 for post 1 and minus 0.4 for post 2. Instruction-oriented video; minus 0.58 for pre, minus 0.44 for post 1 and minus 04 for post 2. The values are estimated.
Timing characteristics were also significantly affected by SEQUENCE, that is, the CE intervention. The effects were restricted to two features: pause count (F[2,184]= 5.989, p=0.003,  = 0.061) and speaking rate (F[2,184]= 3.987, p=0.020,
  = 0.041); and, unlike for intonation and timbre, there were no significant interactions between the CE effects (i.e., the factor SEQUENCE) and SEX. That is, both male and female participants changed speaking in the same way from before to after the CE. Specifically, the pause count increased from PRE to POST1. In POST2 the pause count decreased again to the same level as in PRE. This up-and-down occurred in both the instruction-oriented and the effect-oriented VIDEO condition. Like a mirror image of the number of pauses, participants’ speaking rates decreased significantly from PRE to POST1, but then also increased significantly again in POST2 to the same level as in PRE. The only difference to the pause count effect was that this slowing down and speeding up was more strongly pronounced for the effect-oriented VIDEO condition, in that way creating a significant SEQUENCE*VIDEO interaction (F[2,184]= 3.885, p=0.022,
  = 0.040) – see Figure 24.7(c).
Finally, the results on loudness also show an up-and-down change in speaking behavior from PRE to POST1 to POST2. This effect of SEQUENCE emerged for both mean RMS (F[2,184]= 12.869, p<0.001,  = 0.123) and RMS variability (F[2,184]= 5.790, p=0.004,
  = 0.059). Unlike for pause count and speaking rate, however, there was a three-way interaction of SEQUENCE, SEX, and VIDEO (mean RMS: F[2,184]= 7.363, p<0.001,
  = 0.074; RMS variability: F[2,184]= 4.796, p=0.009,
  = 0.050). That is, the higher and more variable loudness levels in POST1 (as compared to both PRE and POST2) occurred for female speakers only in connection with the effect-oriented video condition, and for male speakers only in connection with the instruction-oriented video condition – see Figure 24.7(d).
24.3.3 Jaw Lowering
The MM-MANOVA on the jaw-lowering data of the MARRYS cap showed a main effect of SEQUENCE (F[6,340]= 3.533, p=0.002,  = 0.059) as well as an interaction of SEQUENCE with VIDEO (F[6,340]= 4.336, p<0.001,
  = 0.071). There was no significant SEQUENCE*SEX interaction and also no significant three-way interaction.
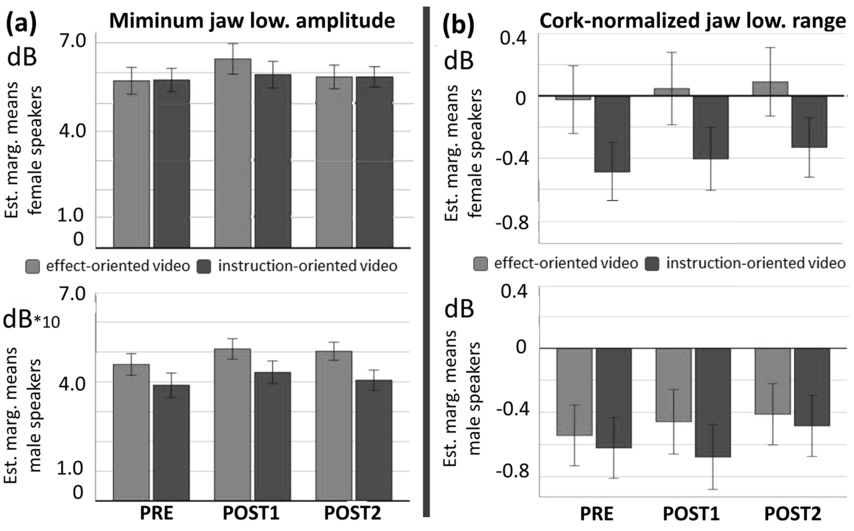
On this basis, the following results pattern emerged, illustrated by two examples in Figures 24.8(a) and (b) of the minimum jaw-lowering amplitude on the one hand and the cork-normalized jaw-lowering range on the other.
Results on jaw lowering represented by absolute minimum and normalized range.
Estimated marginal means and error bars (95% CI) for (a) the minimum jaw-lowering amplitude and (b) the normalized jaw-lowering range, where values below zero indicate that speakers opened their mouth less than in the CE condition. Dark gray bars indicate the effect-oriented and light-gray bars the instruction-oriented video conditions. Top panels show the female speakers’ and bottom panels the male speakers’ results. Note that the male display of jaw-lowering amplitude shows dB*10 to account for the head-size differences between male and female speakers on absolute amplitude offset levels (Alam et al., Reference Alam, Mohd Noor, Basri, Yew and Wen2015).
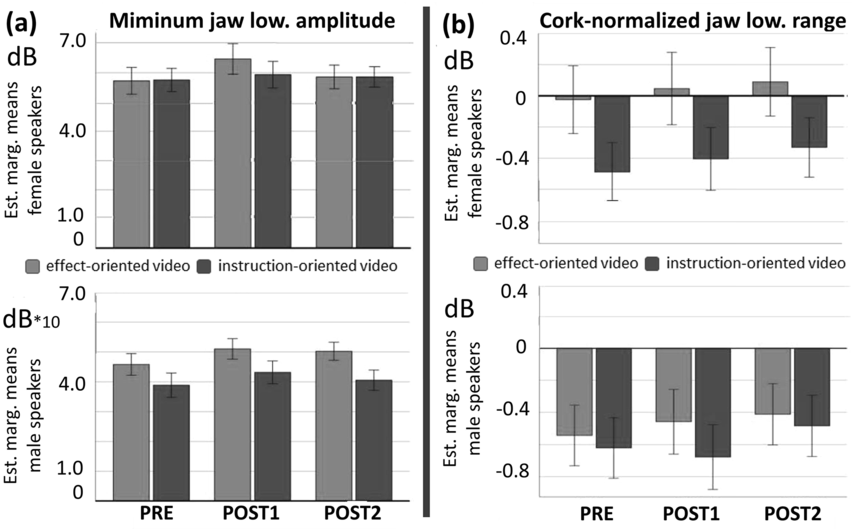
Figure 24.8 Long description
The illustration is in a tabular form. It has six columns and two rows. The column is titled Sequence, N equals 16, Pre versus Post 1 versus Post 2 performances of North Wind and the Sun. The column headers are as follows. Text reading dummy run, Text reading baseline pre, C E intervention, text reading after C E post 1, Distractor pers test survey and text reading after C E P O S T 2.
The average jaw-lowering amplitude measure resulted in no separate significant main effect of SEQUENCE, but we found a significant SEQUENCE*VIDEO interaction (F[2,172]= 5.387, p=0.006,  = 0.061). The interaction reflects that the instruction-oriented video condition brought about an increase in jaw-lowering amplitude, in particular from PRE to POST2. This increase occurred similarly for male and female speakers and was equally absent for both sexes in the effect-oriented video condition. The SEQUENCE*SEX interaction was thus not significant.
The three jaw-lowering measures of minimum amplitude, maximum amplitude, and amplitude range were all significantly affected by the CE intervention (SEQUENCE). The effects were such that the minimum amplitude became successively lower (F[2,172]= 3.725, p=0.026,  = 0.042 – see Figure 24.8(a)) and the maximum amplitude successively higher (F[2,172]= 3.869, p=0.023,
  = 0.043) from PRE to POST1 to POST2. The combination of these two effects, that is, a more contrastive jaw-lowering pattern within sentences, made the amplitude range increase from PRE to POST1 to POST2, with an effect size stronger than those of minimum and maximum amplitude (F[2,172]= 8.924, p<0.001,
  = 0.094). There was a tendency of these individual and combined jaw-movement changes to be more pronounced in the instruction-oriented video condition. However, the interaction SEQUENCE*VIDEO did not reach significance; neither did the SEQUENCE*SEX interaction.
Finally, the cork-normalized main measures both showed significant main effects of SEQUENCE (F[2,172]= 3.869, p=0.023,  = 0.043; F[2,172]= 8.924, p<0.001,
  = 0.094) – see Figure 24.8(b). Recall from Section 24.2.5.3 that we normalized the amplitude values per speaker to those that were measured during the CE intervention. Thus, measurements of 0 or higher (i.e., positive values) indicate that the speakers opened their mouths and lowered their jaws more during the North Wind and the Sun performances than during the actual CE. Measurements below 0 mean the opposite.
Based on that, we can see in Figure 24.8(b) that, unlike the male speakers, the female speakers showed mouth openings or jaw lowerings in POST1 and POST2 that were on average larger than those caused by the cork inside their mouth. We can also see that the mouth openings or jaw lowerings were more pronounced and similar to those caused by the cork inside the mouth in the effect-oriented video condition (the corresponding SEQUENCE*VIDEO interaction showed a significant trend: F[2,172]= 2.622, p=0.076,  = 0.030), and that the biggest changes towards stronger mouth openings/jaw lowerings occurred from POST1 to POST2, not from PRE to POST1. However, as we only have a few speakers per gender and video condition, these results should be taken with caution.
24.3.4 Results Summary
Table 24.2 provides an overview of the results. We have counted the number of measures (dependent variables) for which a significant effect of the CE emerged in the PRE versus POST1 comparisons. Because of the multitude of individual measures, we have summed up these significant effects per measurement type. This is what the column “change” shows. Additionally, we have specified in Table 24.2 if these significant CE effects were found in the effect-oriented video condition – “V-eff” – or in the instruction-oriented video condition – “V-ins.” The column named “robust” specifies how many of the PRE-to-POST1 “changes” persisted also in the POST2 performances. The percentages “Tot” put the absolute numbers in relation to the total number of measures (dependent variables) for which a CE effect could have potentially occurred. All this data is separately presented for the male and the female speaker samples.
Absolute frequencies of changes induced by the CE per measure or type of measure as well as in % across a whole set of measures, displayed separately for the (m)ale and (f)emale speaker groups. V-eff and V-ins refer to the effect- and instruction-oriented video conditions; “robust” refers to significant PRE-to-POST2 differences. Note that Max amplitude and Range amplitude include the normalized and non-normalized MARRYS cap measurements.
| Measure | Sex | change | V-eff | V-ins | robust |
|---|---|---|---|---|---|
| Acoustic rhythm features | |||||
| Mean measures | m | 5 | 5 | 0 | 0 |
| f | 5 | 5 | 2 | 0 | |
| Delta measures | m | 5 | 5 | 0 | 4 |
| f | 2 | 2 | 0 | 0 | |
| rPVI measures | m | 5 | 5 | 0 | 2 |
| f | 3 | 2 | 0 | 0 | |
| Tot % | m | 100.0 | 100.0 | 0 | 33.3 |
| Tot % | f | 66.7 | 81.2 | 18.2 | 0 |
| Acoustic prosody features | |||||
| Pitch | m | 4 | 2 | 2 | 2 |
| f | 4 | 2 | 4 | 0 | |
| Timbre | m | 2 | 0 | 2 | 2 |
| f | 4 | 0 | 4 | 2 | |
| Timing | m | 3 | 3 | 2 | 0 |
| f | 3 | 1 | 2 | 0 | |
| Loudness | m | 2 | 1 | 1 | 0 |
| f | 2 | 1 | 1 | 0 | |
| Tot % | m | 71.4 | 46.2 | 53.8 | 26.7 |
| Tot % | f | 85.7 | 36.4 | 63.8 | 13.3 |
| MARRYS cap jaw-lowering features | |||||
| Mean amplitude | m | 1 | 0 | 1 | 1 |
| f | 1 | 0 | 1 | 1 | |
| Min amplitude | m | 1 | 0 | 1 | 1 |
| f | 1 | 1 | 1 | 1 | |
| Max amplitude | m | 2 | 2 | 2 | 2 |
| f | 2 | 0 | 2 | 2 | |
| Range amplitude | m | 2 | 2 | 2 | 2 |
| f | 2 | 2 | 2 | 2 | |
| Tot % | m | 100.0 | 50.0 | 50.0 | 100.0 |
| Tot % | f | 100.0 | 33.3 | 66.7 | 100.0 |
Here is an example: For the delta type of rhythm measures, there were five significant CE effects from PRE to POST1 for the male speakers (“change” = 5), and for the female speakers there were two significant CE effects (“change” = 2). All of these effects emerged in the effect-oriented video condition “V-eff,” and for the male speakers, four of the five effects persisted in the POST2 condition (“robust” = 4). In contrast, for the female speakers, the two significant CE effects disappeared again in the POST2 condition (“robust” = 0). For the delta measures, the maximum number of effects that could show a significant CE effect was five. The same applied to the mean and rPVI types of measures. For the male speakers, 15 of 15 possible effects occurred from PRE to POST1 across all three measurement types, therefore the Tot % of “change” is 100%; for the female speakers, it was 10 out of 15 measures, that is, 66.7%.
According to Table 24.2, the CE had a significant effect on the acoustic rhythm measures. For the male participants, CE affected all measures (100%); for the female participants, changes still extended over the majority of measures (66.7%). For both speaker groups, the changes were primarily triggered by the effect-oriented video, and almost none of the changes proved robust enough to be carried over from POST1 into POST2 performances. On the whole, the CE had a more comprehensive and robust effect on the acoustic rhythm structures of male than of female speakers.
This higher robustness of cork effects for male speakers also applied to the other measures of acoustic prosody. With 26.7%, almost twice as many cork effects remained in the male speakers’ POST2 performances than in the female speakers’ performances (13.3%). In terms of the number of changed parameters, the CE affected male and female speakers’ prosodies to similar degrees, that is, 71.4% versus 85.7%. That is, not every measured parameter was changed, especially not in the domains of intonation and timbre. For timing and loudness parameters, however, the percentage was 100% for both sexes. In contrast to the rhythm measures, prosodic changes were mainly triggered by the instruction-oriented video condition – for women even more so than for men. In addition, all robust effects go back to the instruction-oriented video condition.
As regards the jaw-lowering signals, we found a similar advantage of the instruction-oriented video in triggering significant PRE-to-POST effects in speakers – and in triggering effects that remain robust in POST2 performances. It is noteworthy that the robustness of the triggered effects was 100% – for male and female participants. The percentage of CE-affected jaw-lowering parameters was also 100% for both sexes. So, the CE clearly had the strongest and most robust effects on articulation patterns (jaw-lowering amplitudes) – and less strong and robust effects on acoustic patterns of rhythm and prosody.
24.4 Discussion
In guidebooks and seminars on public speaking, it is not uncommon that recommendations and methods are passed on to learners without these recommendations and methods having ever been subjected to scientific testing. In this way, a knowledge base is created that gains credibility through tradition and at some point is no longer critically questioned. The present study is part of a line of research that is meant to tackle this issue. We analyze central claims of rhetoric and media training using experimental means.
The present study was on the CE, a very popular method in rhetoric and media training. Based on a within-subjects before–after comparison and an additional between-subjects difference between instruction-oriented and effect-oriented video conditions, the following questions were asked: Are there significant differences in the participants’ vocal performances between PRE and POST? If so, (a) is there a significant interaction of these PRE-to-POST effects with the video condition and (b) do these significant differences persist also in POST2 performances?
Three main conclusions can be drawn from the results summary (see Table 24.2). First, the CE indeed has a significant and sustained effect on mouth-opening (i.e., jaw-lowering) patterns in speech. Rhetoric and media trainers are right when stating that the exercise changes the way participants speak afterwards (see Khidr, Reference Khidr2017; Knoppers et al., Reference Knoppers, Obdeijn and Giessner2021; Bernhardt, Reference Bernhardt2022). Second, however, our data also suggest that these articulatory effects are not consistently and sustainably reflected in the acoustics of rhythm and prosody. On the contrary, after only a short distractor element such as a five-minute personality test, most of the induced rhythmic and prosodic cork effects disappear to the extent that they are no longer detectable in POST2-performance signals (in terms of significant differences relative to PRE signals). This applies in particular to female participants. Finally, it seems that male participants benefit more from the CE than female participants.
These sex-related findings are consistent with Tang et al. (Reference Tang, Hannah and Jongman2015), who reported based on a contrastive analysis of plain versus clear speeches “that male speakers often show greater clear speech effects than female speakers, particularly involving greater degrees of horizontal lip stretch and jaw movement” (p. 10). Our findings also fit in with Weirich et al. (Reference Weirich, Fuchs, Simpson, Winkler and Perrier2016). They showed that male speakers produce, in plain speech, by default less jaw lowering (i.e., a smaller mouth opening) than female speakers. So, after a CE stimulation of clear speech, male speakers should have a greater potential to enhance their movements and prosodies than female speakers, which corresponds to what we found. The underlying reason for these differences between male and female speakers is still largely unknown, and our results are not suitable to shed further light on existing explanatory approaches. Tang et al. (Reference Tang, Hannah and Jongman2015) speculate that the male speakers’ greater articulatory movements in clear speech could be attributed to their larger-size articulators relative to females’, which allow more room for variability and more extreme speech articulation, given that movement displacement is generally positively correlated with the size of the vocal tract and its articulators. In our opinion, this is a plausible idea, which can be combined with the sex differences in public-speaking anxiety to account for the male–female robustness differences in Table 24.2. Yet, further research is required to test these assumptions.
How exactly does the CE change the rhythmic and general prosodic acoustics of speech? To put it briefly and descriptively, the speaking rate decreases, causing the sound-segment durations to increase, especially those of vowels and voiced intervals. Thus, the speech becomes on the whole more sonorous. At the same time, duration structures become richer and more contrasty. For example, short, unstressed syllables become even shorter; and long, stressed syllables become even longer. This also increases loudness level and loudness variability. Together with the increase in loudness level, the voice becomes more high-pitched overall, but not more melodious, for example, in the form of an increased f0 range. The timbre of the voice changes in the form of higher F1 and F3 values and, for female speakers, also in the form of higher h1–h2 and h1–A3 values, which is indicative of a clearer (less breathy) and more powerful voice, produced with more vocal effort. Pauses become more frequent and longer, resulting in a more structured speaking performance of both sexes.
It is well known that F1 is the acoustic mirror image of jaw lowering; that is, there is a negative correlation of F1 values with jaw-lowering amplitudes (Traunmüller, Reference Traunmüller1984). The increase in F1 we found is therefore generally consistent with the larger range and maximum amplitude of jaw lowering observed in the MARRYS cap signals – even though the stronger jaw lowering has proven to be more robust than the acoustic F1 increase (in terms of a PRE versus POST2 significance), especially for female participants. This sex-specific finding is interesting and should be further investigated insofar as it seems to match with physiological studies showing that although women have smaller maximum jaw-lowering amplitudes than men, they can produce a larger jaw-lowering range relative to the movement angle (Pullinger et al., Reference Pullinger, Liu, Low and Tay1987).
The rise in F3 is harder to link to articulatory patterns. In our view, the most plausible explanation for the F3 increase is as follows. The CE not only caused the participants’ mouths to open but also spread their lips. F3 is strongly correlated with speakers’ lip configuration. Lip rounding leads to lower F3 values and lip spreading, that is, smiling, to higher F3 values (Fagel, Reference Fagel, Esposito, Campbell, Vogel, Hussain and Nijholt2010). Thus, given that we found F3 increases, it is plausible to assume – and consistent with our visual observations during the experiment – that the CE resulted in a more smiling way of speaking in POST1 and POST2 performances.
With the increases in F3, we replicated the results of Leyns et al. (Reference Leyns, Corthals and Cosyns2021) as well as their finding that these increases vary across speakers. In contrast to Timmermans et al. (Reference Timmermans, Coveliers, Wuyts and Van Looy2012), we were for the first time also able to find articulatory effects of CE interventions, and unlike in all previous studies, we show for the first time here that CE effects extend beyond pronunciation and the acoustics of a particular formant frequency. Rather, our findings support the previously unproven claims of rhetorical guidebooks and media trainers that the CE affects the voice (Alburger, Reference Alburger2014). That the voice gets “deeper and fuller” after the CE, as claimed by Knoppers et al. (Reference Knoppers, Obdeijn and Giessner2021), is not perfectly in line with our data, though, as the f0 mean actually increased rather than decreased from PRE to POST performances. However, given that loudness increased as well and it is known that a higher loudness level can bias humans to perceive a lower pitch level (Cohen, Reference Cohen1961), perhaps the effect described by Knoppers et al. is a psychoacoustic rather than a purely acoustic one. That voices can get “fuller” is consistent with the h1–h2 and h1–A3 increases we found as well as with the increases in vowel and sonorant-interval durations. Furthermore, the more “open and vivid articulation” that Khidr (Reference Khidr2017) holds out in prospect for CE users is met by our results on jaw-lowering and acoustic rhythm structure.
Regarding these comparisons, what are the practical implications of our results? Based on the known correlations between acoustic parameters and perceived speaker charisma (for Western cultures and/or Western Germanic languages, see, for example, Strangert and Gustafson, Reference Strangert and Gustafson2008; Rosenberg and Hirschberg, Reference Rosenberg and Hirschberg2009; Niebuhr and Skarnitzl, Reference Niebuhr and Skarnitzl2019, Reference Niebuhr and Skarnitzl2021), we can conclude that only a few parameters, such as the speaking rate, were changed by the CE to the detriment of speakers (the rate is positively correlated with charisma but decreased rather than increased after the exercise). Some parameters such as the f0 range remained unaffected. However, the majority of the acoustic parameters were favorably changed by the CE, which is why we can assume that the exercise is basically capable of increasing perceived speaker charisma, at least temporarily. The findings of our present study thus speak in favor of continuing to use the CE in rhetoric and media training.
From a practical viewpoint, it is also noteworthy that type, magnitude, and robustness of the cork-induced effects depended on the type of video presented. In order to achieve rhythmic-acoustic effects, the effect-oriented video seemed to be better suited. For general prosodic effects, on the other hand, the instruction-oriented video was the better trigger. These asymmetrical findings must be examined, replicated, and understood in follow-up studies. For now, the conclusion can only be that the instruction can have a significant effect on how – and how robustly – the CE affects the subsequent speech performances of its users. Rhetoric and media trainers should therefore instruct their participants carefully, monitor changes following the CE, and control and support them in a targeted manner, until more detailed insights are available on how specific instructions affect post-exercise performances. One thing is clear, though: The cork-induced changes on rhythm and prosody seem to be more than simple placebo effects caused by coaches and trainers praising the exercise’s tradition and effectiveness. If this were the case, then we would not have found any PRE-to-POST1/2 effects in the instruction-oriented video condition. Rather, all effects would have been concentrated in the effect-oriented video condition. By contrast, in our data, numerous CE effects emerged after the instruction-oriented video. Praising the CE in advance does not make it more effective; in fact, it can prevent some effects (especially of the vocal performance) from occurring.
Of course, our conclusions are also subject to a number of limitations. The most important one is certainly the small sample. Assuming that the effect of the CE has an individual component, it is quite possible that the differences related to the video and sex conditions are partly caused by individual speakers. This is especially true for the factor of speaker sex. An important task of subsequent studies is therefore to replicate and further differentiate the results using a larger sample. In addition, such a larger sample should also include a control-group condition. Since our study lacked such a condition, we cannot completely rule out that (some of) the CE effects were mere training or familiarization artifacts of a repeated performance of the North Wind and the Sun text. In general, however, the results speak against such an overinterpretation of repetition artifacts as CE intervention effects. First, such artifacts would have had a homogeneous impact on speakers’ performances. Thus, measures would have either increased or decreased continuously from PRE to POST1 to POST2, whereas most of our results showed bidirectional changes from PRE to POST2. Second, we had included a dummy text performance at the beginning of the experiment; and three–four readings of only six sentences hardly seem sufficient to produce a fatigue effect from PRE to POST2. Furthermore, the interactions of the CE effects with speaker sex and video condition speak against pure repetition artifacts, but point to real behavioral patterns owed to the intervention conditions.
A further limitation concerns the jaw measurements. We used the KTH RespTrack system (Heldner et al., Reference Heldner, Włodarczak, Branderud and Stark2019) in an innovative way to implement the MARRYS cap concept in the current study. To that end, the RespTrack stretching belt was attached under the speaker’s chin and then ran along both sides of the cheeks to the cap on the head. Speakers were able to adjust the tension of the belt according to their individual comfort level. Since signal offsets due to speaker-individual tension levels were set to 0 prior to recording, the belt adjustment was not able to affect the measured values per se. What we could not rule out, however, was that the tension of the stretching belt exerted an individual degree of counter-pressure on the speaker’s jaw-lowering movements. Therefore, follow-up studies should use the genuine MARRYS system, which has been optimized to largely avoid such counter-pressure biases (Svensson Lundmark et al., Reference Svensson Lundmark, Ericksson, Niebuhr, Tiede and Wei-Rong2023).
A further limitation concerns the fact that there is a wide range of options in how to apply the CE. One of our reviewers, for example, asked what would have happened if we had used North Wind and the Sun (rather than “Der Zwölf Elf”) also for the CE intervention. We can only speculate about an answer, but we assume that the results might have come out clearer and more robust in that case (in the sense of higher percentages in Table 24.2), due to better motor learning and a more direct motor transfer from the CE to POST1/2 performances. We decided against this option because it does not correspond to common practice. For one thing, learners of public speaking hardly ever have a text that they want to specifically prepare during rhetoric or media training (such training is more about acquiring general, transferable skills); and, for another thing, trainers like to use special texts that require very extensive (compensatory) articulation movements during a CE intervention and that have an inherently regular rhythmic structure, such as “Der Zwölf Elf.” In view of this, the results we obtained here are perhaps more conservative than necessary, but probably also characterized by a higher level of ecological validity.
Further CE options concern the following questions: How often is the exercise used and for how long do the participants train with the cork? How often is the exercise repeated? How long are the breaks between exercises? Which speaking tasks/texts are used? In this experiment, we tested only one single setting from this (non-exhaustive) range of options. It is possible that other settings would have yielded different results. On the other hand, we have certainly tested a minimal setting – and have, based on that, already found supporting evidence for the effectiveness of the CE, especially on rhythm, timing, and loudness measures. It is reasonable to assume that more intensive training settings would yield even clearer and inter-individually more consistent CE effects. Especially since rhetorical coaches and media trainers often stress that the CE unfolds its full potential “if done regularly” (Bernhardt, Reference Bernhardt2022:318), investigating effects of training time and/or training intensity is an obvious task of follow-up studies, in particular with regard to the question of if the CE effects can consolidate (in terms of a higher level of robustness – see Table 24.2), and if so, when and under what conditions.
Answers to such questions can also be useful if the CE is to be used beyond rhetoric and media training. We primarily think of educational (e.g., language teaching) or therapeutic applications, for example, to fight monotonous voices (due to Parkinson’s disease), or to learn or relearn a certain speaking rhythm – see the experiences of Erickson and Niebuhr (Reference Niebuhr, Barbosa, Rüdiger and Drayter2023) with teaching “jaw dancing” across languages. Especially in speech pathology, there seem to be hardly any modern cork studies (see Froeschels, Reference Froeschels1943; Perlstein and Shere, Reference Perlstein and Shere1946), which suggests that the potential of CE is hardly being exploited in that area. Over and above those applied contexts, the CE could also become a powerful stimulation and elicitation tool in linguistic research to better understand the production and perception (and underlying cognitive processes) of speech rhythm – see the critical discussion of speech rhythm in Nolan and Jeon (Reference Nolan and Jeon2014) on the one hand and the summary of the nested neural oscillation idea in Erickson and Niebuhr (Reference Niebuhr, Barbosa, Rüdiger and Drayter2023) on the other.
Summary
The conducted speech-production experiment tested for the first time the effectiveness of the CE, which is a popular technique in public-speaking and media training. We provided supporting evidence that the exercise is able to change users’ rhythm and prosody patterns – mostly temporarily – towards more sonorous and contrasty structures that, when interpreted in the context of known correlations, should be associated with a higher level of perceived speaker charisma.
Implications
First, interventions such as the CE have systematic effects on articulatory and acoustic rhythm patterns that can be used for educational or therapeutic purposes and, if necessary, further refined for these applications. Second, in line with previous findings, articulatory changes do not necessarily have specific acoustic consequences. Both are avenues for follow-up studies.
Gains
CE effects only proved robust for some parameters that varied with speaker sex and instruction. This raises questions about the implicit, individual learning of speech-production/rhythm patterns. Furthermore, the exercise intervention is suitable to create natural, contrastive, within-speaker stimuli with which the contribution of rhythm to perceived speaker charisma can be examined.
24.5 Acknowledgments
The authors are greatly indebted to Rongjie Shi and Katrina Norah Nabunjo for their assistance in recruiting participants and carrying out the experiment. We are also very grateful to Katrin Prüfig for recording the CE videos for us. Furthermore, we would like to thank our two reviewers, Laura Verga and Anna Fiveash, for their many insightful comments and questions on an earlier draft of this chapter as well as our editors Caroline Duchow, Lars Meyer, and Antje Strauss for patience, guidance, and feedback on style and title. Finally, note the first author (Oliver Niebuhr) is the founder and CEO of the speech-technology company AllGoodSpeakers ApS. Please visit the following link for a conflict-of-interest statement: https://oliverniebuhr.com/conflict-of-interest.html.

 Open access
