


1. Introduction
The Amundsen Sea Embayment is considered to be the part of the West Antarctic Ice Sheet most vulnerable to mass loss in response to recent ocean warming (Hughes, Reference Hughes1981; NRC, 2013; Scambos and others, Reference Scambos2017; Smith and others, Reference Smith2020). Thwaites Glacier (TG) is the largest outlet glacier in the ASE, and has been experiencing the fastest ice loss of all marine-terminating glaciers in Antarctica (Scambos and others, Reference Scambos2017). Intrusion of warm circumpolar deep water has increased basal melting of TG's ice shelf, reducing buttressing and leading to thinning and acceleration of inland ice (Jacobs and others, Reference Jacobs, Hellmer and Jenkins1996, Reference Jacobs, Jenkins, Giulivi and Dutrieux2011; Rignot and Jacobs, Reference Rignot and Jacobs2002; Payne and others, Reference Payne, Vieli, Shepherd, Wingham and Rignot2004; Jenkins and others, Reference Jenkins2010; Rignot and others, Reference Rignot, Jacobs, Mouginot and Scheuchl2013; Dutrieux and others, Reference Dutrieux2014; Holland and others, Reference Holland, Bracegirdle, Dutrieux, Jenkins and Steig2019; Smith and others, Reference Smith2020).
The grounding zone (GZ) of TG (Fig. 1, solid black line) currently occupies a transverse bedrock ridge along the northern flank of the West Antarctic Rift System that provides some stability (Rignot and others, Reference Rignot2019; Morlighem and others, Reference Morlighem2020). Large-scale ice-sheet models (e.g., Golledge and others, Reference Golledge2015; DeConto and Pollard, Reference DeConto and Pollard2016) and basin-specific models (e.g., Joughin and others, Reference Joughin, Smith and Medley2014), as well as observational studies (Mouginot and others, Reference Mouginot, Rignot and Scheuchl2014; Rignot and others, Reference Rignot, Mouginot, Morlighem, Seroussi and Scheuchl2014), indicate that too much loss of buttressing from thinning of TG's ice shelf can cause self-sustaining grounding-line retreat (‘marine ice-sheet instability’ or MISI; Weertman, Reference Weertman1974; Schoof, Reference Schoof2007), with the potential to raise global sea level ~0.65 m from the modern Thwaites drainage and ~3.3–5.3 m including interconnections to other basins (Bamber and others, Reference Bamber, Riva, Vermeersen and LeBrocq2009; Morlighem and others, Reference Morlighem2020).
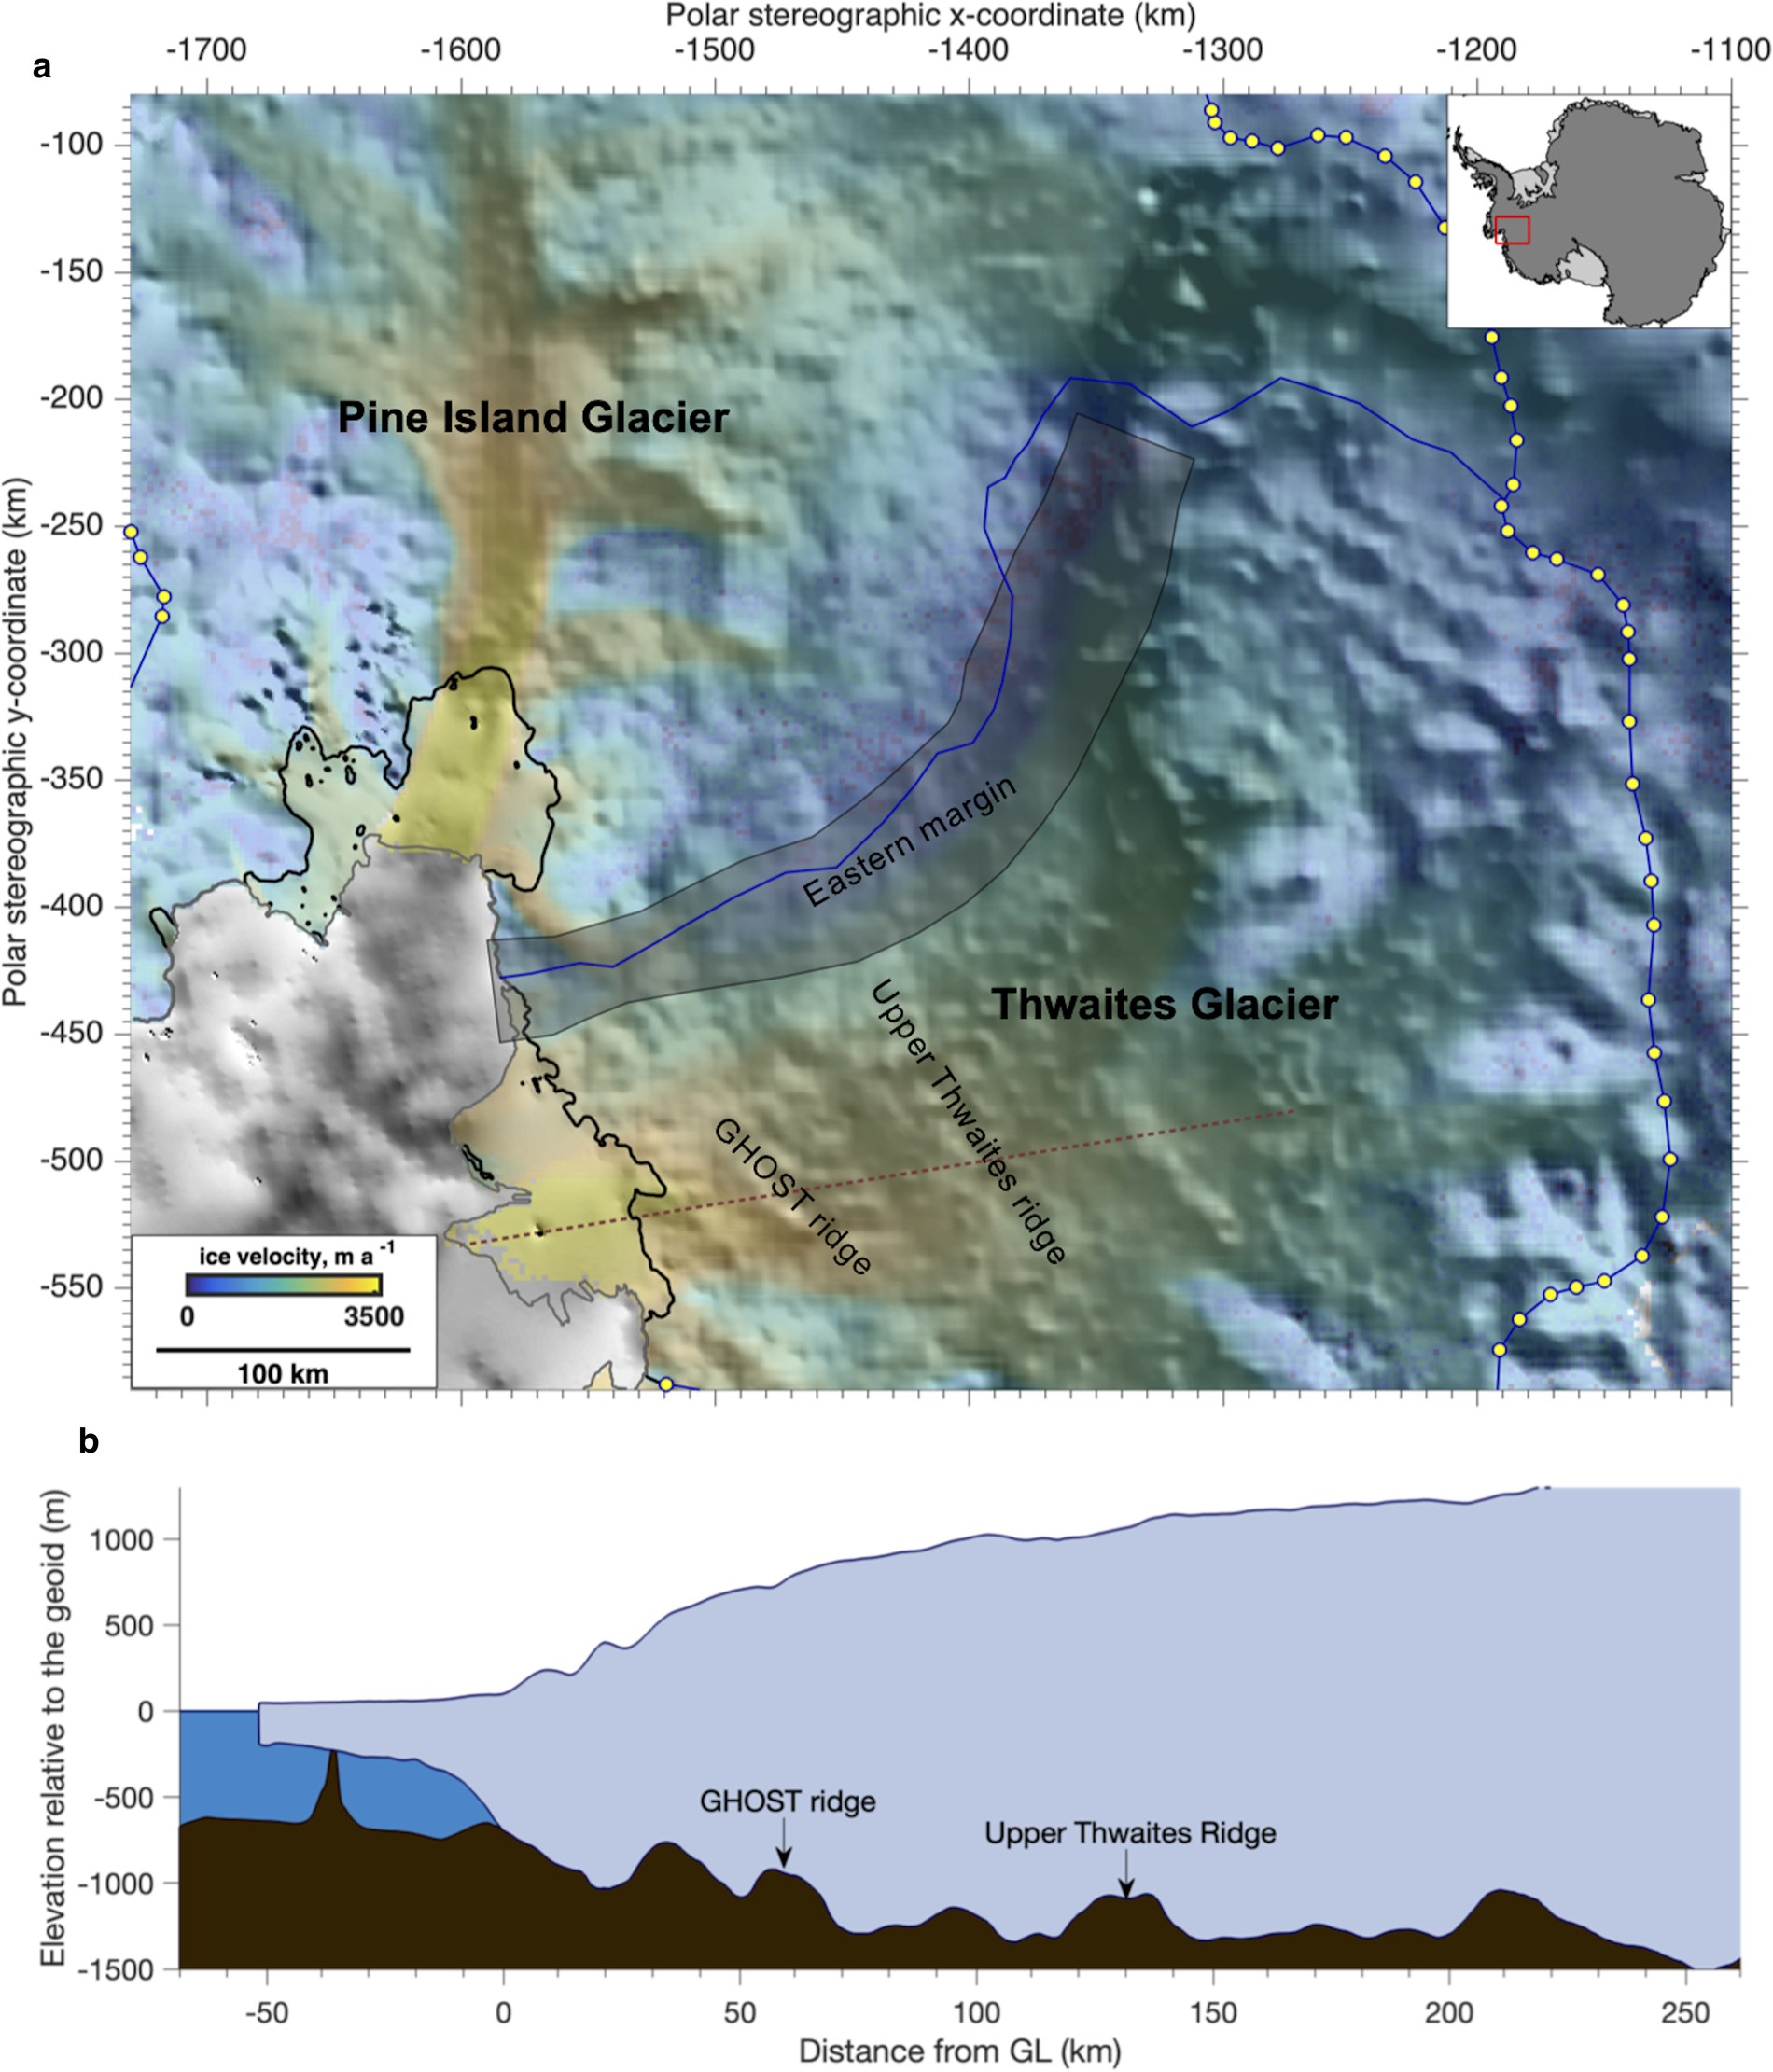
(a) MEaSURESv2 ice velocities (overlay; Mouginot and others, Reference Mouginot, Rignot, Scheuchl and Millan2017) show how Thwaites and Pine Island glaciers flow over inland-deepening topography (shading; from BEDMAP2 at 1 km resolution, Fretwell and others, Reference Fretwell2013), connecting these outlet glaciers to marine basins in interior WAIS outside our modeled domain (domain edge indicated by blue line, yellow markers). Thwaites' eastern shear-margin zone (shaded box bounding margin by ~50 km) does not exhibit strong topographic control, suggesting that the modern catchment boundary (solid blue line) could migrate. BEDMAP2 data (b) along red transect in panel a) indicate the modern grounding line (solid black line in panel a and point at 0-km in panel b) along with GHOST ridge (~55 km upstream of modern position) and Upper Thwaites ridge (~130 km upstream of modern position), which could serve to slow future inland migration following grounding line retreat from its current location. Ice-front and grounding line data from Mouginot and others (Reference Mouginot, Rignot, Scheuchl and Millan2017).
Models show how the onset and rate of rapid mass loss from Thwaites depend on numerous factors, including the effects of anthropogenic forcing and natural climate variability on large-scale atmospheric and oceanic behavior, local oceanic and ice-shelf responses, calving laws, the detailed bathymetry and much more (e.g., Scambos and others, Reference Scambos2017; Waibel and others, Reference Waibel, Hulbe, Jackson and Martin2018; Hoffman and others, Reference Hoffman, Asay-Davis, Price, Fyke and Perego2019; Robel and others, Reference Robel, Seroussi and Roe2019; Yu and others, Reference Yu, Rignot, Seroussi, Morlighem and Choi2019; Hogan and others, Reference Hogan2020). Many of these are being investigated through the International Thwaites Glacier Collaboration (ITGC). Of particular interest here are models showing how TG stability is sensitive to the chosen basal sliding law (e.g., Joughin and others, Reference Joughin2009; Parizek and others, Reference Parizek2013; Yu and others, Reference Yu, Rignot, Seroussi and Morlighem2018; Joughin and others, Reference Joughin, Smith and Schoof2019). Using a flowline model to assess TG response to loss of buttressing, Parizek and others (Reference Parizek2013) found that shifting from a viscous bed to a more-nearly-plastic bed delays retreat by spreading thinning inland rather than localizing it over the ridge, but that this inland thinning speeds retreat once initiated.
Geophysical surveys are planned, and some have been initiated, from several of the ITGC projects to collect data on the physical state of the bed that will help constrain bed character (e.g., Koellner and others, Reference Koellner, Parizek, Alley, Muto and Holschuh2019; Muto and others, Reference Muto, Alley, Parizek and Anandakrishnan2019a, Reference Muto2019b; Clyne and others, Reference Clyne, Anandakrishnan, Muto, Alley and Voigt2020; Holschuh and others, Reference Holschuh, Christianson, Paden, Alley and Anandakrishnan2020). We undertook modeling (Schwans, Reference Schwans2018) to extend the results of Parizek and others (Reference Parizek2013) into high-resolution map-plane simulations of TG and examine differences in modeled basin-wide response of Thwaites to prescribed basal sliding laws to help guide these surveys. Here, we include additional perturbation experiments and model conditions to examine potential interactions between several key processes on TG and their effect on its long-term dynamics. Though Thwaites' great width suggests that shear-margin processes are not dominant (Raymond and others, Reference Raymond, Echelmeyer, Whillans and Doake2001) and flowline models are useful in such a setting, map-plane simulations allow us to capture across-flow variability in behavior and bathymetry (Sergienko, Reference Sergienko2012) as TG retreats off its current stabilizing ridge. Upstream of the modern grounding-zone ridge are several additional topographic features of interest that could serve as potential points of stability as TG's GZ retreats inland (e.g. GHOST ridge and Upper Thwaites ridge, Figs 1a, b) as seen in previous ice-flow modeling work (Joughin and others, Reference Joughin, Smith and Medley2014; Seroussi and others, Reference Seroussi2017; Yu and others, Reference Yu, Rignot, Seroussi and Morlighem2018). Several ridges have also been the target of recent data-gathering work, including the farthest-upstream major ridge on Thwaites (Fig. 1, centered around −1310 km in x and spanning between −475 and −535 km in the y-direction; Muto and others, Reference Muto, Alley, Parizek and Anandakrishnan2019a, Reference Muto2019b) and Upper Thwaites ridge (Clyne and others, Reference Clyne, Anandakrishnan, Muto, Alley and Voigt2020). Furthermore, if shear margins are indeed influential on Thwaites' dynamics, the lack of strong topographic control on the location of its eastern shear margin (MacGregor and others, Reference MacGregor2013) suggests the possibility of shear-margin migration affecting TG behavior.
We use the open-source Ice-sheet and Sea-level System Model (ISSM) (Larour and others, Reference Larour, Seroussi, Morlighem and Rignot2012) together with targeted output from the PSU-3d model (Pollard and DeConto, Reference Pollard and Deconto2009a, Reference Pollard and DeConto2009b) to investigate TG's dynamic response to ocean-driven melt under various bed and boundary prescriptions. We include a range of conditions affecting the ice shelf and the GZ, as well as shear-margin perturbation experiments, in our ensemble of 500-year model runs of ASE. Several ensemble members utilize ISSM's moving ice front (Bondzio and others, Reference Bondzio2016) and plume-parameterization capabilities (Pelle and others, Reference Pelle, Morlighem and Bondzio2019). We do not explicitly model calving, ice-shelf loss by fracture or retreat of grounded calving cliffs (i.e., the ‘marine ice cliff instability’ (MICI); DeConto and Pollard, Reference DeConto and Pollard2016).
Under the given idealized forcing scenarios and omission of a cliff-failure mechanism, we investigate how timing and pattern of retreat on Thwaites depend on ITGC-focused bed character and grounding-zone-proximal processes. We also utilize perturbation experiments ~ the eastern margin to explore the influence that potential future margin migration could have on retreat patterns. Our results serve to help prioritize targets for future modeling and data-collection efforts on Thwaites to more confidently project its evolution and constrain its contribution to sea-level rise (SLR).
2. Methods
Here, we describe the physics used to model ice flow in ISSM, as well as our prescribed basal conditions throughout the ocean and shear-margin experiments, and the forcing/constraining datasets used therein. An in-depth discussion of ISSM's treatment of ice flow is presented in Larour and others (Reference Larour, Seroussi, Morlighem and Rignot2012).
2.1 Ice flow
To include lateral interactions that were parameterized in Parizek and others' study (Reference Parizek2013), we use the 2D Shallow-Shelf Approximation (SSA) – an approximation of the full-Stokes solution for ice flow that omits bridging stresses and vertical variations in horizontal velocity arising from vertical shear stresses within the ice, but still considers the local impact of regional changes through inclusion of membrane stresses (MacAyeal, Reference MacAyeal1989). The computational efficiency of SSA enables a large experimental ensemble to examine potential interactions between various (de)stabilizing processes on Thwaites. Simplified models of ice flow can result in a poor estimation of basal drag in the GZ area (e.g. Morlighem and others, Reference Morlighem2010), potentially affecting modeled inland migration in transient runs. As we are investigating sensitivities to controlling variables to help guide experimental design towards target areas rather than trying to make accurate projections of future SLR from ASE, our conclusions do not depend on the interpretive refinements afforded by higher-order stresses (Applegate and others, Reference Applegate, Parizek, Nicholas, Alley and Keller2015).
2.2 Model set-up
Our model domain includes Pine Island Glacier (PIG) along with TG to assess the potential for interaction between these neighboring glaciers (Appendix A). We initialize ISSM using observed velocities and ice front position from InSAR (Rignot and others, 2017) and GL location from differential InSAR (DInSAR) (Rignot and others, Reference Rignot, Mouginot and Scheuchl2011), along with ice surface, thickness, and bathymetry/basal topography from BEDMAP2 (Fretwell and others, Reference Fretwell2013), with geometry in the GZ adjusted to match the GL from DInSAR following ISSM workflow. We use ice temperatures from PSU-3D modern-day model output (Pollard and DeConto, Reference Pollard and DeConto2012) to compute Glen's flow law parameter, B (Glen, Reference Glen1955) as a function of ice temperature (Cuffey and Patterson, Reference Cuffey and Paterson2010) for grounded ice. An inversion is implemented for stiffness, B, on floating ice to better match velocities across the grounded-to-floating transition while using SSA. Transient runs solve both the stress-balance and mass-transport equations. We include an unforced, half-year relaxation transient in our workflow to remove shocks in the system from nonconcurrent datasets and/or model approximations. Following initialization, two sets of inversions for each ice-shelf and bed rheology (Section 2.2.2) are done for each model – one set before and one after the relaxation transient – so that our ocean-forced transient runs are initialized using end-conditions from unforced relaxation runs. An in-depth discussion of this workflow can be found in Schwans, Reference Schwans2018.
For source/sink terms within our mass balance, we incorporate:
(1) basal melting rates beneath floating ice, either statically from prior Regional Ocean Modeling System (ROMS) ocean output beneath Thwaites' ice-shelf (St-Laurent and others, Reference St-Laurent, Klinck and Dinniman2015) with several representative melt values extrapolated inland to apply forcing beneath newly-floating ice as Thwaites retreats, or dynamically as ocean-forcing output evolves from an ice shelf-ocean coupled plume model (which itself is a coupling between the Potsdam Ice-shelf Cavity mOdel and an ocean Plume model PICOP, Pelle and others, Reference Pelle, Morlighem and Bondzio2019) that accounts for geometric changes in the ice-shelf base;
(2) static basal melting rates beneath grounded ice from PSU-3D modern-day model output, which is calculated using the vertical conductive flux at the top of the bedrock (from geothermal heat flux) plus basal shear heating, where any value exceeding the basal pressure melting point is used to prescribe melt on basal ice (Pollard and DeConto, Reference Pollard and DeConto2012); and
(3) static surface accumulation rates from a modern-day snapshot for precipitation from ALBMAPv2 (Le Brocq and others, Reference Le Brocq, Payne and Vieli2010).
In simulating grounding-line evolution on Thwaites, we attempt to resolve features of interest and limit mesh dependencies while also preserving numerical efficiency by adjusting the resolution of the model mesh to meet these competing demands. We use ISSM's static adaptive mesh-refinement algorithm to capture modern velocity gradients throughout the model domain. Initial mesh resolution in the model domain is allowed to range from 20 km down to 2 km over areas of shelf and GZ where spatial velocity gradients are steep, with additional manual refinement over TG as described below. The mesh is then kept constant over the entire simulations.
Two different meshes for TG are used in our ensemble, such that, on the finer mesh, the maximum resolution in TG's catchment is ~6.5 km, while the coarser mesh contains larger elements (up to 20 km) in slow-flowing portions of TG according to ISSM's algorithm. On both meshes, the finest resolution (~900 m on the fine mesh, ~2 km on the coarser mesh) is manually enforced on and near the ice shelf, as well as within and just upstream of the modern GZ of Thwaites. This targeted refinement allows the model to capture smaller-scale slope feedbacks, ensures resolution of subglacial features that could serve as ephemeral pinning points in Thwaites' initial retreat, and helps reduce mesh-dependence when simulating grounding-line migration and sub-shelf melting using PICOP in transient runs. Shear margin experiments use the coarser mesh, while bed/ocean results reported here utilize the finer mesh. (See Appendix A for bed/ocean results on the coarser mesh.)
The modeled GL location (and therefore, sub-shelf melt and sub-ice-friction from dynamic drag) can be treated on a sub-element scale in ISSM. A partially-grounded element is assigned reduced values for melting rate and α 2 that are weighted according to the percentage of element area that is floating vs grounded (Seroussi and others, Reference Seroussi, Morlighem, Larour, Rignot and Khazendar2014). This reduces mesh dependency during GL retreat into coarser areas of the mesh as it captures sub-gridscale behavior that significantly limits mass loss compared to runs without this parameterization (see Appendix). While previous work suggests that mesh resolution within the GZ area be <1 km for accurate projections of GL location without parameterization (e.g. Pattyn and others, Reference Pattyn2013), our resolution in conjunction with this sub-element parameterization appears sufficient for investigating Thwaites' sensitivity to bed rheology prescription.
In this study, we distinguish between the observed GZ beneath TG and our modeled grounding line (GL). We are likely not capturing the full complexity of GZ behavior (e.g., Horgan and others, Reference Horgan2013; Milillo and others, Reference Milillo2019) nor the included physics (e.g., elastic tidal bending is omitted) with our modeling set-up and resolution. Further, as ISSM distinguishes element-wise between grounded vs floating ice, this transition is reduced to a linear feature in simulations. However, sub-element parameterizations for friction and melt on partially-grounded elements may capture some GZ-like transitional behavior (Seroussi and Morlighem, Reference Seroussi and Morlighem2018).
2.2.1 Boundary conditions
Boundary conditions imposed for the SSA ice-flow approximation include a stress-free ice surface (i.e. zero air pressure and wind stress at the ice/air interface), a viscous or higher-power friction law at the base of the ice linking shear stress to basal velocity (further described in Section 2.3), prescribed velocities along the interior perimeter boundaries of the domain, and depth-integrated hydrostatic water pressure at the ice/ocean interface.
Our model domain contains both PIG and TG, with prescribed ice thickness and velocities across all upstream and lateral boundaries (Dirichlet conditions). To retain computational efficiency with our large ensemble of experiments (see Appendix), our domain does not incorporate several glaciers that are adjacent to TG and can be considered to be part of TG's drainage basin (e.g. Rignot and others, Reference Rignot2019), but does include fixed ice-flux contributions at appropriate locations along this edge of our domain boundary. Nonetheless, nodes along the catchment edge of the model domain were predominantly set as zero-velocity boundaries, and along with prescribed thickness for the mass transport solution, are thus prescribed as zero or nearly-zero flux (i.e., no-flow boundaries are fixed in space to the modern catchment boundary, such that rapid GL retreat is eventually limited by boundary conditions and their chosen location, with less than 0.65 m of SLR from TG possible, rather than the full ~3.3–5.3 m of SLR from connected West Antarctic marine basins (Bamber and others, Reference Bamber, Riva, Vermeersen and LeBrocq2009)). Where catchment regions have prescribed nonzero fluxes, these static values are associated with local thickness and velocity data.
The ice front is initialized using the observed position from the MEaSUREsv2 velocity dataset released in 2017 for both TG and PIG, and in most model runs, is allowed to move freely in front of TG throughout the transient using a level-set boundary-tracking method implemented by Bondzio and others (Reference Bondzio2016). In the model, the ice front lies along the boundary between ice-free and ice-covered domains, where the level-set function is equal to zero. Full implementation of this method is described in Bondzio and others (Reference Bondzio2016). Because we do not prescribe either a calving model or calving rate in our simulations, ice-shelf growth is rate-limited by ice advection and sub-shelf melting only. PICOP produces relatively low melt rates beneath floating ice away from the GL in the Amundsen Sea Embayment (Pelle and others, Reference Pelle, Morlighem and Bondzio2019) and, with no other mass-loss on floating ice prescribed in the model, could result in TG producing an artificially long or thick shelf. We therefore circumvent the associated buttressing from erroneous dynamic drag by either fixing this numerical ice front to its initial position in prognostic runs using PICOP, or not extrapolating our basal friction coefficient seaward (see next section), thereby limiting the ability of TG to reground on new pinning points oceanward of the modern GL in runs with a dynamic ice front. A discussion of the effect of disabling the moving ice front on model runs can be found in Appendix B.
2.2.2 Basal friction and bed rheology
Basal drag (τ b) is related to ice velocity (v b) by a drag coefficient, α and a sliding exponent, m (e.g., Cuffey and Paterson, Reference Cuffey and Paterson2010):

We follow Morlighem (Reference Morlighem2011) and determine the drag coefficient α by inverting from data fields for assumed m, as described below.
A wide range of m values can be justified based on laboratory and field data and physical models, as well as more-complex models than (1), including rate-weakening/rate-and-state or Coulomb-plastic behavior (e.g. Joughin and others, Reference Joughin, Smith and Schoof2019). The classic Weertman sliding model (Weertman, Reference Weertman1957) yields m = 1 (linear) for regelation, m = 3 for enhanced creep, or m = 2 for combined mechanisms, assuming cubic deformation of ice. Deforming tills generally give much higher m values; based on Rathbun and others (Reference Rathbun, Marone, Alley and Anandakrishnan2008), m = 8 or higher may occur. Here, we use m = 1 and m = 8 (Schwans, Reference Schwans2018 includes m = 2 runs, but because they fall between m = 1 and m = 8, we do not explore them further here). We found that use of m > 8 was more likely to be computationally unstable, and that m = 8 captures much of the behavior of those higher exponents, and perhaps also some of the behavior of other strongly nonlinear models. We refer to each basal condition in our results using either the exponent in (1), or the deformation style (linear-viscous for m = 1; plastic bed for m = 8). While we refer to m = 8 as ‘plastic’ for ease of use, the behavior we simulate with this higher exponent is best described as more-nearly plastic.
Determining α for chosen m requires solving an inverse problem to produce a basal friction coefficient field, α 2, that minimizes misfit between observed and modeled ice velocities. ISSM applies an algorithm that uses an a priori estimate of the solution to iteratively solve the forward problem, implementing an adjoint method to compute the gradient of a prescribed cost function and obtain a solution after arriving at a reasonable misfit (MacAyeal, Reference MacAyeal1993; Morlighem, Reference Morlighem2011). We conduct an L-curve analysis that allows us to choose a suitable regularization parameter for our prescribed cost function, smoothing the resulting α 2 field to still capture sharp gradients in ice velocity while avoiding over-fitting artifacts that may be present in data (Morlighem and others, Reference Morlighem, Seroussi, Larour and Rignot2013). A more-detailed description of inversion parameters used in this workflow can be found in Schwans (Reference Schwans2018).
Each stress-balance inversion yields an α 2 field appropriate for the assumed power in the sliding law. Both α 2 and m are then held constant to specify basal drag beneath grounded ice in transient model runs. In runs utilizing a moving front, we extrapolate a representative α 2 value – derived from inverted values in the GZ – seaward of the modern GL to potentially allow TG to touch down on any new pinning points. We eliminate this step in PICOP transient runs due to a numerical instability and associated artificial (un)buttressing encountered when parts of the shelf rapidly and repetitively transitioned between floating and grounding. Newly-grounded ice seaward of the modern GL, then, can experience only form drag from an otherwise frictionless seabed in these runs. This prescription tends to allow for only slightly faster mass loss in runs forced with a static ocean, and is not especially important in modeled behavior on TG (see Appendix B).
2.3 Model experiments
To explore the behavior of TG broadly, we conducted transient runs for each bed type with several ocean-forcing scenarios and shear-margin prescriptions. These experiments are described in detail in the next subsections. A summary of our full ensemble is provided in Table 1 in our Appendix A, along with short discussions of intermediate parameter settings and results from model configurations not reported here.
2.3.1 Ocean forcing: snapshots & PICOP
For our static ocean forcing cases, we initialize our model with prescribed ice-shelf basal melting rates from ROMS under TG's present-day shelf, with a uniform value of 5 m yr−1 prescribed seaward of the present ice front. As the GL retreats, we apply one of two representative, average sub-shelf melting rates found near the modern GZ to any newly-floating inland elements, assuming either a high (100 m yr−1) or low (40 m yr−1) value for sub-shelf melting. Subsequent re-grounding, should it occur, reverts the local basal melting rate back to the initial grounded rate derived from Pollard and DeConto (Reference Pollard and DeConto2012).
Our dynamic ocean condition uses regional far-field ocean temperature and salinity in Amundsen Sea as inputs into an ice shelf cavity model (PICO, Reese and others, Reference Reese, Gudmundsson, Levermann and Winkelmann2018) to calculate temperature and salinity distributions beneath floating ice. These are then fed into a buoyant plume model (Lazeroms and others, Reference Lazeroms, Jenkins, Gudmundsson and van de Wal2018) to obtain basal melting rates beneath floating ice in each step of the transient (PICOP, see Pelle and others, Reference Pelle, Morlighem and Bondzio2019 for more details on the PICOP parameterization and its implementation in ISSM).
2.3.2 Shear margin perturbation
The eastern shear margin of TG may be able to migrate because it is not pinned strongly by underlying topography (MacGregor and others, Reference MacGregor2013). In several model runs, we instantaneously apply strong weakening to the eastern shear margin in one of two ways to assess whether changes there could speed GL retreat and mass loss across TG. We either reduce the calculated α 2 by 90% or halve the ice-stiffness parameter, B, within 50 km of the eastern shear margin (shaded box, Fig. 1). One might think of these, respectively, as an increase in basal melting and lubrication, and an increase in ice damage, strain heating, and/or c-axis-fabric alignment in response to accelerating flow of TG. The magnitude of these perturbations applied instantaneously over a large area likely overestimates possible shear-margin responses to changes in the TG trunk. While we neglect to capture small-scale or dynamic shear margin processes with this approach (e.g. Raymond and others, Reference Raymond, Echelmeyer, Whillans and Doake2001; Schoof, Reference Schoof2012; Suckale and others, Reference Suckale, Platt, Perol and Rice2014; Elsworth and Suckale, Reference Elsworth and Suckale2016; Meyer and Minchew, Reference Meyer and Minchew2018; Alley and others, Reference Alley, Scambos, Alley and Holschuh2019; Holschuh and others, Reference Holschuh, Lilien and Christianson2019; Ranganathan and others, Reference Ranganathan, Minchew, Meyer and Gudmundsson2021), the strength of perturbation applied should allow us to gauge how relatively large changes in Thwaites' eastern shear margin might influence broad-scale dynamics in our model domain.
3. Results
Our ocean condition forces reduction of ice-shelf buttressing on TG, which causes speedup of grounded ice landward of the GL. The resulting increase in along-flow stretching thins the grounded ice most strongly at the GL, causing inland retreat as ice there goes afloat. More vigorous melting of newly-ungrounded ice beneath TG results in faster modeled inland GL migration. This retreat is relatively slow near local bedrock highs, and faster over areas of retrograde slope beneath TG. Two bathymetric ridge features extend in the across-flow direction beneath the central trunk of TG (GHOST ridge and Upper Thwaites ridge, Fig. 1b), and act as key stabilizers throughout modeled retreat. Under a static ocean forcing, the GL moves inland from its modern position rapidly, with shorter pauses on ridges that depend in detail on how chosen basal boundary conditions affect TG's behavior during retreat. Model runs utilizing PICOP show limited inland GL motion, with the GL either remaining fairly stable on its current ridge, or migrating inland slowly, lagging as it moves across the ridge just upstream from the modern GL for much of the modeled period.
In all transient runs using a static ocean condition, retreat eventually extends far up-glacier along the trunk of TG and laterally. This causes the GL to become much longer, with inflow to the growing embayment from three sides. In turn, this greatly increases the total sub-ice-shelf melting from a specified melt rate, contributing to loss of buttressing and SLR. We use SLR as a single, convenient metric for integrated changes – and rates thereof – across our ice domain (see Methods regarding constraints on its interpretation). The limited ability of PICOP to both reduce ice shelf buttressing across the whole shelf and, more importantly, to concentrate melt at the GL restricts modeled retreat and contribution to SLR under this dynamic ocean forcing.
When comparing results from similar mesh resolutions, regardless of ice front treatment or assignment of α 2 in currently floating regions (see Appendix B), interplay between sub-shelf melting–especially near the GL –and bed-dependent dynamic thinning controls the rate and pattern of inland GL migration on TG, and therefore, the rate of its contribution to SLR. Our results demonstrate the need to resolve variations in bed character as well as ice/ocean interactions to more confidently model future behavior on TG.
3.1 Influence of ocean condition and bed character
We analyze our results in several ways, including examining the evolution of thinning rates and GL retreat, the patterns of driving stress over TG, and time series of ice mass above flotation which contributes to sea-level change.
We calculate this from ice volume above flotation (e.g. Goelzer and others, Reference Goelzer, Coulon, Pattyn, de Boer and van de Wal2020):

where H is the ice thickness, b is the bed elevation in meters, ρ w is the density of seawater (1023 kg m−3), and $\bar{\rho }_i$ is the vertically-averaged ice density (917 kg m−3). After summation, ice-volume is converted to Gigatonnes of ice using the vertically-averaged ice density.
We plot time series of the mass remaining in the main trunk of TG throughout the 500-yr transient period in Figure 2, for each bed exponent and ocean condition on both meshes (excluding our shear margin modification zone and noting that the boundaries of our simulated TG domain often lie within TG's full catchment (see Fig. 1), allowing only up to ~0.4 m of the available ~0.65 m SL equivalent for TG). Figure 2a shows ice mass time series for model runs on our finer mesh. Models in Figures 2b and 2c utilize our coarser mesh and include mass-loss curves for our shear-margin perturbations. Furthermore, while we could not include α 2 extrapolation in the event of a grounding-line advance from its modern position due to numerical instabilities in PICOP-driven experiments (purple curves in Fig. 2a), a comparison of runs forced with a static ocean both with and without friction-coefficient extrapolation (Appendix B) show that seaward extrapolation of α 2 plays a relatively minor role in limiting modeled retreat, allowing us to draw comparisons between basal rheologies and ocean forcings with the suite of models from our ensemble shown in Figure 2.
Ice mass/SLR time series calculated in Thwaites' catchment (excluding our shear-margin modification zone) for primary ensemble members on both our fine (a) and coarse (b, c) mesh throughout the 500-year transient period. Dashed lines designate modeled mass loss/sea-level contribution under a linear basal condition (m = 1); solid lines represent simulated mass loss/sea-level contribution under our more-nearly plastic basal condition (m = 8). Time series for model runs on fine mesh (a) show mass loss under HSO (orange), LSO (green), and PICOP (purple) forcings throughout the transient period. Panels b (middle; HSO forcing) and c (bottom; LSO forcing) contain time series for shear margin experiments on our coarse mesh for each static ocean forcing, with shear-margin lubrication experiments shown in blue (+slip), and shear margin softening experiments in violet (+soft). Green boxes designate where boundary conditions begin to have a strong influence on simulated SLR contribution across models.

3.1.1 Static-ocean snapshot forcings
As expected, Thwaites loses mass faster in transient runs forced by a high-melt static ocean (100 m yr−1 inland of modern GL, HSO, orange curves, Figs 2a, b) and contributes more to SLR until domain boundary effects arise compared to equivalent runs using the low-melt static ocean (40 m yr−1 inland of modern GL, LSO, green curves, Figs 2a, c). The fastest contribution to SLR comes from the combination of HSO and m = 8 (plastic, solid line) while the slowest modeled SLR contribution under static-ocean conditions occurs when m = 1 (linear-viscous, dashed line) with LSO prescribed. Note that the rate of mass loss decreases late in most runs (e.g., after ~275 years for a plastic bed with stronger ocean forcing) because retreat is reaching the edge of TG's catchment so that almost no grounded ice remains. The model is not configured to allow drawdown along or inside the model domain boundaries. Our boundary conditions prohibit ice-free conditions and impact our results once SLR reaches ~0.3 m without the eastern shear margin (asymptotic approach of zero-mass-above-flotation in Fig. 2a). We report mass losses for the entire model domain (including PIG's catchment, and losses within TG's trunk and shear-margin zone) in Appendix A.
Later in the transient, our boundary conditions begin to affect model output, limiting mass loss rates by means of our fixed velocities and thicknesses at the edge of our domain. These ‘edge effects’ present at different points for each bed type. Many of the linear-viscous runs show more gradual mass loss sooner, and at lower values of SLR-equivalent. Without the substantial inland drawdown that Thwaites experiences under a more-nearly plastic bed, a linear-viscous bed allows relatively slower GL motion even as retreat extends far into Thwaites' catchment, limiting modeled mass loss. Figure 2a in particular highlights how each bed behaves differently as edge effects are felt. Despite both GLs having retreated over their respective beds past Upper Thwaites Ridge deep into Thwaites' interior after ~250 years of the same HSO forcing, there are higher sustained rates of SLR contribution in runs with a more-nearly plastic bed as Thwaites continues to experience more far-field drawdown.
Figures 2b and 2c also contain ice mass/SLR time series on our coarse mesh for our shear-margin experiments for lubrication (blue curves, +slip) and softening (purple curves, +soft), which we discuss further in Section 3.3.
The effect of changing meshes becomes evident when we compare the orange/green curves (HSO/LSO, respectively) in Figure 2a to their equivalent curves in 2b (high-melt forcing on coarse mesh) and 2c (low-melt forcing on coarse mesh). The ~0.3 m SLR contribution from TG is reached roughly three decades earlier on the coarse mesh when forced with HSO (orange curves in Figs 2a vs 2b: m1HSO vs m1, m8HSO vs m8). We also see given mass losses occurring half a century earlier with less ice remaining in TG's catchment after 500 years of LSO forcing under either bed prescription when we use our coarser mesh (green curves in Figs 2a vs 2c: m1LSO vs m1, m8LSO vs m8). Modeled GL retreat and the rate of TG's contribution to SLR throughout the transient for any bed/ocean combination is affected by mesh resolution (e.g., Vieli and Payne, Reference Vieli and Payne2005; Parizek and others, Reference Parizek, Alley, Dupont, Walker and Anandakrishnan2010), with faster migration simulated on our coarser mesh. Appendix A includes further discussion of this mesh dependency and a figure for direct comparison of the impact of mesh resolution on mass loss for each bed/ocean-forcing combination.
Though the ocean largely controls the rate of mass loss through sub-shelf melting, the sliding law dictates how the glacier geometrically compensates in response to this forcing. Modeled differences in these dynamic thinning patterns across TG lead to different trajectories for subsequent GL retreat under the same ocean forcing, and therefore modeled timelines for rapid contribution to SLR from Thwaites in our map-plane simulations, similar to the flowline simulations by Parizek and others (Reference Parizek2013). We compared GL positions across the central portion of TG's trunk throughout these transient runs to assess differences in map-plane retreat behavior for each bed character/ocean combination (Fig. 3). In all runs, the GL experiences accelerated retreat over areas of the bed with a retrograde slope and slowed retreat over high points in the basal topography, including two notable ridges: GHOST ridge, ~50 km inland of the modern GZ, and the Upper Thwaites ridge, about 75 km farther upstream (Fig. 1). The timing of modeled GL retreat up to and over each of these key stabilizing bed features differs for each α 2 and ocean condition.
Grounding line motion in the main trunk of Thwaites during the ridge-to-ridge period of retreat for each bed prescription (linear-viscous, left panels a, c; plastic, right panels b, d) under HSO (top panels a, b) and LSO (bottom panels c, d), overlain on bed topography. Note the different time-scales designated by the colorbar atop each set of panels. GL position is shown at 5-yr intervals, where thicker lines occur every five intervals (e.g. 25-yr difference in GL position between bolded lines, such that the timestamp of bolded lines is equivalent to intermediate tick-marks in the colorbar).

The relative timings of GL motion reported here are necessarily approximate. In addition to refinements afforded by higher-order ice-flow approximations and higher-resolution meshes than what we utilize here, the rate of GL retreat is not constant across the width of TG in our model experiments. Each timestamp for motion on or off a ridge represents either the first or last instance at which any point along the length of the simulated GL is observed to be in contact with each major topographic feature and are reported to provide insights into the relative impacts of ocean forcing and basal rheology, rather than predict future GL motion on Thwaites.
Modeled retreat up to, between, and past stabilizing ridges is governed both by bed prescription and ocean forcing. Generally, as Thwaites retreats over a linear-viscous bed, the GL position at a given time step in a model run tends to be inland of its position in the equivalent run using a plastic bed (Figs 3a vs 3b, Figs 3c vs 3d) until the GL passes across the last prominent ridge that provides limited stability (Upper Thwaites ridge in Fig. 1), at which point retreat becomes accelerated moreso over a plastic bed. In our main model configuration, which includes a dynamic ice front and seaward α 2 extrapolation, runs using a linear bed condition show Thwaites' GL first reaching GHOST ridge after ~250 years of LSO forcing (Fig. 3c). If TG instead retreats over a more plastically-deforming bed under LSO, the modeled GL reaches this ridge approximately ~30 years later (Fig. 3d) than in the equivalent run with m = 1. While retreating over a linear-viscous bed, TG pulls off GHOST ridge after 345 years of LSO forcing (Fig. 3c), but the delayed GL retreating over a plastic bed slowly progresses across this inland ridge for several more decades, only allowing Thwaites to start to pull off this high point after ~375 years, losing full contact after 400 years of forcing, with only pinning points remaining (Fig. 3d). However, while models using m = 8 show limited initial GL retreat, much of TG's catchment is drawn down in response to ocean forcing (Figs 4d, h, l). Halfway through our transient under LSO forcing, Thwaites has contributed about 4 cm ice eq. more to SLR when retreating under m = 8 than in our LSO run with m = 1 (Fig. 2a, m8LSO vs m1LSO).
Thinning (blue-to-white colormaps) and driving stress (peach-to-red colormaps) for TG's retreat during the first 85 years of high-melt ocean forcing (HSO) with initial (dashed gray line) and evolving GL position (solid black line) over a linear-viscous (panels a, b, e, f, i, j) and more-nearly plastic (panels c, d, g, h, k, l) bed.

This modeled trade-off between mass loss and magnitude of retreat becomes more pronounced when we prescribe more-vigorous melting – after 250 years of HSO forcing, the linear-viscous condition has allowed TG to lose <15 cm of water/ice eq., while the plastic condition shows TG surpassing 30 cm of SLR within a decade of this halfway point (Fig. 2a, m1HSO vs m8HSO), beyond which edge effects begin to impact the m = 8 simulation. Faster initial GL retreat over both beds occurs when TG is forced with HSO (Figs 3a, b), and the modeled GL also progresses inland relatively faster when m = 1. The GL first reaches GHOST ridge after only 90 years of HSO forcing (~160 years earlier than under LSO) when retreating over a linear-viscous bed, and after 120 years of forcing when retreating over a plastic bed (also ~160 years earlier than LSO), pulling off in each case after 155 years and 185 years of forcing, respectively. Under this stronger-ocean-forcing scenario, once the GL reaches GHOST ridge, the ephemeral stability that it offers is cut from 95 years to 65 years for both bed types. The imbalance between ice-flux to this new GL location and the combination of divergent-flow and melt thinning is simply too severe to be overcome by any dynamic changes within the catchment.
When it comes to refining spatiotemporal predictions of GL motion, the importance of constraining both basal rheology and ocean forcing is also apparent in our results. For given phases of retreat, the ocean condition impacts which bed type leads to faster GL motion. The modeled retreat across the mid-section of TG from GHOST to Upper Thwaites ridge occurs sooner across a linear bed (Figs 3a, c). While runs with limited ocean melt show slower modeled retreat between the ridges over an m = 8 bed, when the ocean melts ungrounding ice more vigorously under HSO, the rate of retreat across this zone is faster over the plastic bed, though it occurs slightly later in the transient (Figs 3b, d).
As the GL progresses up-glacier from Upper Thwaites ridge, similar bed-dependent behavior to that seen in initial modeled retreat is observed at this stage of retreat as well, but is convoluted with the effect of the ocean forcing on retreat behavior across the basal topography between these ridges, affecting the timing of GL migration past this key stabilizing feature (Appendix A, Table 2). For instance, when retreating under our m = 1 condition using our lower value for melt beneath newly-floating elements, Thwaites' GL reaches Upper Thwaites ridge after 375 years, while the GL migrating over a plastic bed is just pulling off GHOST ridge (Figs 3c vs 3d). This GL does not reach this second prominent ridge until ~420 years into the transient, at which point TG under our m = 1 bed condition has already begun to switch into unstable retreat past Upper Thwaites ridge. Within 35 years, however, modeled GL retreat accelerates off the Upper Thwaites ridge into relatively thinner ice under m = 8, and overtakes the GL retreating over the linear-viscous bed after ~485 years. Timing of GL motion off Upper Thwaites ridge is approximately the same regardless of bed prescription under HSO (Figs 3a, 3b). While the GL migrates more slowly across a linear bed in the phase of Thwaites' retreat from ridge to ridge and lags across this second ridge for several more decades than when m = 8, the later arrival at GHOST ridge of the GL migrating over a plastic bed balances out this combination of slower ridge-to-ridge and cross-ridge migration. Retreat beyond Upper Thwaites ridge leads to accelerated MISI-style retreat of TG into deep marine basins. During this unstable retreat phase, the modeled rate of inland GL motion over a plastic bed becomes faster than modeled retreat with a lower exponent as Thwaites retreats inland to relatively thinner ice in a more drawn-down catchment regardless of ocean prescription, though the GL migrating over the linear-viscous bed is overtaken by the GL migrating over the plastic bed sooner under HSO.
Snapshots of thinning and driving stress patterns across Thwaites under HSO are shown in Figure 4 for both bed prescriptions. Driving stresses near the GZ remain higher throughout the model run when TG is retreating over a viscous bed (Figs 4b, f, j). Runs using a plastic bed exhibit more-widespread thinning (Figs 4d, h, l), and tend to retain a thicker buttressing ice shelf as TG retreats and ice is readily flushed across the GL from the inland part of the catchment. In all runs using a static ocean forcing, Thwaites retreats to the edge of its catchment, and would tap into interior West Antarctic Ice Sheet and thereby its full potential of ~3.3–5.3-m of sea-level equivalence if allowed in our model.
3.1.2 PICOP forcings
Runs using PICOP produce notably less mass loss (cf. purple curves in Fig. 2a, m1PICOP/m8PICOP) than either static-ocean melt scenario. In these dynamically-forced runs, the GL remains largely static on either bed, continuing to occupy its current bedrock high throughout much of the modeled period regardless of ice front treatment (see Appendix B for discussion of moving front effect on PICOP-driven runs). In these runs with a moving front (but no seaward extrapolation of α 2, and therefore, a prescribed frictionless bed where ice is newly grounded oceanward of the modern GL, such that the seabed provides only form drag), TG is able to retain more of a buttressing ice shelf throughout the simulation, with its GL remaining fairly static just upstream of its modern location regardless of bed choice.
In its implementation in ISSM, sub-shelf melt rates calculated by PICOP taper to 0 m yr−1 at the transition to grounded ice. This reduces the calculated melting rate in the first floating element at any point along the GL, and limits modeled retreat by keeping melt rates artificially low in areas most influential in TG's retreat. While PICOP also produces lower-than-observed ice-shelf melting rates away from the GZ (see Pelle and others, Reference Pelle, Morlighem and Bondzio2019), thus allowing large areas of floating ice to provide more buttressing throughout transient runs, it is the tapering effect at the GL that ultimately limits the effectiveness of this parameterization for use on TG at this resolution. PICOP produces melting rates in the first floating element that fall between 5 and 20 m yr−1 throughout the entire simulation. The melt value in the second floating element remains in this same range for the first ~150 years of each simulation, after which it oscillates between our low (40 m yr−1) and high (100 m yr−1) static ocean melt values. Only after ~375 years does the melt value in the second floating element exceed 100 m yr−1, at which point it oscillates between 100 m yr−1 and 110 m yr−1. Despite our sub-kilometer scale resolution in this zone, limited melt at the GL keeps our model of Thwaites from substantially retreating under this dynamic forcing. Because it is also possible that rapid melting beneath ice shelves reaches near, or even up-glacier of, the nominal GL (e.g. Horgan and others, Reference Horgan2013; Milillo and others, Reference Milillo2019), additional enhancement of melt may be required in PICOP (e.g. Parizek and others, Reference Parizek2013). Furthermore, without an interactive calving module to help limit the extent of the buttressing shelf, the impact of PICOP's underestimation of melt rates is exacerbated. Therefore, an explicit treatment for calving, which we lack in these experiments, is likely necessary to use PICOP or similar parameterizations more meaningfully in projections of TG.
3.2 Shear margin experiments
All shear margin experiments are forced using a static ocean, and utilize a moving front as well as the coarser mesh described in Section 2.2. We compare the relative differences in GL migration and SLR contribution in our forced-margin experiments to equivalent runs without shear margin perturbations (Fig. 2a), but on the coarser mesh (Figs 2b, c). To analyze the effects of our instantaneous shear-margin activation in the context of large-scale retreat dynamics on TG, we again report only on modeled mass loss within our Thwaites' catchment, outside of the shear-margin zone as delineated in Figure 1. ASE-wide losses (as well as losses within Thwaites and its eastern shear-zone) for these ensemble members can be found in the Appendix.
Both shear-margin scenarios simulate an immediate outward migration of the eastern lateral margin at the start of the transient, allowing for slightly faster velocities (and therefore, more thinning) across TG's trunk within first century of the simulation compared to runs without these forcings (Fig. 5). Differences in mass loss rates following margin forcing compound with those from changes in ocean forcing and bed character (Figs 2b, 2c). We first consider a 90% reduction of α 2 within the shear-margin zone, then 50% softening of ice in the shear-margin zone as described in Section 2.3.2.
Differences in ice-velocity between weakened shear-margin experiments (reduction in friction, panels a–d; increased softness, e–h) and those with unforced margins under HSO forcing for linear (left column) and plastic beds (right column). Streamlines here are calculated from margin-forced velocities at the above-pictured time-steps in the transient. Margin-forced GL locations are designated by the solid black line, and equivalent unforced-margin GL positions shown as dashed lines. Note the different scale in (panels b and d).

3.3.1 Basal friction coefficient reduction
The modeled rate of mass loss in TG's catchment (Figs 2b, c) is slightly higher in simulations with a more-lubricated shear margin (blue curves, +slip) than in equivalent unforced-margin runs (orange m1/m8 curves in Fig. 2b; green m1/m8 curves in Fig. 2c) with a linear-viscous bed (dashed lines, cf. m1, m1 + slip, m1 + soft), and much higher than in unforced-margin runs with a plastic bed condition (solid lines, cf. m8, m8 + slip, m8 + soft). The timing to reach ~0.3-m SLR (our cutoff to avoid boundary effects) is shortened by up to ~85 years under m = 8 and HSO conditions.
3.3.1.1 Linear-viscous bed
Overall, flow patterns in the main trunk of Thwaites (outside the shear-margin zone) do not appear to be strongly affected by a large reduction in basal drag in the shear-margin zone in runs with a linear-viscous sliding law (e.g. minor slow-down in Fig. 5a). Under both ocean forcings, the rapid export of ice into the ocean along the lubricated shear margin allows for the GL here to experience very limited initial retreat before ungrounding and marching back to approximately the same location as the GL in the equivalent unforced-margin run. However, once notable GL migration is finally initiated, relatively thinner ice in the lubricated margin allows the GL to pass through this zone more rapidly (Fig. 5c) as it reaches this common location. Despite this strong marginal forcing, only relatively minor changes to overall m = 1 retreat rates within the central trunk result (Fig. 5c).
Enhanced mass loss in the lubricated margin allows for slightly faster inland GL migration in the main trunk of TG, such that rapid retreat past Upper Thwaites ridge occurs several decades sooner, but otherwise follows the same pattern of retreat as unforced-margin runs. There are also slight differences in timing of GL motion up to and past GHOST ridge as a result of shear-margin lubrication. With HSO prescribed, the GL stabilization persists throughout the first century, diminishing during the second century of forcing, after which retreat follows a similar pattern as unperturbed linear-viscous runs. Under HSO, the GL reaches the first ridge after ~50 years of ocean forcing in both our forced- and unforced-margin runs with a linear-viscous bed condition (Fig. 5a). The GL pulls off GHOST ridge 5 years sooner with lubrication forcing, proceeding to Upper Thwaites ridge slightly faster, such that unstable retreat past this point occurs ~ the same time in both HSO runs where m = 1. Retreat past Upper Thwaites ridge also proceeds slightly faster in the lubricated run, but ultimately, TG follows the same pattern of mass loss over the course of the transient, with some notable differences.
When LSO is prescribed instead, the GL reaches the first ridge after 90 years of ocean forcing when the margin is lubricated, and after 105 years without margin lubrication. This difference in initial retreat rate combined with faster GL motion in the main trunk of TG in our forced-margin run allows the GL to pull off of GHOST ridge after 200 years of LSO forcing, ~40 years sooner than in our unforced run despite the GL stabilization effect on the eastern side of the catchment. This gap in timing of GL motion off of GHOST ridge is carried forward throughout the rest of the transient, but the relatively faster rate of retreat in the trunk of TG in our forced-margin run becomes more diminished as the GL progresses inland. The forced-margin GL reaches Upper Thwaites ridge a decade sooner (after ~275 years of LSO forcing). At this point, the stabilization effect from faster flux in the shear-margin zone is overcome by MISI retreat under LSO forcing as the GL pulls off Upper Thwaites ridge after 325 years. At this point in LSO runs with a linear sliding law, TG is able to sustain its GL position in the eastern shear margin more readily in unlubricated runs when the margin can still provide drag here, allowing slightly slower rates of GL retreat across Thwaites towards the edges of our model domain.
3.3.1.2 Plastic bed
Shear-margin lubrication causes earlier GL retreat off each ridge in runs with a plastic basal condition as well, but this difference is more pronounced than in runs with a lower bed exponent. The GL stabilization effect along the eastern shear margin occurs in runs assuming a plastic bed, but with a competing effect. In forced-margin runs with a plastic bed prescribed, limited GL retreat along the eastern margin occurs throughout the first century under HSO. This persists for another century in the margin-forced run with LSO. However, more consistent, rapid loss of ice mass occurs in both ocean scenarios compared to runs where the shear margin is not lubricated. Rapid ice export out of the eastern shear margin allows initial GL retreat to proceed much more rapidly across the width of TG compared to unforced-margin runs where m = 8 (Fig. 5b). While the forced-margin GL reaches the first ridge within the first century of LSO forcing and pulls off almost a century and a half sooner than in unforced-margin runs, its progression up to and past Upper Thwaites ridge occurs only ~80 years sooner when the margin is lubricated. Under HSO, the enhanced drawdown of the catchment as a result of both the basal condition and lubrication results in nonlinear retreat past Upper Thwaites ridge occurring after 100 years of forcing (Fig. 5d), whereas the equivalent run without margin forcing reaches this point after 180 years. By the end of the second century of forcing, both GLs have moved across the entire catchment in MISI-style retreat, with the margin-forced GL proceeding slightly faster due to the presence of relatively faster, thinner ice from enhanced drawdown that results from margin lubrication (Figs 5b, d).
Though the rate of retreat (and therefore timing of the onset of subsequent unstable retreat) on TG is mainly controlled by ocean forcing and bed rheology, beyond a certain threshold in all forced-margin model runs, the GL along the entire width of the trunk and in the shear-margin zone retreats rapidly inland into TG's catchment regardless of the prescribed bed exponent. This occurs much sooner in runs with a higher exponent, as the effects from the enhanced mass loss along the lubricated shear margin are far less localized (Figs 5b, d).
3.3.2 Increased softness
In all linear-viscous runs (dashed lines, Figs 2b, c) with enhanced shear-margin ice softness (violet curves, +soft), mass is lost at approximately the same rate as in equivalent runs without softening (orange/green dashed curves, m1HSO/m1LSO, respectively), with slight acceleration of SLR contribution in softened-margin runs occurring under sustained forcing.
We observe some differences in ice velocities and modeled rates of inland GL migration in margin-forced m = 1 runs, particularly along the eastern margin (Figs 5e, g), but neither the pattern of retreat across TG's trunk nor the modeled rate of contribution to SLR are strongly affected by shear-margin softening. In particular, while under LSO forcing, the GL pulls off GHOST ridge only two years sooner when the margin is softened. Modeled mass loss (Fig. 2c) past this point is slightly faster than in runs where the shear margin retains its modern-day strength. While the GL migrates inland faster along the weakened shear-margin zone, this only slightly accelerates ridge-to-ridge migration, such that the GL reaches Upper Thwaites ridge only 15 years sooner. TG enters rapid retreat past this point only two decades sooner under LSO, m = 1, and a weakened margin. Under HSO forcing, the timing of GL migration over a linear-viscous bed up to and over each ridge does not differ markedly following shear margin softening. While retreat along the eastern side of TG's catchment proceeds slightly faster, the overall pattern of GL migration throughout the rest of TG's trunk does not differ as a result of shear margin softening, and modeled mass loss rates follow a similar trajectory throughout the transient run (Figs 5e, g).
Faster retreat over a plastic bed along a weaker eastern shear zone results in an acceleration of mass loss relative to runs in which the shear margin retains its modern-day strength (solid curves, Figs 2b, c). This acceleration in SLR contribution occurs after 50 years under HSO, and after 100 years under LSO in runs with a softened eastern margin and a plastic basal condition. Much of the catchment has accelerated in response to this forcing (Fig. 5f), such that modeled deglaciation of TG occurs several decades sooner if the shear margin is weakened in this manner under either ocean forcing (Fig. 5h). With HSO forcing, shear-margin softening has little effect on the timing of GL arrival at the first inland ridge when m = 8, but the GL traverses and pulls off GHOST ridge about 10 years sooner than in the equivalent run without softening. This offset in timing of GL migration grows as each GL proceeds inland to Upper Thwaites ridge, with unstable retreat behavior past this point occurring about 20 years sooner in the HSO run with a weaker eastern margin compared to the run where the margin is unforced. Under LSO forcing, this offset is even more pronounced: margin-softening allows the GL to reach and traverse the first ridge about 40 years sooner than its unforced-margin counterpart, such that rapid retreat past Upper Thwaites ridge occurs after 340 years of LSO forcing (compared to 400 years when the margin retains its modern-day strength).
While both aggressive shear margin forcings modify TG's rate of retreat, the overall timing of retreat off stabilizing ridges and into TG's interior still appears to be most strongly governed by bed behavior and ocean forcing rather than by what would almost certainly be more tempered changes in the lateral drag provided by the shear margin (cf. dashed vs solid lines in Figs 2b, c as well as the various solid lines in Figs 2b, c). However, in runs with our plastic bed condition, widespread and pressurized shear-margin basal lubrication could have a very strong effect on the timing of the onset of rapid retreat on TG, particularly when ocean forcing is relatively weak. This once again points to the importance of better constraining bed rheology and future ocean forcing, especially in models that more-explicitly resolve shear-margin behavior.
4. Discussion
Our results confirm and extend the results of Parizek and others (Reference Parizek2013), demonstrating how the rate and timing of modeled GL retreat on TG is highly dependent on bed rheology. Thwaites undergoes different patterns of dynamic thinning in response to external forcing as it retreats over a linear-viscous (m = 1) vs a more-nearly plastic (m = 8) bed. A linear-viscous bed localizes thinning, limiting mass loss, but steepens the ice surface and thus increasing driving stress along the length of the GL. This enhancement of near-GL driving stress persists throughout TG's modeled retreat under the linear-viscous basal condition. Faster flux of ice across the grounded-to-floating transition allows ice proximal to the GL to thin to flotation even faster, causing the GL to migrate inland rapidly. By contrast, a plastic bed allows Thwaites to compensate for changes occurring near the GL by transferring stresses upstream. TG's thinning in response to ocean forcing is therefore spread out over a large area, reaching far upstream of the GL. This catchment-wide drawdown keeps gradients in thickness low along the length of the GL, and we generally observe slower initial GL retreat in simulations using our plastic bed. When forced at the ice margin, these distinguishing thinning patterns could, in turn, provide a remote-sensing fingerprint for bulk bed conditions beneath outlet glaciers after compensating for the surface mass balance (SMB) across their inland catchments. Throughout the satellite era in the ASE, SMB across the inland catchments has remained positive and has not decreased at the magnitudes nor spatial scale required to explain observed thinning. Therefore ocean-forced thinning can be directly associated with dynamic changes, which can then be used along with planned ITGC geophysical observations on TG (as briefly discussed at the end of this Section) to help constrain the rheological distribution of bed types.
Though modeled GL retreat over a linear-viscous bed tends to progress more rapidly, and tipping-point behavior is observed sooner in runs using this basal condition, more mass is lost with a plastic bed, as Thwaites is able to draw down more distal ice while retreating. While Parizek and others (Reference Parizek2013) found a secondary steady state in some forcing scenarios using m = 8 with adapative mesh refinement (maximum along-flow nodal spacing of 1000 m, with 100-m spacing across the GZ), this does not appear to hold true in our map-plane simulations with a static ocean forcing (albeit, with our finer mesh resolution of ~6500 m in inland regions tapering down to ~900 m across the GZ and ice shelf). Under sustained forcing, substantial retreat occurs on Thwaites in all runs forced with a static ocean condition.
Thwaites' retreat switches to rapid MISI-style collapse in all runs where the GL migrates over the Upper Thwaites ridge, the timing of which is primarily controlled by prescribed bed and ocean conditions. Although the GL reaches the ridge fastest under HSO and m = 1, on our GZmesh with a dynamic ice front, the GL pulls off the ridge at essentially the same model year for both the m = 1 and m = 8 experiments. Past this ridge, modeled GL retreat rates over a plastic bed become faster than those over a linear bed due to the presence of relatively thinner ice in these deep interior basins from sustained catchment-wide drawdown.
The modeled rate of GL retreat up to GHOST ridge is sensitive to both ocean condition and bed character. Retreat of the GL from its modern location inland to the first ridge occurs decades sooner in runs prescribing a linear-viscous basal condition, and much faster in runs prescribing HSO. In addition, the modeled time span of ridge-to-ridge GL migration appears more sensitive to ocean influence in runs with a more plastic bed (15 years under HSO, 45 years under LSO) than in runs with a viscous bed prescription (25 years under HSO, 30 years under LSO).
Modeled rates of retreat over Upper Thwaites ridge show limited slowdown in runs with a plastic bed. While this topographic high allows the GL to lag for ~50 years when retreating according to a linear basal sliding law, this is more ephemeral in runs with a plastic bed, where increased regional drawdown since the start of the simulation has left very little remaining ice above flotation across this region by the time the GL has reached this second ridge, which is ~75-km farther inland from GHOST ridge. In these runs, the GL migrates over this inland ridge within 20 (HSO) to 35 years (LSO). However, the timing of modeled retreat up to and over this second ridge appears less sensitive to bed prescription than retreat up to and past GHOST ridge.
Both our shear margin forcings limit the ability of the shear margin to support changes in TG's driving stress as it retreats. While we do not attempt to capture the full range of shear-margin behavior and interaction with changes on TG over our simulated period, our purpose was to investigate whether the support that the current shear-margin is able to provide strongly affects dynamics across TG's trunk over relevant timescales. We find that, considered individually, neither a drop in basal friction nor a softening of the ice strongly affects the modeled magnitude of GL migration over longer timescales, but can, in some cases, alter the rate of mass loss and the timing of the onset of rapid retreat on TG in our model configuration. While modeled patterns of GL migration along a lubricated margin are distinctly different from those in equivalent runs without this margin activation, patterns of retreat across TG's trunk differ far less. Additionally, while the rate of inland GL retreat along the eastern shear-margin in either shear-margin forcing scenario appears to provide a control on the timing of Thwaites' retreat off the eastern portion of its stabilizing ridge, the main controls on TG's rate of retreat over longer timescales are still the bed and ocean prescriptions. There is some interesting interaction between these shear-margin forcings and our bed prescription, however, that suggests future margin migration could potentially alter TG's rate of contribution to SLR more significantly. The tendency of a more-nearly plastic bed to readily transfer stresses across large distances allows for changes occurring in this zone to have more of an influence on dynamics throughout TG's catchment. Activation of the shear margin through manual tuning of α 2 alters TG's rate of SLR contribution over the modeled period when m = 8, but has less of an effect on retreat over a viscous bed. Softening of the shear margin also enhances retreat rates over a more plastic bed, but ocean forcing still plays a larger role than this instantaneous weakening. We do not, however, consider evolving damage following shear-margin weakening.
Thwaites' GL remains fairly stable close to its modern position throughout the simulated period when we apply limited melt at the GL and beneath the floating shelf using PICOP. In runs where less melt is applied on the first floating element, whether using PICOP or LSO, we observe a trade-off between initial rates of mass loss and evolution of buttressing. While the rate of ice export to the weakly-buttressing shelf is primarily a function of the modeled rate of GL retreat into regions with thicker, faster spreading ice, in scenarios where forcing is limited and the GL retreats more slowly, a plastic basal condition allows for more contact with pinning points within the first two centuries of forcing. As TG retreats in these runs, it is more consistently evacuating ice across the grounded-to-floating transition throughout the transient period, allowing for slower initial retreat over a plastic bed.
Our results using a dynamic ocean suggest that potential sticky spots in the bed could slow retreat if (i) the ocean has limited ability to melt and thin ice close to the GL, and (ii) lower melt rates across large areas of floating ice allow TG to sustain a buttressing ice shelf. We note that it is possible that PICOP could still produce faster or more sustained retreat on Thwaites within our modeled period if we were not overestimating buttressing by omitting calving as a mass-wasting mechanism to limit shelf extent. However, as the only means of limiting SLR contribution from TG in our model set-up involves using a parameterization that drastically reduces melt near the GL (between 5 and 20 m yr−1 on the first floating element), this further suggests that basal drag in the GZ is providing far more ‘buttressing’ to TG's outflow than its remaining ice shelf (e.g., Parizek and others, Reference Parizek2013; Milillo and others, Reference Milillo2019). Our results using a static inland sub-shelf melting rate further support this: newly-ungrounded ice is melted at a fixed rate in these experiments. The modeled difference between TG's mass loss under HSO vs LSO early in the transient under the same bed/friction prescription means that the fixed difference of 60 m a−1 in sub-shelf melting close to the GL matters. A dynamic ocean forcing is clearly necessary to capture complex interactions between evolving shelf/cavity geometry and subsequent changes in sub-shelf melting rates and thus, their influence on buttressing and GL retreat patterns. However, PICOP's limited ability to drive melting closest to the GL renders the current version of this parameterization less suitable for simulating GL migration on Thwaites, where proximal melt is most influential.
Geophysical surveys over portions of Thwaites (e.g. Muto and others, Reference Muto, Alley, Parizek and Anandakrishnan2019a, Reference Muto2019b; Clyne and others, Reference Clyne, Anandakrishnan, Muto, Alley and Voigt2020), have found that there is almost certainly spatial variability in bed character. By assigning a single value for m, we prescribe a uniform rheology, and thus, complexities introduced by variable retreat speeds and stress concentrations over a heterogenous bed are not captured. Flowline results from Koellner and others (Reference Koellner, Parizek, Alley, Muto and Holschuh2019) show that, under certain conditions, this variability allows for behavior that falls outside the range of behavior spanned by the end-member cases with spatially-uniform bed rheology. Additionally, using a modern snapshot of velocities to infer friction and running forward for centuries under this scenario is an inadequate description of what is likely to be an evolving condition throughout deglaciation of TG's catchment. The response of glaciers to dynamic basal conditions, especially glaciers such as TG with relatively weak side confinement and primary drag from their beds, requires further investigation. The initial correlation between topography and rheological transitions (Muto and others, Reference Muto, Alley, Parizek and Anandakrishnan2019a, Reference Muto2019b; Clyne and others, Reference Clyne, Anandakrishnan, Muto, Alley and Voigt2020) points towards useful time-independent parameterizations that can be tested by map-plane models. However, spatial variability in bed rheology will continue to be a large source of uncertainty in models of TG's contribution to SLR until field campaigns are able to image the bed more fully to better constrain patterns of bed character, and any systematic variability thereof, such that these data can be meaningfully incorporated into higher-resolution predictive models of TG and the Amundsen Sea Embayment as a whole.
5. Conclusion
We use ISSM's SSA ice-flow approximation to model TG's long-term dynamic response to forcing, prescribing a range of basal conditions to investigate the relative influence of several ill-constrained processes that affect modeled retreat on Thwaites throughout a 500-yr forcing period. All our model runs indicate that TG will continue to lose mass, while a majority of the simulations head towards instability. The rate at which Thwaites contributes to sea-level throughout our modeled period, however, depends strongly on bed rheology via the basal sliding law as well as on ocean forcing near the GZ.
The ocean plays a strong role in Thwaites' evolution through its effect on buttressing near the GZ and ice-shelf retention. Loss of buttressing from sub-shelf melt causes retreat on TG, where more vigorous melting of newly-ungrounded ice results in faster modeled inland GL migration. As we do not explicitly resolve calving, the rate at which we model loss of floating ice (and therefore, loss of buttressing potential throughout the modeled period) is likely conservative. Limited retreat in our runs forced by PICOP demonstrates a need for ocean parameterizations that can concentrate melt where it is most influential, as warranted physically (e.g. Milillo and others, Reference Milillo2019). However, when consistent melt is applied at the GL (and beneath the shelf), we observe rapid inland MISI-style retreat that initiates once dynamic thinning patterns on TG have allowed the GL to progress inland past Upper Thwaites ridge, about 125 km upstream of the current GL of Thwaites. This unstable, rapid retreat is observed in all model runs using a static ocean forcing within the 500-year forcing period.
Our results confirm and extend Parizek and others' (Reference Parizek2013) findings regarding Thwaites' dynamic retreat dependency on chosen basal sliding law; however, while instability was avoided in some of their runs with m = 8, the onset of rapid retreat over a more plastic bed on TG can be delayed, but not avoided, in these experiments. We also show how large changes in Thwaites' eastern shear-margin can affect timing and style of retreat in our modeling configuration. Overall, though, basin-wide basal conditions appear more influential than this shear-margin in controlling behavior within the trunk of TG over modeled timescales.
Mesh dependencies continue to indicate a need for fine resolution near the GZ and throughout the trunk of Thwaites to more confidently model its contribution to SLR, and reduce uncertainty in estimates for the timing of its likely retreat into interior West Antarctic Ice Sheet under any bed prescription.
Bed character, along with future ocean forcing (especially near the GZ), remains a large uncertainty that must be constrained in models to ensure accurate projections of this critical region of the ice sheet, and inform policymakers of likely timelines of significant SLR from TG and the West Antarctic Ice Sheet as a whole.
Acknowledgements
The authors would like to thank Pierre St.-Laurent, Ryan Walker, and David Pollard for their model output that was used to initialize and force our experiments, as well as Chris Borstad and Hélène Seroussi for each of their valuable contributions in discussions regarding model tuning in ISSM. Guidance from the ITGC GHOST team was invaluable in completing this research. We would also like to express our appreciation to the reviewers for their clear and insightful comments and suggestions. This work was funded by U.S. NSF Grants PLR-1443190, ANT-0424589, AGS-1338832. Model output is hosted on Penn State's data commons and is available at doi: 10.26208/A699-3A21.
Appendix A – Domain-Wide Results: Mesh Dependency and Connection to PIG
Extended model ensemble of 500-year simulations of Amundsen Sea Embayment for each prescription for bed (m = 1, linear-viscous, m = 8, plastic), grounding zone friction (with or without sub-element friction (SEF)), and ocean (HSO = high-melt static ocean, LSO = low-melt static ocean, and PICOP plume model) on each mesh, with primary members (reported on in main text) in bolded letters

Here, we summarize the impact of our mesh resolution on simulated Thwaites Glacier (TG) dynamics, as well as the influence that the inclusion of the adjacent Pine Island Glacier (PIG) in our model domain has on overall results and retreat on TG.
Modeled mass loss as a result of either high or low static ocean forcing (HSO or LSO, respectively) exhibits a dependency on mesh resolution, such that the increase in average element size from our fine to our coarse mesh results in relatively more mass loss (i.e., less volume of ice above flotation remaining) at any given time step throughout transient runs for our primary ensemble members that use a dynamic front with basal friction coefficient (α 2) extrapolation (Fig. 6, panels a-c). Figure 6b also shows less mass remaining within TG's catchment and shear margin zone for a given bed/ocean combination on the coarse mesh than in the equivalent run on the fine mesh. These findings are in agreement with previous work illustrating the need to refine model meshes within the grounding zone (GZ) to minimize grid dependencies on grounding-line (GL) migration (e.g., Vieli and Payne, Reference Vieli and Payne2005), with ease of retreat often favored over re-advance on coarser meshes (e.g., Parizek and others, 2010). While the timing and rate of GL retreat and reported mass changes are dependent on mesh choice as detailed below, the relative impacts of ocean forcing, GZ treatment, and basal rheology remain robust until boundary effects arise (~0.3/~0.35 m SLR for TG without/with eastern shear margin, ~0.15 m SLR for PIG, and ~0.5 m SLR for the entire ASE domain; Figs 2, 4a–c).
A comparison of mass loss timeseries across meshes (left panels) and across model prescriptions (right) within our ensemble. Green boxes designate where edge-effects begin to come into play across models. Panel a shows whole-domain losses (note the ~2x scaling of the vertical axes compared to the other panels) for each bed (m = 1 dashed, m = 8 solid), ocean (greens = LSO, orange/brown = HSO) combination, where the darker-colored lines are time series of mass loss calculated on the coarse mesh. Panels b and c show these same results for the area within Thwaites' catchment and shear-margin zone (b) and the model domain outside TG's catchment (c). Panels d, e and f parse out each setting in our model configuration that had a measurable impact on modeled results, where lighter/thinner lines are the timeseries of mass loss in Thwaites' catchment without: SEF (d), a moving front (e), and α 2-extrapolation (f), the lattermost being within a configuration with a moving front, such that lighter curves in (f) are the same as thicker curves in (e).

A coarser mesh allows for steeper driving stress gradients and enables faster retreat of the grounding line (GL) over less-resolved bed features. Of particular note is the spread between fine and coarse mesh runs for m = 8 with Thwaites forced by LSO: the mesh dependency is amplified in this particular bed/ocean combination as the mesh cannot resolve small-scale points of contact as TG retreats inland, making it more difficult to touch down on underlying high points despite lower sub-shelf melt. Whereas, under HSO, large driving stresses still initiate earlier retreat on coarser meshes, but the rapid melting of newly floating ice diminishes the importance of resolving the underlying bathymetry and bed as potential points of contact.
The timing of modeled GL migration up to and over both GHOST ridge and Upper Thwaites ridge differs between meshes for equivalent primary members of our ensemble that use a static ocean forcing (Table 2). Generally, the modeled GL migrates faster over our coarser mesh, such that unstable retreat past Upper Thwaites ridge occurs several decades to almost a century earlier on this mesh for a given ocean/bed prescription. Thwaites' GL arrives at each ridge relatively sooner on the coarser mesh for any bed/ocean combination, but the difference in timing of rapid retreat behavior appears to arise primarily from differences in rates of modeled migration in Thwaites' initial phase of inland retreat up to and past GHOST ridge between meshes, rather than differences in the rate of its modeled retreat between ridges or across Upper Thwaites ridge.
Approximate timing of grounding line migration off (and between) each stabilizing ridge feature of interest beneath Thwaites (GHOST ridge and Upper Thwaites ridge (UTR)) for each bed (m = 1, linear-viscous and m = 8, plastic) and ocean (HSO = high-melt static ocean and LSO = low-melt static ocean) prescription on each mesh (C = coarse, F = fine)

The area over the ice-shelf, within the modern GZ, and just upstream is where our resolution difference between meshes appears most influential. Here, the smallest elements on our coarse mesh are at a resolution of 2000 m, while elements on our fine mesh are refined down to 900 m. Thwaites' GL reaches GHOST ridge sooner in all experiments on the coarser mesh as it retreats through this part of the domain. As in our primary ensemble runs, the modeled retreat of the GL from its modern location inland to GHOST ridge occurs sooner when we prescribe a linear-viscous basal condition, and faster when we prescribe HSO. Differences in timing of GL arrival at this ridge on the order of one to several decades are seen between meshes for most bed/ocean combinations, with the largest difference in modeled motion up to this ridge on each mesh occurring under LSO when m = 1. Less-vigorous melting allows TG to retreat more slowly and with greater potential for ice-shelf re-grounding, which, given higher driving stresses across the GZ and poorer resolution of basal high points on coarser meshes, in turn accentuates the mesh dependency when simulating grounding-line migration.
Connection to PIG
GL motion on Thwaites does not appear to be independent of retreat on neighboring PIG. Early in the transient with a linear bed prescription, PIG's floating extension degrades along its edges under static ocean forcing and is lost. The GL across the portion of PIG closest to TG retreats into the small linking tributary between these neighboring glaciers, with enhanced outflow from TG helping to minimize early mass loss from PIG. The GL on the eastern margin of TG becomes ungrounded at this point – while modeled inland migration across the width of TG is limited during this phase of retreat, high driving stresses retained in the eastern shear-margin eventually cause the GL here to retreat, allowing for the GL on Thwaites' western side to pull off of GHOST ridge. This same effect is seen in runs with a plastic bed, though generally, driving stresses remain lower after the eastern side of the GL retreats into the shear-margin zone. However, under either bed prescription, the enhanced flux of ice out of the eastern part of Thwaites from its connection with PIG allows the GL across the width of TG to destabilize more readily and eventually migrate off of GHOST ridge in low-melt scenarios, while in high-melt scenarios, the GL is only slowed by GHOST ridge, but does not appear to stabilize on it at any point.
Our results using the plume parameterization further support the idea that Thwaites' retreat along its eastern margin is influenced by its neighbor's retreat in response to ocean forcing. PIG's floating shelf is not lost in any of the PICOP runs, and the GL does not retreat into the linking tributary. The GL on this side of Thwaites remains closer to its modern position in these runs, and retreat across the width of TG's GL is limited as well. Runs that do not resolve sub-element friction (SEF) show more substantial retreat on PIG, which allows retreat to progress faster along TG's eastern margin as well. This potential for PIG to influence GL migration rates and patterns on the eastern side of Thwaites, and the apparent effect this influence has on GL motion across the width of TG, merits further investigation.
Appendix B – Influence of Grounding Zone/Ice Shelf Prescriptions
Each of the following subsections contains a brief discussion of intermediate experiments for each grounding-zone friction and ice front prescription within our model ensemble to help clarify our results by parsing out the influence each of these settings (and their interaction) has on overall modeled glacier dynamics on TG.
Subelement resolution of grounding zone friction
Along with the bed and ocean prescription, resolution of SEF in the GZ is the most influential control on TG's retreat in our modeling configuration. Figure 6d shows mass loss modeled within TG's catchment and shear-margin zone within our 500-yr forcing period both with (darker lines) and without dynamic drag (thinner, lighter-colored lines) from partially-floating elements. Results in Figure 6d do not utilize a dynamic front or friction coefficient extrapolation, which have relatively minimal impact on basin-wide changes (discussed in sections below).
Removing partially-grounded elements' ability to exert dynamic drag on ice in Thwaites' GZ results in much faster inland GL migration and higher modeled mass loss rates for all bed/ocean combinations in our ensemble. As is the case in runs with SEF enabled, more-vigorous melting of newly-ungrounded ice gives rise to faster mass loss.
Rather than gradual thinning across the GZ (which also lowers driving stress) and a subsequent gradual reduction in SEF, full-element basal drag abruptly drops to zero with ungrounding when SEF is turned off. This transition creates a steeper local surface slope and therefore higher GZ driving stresses to promote more rapid flow thinning. These enhancements are particularly prominent over an m = 1 bed as elevated driving stresses are balanced locally, such that flow thinning across the area near the GZ is more pronounced when compared to m = 8 simulations. Furthermore, under more rapid, step-wise retreat with basal drag lost across the entire next ungrounded element (SEF off), proximal up-glacier ice has less time for viscous thinning – this relatively thicker, steeper ice further promotes increases in GZ driving stresses. Thereby, linear-viscous beds respond more strongly to this change in GZ friction, retaining high driving stresses near a more-lubricated GZ that causes faster retreat under any ocean prescription.
While we did not specifically test this formulation for each mesh, as resolution becomes smaller, the effect of prescribing no drag on partially-floating elements goes towards zero (Parizek and others, 2010). That is, a resolution exists that is fine enough to resolve the GL such that most elements enter, but do not tend to remain in, a state of partial flotation. At this resolution, the subsequent increase in modeled mass loss and GL migration rates under this prescription would tend towards zero (e.g., Vieli and Payne, Reference Vieli and Payne2005; Parizek and others, 2010). Modeled differences, then, between mass loss in our ensemble members with and without SEF can be considered (in tandem with our mesh-dependency discussion above) another testament to the importance of GZ resolution in projecting TG's retreat into the interior of WAIS. However, while mesh resolutions <1 km are required to reliably project patterns of future grounding-line retreat without sub-element parameterization of friction (Pattyn and others, Reference Pattyn2013), the aim of our study was to investigate broader-scale variability in relative retreat rates based on bed rheology prescription. The substantial increase in retreat rates seen in results that do not use SEF (Fig 2d) is therefore a testament to the efficacy of our sub-element parameterization for the purposes of this study.
Dynamic front
These results do not include GL-seaward extrapolation of basal friction (see next section in Appendix B). Without a moving ice front, TG loses relatively less mass under any bed/ocean prescription throughout the modeled period (lighter curves in 4e). We expand on notable differences the moving front creates as it interacts with other prescriptions in our model ensemble below.
Static ocean
When m = 1, there is very little difference between mass loss curves for each ice front prescription, and throughout much of the transients, the position of the GL is about the same for corresponding static ocean forcings regardless of ice front treatment. Modeled mass loss on TG, however, is more sensitive to ice front prescription when m = 8, where a dynamic front condition allows for more mass loss throughout the transient period as TG retreats over a plastic bed under either HSO or LSO.
Enabling a moving ice front with no rate-limiting mechanism other than sub-shelf melt on a fully lubricated ocean surface initially results in a kinematic wave of ice from upstream that fills the ocean domain in front of TG with thin ice. This ice does not show high buttressing capacity, and likely has little effect on differences seen throughout runs with and without a moving ice front, as it is melted away swiftly under ocean forcing. While this large advection of inland ice initially leads to relatively thicker ice in the GZ area in all runs, each bed prescription sources this ice differently, and, in these runs, Thwaites dynamically adjusts under continued ocean forcing according to each bed prescription.
Once the initial stability from thickening at the GZ is removed by the ocean, the characteristic widespread and pervasive drawdown of a more-nearly plastic bed condition results in relatively faster retreat under our dynamic front condition. The tendency of a plastic bed to distribute stress changes that are occurring near the ice front means that both the thinning from the initial drawdown following adjustment to our front condition as well as the thinning from continued forcing are more widespread inland and across the width of TG, resulting in more-substantial mass loss at beginning of the transient when compared to our static-front model. This adjustment to the dynamic ice front condition allows for inland GL retreat across the plastic bed to progress such that it reaches each inland ridge about 30 years sooner than in runs with a static front treatment. Evolving patterns of buttressing and GL retreat between equivalent m = 8 models differ little regardless of ice front prescription – while the GL in the run with the dynamic front is slightly farther inland than the static-front-GL at any given point in the transient, the pattern of retreat is not strongly affected by the ice front prescription. Rather, the enhanced retreat rates in our plastic models that use a moving ice front are mainly due to Thwaites' dynamic adjustment to this larger initial kinematic wave that ‘fills’ more area in front of Thwaites at the beginning of the transient, drawing down relatively more ice across the catchment under our plastic condition.
Less of a difference is seen in the GL retreat patterns of equivalent m = 1 runs with and without the moving front, as a linear-viscous bed allows the influence of the shock of advected ice to remain local, affecting dynamics along the width of the GZ to a lesser degree both as Thwaites adjusts following the initial kinematic wave and continues to respond to ocean forcing. Namely, the ice in the kinematic wave is sourced more proximal to the initial GZ, and, once advected to the GZ, is then distributed more locally as the Thwaites continues to undergo ocean forcing and more ice is advected from upstream. However, without additional rate-limiting mechanisms (other than constant sub-shelf melt), this configuration is not likely to produce as steep of gradients in driving stresses near the front that would be typical of a linear-viscous bed with a true calving front.
This difference in ice front influence between bed prescriptions for our static ocean forcing scenarios speaks more to the sensitivity that modeled GL migration up to and past GHOST ridge exhibits to our choice of bed character and parameterization of GZ-proximal processes in ISSM than it does on the influence of ice front dynamics on TG under either bed prescription.
Dynamic ocean
A dynamic ice front has a small effect on mass loss under PICOP (purple curves in Fig. 6e) under either bed prescription, but does affect modeled GL retreat patterns and general dynamics near Thwaites' floating shelf and GZ. Without a moving front, the TG's western ice shelf is able to persist under PICOP forcing throughout the transient when m = 1, and throughout the first two centuries when m = 8.
With a dynamic ice front, the GL on the eastern side of Thwaites progresses farther inland under PICOP as ice is more-readily advected over a lubricated ocean surface. This is enhanced when m = 8, allowing for faster inland GL motion on the eastern side of TG earlier in the transient with a dynamic front, though the tendency of the ice-shelf to remain longer and flatter when the moving front is enabled keeps PICOP melt rates lower near the GZ for the rest of the transient, such that the final GL positions when m = 8 are approximately the same under either ice front prescription.
With a linear bed prescription, a freely-moving front results in rapid grounding and ungrounding of pinning points in the center of Thwaites' shelf due to lower PICOP values in this area allowing localized thickening, creating ephemeral grounding points. Further, the dynamic front with PICOP reduces driving stresses along the m = 1 GZ due a flat, long shelf.
Given that the evolving melt rates tend to stay lower due to a smooth modeled ice shelf base, a bed that distributes advected ice from upstream more proximal to its GZ becomes more efficient at grounding in this configuration than a bed that spreads these changes out. This contrasts with bed-specific dynamic GL behavior seen when our ocean forcing is static, but we still include a dynamic front. This stabilizing effect of more-readily thickening grounding points on a linear-viscous bed diminishes as proximal melt rates don't fall off during ungrounding events as they do in PICOP-driven model runs, and driving stresses near the front can remain higher. As higher melt rates near the GZ persist throughout our runs using a static ocean, a bed that spreads stress changes out is able to touch down more-readily throughout the transient than a linear-viscous bed, both in runs with and without a dynamic front that tends to reduce modeled GZ driving stresses.
Divergence in PICOP results with and without a moving front highlights the sensitivity of this parameterization to shelf geometry. A thin, long ice-shelf does not appear to be able to produce high melting rates under PICOP, as the plume advection schema relies on basal slope and GL depth to calculate melting rates. Results further point to the important role that sub-shelf melt near Thwaites' GZ plays in its retreat dynamics.
Seaward extrapolation of basal friction
With a dynamic ice front enabled, the additional modeling step of a seaward extrapolation of the inverted basal friction coefficient (α 2) decreases modeled rates of mass loss on TG (thicker curves in 4f) by allowing nonzero dynamic drag from the seabed on any newly-grounded ice seaward of the relaxed GL. However, the effect of these changes on timing and magnitude are minimal when compared to the impacts from altering the ocean forcing and/or basal rheology.
Under HSO, mass loss curves for each bed follow similar trajectories regardless of whether extrapolation is included. At a given time step, the model without extrapolation (lighter, thinner orange curves in Fig. 6f) shows only slightly less mass remaining in TG's catchment, with similar timing for changes in modeled rates of mass loss. However, in runs where the ocean might allow the shelf to thicken and touch down more easily, a lack of dynamic drag from new or growing pinning points causes TG's transient behavior to diverge under both bed prescriptions (lighter, thinner green curves in Fig. 6f).
No large difference in timing of GL migration onto or between ridges is observed when m = 1 and Thwaites is forced by HSO, though under LSO, we see an offset in timing of GL retreat, where the GL modeled with no seaward extrapolation of α 2 has progressed slightly farther upstream at any given point in the transient. Midway through the LSO transient with a linear-viscous bed prescription, the GL without α 2 extrapolation arrives at GHOST ridge 20 years sooner, then migrates across and pulls off 30 years sooner than the run with seaward dynamic drag. This 30-yr offset persists throughout the inland migration of the GL up TG's trunk to Upper Thwaites ridge. Rapid retreat past this ridge occurs 30 years sooner without α 2 extrapolation as the GL arrives at this point after only 345 years of LSO forcing (375 years with α 2 extrapolation included), then moves across the ridge at a rate controlled by the linear bed prescription and ocean melting rate.
In model experiments with a plastic bed, Thwaites is able to retain more of a buttressing ice-shelf throughout the first several decades of retreat when we extrapolate basal friction seaward under either static ocean forcing. The high-buttressing area on the western part of Thwaites' GZ that we see with the dynamic front enabled persists longer when we extrapolate α 2, slightly slowing down initial GL migration as a result of either ocean forcing. Though throughout the rest of TG's retreat over an m = 8 bed, the GL modeled without α 2 extrapolation is only slightly farther inland relative to the GL in the model run with α 2 extrapolation included, likely highlighting the progressive strengthening of MISI as the GL retreats into the deeper inland basin as well as the eventual limiting impact of boundary effects. Under HSO, we reach rapid retreat behavior only 5 years sooner without friction extrapolation. This offset in timing of onset of rapid retreat past Upper Thwaites ridge is more pronounced with the low-melt ocean condition, as it favors ice-shelf persistence and therefore, magnifies the effect of the difference in buttressing during Thwaites' initial retreat from its modern GL, such that rapid retreat occurs ~15 years sooner without α 2 extrapolation.


 Open access