




Introduction
Soils represent the fundamental component for the agricultural system, for wild flora, fauna and humankind. The healthy condition of the soils is essential for food production and for a resilient ecosystem. More than 60% of European soils are considered ‘unhealthy’, being affected by the land degradation process (Panagos et al., Reference Panagos, Borrelli, Jones and Robinson2024). The European Union (European Commission, 2023a,b) has recently proposed a Soil Monitoring Law to offer a legal framework for soil health. Soil fertility and health are defined by their properties, such as organic matter, clay content, bulk density (BD), pH, etc., and soil organic carbon (SOC) influences many soil properties, being of utmost importance (Paltineanu et al., Reference Paltineanu, Dumitru, Vizitiu, Mocanu, Lăcătușu, Ion and Domnariu2024). Soils store the most organic carbon in the terrestrial biosphere (Lal, Reference Lal2004; Schmidt et al., Reference Schmidt, Torn, Abiven, Dittmar, Guggenberger, Janssens, Kleber, Kögel-Knabner, Lehmann, Manning, Nannipieri, Rasse, Weiner and Trumbore2011). Various soil functions and health indicators were developed by some scientists (Schulte et al., Reference Schulte, Creamer, Donnellan, Farrelly, Fealy, O’Donoghue and O’hUallachain2014; Van Leeuwen et al., Reference Van Leeuwen, Saby, Jones, Louwagie, Micheli, Rutgers, Schulte, Spiegel, Toth and Creamer2017; Sere et al., Reference Sere, Le Guern, Bispo, Layet, Ducommun, Clesse, Schwartz and Vidal-Beaudet2024) using SOC. Geology, climate, land use, land management, etc., influence SOC sequestration (Scharlemann et al., Reference Scharlemann, Tanner, Hiederer and Kapos2014; Paustian et al., Reference Paustian, Collier, Baldock, Burgess, Creque, DeLonge, Dungait, Ellert, Frank, Goddard, Govaerts, Grundy, Henning, Izaurralde, Madaras, McConkey, Porzig, Rice, Searle, Seavy, Skalsky, Mulhern and Jahn2019; Paltineanu et al., Reference Paltineanu, Lacatusu, Vrinceanu and Lăcătusu2020a, Reference Paltineanu, Dumitru, Vizitiu, Mocanu, Lăcătușu, Ion and Domnariu2024). Establishing the benchmarks for SOC storage as low, medium and high levels is complex and variable, depending on different soil-forming factors such as parent material, topography, climate, time, soil biology, human intervention (Richter and Yaalon, Reference Richter and Yaalon2012) and site-specific factors (soil texture, potential for carbon sequestration and management practices (Drexler et al., Reference Drexler, Broll, Flessa and Don2022; Prout et al., Reference Prout, Shepherd, McGrath, Kirk, Hassall and Haefele2022; Chahal et al., Reference Chahal, Amsili, Saurette, Bower, Gillespie, van Es and Van Eerd2024).
Fine silt and clay particles retain more stable the organic carbon in soil as shown by Hassink (Reference Hassink1997), Hassink and Whitmore (Reference Hassink and Whitmore1997), Stewart et al. (Reference Stewart, Paustian, Conant, Plante and Six2007) and Matus (Reference Matus2021), while Fujisaki et al. (Reference Fujisaki, Chapuis-Lardy, Albrecht, Razafimbelob, Chotte and Chevallier2018) and Heikkinen et al. (Reference Heikkinen, Keskinen, Kostensalo and Nuutinen2022) also stressed the clay contribution for SOC sequestration. Six et al. (Reference Six, Conant, Paul and Paustian2002) and Rasmussen et al. (Reference Rasmussen, Heckman, Wieder, Keiluweit, Lawrence, Berhe, Blankinship, Crow, Druhan, Hicks Pries, Marin-Spiotta, Plante, Schädel, Schimel, Sierra, Thompson and Wagai2018) emphasized the role of clay mineralogy as an important predictor of soil carbon, while Singh et al. (Reference Singh, Sarkar, Biswas, Bolan and Churchman2017) reported the higher capacity of sesquioxides and kaolinitic-illitic minerals for soil carbon stabilization.
The indicator represented by SOC/clay ratio was chosen by Johannes et al. (Reference Johannes, Matter, Schulin, Weisskopf, Baveye and Boivin2017) in Switzerland and used by Prout et al. (Reference Prout, Shepherd, McGrath, Kirk and Haefele2021) in England and Wales to characterize the soil health using the following thresholds: >1/8 (0.125) as very good, between 1/8 and 1/10 (0.100) as good, between 1/10 and 1/13 (0.077) as moderate and <1/13 as degraded. The SOC/clay ratio has been recently proposed as an indicator of soil organic matter status for mineral soils within the framework of the European Soil Monitoring Law proposal (European Commission, 2023a). However, Poeplau and Don (Reference Poeplau and Don2023), Rabot et al. (Reference Rabot, Saby, Martin, Barré, Chenu, Cousin, Arrouays, Angers and Bispo2024), Mäkipää et al. (Reference Mäkipää, Menichetti, Martínez-García, Törmänen and Lehtone2024), Feeney et al. (Reference Feeney, Bentley, De Rosa, Panagos, Emmett, Thomas and Robinson2024), Chahal et al. (Reference Chahal, Amsili, Saurette, Bower, Gillespie, van Es and Van Eerd2024) and Paltineanu et al. (Reference Paltineanu, Mocanu, Vizitiu, Domnariu and Dumitru2025b) criticized the ratio between SOC and clay content as a universal soil health index, especially for extreme-textured soils. Poeplau and Don (Reference Poeplau and Don2023) consequently proposed a ratio between observed (current) and ‘expected’ SOC estimated using linear regression models to predict the SOC content depending on clay content, while in the case of Feeney et al. (Reference Feeney, Bentley, De Rosa, Panagos, Emmett, Thomas and Robinson2024), the authors proposed a ratio between the observed and ‘typical’ SOC (O/T SOC), where ‘typical’ SOC was defined as its mean content estimated by regression analysis for various pedo-climate zones. According to Feeney et al. (Reference Feeney, Bentley, De Rosa, Panagos, Emmett, Thomas and Robinson2024), O/T SOC incorporates the influences of land cover, climate and soil texture alike. Nevertheless, the recent attempts to find an agreement for soil health assessment are not yet worldwide recognized. In Romania, there is a large diversity of landscapes, climates, vegetation floors and soil conditions requiring the development of a specific soil health indicator for a consistent soil depth of 0.5 m, for this part of Europe. Paltineanu et al. (Reference Paltineanu, Mocanu, Dumitru and Domnariu2025a) have reported data and a recent methodology on the health indicators across this country. Development of a reliable and realistic indicator of SOC storage accounting for the various driving variables at a regional scale is still required (Chahal et al., Reference Chahal, Amsili, Saurette, Bower, Gillespie, van Es and Van Eerd2024).
The purpose of this study is to find a more adapted way to assess the mineral soil health in central-south-eastern European environments (Romania) for a soil depth of 0.5 m, based on the hypothesis that different pedo-climatic regions exert significant effects on SOC values, by adjusting to local conditions the methods used by recent approaches on expected SOC values for shallower depths (e.g. Poeplau and Don, Reference Poeplau and Don2023; Feeney et al., Reference Feeney, Bentley, De Rosa, Panagos, Emmett, Thomas and Robinson2024; Chahal et al., Reference Chahal, Amsili, Saurette, Bower, Gillespie, van Es and Van Eerd2024).
Materials and methods
A database (ICPA Bucharest Archive) of 991 mineral soil profiles was used for this study. The database consisted of chemical and physical analyses taken from the soil pedo-genetical horizons and analysed for basic soil properties (e.g. SOC, particle-size distribution, pH, etc.) using the standardized methods reported by Florea et al. (Reference Florea, Balaceanu, Rauta and Canarache1987). The profiles were sampled during 2012–2022 in forestland, grassland and cropland, which were in a relatively balanced proportion. The landforms are balanced across Romania and diverse (low and high-level river plains, hills, plateaus and mountains), and the elevation varies from the sea level to about 2500 m high in the mountains, determining the continental-temperate climate across Romania. Mean annual air temperature (T) and precipitation (P) data have been estimated for a time period starting from 1961 for more than four decades, for each soil profile with the Climate Adapt Program by interpolating the data grid (New et al., Reference New, Lister, Hulme and Makin2002). Using the above data, the de Martonne aridity index (Iar) (with Iar=Pr/(T+10), de Martonne, Reference de Martonne1926) has been calculated.
The vegetation is also diverse, from that one specific to steppes and silvo-steppes in the south-eastern part of the country to that of deciduous trees in the high plains, tablelands and hills and coniferous trees and specific shrubs and grasses in the high mountains. The national soil taxonomy system (Florea and Muntenu, Reference Florea and Muntenu2012) was used in this study. There were 10 soil classes and 22 soil types (in parentheses) studied, as follows: (1) Antrisols (Anthrosol, 15 soil profiles); (2) Cambisols (Eutricambosols and Districambosols, 255 profiles); (3) Chernisols (Chernozems, Phaeozems, Kastanozems, Rendzinas, 188 profiles); (4) Hydrisols (Gleysols and Stagnosols, 31 profiles); (5) Luvisols (Preluvosols, Luvosols, Alosols, 259 profiles), (6) Protisols (Aluviosols, Psamosols, Regosols, Lithosols, 174 profiles); (7) Salsodisols (Solonchaks/Solonetzes, 18 profiles); (8) Spodisols (Prepodzols and Podzols, 38 profiles); (9) Umbrisols (Humosiosols, 2 profiles); and (10) Vertisols (Pelosols and Vertosols, 11 profiles). Details for the natural elevation zoning and soil location and presentation in Romania can be found in three recent papers (Dumitru et al., Reference Dumitru, Paltineanu, Vizitiu and Domnariu2024; Lacatusu et al., Reference Lăcătușu, Paltineanu, Vrinceanu and Lăcătușu2019; and Paltineanu et al., Reference Paltineanu, Dumitru, Vizitiu, Mocanu, Lăcătușu, Ion and Domnariu2024).
Considering the procedures reported by Poeplau and Don (Reference Poeplau and Don2023), Feeney et al. (Reference Feeney, Bentley, De Rosa, Panagos, Emmett, Thomas and Robinson2024) and Chahal et al. (Reference Chahal, Amsili, Saurette, Bower, Gillespie, van Es and Van Eerd2024), and adjusting them to the studied area and to the specific conditions, the environment characteristics of Romanian territory were grouped according to elevation (i.e. differing for climate: precipitation, temperature, Iar and vegetation), landform, land use, soil texture, soil pH, because these features were found to be key predictors for SOC content (Dumitru et al., Reference Dumitru, Paltineanu, Vizitiu and Domnariu2024; Lăcătușu et al., Reference Lăcătușu, Paltineanu, Vrinceanu and Lăcătușu2019; Paltineanu et al., Reference Paltineanu, Dumitru, Vizitiu, Mocanu, Lăcătușu, Ion and Domnariu2024), resulting in 19 pedo-climatic regions, as described in Table 1. SOC contents calculated as average values for 0.5 m depth, similar to all soil properties’ calculation, were more or less homogeneous within each region and substantially differing between regions. The soil depth of 0.5 m was used because most of the active plant roots develop within that depth, as a result of previous studies (Paltineanu et al., Reference Paltineanu, Septar, Gavat, Chitu, Oprita, Moale, Calciu, Vizitiu and Lamureanu2016, Reference Paltineanu, Dumitru, Vizitiu, Mocanu, Lăcătușu, Ion and Domnariu2024).
Means of annual air temperature, precipitation, aridity index and SOC content for 0.5 m depth depending on elevation (climate + vegetation floor), land use and clay content; SOC means in forestland and grassland are considered ‘reference levels’ (bold) for each studied pedo-climatic region in Romania, while SD is standard deviation, and the small letters in superscript in the furthest right column represent significant differences when different
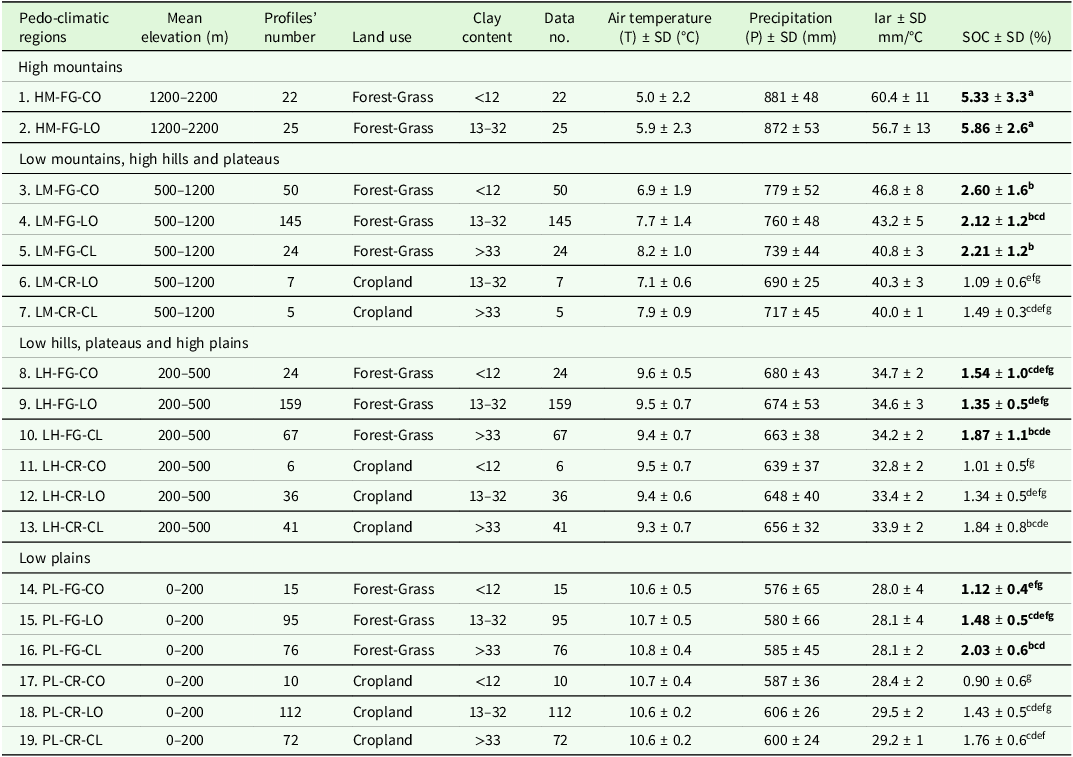
SOC content reached an equilibrium in grassland and forestland under a long and continuous period (Hassink, Reference Hassink1997; Matus, Reference Matus2021). Paltineanu et al. (Reference Paltineanu, Lacatusu, Vrinceanu, Vizitiu and Lacatusu2020b) found higher SOC values and better physical properties such as soil total- and macro-porosity and hydraulic conductivity for the same soil types in forest soils versus arable soils. Observed per mean SOC (O/M SOC ratios) values were thus calculated from the current SOC content values divided by the mean SOC average values of those land uses where human influence on the environment was minimum and where SOC sequestration reached a pedo-climatic equilibrium, that is, forestland and grassland, for each soil texture. These ratios were calculated as mean values (± standard deviations) for each region. These mean SOC (M SOC) content values were considered as ‘reference levels’, shown in Table 1 in bold, for a good soil health in the studied pedo-climatic regions for forestland and grassland; in other words, the mean SOC contents for each texture and elevation (climate and vegetation alike) obtained from a large data number, were ‘reference levels’ for a good soil health not only for forestland and grassland, but also for cropland (that has no own reference level SOC). SOC content means ranged from about 1.0% within low-elevation plains to about 6.0% within high-elevation mountains. The O/M SOC categories of this normalized indicator were grouped according to method of Feeney et al. (Reference Feeney, Bentley, De Rosa, Panagos, Emmett, Thomas and Robinson2024), by using ‘quartile.exc’ function from Microsoft Excel, such as: ‘low’ category below the first quartile, ‘intermediate’ between the first and second quartiles (medians), ‘high’ between the second and third quartiles, ‘very high’ above the third quartile and below the upper fence boundary, while outliers were those values higher than the upper fence. Analysis of variance and Duncan’s multiple range test were used to compare the means of the analysed soil properties (SPSS 21 version software) and also regression equations and t test to establish statistical significance.
There were four altitudinal groups in Romania, generally covering the vegetation and climate floors (Lăcătusu et al., Reference Lăcătușu, Paltineanu, Vrinceanu and Lăcătușu2019; Paltineanu et al., Reference Paltineanu, Dumitru, Vizitiu, Mocanu, Lăcătușu, Ion and Domnariu2024), characterized by specific mean annual precipitation, air temperature and de Martonne Iar values, as well as by specific SOC means. The pedo-climatic regions were named after the first two letters for (a) landforms (HM [high-elevation mountains]; LM [low-elevation mountains and high-elevation hills and plateaus], LH [low-elevation hills, plateaus and high plains], PL [low-elevation plains]), (b) for land uses (FG [forestland and grassland combined] and CR [cropland]) and (c) for soil texture (coarse [CO], with clay content <12%; loamy [LO], with clay content between 13 and 32%; and clayey [CL], with clay content >33%). The highest studied pedo-climatic regions (mountain area, 1200–2200 m a.s.l.) consist of two combined forestland-grassland sub-regions separated by soil texture (with a coarse texture and a loamy one); there is no cropland at this high elevation. Both sub-regions show a cool mean annual temperature (5–6°C), high precipitation (>950 mm annually) and a wet climate aridity index (Iar=57–60 mm/°C), where SOC content reaches as much as 5.3–5.9% (reference level), which is statistically higher than SOC content in all the other regions, but is not much different between soil textures (Table 1).
The following pedo-climatic regions (altitudinal area of 500–1200 m a.s.l.) occur in low mountains, high hills and plateaus and consist of five sub-regions, with three of them covering the forestland-grassland areas separated by soil textures and two sub-regions of cropland because of two existing soil textures, the loamy and clayey ones. Mean annual air temperature roughly ranges between 7 and 8°C, while precipitation and Iar occur between 690 and 780 mm and 40–47 mm/°C, respectively. The mean SOC content varies from about 2.12–2.60% (reference level) in the forestland-grassland areas to around 1.10–1.50% in the cropland areas. The two forestland-grassland sub-regions present significantly higher SOC values than the cropland regions. The 200–500 m altitudinal area (pedo-climatic regions), with two land use sub-regions (forestland and grassland combined and cropland) and three soil texture sub-regions (coarse, loamy and clayey), consists geomorphologically of low hills, plateaus and high plains (Table 1). The mean annual air temperature ranges around 9.3–9.6°C, precipitation around 640–680 mm and Iar around 33–35 mm/°C. The mean SOC content ranges between 1.35 and 1.87% (reference level) in forest-grassland areas and from 1.0 to 1.84% in cropland areas, slowly increasing from a coarse texture to a clayey one. The last altitudinal (0–200 m a.s.l.) area (pedo-climatic regions) also consists of both land use sub-regions and three soil texture sub-regions. The mean annual air temperature varies around 10.6–10.8°C, precipitation around 575–600 mm and Iar around 28.0–29.6 mm/°C (Table 1). The average SOC content shows a pattern that is similar to one of the 200–500 m a.s.l. pedo-climatic region. The reference level of SOC content was between 1.12 and 2.03% for this area, depending on soil texture.
Results
SOC/clay, O/M SOC and BD in the studied pedo-climatic regions
Figure 1 shows SOC/clay, O/M SOC and BD (kg/dm3) as 0.5 m soil depth average values in the studied pedo-climatic regions. The SOC/clay ratio shows the highest values within the mountain areas (HM-FG-CO and HM-FG-LO), much higher than the recommended EU SOC/clay values. For the other pedo-climatic regions, the SOC/clay values were significantly higher within the coarse-textured soils (and also higher than the EU recommended soils) than in the loamy- and clayey-textured soils, because of the increase in ratio denominators. Unlike the SOC/clay ratios, the mean O/M SOC ratio values, calculated using denominators (reference levels) that were specific for each sub-region, were around 1.0 in most pedo-climatic regions and sub-regions where their maximum potential was reached, being a normalized indicator and showing that the SOC drivers’ influence was thus levelled across the country’s soils within these areas. Nevertheless, for some cropland sub-regions (LM-CR-LO, LM-CR-CL, LH-CR-CO, PL-CR-CO and PL-CR-CL), where the SOC sequestration conditions were below their pedo-climatic potential for SOC sequestration from forestland and grassland, the O/M SOC means were significantly lower than 1.0. Further comparisons were then made within the pedo-climatic regions that had certain capacities to sequester C in soils.
SOC/clay, O/M SOC and bulk density (BD, kg/dm3) as 0.5 m depth means in the studied pedo-climatic regions and sub-regions; the values (columns) that are associated with different letters are significantly different for the same character, and the horizontal dash lines represent the 1/13 (0.077), 1/10 (0.100) and 1/8 (0.125) SOC/clay lines that are considered limits for various levels of healthy soils by EU recommendations.
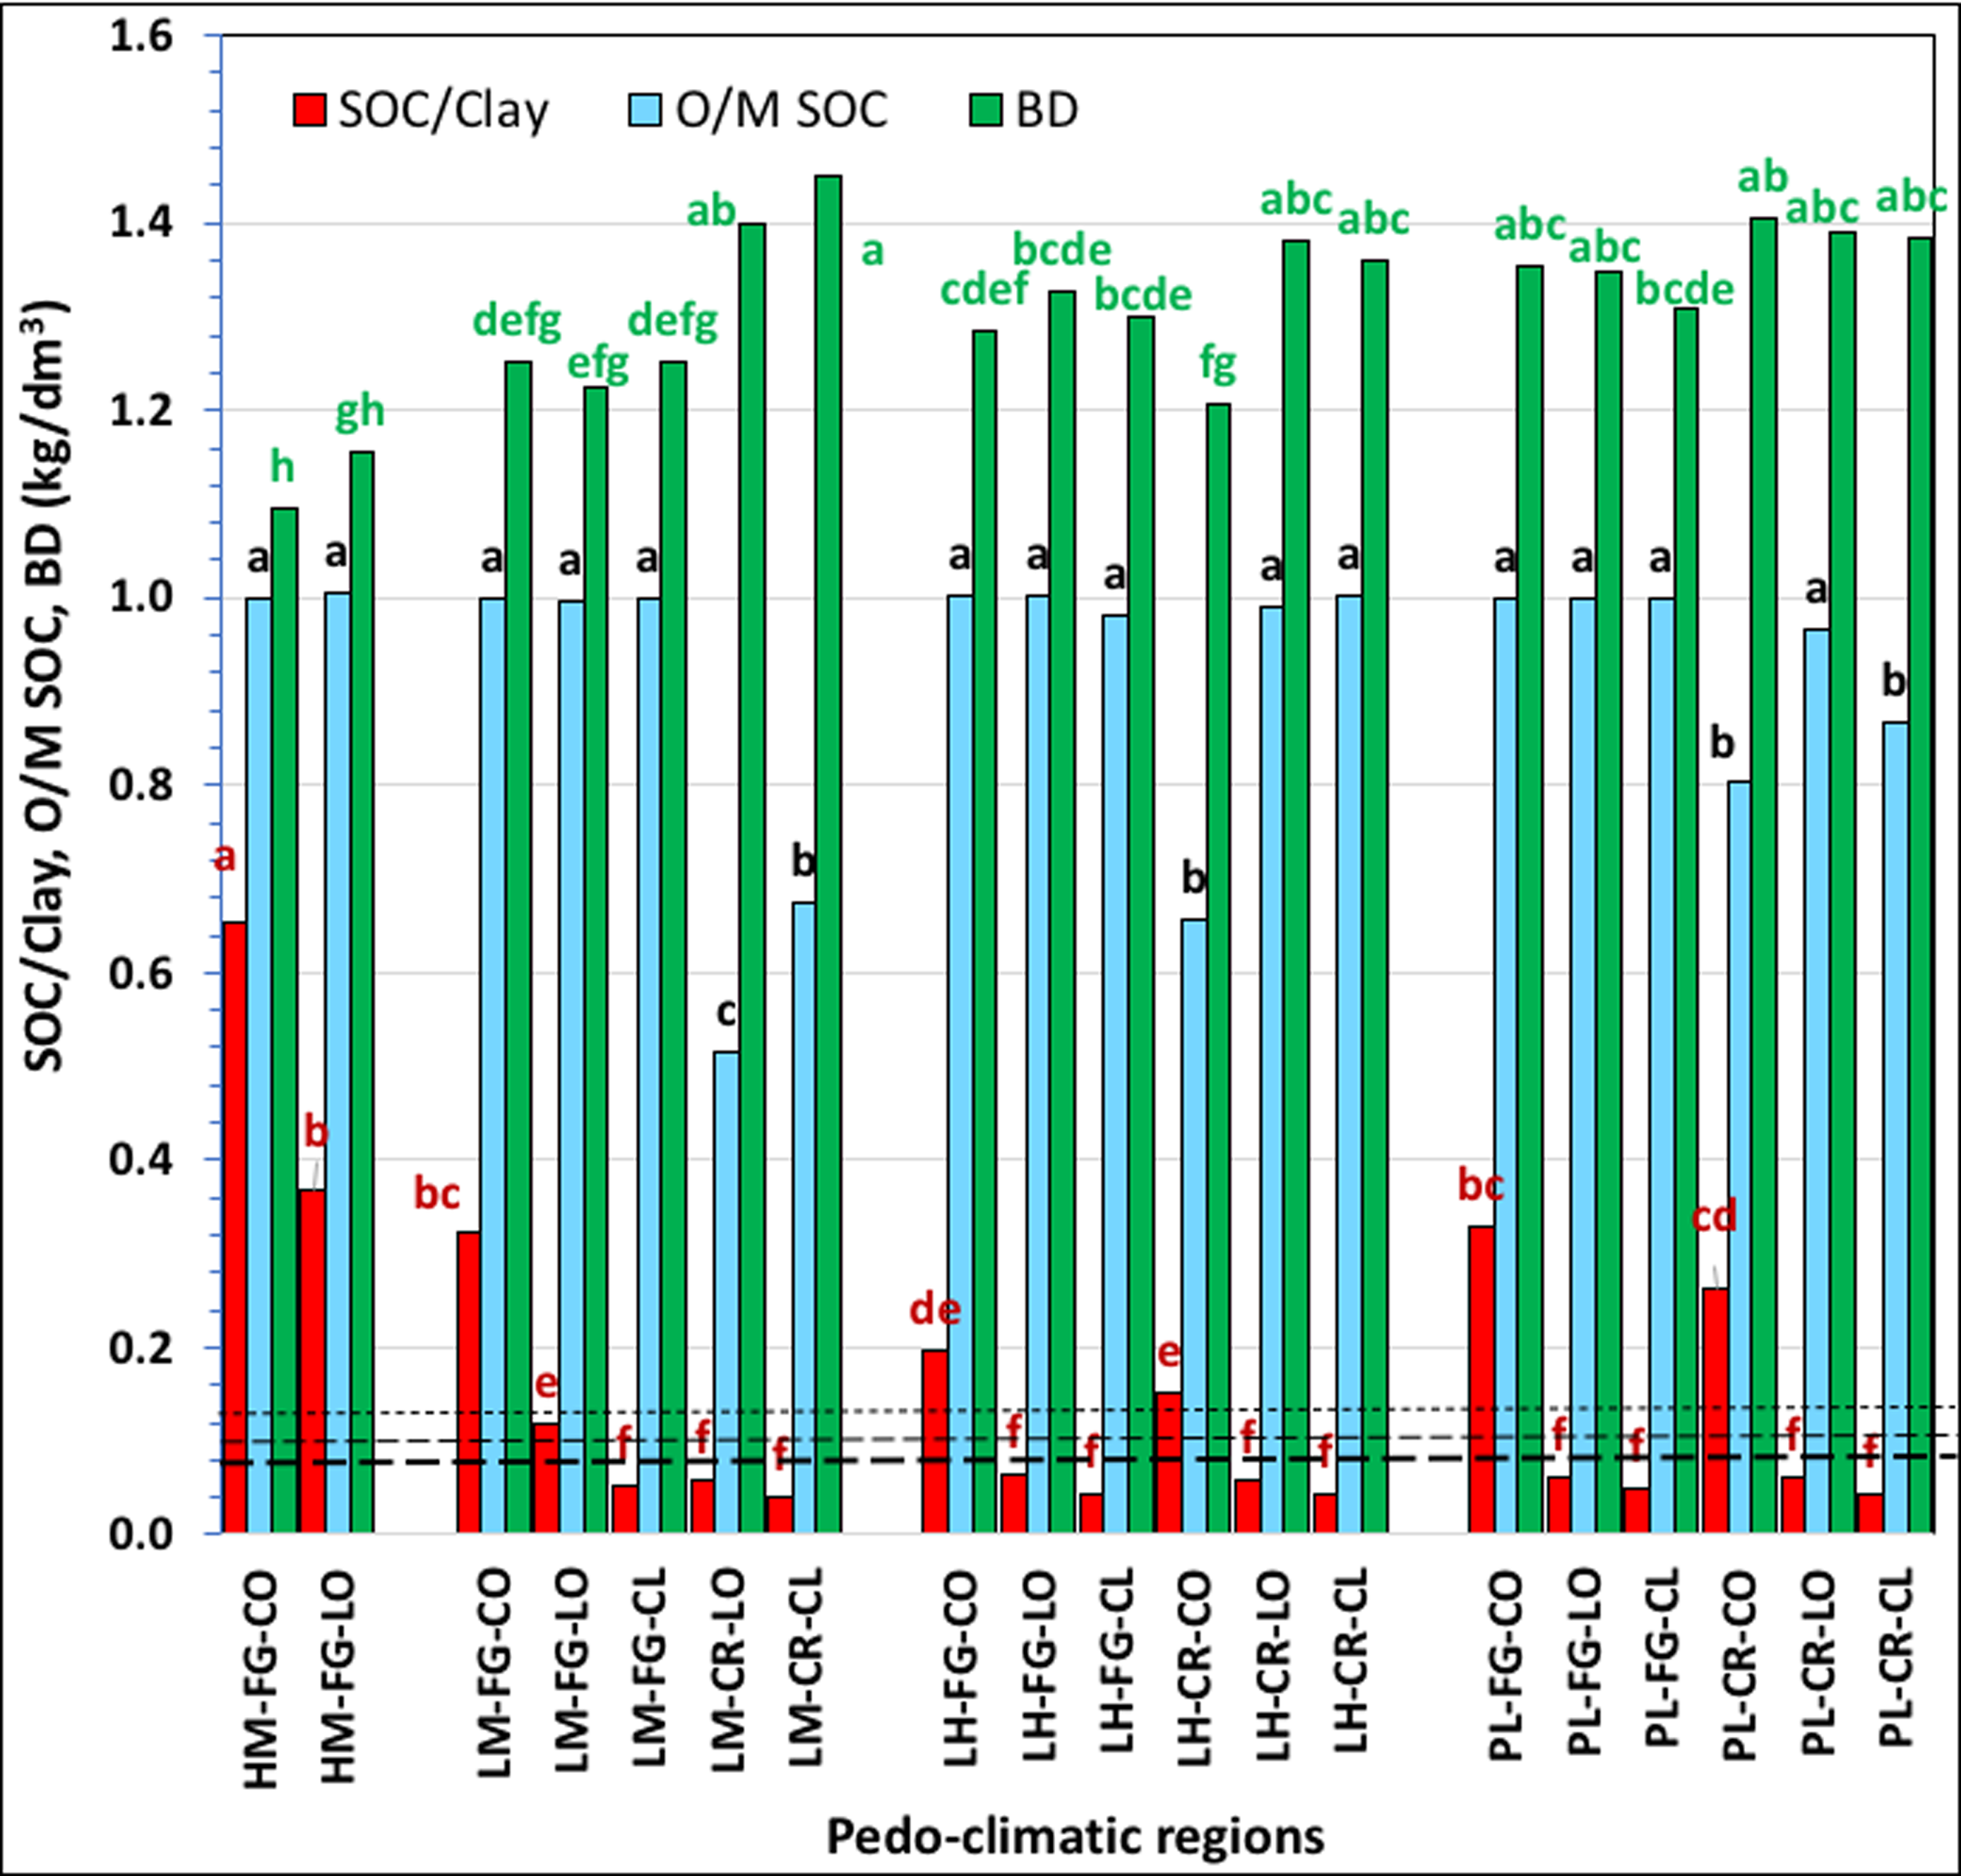
Considered a proxy for the soil structure, BD was the lowest in the mountain areas (HM-FG-CO and HM-FG-LO) and showed a good soil health through the other derived soil physical properties (porosity, hydraulic conductivity, Paltineanu et al., Reference Paltineanu, Lacatusu, Vrinceanu, Vizitiu and Lacatusu2020b) and was the highest in cropland regions (LM-CR-LO, LM-CR-CL, HL-CR-LO, HL-CR-CL, PL-CR-CO, PL-CR-LO and PL-CR-CL), probably due also to tillage and field work. Among some of these regions, BD presented significant differences.
SOC, SOC/clay, O/M SOC and BD for soil classes depending on the pedo-climatic regions
The mean values of 0.5 m depth for SOC, SOC/clay, O/M SOC and BD of soil classes depending on pedo-climatic regions represented by mountains, high-elevation hills and plateaus are shown in Table 2, the upper part, while those represented by low hills, plateaus, high plains and low plains are in Table 2, the lower part, together with their characterizations. ‘Support points’ SOC values (written in bold in Table 2) were established for all sub-regions using an intersection of two criteria: SOC/clay values of minimum 0.077, that is, moderate soil health, and at least an ‘intermediate’ O/M SOC quartile category (where SOC/clay ratios were high) or preferably a ‘high’ or very high O/M SOC quartile categories (where the case, trying to meet these both conditions, where possible). At the same time, in the case of the clayey texture, adjustments were made to meet the increasing SOC trend with Iar and elevation. For example, the HM-FG-CO pedo-climatic region generally consists of Spodisols, Cambisols and Protisols, with SOC values from 1.66 to 10.3%, and where SOC/clay exceeds 0.125, showing a very good soil health condition. O/M SOC range was split into four categories according to its calculated quartiles; the ‘low’ soil health category was delimited by the quartile of 0.53 (higher limit), corresponding to a mean SOC value of 1.66% and a mean of 0.19 value for SOC/clay, while the ‘intermediate’ category was delimited by the quartiles of 0.53 and 0.88, and the corresponding 3.63% as a mean SOC content, and 0.39 SOC/clay as a ratio mean. Consequently, for the SOC content reference level of the 1200–2200 m pedo-climatic region, the SOC value of 1.66% characterizes a low O/M SOC category, that is, a low (weak) soil health for the land use and climate potential of this mountainous region, even if SOC/clay ratio shows a very good health. Similarly, the high (good) and very high soil health conditions would be characterized by SOC contents that are higher than 3.63% (in bold in Table 2), because O/M SOC means show an intermediate soil health. Similarly, from the same mountainous region, HM-FG-LO presents a very good health according to SOC/clay ratios and low and intermediate soil health according to O/M SOC values up to a SOC content mean of 4.56% (also in bold in Table 2); from this SOC value on, the soil health presents high and very high health conditions for the region potential for carbon sequestration.
Mean values of SOC, SOC/clay, O/M SOC and BD for 0.5 m depth for interquartile intervals of soil classes depending on pedo-climatic regions represented by mountains, high-elevation hills and plateaus, low-elevation hills and plateaus and high plains and low plains and their characterization; SD is standard deviation
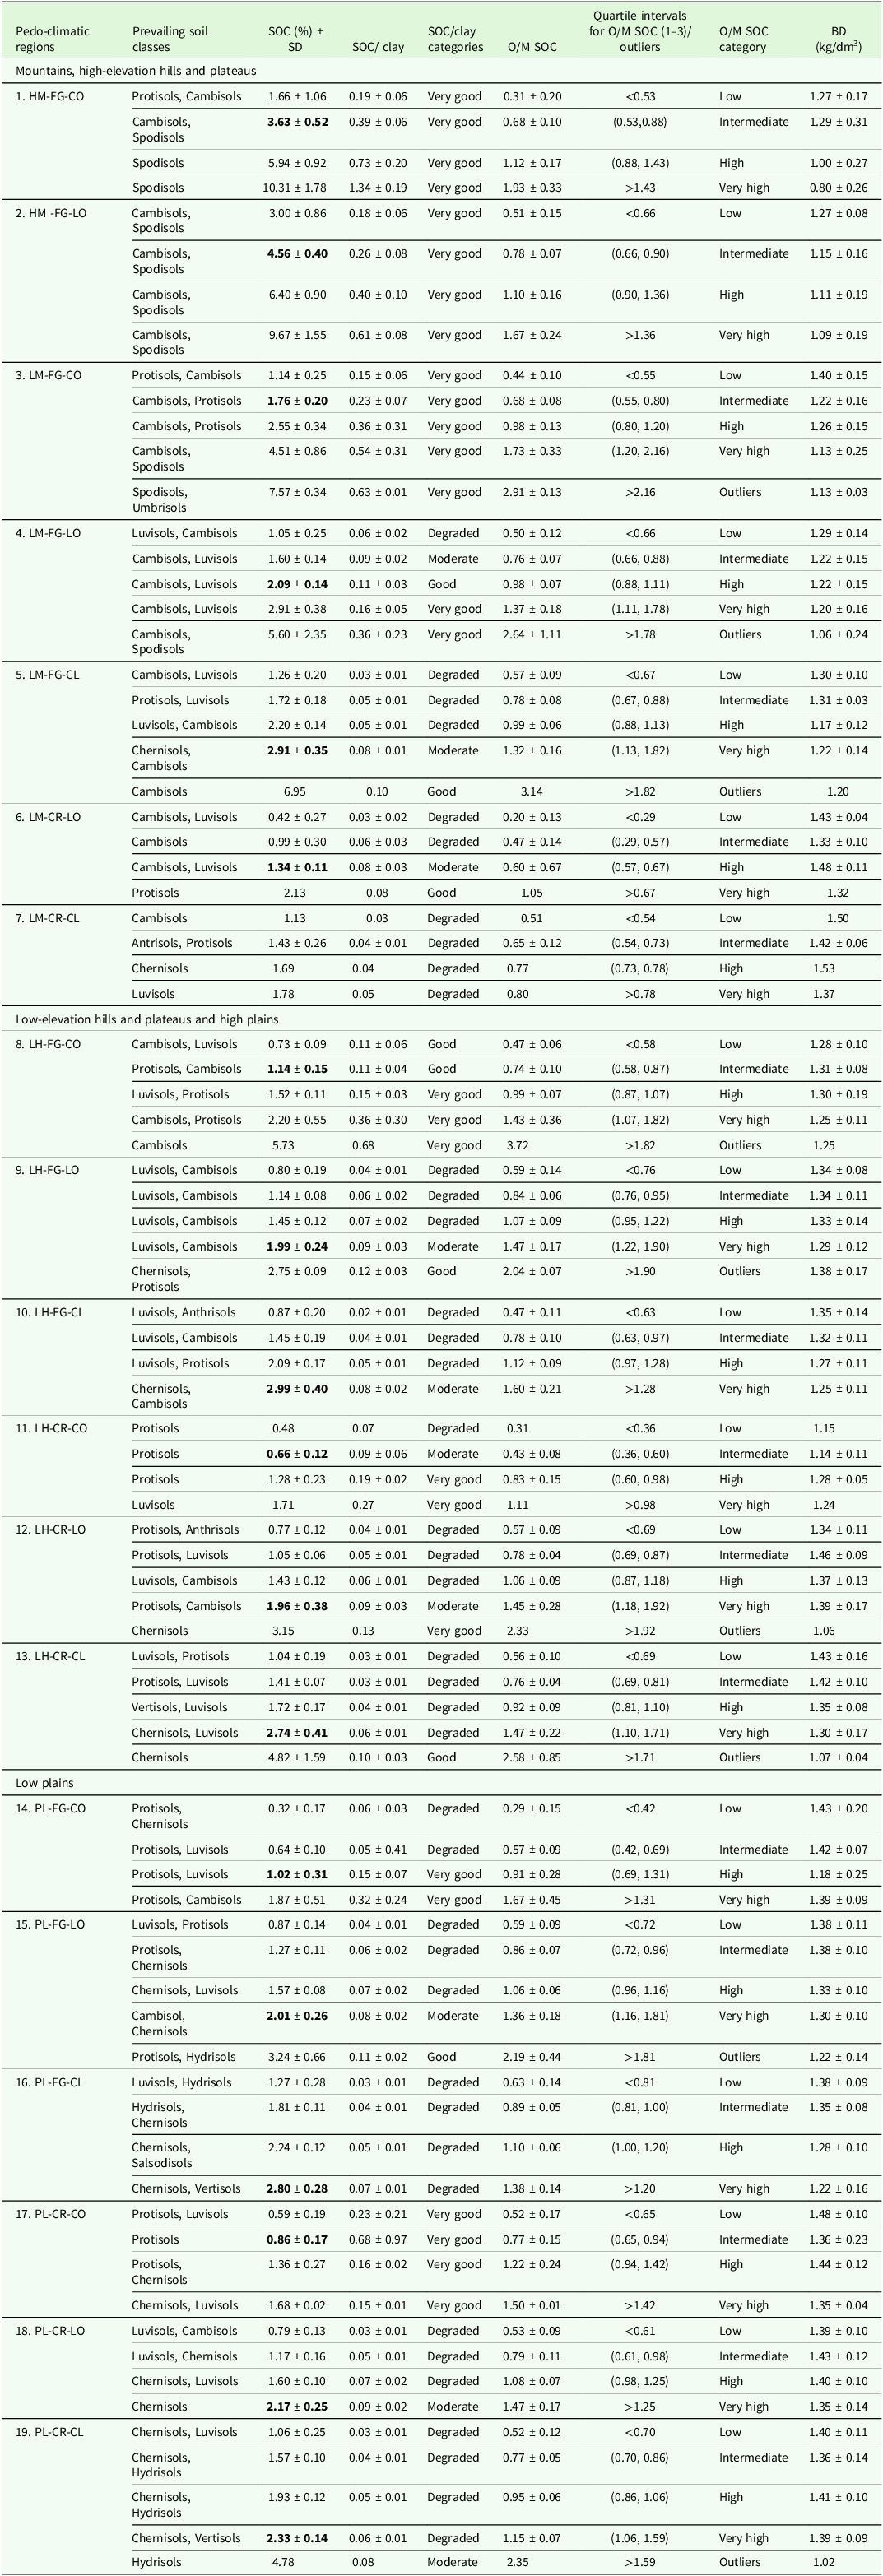
Following the next pedo-climate regions that decrease in elevation and are described in Table 2, it can be seen that the soil classes change slowly between regions while their corresponding SOC contents decrease slowly. Even if LM-FG-CO region presents a very good soil health after SOC/clay ratio for all textures, a mean SOC content of 1.76% would show a high soil health according to the SOC sequestration potential for this low mountainous forest-grassland region, while a SOC content of about 7.6% (outlier) would show ‘extremely high’ health condition. Similarly, for LM-FG-LO, LM-FG-CL, LM-CR-LO and LM-CR-CL regions, the SOC content means of 1.60, 1.72, 0.99 and 1.43% would show the limits for an intermediate and/or high soil health condition according to O/M SOC ratios; nevertheless, after SOC/clay ratios, the SOC values would be 2.09 instead of 1.60, a higher value; as 2.91, instead of 1.72%, a higher value; as 1.34, instead of 0.99%; and much above the value of 1.8, for instance, 2.91 from the same climate region (500–1200 m a.s.l.), as LM-FG-CL, instead of 1.43% (Table 2).
The altitudinal pedo-climatic regions represented by low hills, plateaus and high plains consist of various soil classes that change slowly from one region to another (Table 2, the lower part). Following the same reasoning as above, the SOC content mean values for LH-FG-CO, LH-FG-LO, LH-FG-CL, LH-CR-CO, LH-CR-LO and LH-CR-CL regions characterizing a ‘good’ or ‘high health’ condition according to both SOC/clay ratios and O/M SOC ratios are as follows: 1.14, 1.99, 2.99, 0.66, 1.96 and 2.74%, respectively, with the higher values for the finer soil textures. For the other pedo-climatic regions from the low-elevation plains: PL-FG-CO, PL-FG-LO, PL-FG-CL, PL-CR-CO, PL-CR-LO, PL-CR-CL the SOC content means meeting both criteria are: 1.02, 2.01, 2.80, 0.86, 2.17, 2.33%, respectively, again with the higher values for the finer soil textures.
Correlation between the support points of SOC content values and Iar, the SOC limits for a ‘good’ soil health
Using the highlighted (bold) SOC means limits for a good soil health fitting both criteria, that is, SOC/clay and O/M SOC ratios as shown in the above tables, that is, the support points, and Iar values to characterize climate for each pedo-climatic regions, regression equations were calculated for each soil texture, resulting in lower baselines (LBLs) (Fig. 2). This means, that for any coarse-, loamy- and clayey-textured soil occurring at any elevation below 2200 m a.s.l. and with Iar mean values of up to 90 mm/°C, practically covering most of the country land and pedo-climatic regions, these wrapping LBLs may be generally considered ‘diffuse’ boundaries to assess separation of ‘healthy’ soils that are above the curves from ‘non-healthy’ ones, which are below the curves. The higher point position in the graph, the higher (better) soil health. The correlation incorporates the influence of elevation, climate and vegetation on the soils’ health, versus the optimum conditions for SOC sequestration from forestland and grassland combined within any specific region, thus showing the current soil health in any land use. There was no significant LBL for clayey-textured soils, because the range of this texture was not sufficiently wide, especially towards the higher Iar values and high hills or mountains. However, the correlation coefficient of 0.598 was below the significant threshold (0.81), and because of this relative vicinity, the LBL for clayey-textured soils was still accounted for in this approach, only to have an orientation trend.
Relationships between the SOC limits for a good soil health and Iar and the distribution of SOC contents (average values for 0.5 m depth); vertical lines from left to right show the estimated limits of elevation for the pedo-climatic regions of 200 m (Iar=30), 500 m (Iar=38) and 1200 m (Iar=56), respectively.
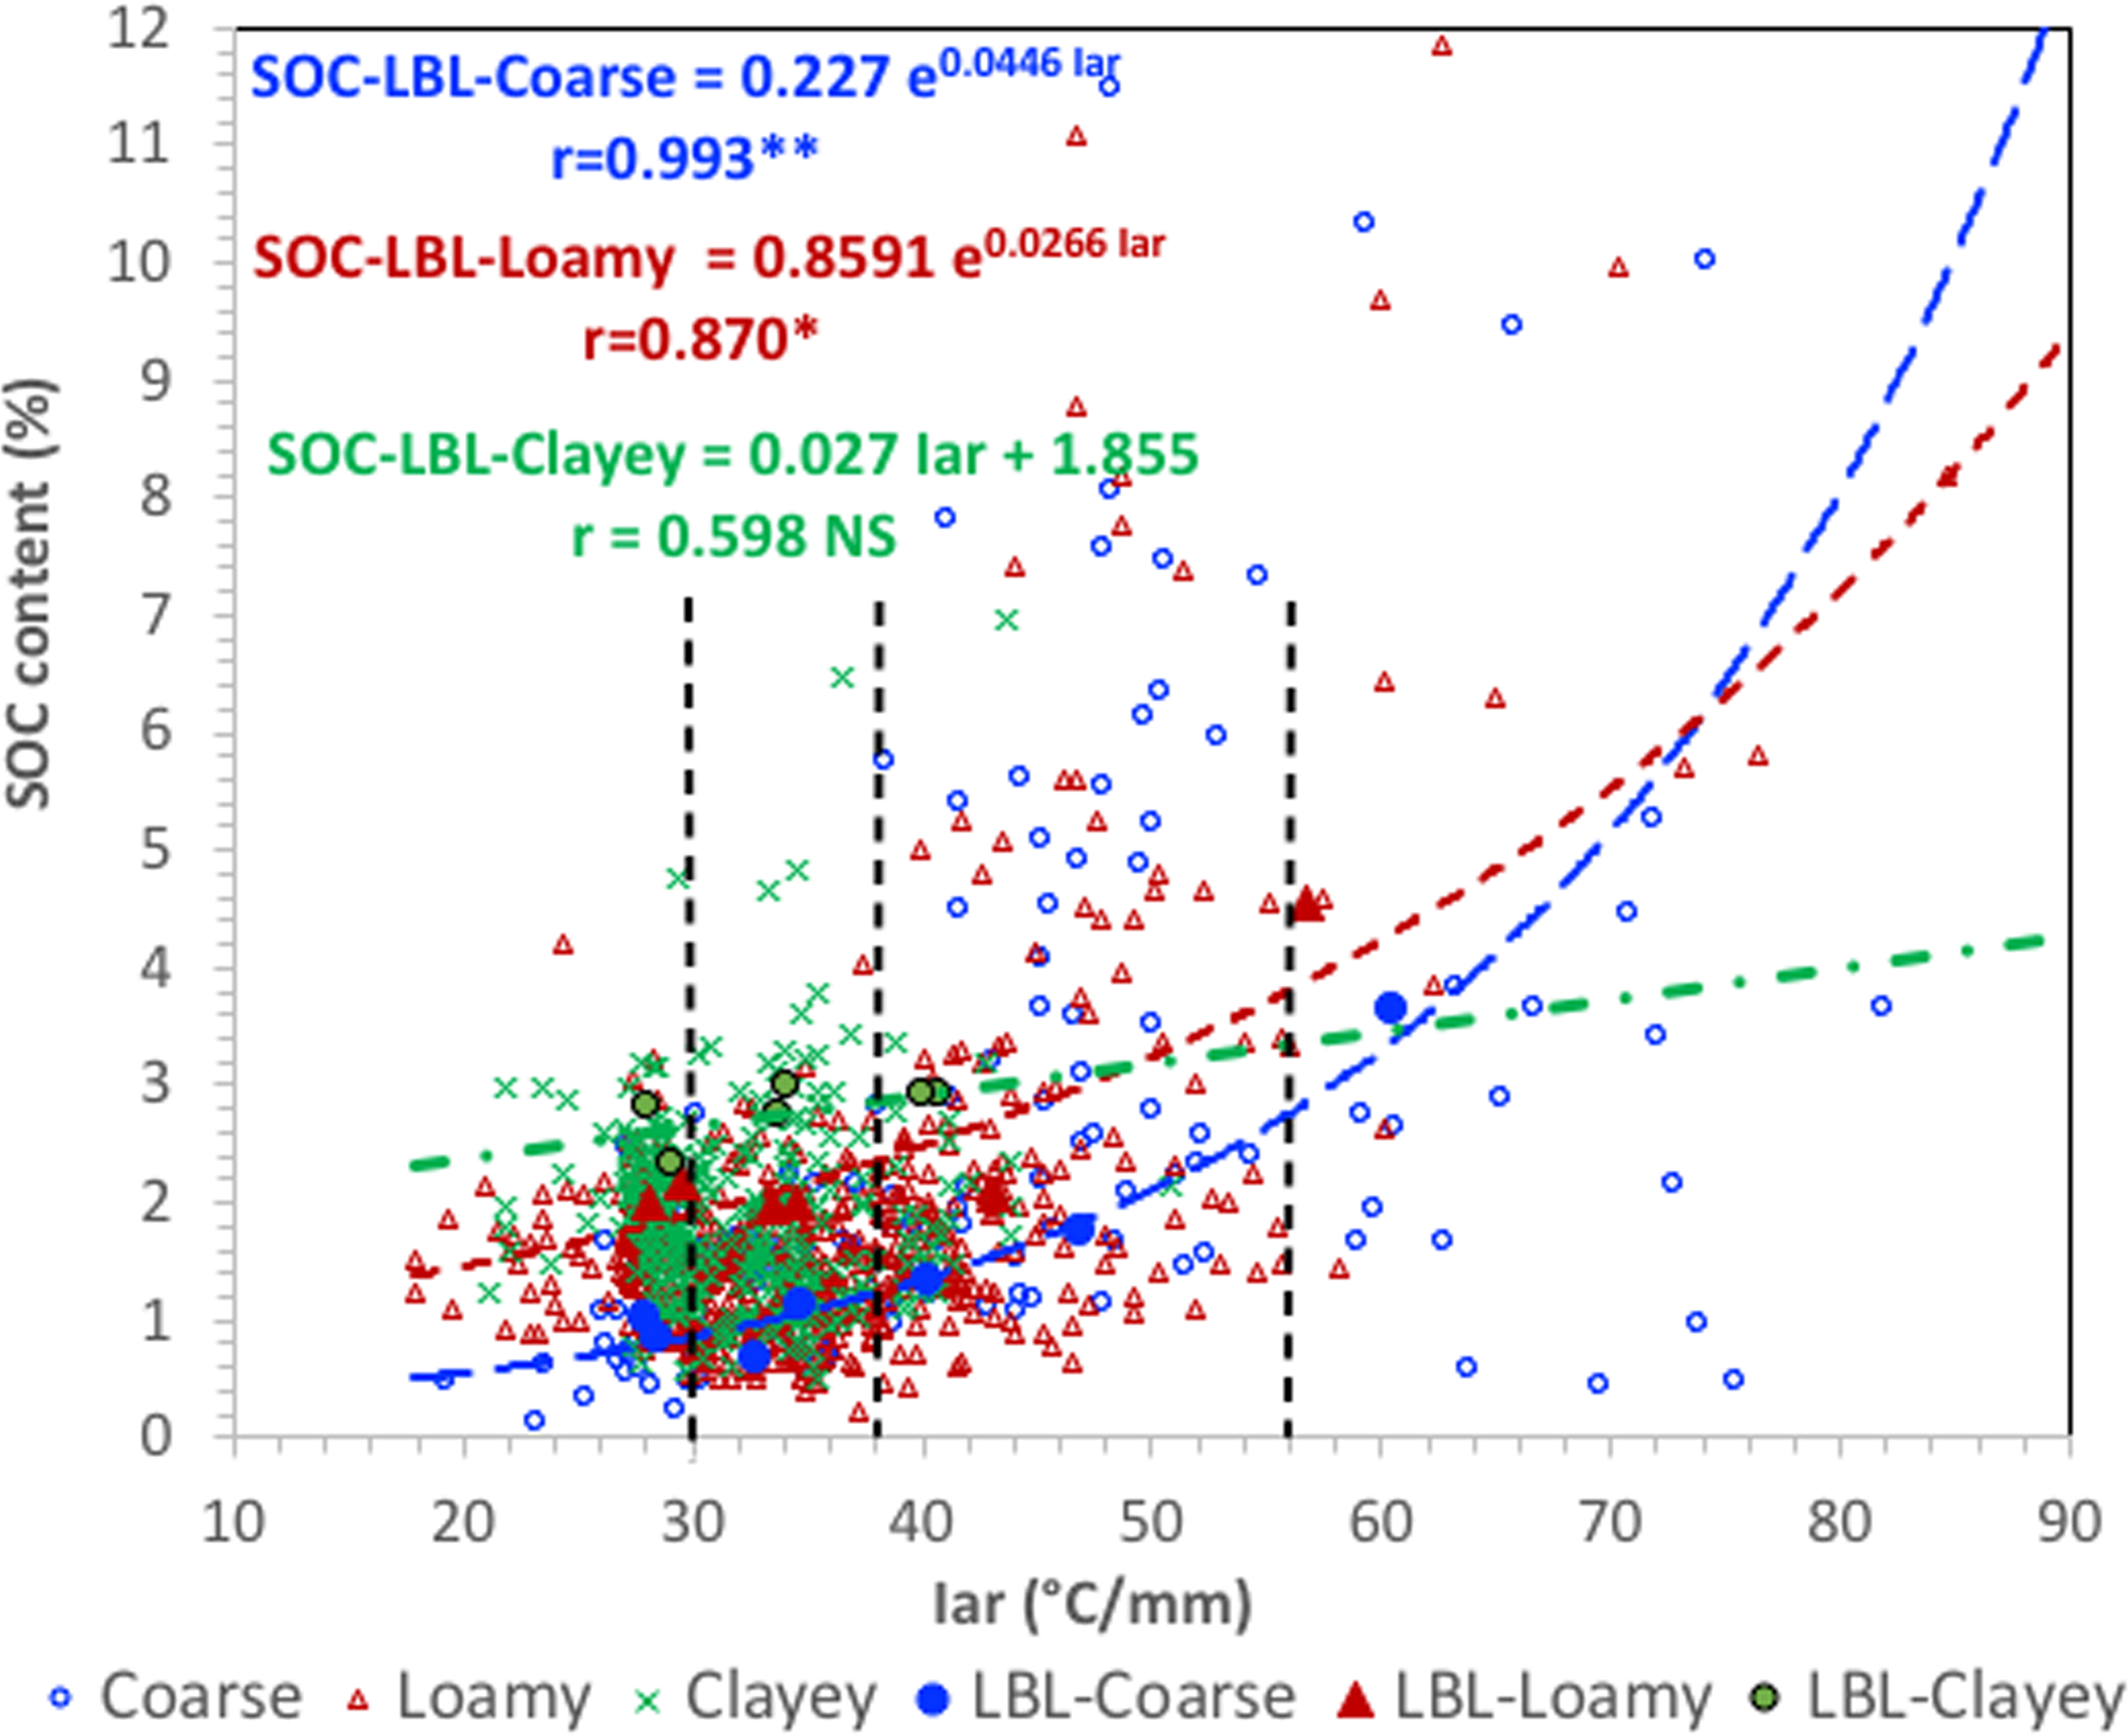
On the other hand, there was no significant correlation between O/M SOC values and Iar (y = 0.0013x+0.9532, with r = 0.0245 as not significant), the whole function value for all the Iar range reaching about 1.0 and showing no dependence between O/M SOC and Iar (data not presented).
Comparison between the two methods of health characterization, SOC/clay ratio and O/M SOC ratio and SOC/clay ratio combined
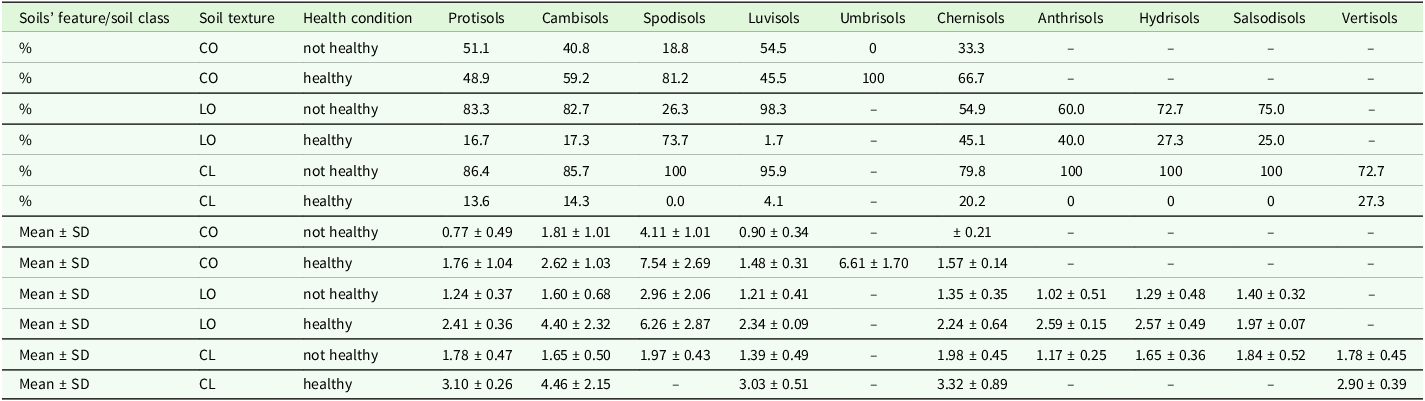
Using the regression equations obtained by help of the procedure using O/M SOC ratios and SOC/clay ratios combined, presented in Fig. 2, the SOC content values for each soil texture were separated into two domains: above the curve, characterized as healthy, and below the curves, as not healthy (Table 3). Further below, Table 4 presents the SOC/clay ratio characterization for the same textures and soil classes: as not healthy (degraded) for SOC/clay ratios below 0.077, moderate for the ratios between 0.078 and 0.100, good for 0.101 and 0.125 and very good for ratios higher than 0.126. In addition to percentages, the mean indicator and SD values were shown in these tables.
Percentage of the assessed soil profiles, mean and standard deviation (SD) of SOC (%) for the studied soil classes as a function of soil texture (coarse [CO], loamy [LO], clayey [CL]) using the regression equations between SOC content and Iar from above and splitting the soil profiles into not healthy and healthy; here and in the following table, some cells contained no data because there were no corresponding soil classes for them
Percentage, mean and standard deviation (SD) of SOC/clay ratios for the studied soil classes as a function of soil texture (coarse, loamy, clayey), splitting the soils into not healthy and various healthy categories
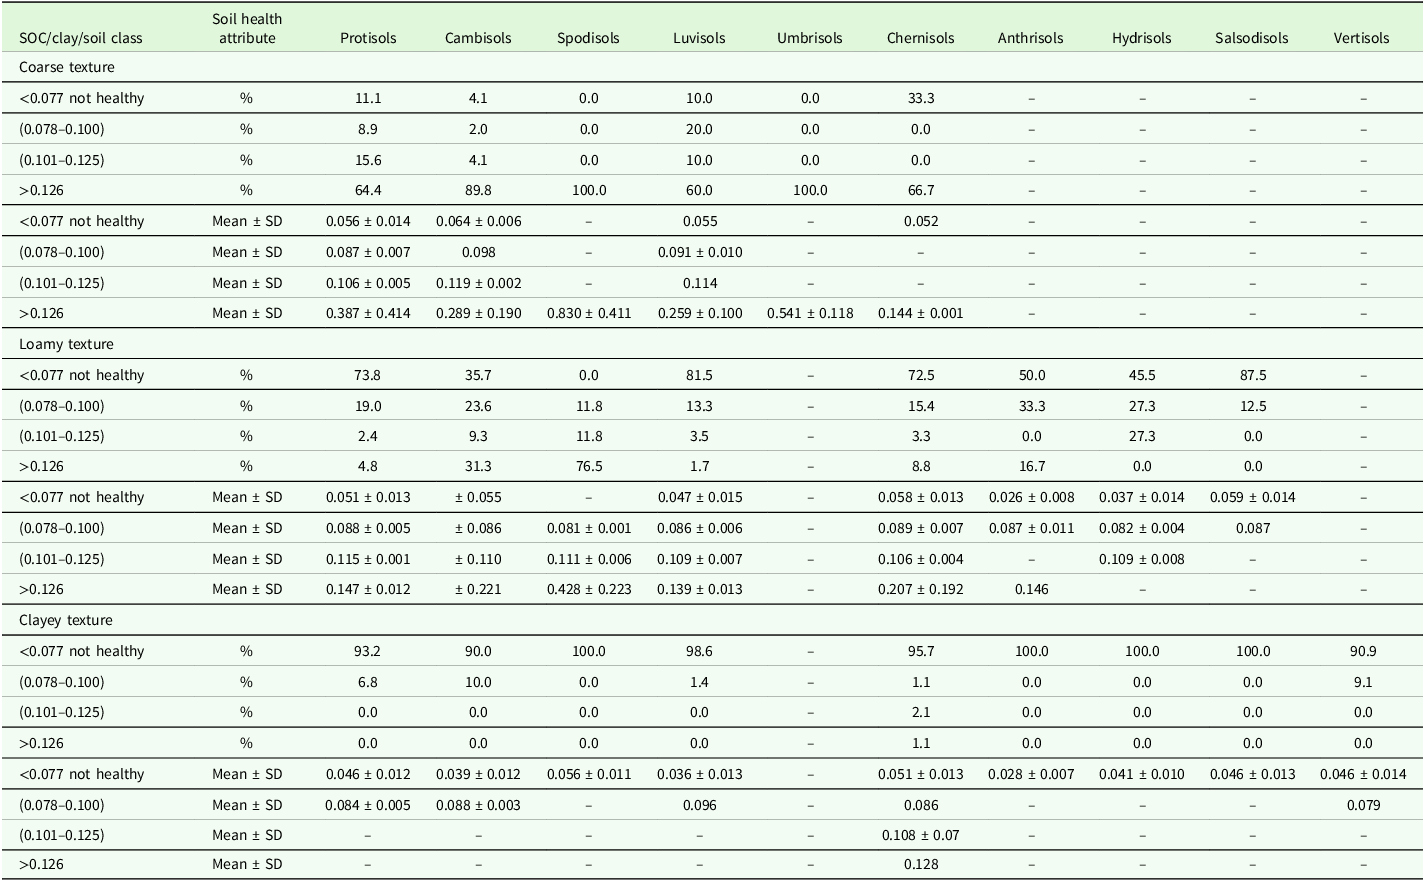
For the coarse texture, the degraded soil health condition showed higher values according to the O/M SOC ratio and SOC/clay ratio combined method, where the percentage of degraded soil health soils were much higher (Table 3) than according to the SOC/clay ratio method (Table 4); for example, Protisols were 51.1% in Table 3 versus 11.1%, in Table 4, as not healthy, except for Chernisols. Conversely, the percentage of ‘healthy’ soils was much higher when using only SOC/clay ratios in characterization; out of these three categories of healthy soils, the highest SOC/clay values (>0.126) were prevailing (Table 4), showing a bias due to the lowest clay contents. The means of SOC content for each category are within their own intervals. For the loamy soil texture, the situation is different. The degraded soils generally prevailed when using both indicators, O/M SOC ratio and SOC/clay ratio combined, versus SOC/clay ratio, except for Chernisols and Salsodisols, where the indicator values were inversely related but were not much different. In the case of clayey, the degraded soils according to O/M SOC ratio and SOC/clay ratio combined from Table 3 presented lower values than those from Table 4, where there were more than 90%, in some cases even 100%, just because of the high clayey contents, and this might also be a biased result.
Discussion
Elevation zoning is the main geographical driver in Romania, because it determines or influences climate, flora and soil, as well as other physical-geographical features (Mihăilescu, Reference Mihăilescu1969; Babaca, Reference Babaca1973; Serbanescu et al., Reference Serbănescu, Dragu and Babaca1973; Paltineanu et al., Reference Paltineanu, Chiţu, Tănăsescu, Apostol and Pufu2000; Dragu et al., Reference Dragu, Bălăceanu and Taină2009). By combining elevation (mainly representing the climate, vegetation and soils), land use and soil texture, the resulting pedo-climatic regions presented certain SOC values, which in many cases were significantly different among each other and were region-specific (Table 1). For the lower-elevation pedo-climatic regions represented by tablelands, low hills and plains, the difference between the reference levels of SOC is less obvious because of the drier climate. Organic soils containing more than 20% organic matter from local wet and warm regions caused by the presence of groundwater such as those from the Danube Delta were not included in this study.
The SOC/clay ratio was proposed by scientists and EU policy makers (European Commission, 2023a, 2023b) as a soil health indicator. However, some scholars criticized it because it did not succeed to meet all requirements. Firstly, SOC/clay is highly sensitive to clay contents and outside of loamy soils with medium clay contents (roughly 15–30% clay), the ratio starts to return disproportionately large records of either ‘Very good’ (in the case of clay-poor soils) or ‘Degraded’ (in the case of clay-rich soils). This is even noticeable for soils known to be considered rich in carbon and highly fertile (e.g. Chernozems). Secondly, SOC/clay does not account for climate or land cover differences, which are both highly important for governing topsoil organic carbon concentrations. These two points, taken together, make the SOC/clay ratio very challenging to use properly at a pan-European scale and thus render it a poor indicator of soil health for the proposed Soil Monitoring Law for adoption across the EU. For such reasons, Poeplau and Don (Reference Poeplau and Don2023), Chahal et al. (Reference Chahal, Amsili, Saurette, Bower, Gillespie, van Es and Van Eerd2024) and Feeney et al. (Reference Feeney, Bentley, De Rosa, Panagos, Emmett, Thomas and Robinson2024) proposed additional indicators. Feeney et al. (Reference Feeney, Bentley, De Rosa, Panagos, Emmett, Thomas and Robinson2024) also reported that the O/T SOC ratio was less sensitive to clay content, land cover and climate, as well as less geographically skewed. Similar to their procedure, a ‘SOC reference level’ for 0.5 m depth was averaged for each pedo-climatic region (natural vegetation floor) in the current study. Unlike Chahal et al. (Reference Chahal, Amsili, Saurette, Bower, Gillespie, van Es and Van Eerd2024) who considered linear regression between SOC and clay content for the pasture systems to calculate their reference SOC expected values, both forest soils and grassland soils were used in the present study to estimate M SOC as average values. The present procedure might be considered a novelty, not only because of a different soil depth for mean values calculation, but also because of the way the O/M SOC ratio was calculated, establishing LBLs relative to Iar, which includes climate, vegetation and soil types.
The SOC/clay ratio was combined with the current O/M SOC ratio in this study, using the thresholds of each indicator, that is, the values of 1:8 (0.125), 1:10 (0.100) and 1:13 (0.077) for SOC/clay ratios as boundaries between four soil health categories: very good, good, moderate and degraded, respectively, as Johannes et al. (Reference Johannes, Matter, Schulin, Weisskopf, Baveye and Boivin2017) and Prout et al. (Reference Prout, Shepherd, McGrath, Kirk and Haefele2021) reported, and the quartiles as used by Feeney et al. (Reference Feeney, Bentley, De Rosa, Panagos, Emmett, Thomas and Robinson2024), described above. Similar to Feeney et al. (Reference Feeney, Bentley, De Rosa, Panagos, Emmett, Thomas and Robinson2024), the present study suggests that using SOC/clay and O/M SOC ratio in the pedo-climatic regions and sub-regions, the soil texture, which is a hard-to-change property, is not the only essential driver for soil health assessment. There is neither any risk to characterize the croplands as disproportionately degraded and forests as possessing always a very good soil health, because both forestland and grassland combined and cropland soils are related to the same soil health within a pedo-climatic region, that is, the health of forestland and grassland where SOC sequestration was the most stable. A similar assessment could be made for coarse-textured soils, which should not be considered as overwhelmingly healthy, just based on the reduced soil clay content values. As for the clayey-textured soils, the regression model establishing a baseline was not significant, although it was not too far from the significance threshold, and this was because an important part of the soil clay was of Pleistocene origin, which was found especially in low-elevation areas and former lakes that became dry land now. For such regions where SOC means are generally low and soil textures are more clayey, O/M SOC ratios have limited value, and SOC/clay ratios are still generally considered to characterize the soil health.
A notable difference between the present study and those of Prout et al. (Reference Prout, Shepherd, McGrath, Kirk and Haefele2021) and Feeney et al. (Reference Feeney, Bentley, De Rosa, Panagos, Emmett, Thomas and Robinson2024) is that the reference level of SOC content here was considered SOC content from the forestland and grassland combined. In this way, the SOC sequestration potential (not only the SOC/clay ratio) for a pedo-climatic region is taken into account for all land uses. This procedure allows comparisons within the pedo-climatic regions and sub-regions generated by textures. For example, Chernisols (mostly Chernozems and Phaeozems) occurring especially in dry plains of steppes and forest-steppes, and without a capillary rise effect from groundwater, cannot sequester similar amounts of organic C as the soils from wetter climates or mountainous regions but can be compared with each other. Similarly, Protisols, Hydrisols and other soil classes.
To characterize the soil health of any region in Romania or the neighbouring countries such as Hungary, Bulgaria, southern Ukraine, Serbia and the Republic of Moldova, the SOC reference levels might be considered, or the relationship between Iar and the SOC content mean limits (Fig. 2).
Limitations of this procedure refer to the database size, because some pedo-climatic regions were not equally represented, for example, LM-CR-LO, LM-CR-CL, LH-CR-CO and PL-CR-CO that had a relatively low number of analysed soil profiles and where the mean SOC reference level might be better represented with more data points and possibly obtaining more SOC support points, where they were missing in this approach. Nevertheless, this disadvantage can be removed in the future by enlarging the database. Another improvement might be to diversify the analysis by including soil types and sub-types in addition to the more comprehensive soil classes already assessed, when reliable SOC support points and regression lines can be obtained.
SOC/clay alone is not sufficient to assess the soil health under a wide range of conditions, and Rabot et al. (Reference Rabot, Saby, Martin, Barré, Chenu, Cousin, Arrouays, Angers and Bispo2024) criticized this indicator, finding that the acidic soils were characterized as healthy after the threshold of 1/13, while the alkaline soils were characterized as unhealthy. As Feeney et al. (Reference Feeney, Bentley, De Rosa, Panagos, Emmett, Thomas and Robinson2024) and Sauzet et al. (Reference Sauzet, Johannes, Deluz, Dupla, Matter, Baveye and Boivin2024) also reported, the applicability of the SOC/clay ratio is entirely based on the regional conditions and does not have a worldwide application. Mäkipää et al. (Reference Mäkipää, Menichetti, Martínez-García, Törmänen and Lehtone2024) also stressed that SOC/clay alone is not adequate to characterize soil C loss, while Chahal et al. (Reference Chahal, Amsili, Saurette, Bower, Gillespie, van Es and Van Eerd2024) concluded that SOC/clay was not a reliable indicator of soil conditions, and SOC/SOCexp might be more useful to estimate soil health and derive baseline soil carbon levels at a regional scale. In addition to SOC content, SOC/clay and O/M SOC ratios, as well as BD, other soil features may be considered to characterize soil health. Such situations refer to some pollutants like higher pesticide application and over-fertilization, as well as higher soil contents of Pb and other heavy metals. Leaching of such substances towards deeper soil horizons and groundwater or surface water was previously reported in the country by Lăcătușu et al. (Reference Lăcătușu, Paltineanu, Vrinceanu and Lăcătușu2019), Domnariu et al. (Reference Domnariu, Paltineanu, Marica, Lăcătușu, Rizea, Lazăr, Popa, Vrinceanu and Bălăceanu2020) and Paltineanu et al. (Reference Paltineanu, Domnariu, Marica, Lăcătușu, Popa, Grafu and Neagoe2021, Reference Paltineanu, Dumitru and Lacatusu2022). SOC content, SOC/clay and O/M SOC ratios combined are indicators that can better characterize the soil health, and the European Commission (2023a, 2023b) should take them into account to characterize the soil health in the EU states.
To improve the soil health of compacted cropland soils some practical measures should be considered to increase SOC/clay ratio and reduce BD and increase soil porosity, such as conservation tillage, incorporation of crop remains in deeper soil horizons using deeper-rooted crops, crop rotation including grass leys (Peres et al., Reference Peres, Hoeffner, Cluzeau, Decau, Gastal, Legras, Louault and Vertes2022), green manure application measures, etc. These measures might contribute to better carbon sequestration and global change mitigation, macronutrient availability, creation of better conditions for the activity of fauna and microorganisms and finally having a positive impact on soil health. With respect to grassland soils, reasonable grazing is recommended in order to prevent worsening of soil physical, chemical and biological properties and implicitly decreasing runoff and leaching (Bogunovic et al., Reference Bogunovic, Kljak, Dugan, Grbesa, Telak, Duvnjak, Kisic, Solomun and Pereira2022; Centeri, Reference Centeri2022). Another approach to improve soil health would be to use agroecology and permaculture (Reiff et al., Reference Reiff, Jungkunst, Mauser, Kampel, Regending, Rösch, Zaller and Entling2024); the last scientists recommended permaculture to offer a more adequate framework for an agroecological system that could restore biodiversity in cropland and mitigate climate change.
SOC and clay contents are essential soil properties for agriculture, the environment and climate alike. SOC/clay is already used to characterize soil health; however, it is not sufficient, and other environmental indicators need to be used to better clarify soil health, for instance, such as observed/mean SOC content, as well as an Iar to link with other soil properties, with climate and land use. Paltineanu et al. (Reference Paltineanu, Mocanu, Vizitiu, Domnariu and Dumitru2025b) have recently found relationships between SOC/clay and BD for various depths, including 0.5 m depth. The combined SOC/clay and O/M SOC ratio approach can be useful for various end-users such as policymakers, governmental and local planners, farmers, scientists and others.
Conclusions
The main idea of this study is that SOC sequestration in mineral soils depends on many factors that are specific for each pedo-climatic region and soil texture and so is the soil characterization as healthy or not healthy.
SOC/clay ratios alone cannot be used everywhere to characterize soil health, specifically for extremely textured soils. SOC/clay ratios and O/M SOC ratios combined were used to characterize the soil health of the studied soil classes under various ecological conditions across Romanian territory. The simultaneous application of these two indicators revealed specific SOC content values as reference levels for a good soil health, which decrease from the wetter climates towards the drier ones.
Altitudinal areas showing relatively homogeneous climate, vegetation and soils were grouped to represent pedo-climate regions and sub-regions using soil texture; they manifest specific SOC sequestration properties. SOC content considerably differed among these regions, and soil health should be compared within the same pedo-climatic regions that have specific SOC sequestration conditions.
Correlations were found between support points SOC values and the Iar that synthesizes the main climate variables, allowing to separate between ‘healthy’ soil condition and ‘non-healthy’ condition for any climate, vegetation floor and land use. Land uses can also be compared within each other.
Author contributions
All authors contributed to the design, data analysis and processing; the manuscript drafts were written by the corresponding author, and all authors commented, improved and approved the manuscript.
Funding statement
This work was financed by the Ministry of Agriculture and Rural Development through the ADER 2026 Sectoral Plan – Project ADER 19.1.1 (development of agricultural technologies for the main crop plants in order to intensify the carbon sequestration in soil according to the 4‰ initiative) – and by the Ministry of Research, Innovation and Digitalization through Project PN 23 29 06 01 (innovative tools for identifying the risks and challenges related to impact of climate change on the ecosystem services) and Project PN 23 29 05 01 (development of indicators on the role of biodiversity and functionality of soil microbiota in providing ecosystem services, improving soil health and increasing resilience to climate). Funders had no role in the design, analysis or writing of this article.
Competing interests
None.
Ethical standards
Not applicable.


 Open access

