
For over half a century, academic historians, theologians and sociologists have debated the nature, scale and periodisation of religious change in modern Britain.Footnote 1 They have drawn upon a range of competing quantitative and qualitative sources and applied alternative hypotheses as frameworks for evaluating their evidence. An especially contested concept has been secularisation, which came to the fore during the 1960s, when it was popularised by sociologist Bryan Wilson, initially as a descriptive shorthand for ‘the process whereby religious thinking, practice, and institutions lose social significance’.Footnote 2 Secularisation was subsequently, first by Wilson and then by Steve Bruce, refined in a paradigmatic sense, and presented as an inevitable (yet unintended) consequence of modernity. Such a master narrative commanded widespread scholarly acceptance until the 1980s but has been increasingly rejected or significantly modified since.
At the heart of these academic disagreements have lain difficulties in isolating longitudinal metrics of religious change in Britain. Although there is a comparatively large number of key performance indicators available for recent decades,Footnote 3 they become scarcer as researchers work backwards from 1970. Over longer time spans, historians and sociologists have typically relied upon two quantitative measures: church membership and church attendance. Since its publication in 1977, the major source for membership trends has been the ambiguously titled Churches and churchgoers. Footnote 4 However, church membership is problematical in terms of comparability because there is no common criterion of what constitutes ‘membership’. By contrast, churchgoing is a more compelling measure because all major Churches and faiths have expected their followers to participate in collective public worship, and thus it has become a common denominator of religiosity. More specifically, applied to Christianity, Hugh McLeod has argued that Sunday church attendance should be regarded as ‘the main index of church attachment’ for ‘all churches made Sunday worship the chief focus of their activity’.Footnote 5
In England, churchgoing was, theoretically, compulsory for all citizens after the Reformation, according to statutes designed to underpin the new Protestant state and established Church. In practice, enforcement was always selective and virtually non-existent after 1689 when toleration was extended to Nonconformists.Footnote 6 In consequence, records of prosecutions for non-attendance at church before ecclesiastical or civil courts offer no real guide to the participation of ordinary people in public worship. For the eighteenth and early nineteenth centuries, a variety of fragmentary local evidence exists, including some Church of England episcopal visitation returns,Footnote 7 while for the mid-nineteenth century there is the 1851 religious census, part of the official decennial census of population.Footnote 8 Politico-sectarian rivalries prevented the experiment from being repeated, and, when (in 2001) a religion question was again inserted in the population census, it related to religious profession and not attendance.Footnote 9 Notwithstanding, some local censuses of churchgoing were undertaken, with large clusters during the late Victorian and Edwardian eras,Footnote 10 many of them investigated by Robin Gill.Footnote 11 In the late twentieth and early twenty-first centuries, between 1979 and 2005, Peter Brierley organised four ecumenical England-wide enumerations of church attendance.Footnote 12
The foregoing brief historiographical background provides essential context for this local and longitudinal study of churchgoing in London, which forms part of a series of case studies of religious attendance in English and Scottish cities and towns between the early nineteenth century and the present.Footnote 13 As the historically dominant urban community in Britain, by far the largest city and the capital of England, and seat of the UK parliament and government and home to many national institutions, London’s selection needs little justification. The population of the area that became Greater London rose strongly between the first official census in 1801 and 1939, when it peaked at 8,615,000, before declining until the late 1980s and recovering thereafter, standing at 9,300,000 in 2025. Its growth has been driven by a constantly changing mixed economy of trade, manufacture, service industries and educational and cultural provision which has been an employment magnet for large-scale internal and overseas migration, adding considerably to the city’s racial and religious diversity.
Much has been written about London’s religious history,Footnote 14 although the most recent attempt to summarise it leaves something to be desired.Footnote 15 The nineteenth century has attracted particular attention from church historians, as it did from contemporary ecclesiastics and social investigators perturbed by the perceived deficit of religious belief and practice among the city’s working-class residents.Footnote 16 The Victorian era witnessed concerted campaigns of evangelism, church-building and outreach, recapitulated by William Jacob in his monograph on ‘religious vitality’, which also briefly considered church attendance.Footnote 17 With some exceptions in suburban areas,Footnote 18 these denominational and collaborative efforts receded during the early twentieth century, exposing London as a region of overall low religiosity. Only as the new millennium approached were there apparent signs of religious resurgence, reflected in John Wolffe’s research, which highlighted a movement of religious pluralisation, including spectacular growth of Pentecostal and ethnic minority churches.Footnote 19 In parallel, public opinion polls of Londoners suggested the city’s longstanding reputation for irreligion may have been (momentarily) exaggerated.Footnote 20
Privileging quantitative sources, this study assembles evidence about the extent of churchgoing in London over two hundred years, typically measured by an index of attendance (IA), expressing attendances as a percentage of the city’s population within its administrative boundaries as constituted at any given time. The focus is on censuses of churchgoing, national in 1851 and 1979–2005, metropolitan in 1886–7, 1902–3, 1933–4 and 2012, together with some other statistical enquiries. The arrangement is chronological. Because of the vastness of London, and the number of places of worship, findings are mostly summarised at city-wide level, and variations between individual districts/boroughs cannot be explored; however, churchgoing and religious practices have been investigated by other scholars in a handful of boroughs.Footnote 21 For identical reasons, the fortunes of individual denominations cannot be commented upon in depth, although their raw data are captured in the tables.
Pre-1851 estimates and censuses
It was during the second quarter of the nineteenth century that initial attempts were made to quantify the scale of non-churchgoing in London. Several calculations were made, deceptively precise yet varying widely. In 1827, the Congregational minister John Blackburn estimated there were 400 places of worship in the city each attended by 500 regular and 250 fluctuating hearers, representing 300,000 attenders from a population of 1,274,800, equivalent to an IA of 23.53.Footnote 22 Five years later, a writer in the Congregational Magazine subdivided London’s population into 458,411 young children and elderly persons who could not attend church, at least 700,000 adults who did not do so, and 230,000 who did, an IA of 16.72.Footnote 23 Baptist Noel, an Evangelical Anglican minister, was more sanguine in 1835, proposing 566,145 orthodox (Anglican/Nonconformist) regular worshippers, 300,746 orthodox occasional worshippers, 74,400 unorthodox (Roman Catholic/others) worshippers, amounting to an IA of 64.47, leaving 518,850 non-worshippers.Footnote 24 However, James Grant, author and journalist, inclined to pessimism, reckoning in 1839 that only 344,000 Londoners attended places of worship (150,000 Anglicans, 158,000 Nonconformists, 26,000 Roman Catholics and 10,000 Jews), an IA of 17.25, the residual 1,650,000 going nowhere.Footnote 25 Four years later, the London City Mission (LCM) suggested 350,000 Londoners frequented church services at any one time, an IA of 16.67,Footnote 26 subsequently raised to 400,000 (19.02).Footnote 27 However, in 1847 the LCM revised its estimates, ‘to allow for the attendance of different individuals at separate services’: 1,400,000 neglectors of public worship, 60,000 communicants, 800,000 attenders, an IA of 38.05.Footnote 28
Obviously, limited reliance can be placed on such uncertain estimates. More exact statistics might have been expected from censuses of church attendance, but the only agency known to have undertaken any in the capital before the mid-nineteenth century was the LCM. By definition, its sphere of operations concentrated on areas of poverty and destitution, and thus the relatively few censuses it undertook during these years, while of illustrative value, may not have been representative. In the united parishes of St Margaret and St John, Westminster, in 1840, average attendance at the fifteen places of worship was 6,160 from a population of 54,000, an IA of 11.41.Footnote 29 LCM’s survey of morning and evening services in thirty-six churches of Spitalfields district in 1843 enumerated 18,688 adults and children, an IA of 16.20.Footnote 30 In Greenwich in 1846, morning, afternoon and evening congregations (adults and children) amounted to 13,960, an IA of 43.20,Footnote 31 while in Hammersmith in 1848 they numbered 4,232, an IA of 25.70.Footnote 32 The IA for Chiswick in 1848 was 32.09 (1,975 attendances from a population of 6,155),Footnote 33 and in Cripplegate Without in 1849 it was 34.94 (4,940 from 14,140).Footnote 34
The 1851 religious census
The 1851 religious census, coordinated by Horace Mann, was one of two special enquiries (the other on education) launched that year alongside the decennial census of population in Britain. In England and Wales, 30,610 enumerators were tasked with identifying all places of worship in their districts and delivering, to the minister or other responsible official of each, the appropriate form for recording details of religious accommodation and attendance at morning, afternoon and evening services on 30 March (both in general congregations and at Sunday schools). In view of the bitter controversy surrounding the principle of covering religion in the census, law officers of the Crown advised the religious schedules need not be completed under penalty, resulting in some non-compliance by local clergy, especially Anglicans, including many examples in London. The frequency of rounding of attendances also suggests an actual count of congregations was not always made.
Results of the religious census in England and Wales were analysed and tabulated in considerable detail in a parliamentary paper in December 1853.Footnote 35 In London’s case, the volume included tables for the metropolitan area (Inner London) and its thirty-six constituent registration districts. A collapsed version of the published summary for general congregations and Sunday scholars is reproduced as Table 1 (see Appendix). Denominational shares of attendances on the day were: Church of England, 56.64 per cent; other Protestants, 36.64 per cent; and Roman Catholics, 6.38 per cent. The overall IA across three services was 37.01, which was much lower than the average of 60.8 for England and Wales and of 50.8 for all large town districts, seemingly confirming London’s reputation for religious destitution.Footnote 36
In reality, the picture was bleaker than Table 1 suggested. For London’s IA of 37.01 did not imply this was the proportion of the capital’s population who worshipped on census Sunday, as the IA was based on attendances rather than individual attenders. It took no account of the fact that it was common for people to frequent more than one service on Sunday (a practice known as twicing), effectively resulting in them being double counted. The scale of twicing is unknown in the mid-nineteenth century. Although Mann proposed a formula for correcting for twicing,Footnote 37 it was rightly criticised for failing to make sufficient allowance for regional and denominational variations in the number and timing of services, not least the popularity of evening worship among Nonconformists. At one level, all that can be said with certainty from Table 1 is that the number of individual attenders will have been somewhere between 504,914, being the sum of attendances at the single best attended service in each denominational grouping (equivalent to a single-service IA of 21.37),Footnote 38 and 874,339 (the tri-service total).
Among modern day historians, Michael Watts was especially critical of Mann’s formula, dismissing it as ‘arbitrary in conception and unfair to Nonconformists in operation’.Footnote 39 Arguably, the alternative formula Watts proposed, although less biased against Nonconformity, also lacked strong evidential basis. For each registration district in England and Wales, Watts used totals for the best attended services for each denomination and added a third of attendances at all other services.Footnote 40 In London, this method of correcting for twicing reduced the IA to 27.0, ranging from 15.3 in Shoreditch to 48.9 in Hampstead. The Church of England accounted for the majority (15.6) of this revised IA, with other religious bodies contributing 11.4.Footnote 41
There is a further complication, affecting comparability of the 1851 religious census with later Victorian and Edwardian enumerations of church attendance, the overwhelming majority of which were confined to what Mann described as the ‘general congregation’, i.e. omitting Sunday schools. The aspiration in 1851 had been to record general congregations and Sunday scholars separately, but, as many informants returned a combined total for both, Mann was forced to do likewise, only disregarding Sunday scholars for any place of worship when they did not assemble at the same time as a general congregation.Footnote 42 With the release of the original schedules of the religious census by The National Archives after an embargo of 100 years, it became possible to analyse results for general congregations alone.Footnote 43 Based on such general congregations (see Table 2), the IA for London in 1851 was 32.72, unadjusted for twicing, ranging (see Table 3) from 15.41 in Shoreditch to 83.17 in the City of London (which drew many of its worshippers from beyond its boundaries). The number of individual attenders in general congregations in London in 1851 will have been somewhere between 410,766, the sum of attendances at the single best frequented service in each denominational grouping, and 773,003, the total of all services, perhaps just under 600,000 persons, equivalent to an IA of about 25. Shares of attendances for general congregations were: Church of England, 54.52 per cent; other Protestants, 35.38 per cent; and Roman Catholics, 9.75 per cent.
The original schedules provided space for informants to add remarks, but only a relatively small minority elected to do so in London. Regarding attendance, the commonest gloss was to the wet and stormy weather that affected most parts of the metropolis on 30 March, keeping some potential worshippers at home. Another general deterrent was the prevailing influenza outbreak. Other respondents, particularly Nonconformists, blamed lower than average turnout on competition from neighbouring places of worship. A few ministers referred to unfavourable social conditions, such as Sunday trading in Bethnal Green.Footnote 44
Revelations about ostensibly low levels of churchgoing in London were deeply shocking to many contemporaries. They were vigorously debated in both religious and secular print media. They also led to one parliamentary follow-up, a select committee of the House of Lords in 1858 into the ‘Deficiency of means of spiritual instruction and places of divine worship in the metropolis, and in other populous districts of England and Wales’. The committee took the majority of its oral evidence from incumbents and officials connected with London parishes, presenting general and statistical overviews, sometimes citing usual congregations. However, there was no systematic aggregated analysis of attendance data, and only occasional information about Nonconformists and Catholics.Footnote 45
Among religious agencies, the main focus of activity after publication of the 1851 religious census was to multiply the number of places of worship and sittings therein in an attempt to keep pace with London’s rapidly growing population. Tables 4 and 5 reveal the extent of their success. Table 4 shows the average number of people per place of worship remained high throughout the second half of the nineteenth century; although the ratio certainly dropped from the 1880s, this was mainly due to proliferation of small and relatively humble local missions, particularly Anglican or interdenominational, rather than the more famous central missions operated by Wesleyans and other Nonconformists. Statistics of sittings are only available for all denominations until the 1880s (see Table 5), indicating rather modest gains towards raising accommodation in places of worship to around a third of the population. It seems unlikely this ratio was ever improved upon thereafter.
The 1886–7 religious census
Thirty-five years elapsed after 1851 before the next attempt to enumerate churchgoing in London. The only tiny exception was a census by the St James’ Gazette of morning worship in the City of London one Sunday in May 1881.Footnote 46 When a nationwide movement to undertake religious censuses by local newspapers sprang up in autumn/winter 1881–2, the London press were bystanders; the scale, complexity and cost of organising such a venture in London were doubtless deemed too challenging.Footnote 47 So it was left to the religious journalist William Robertson Nicoll to rise to the task when he launched a religious census of London as a means of promoting the British Weekly, his new weekly Nonconformist newspaper, in 1886.Footnote 48 Nicoll was highly critical of the methodology employed by the 1851 religious census, which he judged ‘comparatively worthless and very misleading … it rested on estimates, often mere guesses, made by officials of particular churches. These, as a rule, are far in excess of the facts’.Footnote 49 He was determined to adopt a more scientific approach.
For the main part of his own religious census of London, attendance at the principal morning and evening services of churches and chapels on Sunday, 24 October 1886, Nicoll relied upon a network of independent enumerators directed by Major Colquhoun of Lyons, who had previously superintended a similar project in Glasgow in 1882 and was to do so again in 1896.Footnote 50 Results for this part of the census were serialised in the British Weekly between 5 November and 17 December 1886, not without some criticisms, although there were also endorsements from prominent figures such as William Gladstone and William Booth. However, for the second part of the census, the survey of missions on the morning, afternoon and evening of Sunday, 27 November 1887, Nicoll abandoned the principle of independent enumeration and permitted the parties in charge of the missions to self-report. Mission data were initially serialised in the British Weekly between 13 January and 20 February 1888. Results from both parts of the census were consolidated into a single volume in 1888, prepared by George Stevenson, a leading Wesleyan layman, and incorporating corrections of the serialised findings.Footnote 51
Summary data from the 1886–7 religious census of Inner London are presented in Table 6. The overall IA, unadjusted for twicing, was 29.25, which was 3.47 points less than the equivalent figure for general congregations in 1851 (see Table 2).Footnote 52 Shares of attendances in 1886–7 were: Church of England (including public institutions), 49.10 per cent; other Protestants, 45.95 per cent; and Roman Catholics, 4.57 per cent. Other Protestants were obviously fast closing on the Church of England, which no longer commanded an absolute majority of metropolitan churchgoers. The reduction in the Catholic share from 9.75 per cent in 1851 to 4.57 per cent in 1886–7 is more apparent than real, reflecting the fact that, whereas in 1851 Catholics returned congregations at all morning masses, in 1886–7 only the 11 a.m. high mass was counted. A comparison of the overall IA of 29.25 with other British cities with populations of 100,000 and above around the same time shows the rate of church attendance in London was: higher than in Liverpool (26.3 in 1881, 26.7 in 1891); strikingly close to Birmingham (29.4 in 1892) and Glasgow (30.1 in 1896); but lower than in Sheffield (31.4 in 1881), Bradford (32.2 in 1881), Bolton (32.5 in 1881), Nottingham (36.0 in 1881), Hull (40.9 in 1881), Portsmouth (41.9 in 1881), Leicester (44.1 in 1881), Edinburgh (44.6 in 1882) and Bristol (56.2 in 1881).Footnote 53
Nicoll continued to proclaim the value of the 1886–7 religious census for some years afterwards, which ultimately led him to cross swords with Charles Booth, the pioneering social scientist and author of Life and labour of the people in London, the fieldwork for the Religious Influences series of which was undertaken in 1897–1900, with the findings published in seven volumes in 1902–3.Footnote 54 Booth’s methodology for the series was qualitative; after five years of researching the capital’s religious life, he concluded: ‘Spiritual influences do not lend themselves readily to statistical treatment … The subject is one in which figures may easily be pressed too far, and if trusted too much are likely to be more than usually dangerous.’Footnote 55 This approach displeased Nicoll; writing in the British Weekly in 1903, he expressed regret that Booth had not attempted to provide any quantitative record of church attendance nor even to mention the 1886–7 religious census. Nicoll added: ‘while church-going is not a test of religion, without it religion perishes’.Footnote 56
The 1902–3 religious census
The religious censuses of Inner London in 1902–3 and Outer London in 1903 were undertaken by the Daily News, a national newspaper originally founded by Charles Dickens but owned since 1901 by George Cadbury, Quaker chocolate manufacturer and philanthropist, who moved the title in a politically Liberal and Nonconformist direction. Cadbury had been the inspiration and the money behind the 1892 Birmingham religious census,Footnote 57 and he was equally the driving force behind the London religious census of 1902–3, although operational command lay with Richard Mudie-Smith, estate agent turned journalist, who was on the staff of the Daily News in 1902–6 and 1910–12. Mudie-Smith also edited the definitive volume of census results in 1904.Footnote 58
The Daily News census has tended to be regarded by historians as a ‘gold standard’ in enumerations of churchgoing. Hugh McLeod described it as ‘probably the fullest and the most accurate census of church attendance ever taken in Britain’.Footnote 59 While it was undoubtedly more sophisticated than any religious censuses that had gone before, and it was emulated by many provincial newspapers in the early Edwardian era,Footnote 60 it was not beyond criticism. Most notably, there are doubts about its completeness of coverage of places of worship, partly arising from Mudie-Smith’s inheritance of Charles Booth’s listings.Footnote 61 Perhaps the worst oversight in this respect, and somewhat ironic given Cadbury’s own religious allegiance, is that the 1902–3 census omitted forty of the seventy metropolitan Quaker meetings.Footnote 62
In both Inner London and Outer London, the census was conducted independently of clergy and officials of each place of worship, a team of 400 men being engaged as paid inspectors, supervisors and enumerators.Footnote 63 To spread the workload, the census was staggered, the twenty-nine boroughs of Inner London being surveyed between 30 November 1902 and 21 June 1903, and fifty-two districts of Outer London (including two county boroughs and four metropolitan boroughs) between 19 July and 8 November 1903. The counts were restricted to the principal morning and evening services at churches, chapels and missions (but omitting public institutions), congregants being divided into men, women and children (judged to be below fifteen years). The major exception was that, in the Roman Catholic Church, every Sunday morning mass from 6 a.m. to 12 noon inclusive was enumerated, thereby correcting a shortcoming of the 1886–7 census. Synagogue attendance was taken on the first day of Passover week 1903. Children’s services distinct from Sunday schools and held at the hour of the main Sunday morning or evening services were recorded but Sunday schools were excluded, precipitating a disagreement between Mudie-Smith and Charles Masterman, one of his leading contributors.Footnote 64 Only in Chelsea was a full count made of attendance at all religious activities on Sunday (including Sunday schools); otherwise, meetings and services other than the principal acts of worship on Sunday morning or evening were just noted on a sample basis.
Topline results for Inner London are displayed in Table 7 and Outer London in Table 8. The IA for Inner London, unadjusted for twicing, was 22.13, almost a quarter less than the figure of 29.25 in 1886–7 (see Table 6). The Church of England had sustained the biggest net losses, absolutely and relatively, since 1886–7, with 23.65 per cent fewer attendances and its denominational share reduced from 49.10 per cent to 42.84 per cent. In terms of share, the Anglicans had now been overtaken by other Protestants who stood at 45.18 per cent, albeit several constituent groups (Congregationalists, Baptists, Wesleyans) were already in absolute decline, and the Salvation Army’s impact was limited. The Roman Catholic Church accounted for 9.33 per cent of attendances, its share boosted by continued immigration but also inclusion in 1902–3 of all Sunday morning masses. Also of note was the six-fold increase in synagogue attendance since 1886–7 (to 2.65 per cent of the total), reflecting rapid growth of the Jewish population through immigration since the 1880s. The Inner London IA of 22.13 can only meaningfully be compared with three other English cities at this time, Hull (1903–4), Liverpool (1902) and Portsmouth (1902). In Hull, the religious census was abandoned two-thirds of the way through, and the IA of 20.5 is this author’s estimate of what the completed figure might have been, which may or may not be accurate. In Liverpool, the IA was 25.3, surpassing Inner London’s on this occasion, unlike 1886–7. The Portsmouth IA was 27.0.Footnote 65
At 26.61, the Outer London IA (see Table 8) was one fifth above Inner London’s. Denominational shares of total attendances were: Church of England, 45.86 per cent; other Protestants, 48.05 per cent; and Roman Catholics, 6.09 per cent. The flight of the upper working class and lower middle class from downtown areas of Inner London to the suburbs of Outer London had given other Protestants the edge over the Church of England, while Inner London remained the stronghold of the Roman Catholic poor and working class. Overall, however, Outer London’s results must have seemed disappointing in comparison with some other south-eastern communities where churchgoing was enumerated in the early Edwardian years.
So far, we have considered only IAs unadjusted for twicing in 1902–3. We now need to factor in findings from a pilot study to quantify twicing undertaken as part of the Daily News census. Mudie-Smith’s description of methodology was brief and his application of results rather muddled.Footnote 66 The ‘sample’ of sixty-nine places of worship seems unlikely to have been representative of the universe of 4,026 churches, chapels and missions in Inner London and Outer London, and it certainly constituted a tiny fraction thereof. The selection was confined to Protestant churches, reflecting Mudie-Smith’s understanding that the number of Catholic twicers was negligible,Footnote 67 with which later historians such as Gill have concurred.Footnote 68 The pilot revealed twicing was marginally more common in Inner London than Outer London, and significantly more common among other Protestants than Anglicans. Based on these data, grossed up for the full census returns, an approximate adjustment for twicing is presented in Table 9, suggesting the number of unique attenders in 1902–3 on an average Sunday was 875,971 in Inner London (equivalent to an IA of 19.32) and 450,484 in Outer London (23.27).
Another important feature of the 1902–3 census was the categorisation of worshippers by age and gender. In this respect, the Daily News was not breaking new ground, for the same disaggregation had already been implemented in the large number of religious censuses taken in Scotland in 1901 by the Aberdeen Journal and two Dundee newspapers.Footnote 69 The London breakdown is given in compressed form in Table 10. A third (32.15 per cent) of worshippers were children, the proportion being much the same among Anglicans and other Protestants, with Catholics and Jews somewhat lower. Of the remaining two thirds who were adults, just 38.85 per cent were men and 61.15 per cent were women (slightly less in Inner London and slightly more in Outer London). The proportion of females among adults was 65.62 per cent in the Church of England, 58.15 per cent for other Protestants, 63.27 per cent for Roman Catholics, but just 22.40 per cent for Jews. Using data for twenty-eight boroughs in Inner London in 1902–3 (omitting the City of London), Callum Brown has asserted the primacy of gender as a determinant of churchgoing in particular locations. Especially interesting is his discussion of how the duties of preparing Sunday lunch and baby-minding, by domestic servants in affluent households or wife-mothers in servant-less working-class households, shaped the relative sizes of morning and evening congregations in Protestant churches.Footnote 70 In stressing gender, Brown has downplayed the contribution of social class to churchgoing which has been key to McLeod’s analysis of this and other religious censuses.Footnote 71
A methodological by-product of staggering the 1902–3 census over such a long period, and in different meteorological conditions, was that it facilitates examination of the weather’s effect on churchgoing. Many contemporaries readily assumed that, the worse the weather, the lower the numbers in the pews, particularly in areas where roads were bad and distance from home to church was long. Such an assumption has recently been questioned by Gill who argued the impact was less than expected, and more on Nonconformists than Anglicans.Footnote 72 Mudie-Smith’s opinion was that ‘adverse weather conditions do not affect church attendance to the extent generally imagined’.Footnote 73 He failed to reach definite conclusions about the weather’s influence in Inner London, while observing that, in Outer London, the districts with the highest and lowest attendance ratios (Barnet and Tottenham) were enumerated on the same day and under identical weather conditions.Footnote 74 At the same time, when four places of worship (one St Paul’s Cathedral) were counted on both fine/fair and wet days, congregations on the latter were reduced by 35.4 per cent.Footnote 75 Reviewing the 1902–3 Inner London census, Brown found very weak correlations between churchgoing and the weather and season.Footnote 76 The present author’s analysis of Inner London data showed the collective IA in thirteen boroughs enumerated in fine weather was actually lower (21.86) than in twelve boroughs where the count was taken under showery, wet or very wet conditions (22.29).Footnote 77 However, the reverse was true in Outer London, in many parts of which population was more dispersed; here, the IA in thirty districts counted in fine weather was 30.93, whereas in fifteen districts where the census day was wet it was 28.73.Footnote 78 Seemingly in confirmation, in Croydon the state of the weather is one credible explanation for the substantially lower IA in a census taken by the Croydon Religious Discussion Society on an exceedingly wet Sunday in November 1902 than in the Daily News count on a fine day in October 1903 (22.0 versus 37.8).Footnote 79
The 1913 religious census (abandoned)
In 1912, the Daily News merged with the Morning Leader and was renamed the Daily News and Leader. On 22 October, the newspaper announced its intention to replicate the 1902–3 religious census.Footnote 80 Managerial oversight was entrusted to Henry Wilson Harris, who had joined the Daily News as news editor in 1908.Footnote 81 On this occasion, the enterprise was to be confined to Inner London, undertaken with fewer paid and more voluntary staff, and conducted over a shorter timeframe, commencing in Paddington on 19 January 1913. Soon afterwards, on 30 January, the Daily News and Leader decided to abandon the census, in the face of growing hostility towards it in Anglican and, especially, Nonconformist circles. Opposition culminated in an unprecedented joint letter to the editor, urging cancellation of the project, from Arthur Foley Winnington-Ingram (bishop of London) and Frederick Brotherton Meyer (secretary of the National Council of the Evangelical Free Churches). Although initial ecclesiastical reaction to the census had been mostly positive or neutral, it turned sharply against after 13 December 1912, when the Liverpool Daily Post and Mercury published results of its latest census of churchgoing in that Merseyside city, revealing a substantial decline in attendance since 1902. To many observers, this seemed ominous; as John Clifford, prominent Baptist minister, told his congregation: ‘The Liverpool census is most discouraging, and everybody is apprehensive of a similar or worse state of facts being discovered by the statistics to be given us about London.’Footnote 82 The Daily News and Leader capitulated and cancelled its 1913 census, substituting a qualitative survey of the religious and social work of the metropolitan churches, based on responses to a lengthy questionnaire from just over one third of places of worship, which was published in January 1914.Footnote 83
The 1915–16 and 1927 surveys by Arthur Black
Arthur Black was a leading Baptist and Free Church layman, who became involved with religious statistics in Liverpool, where he was a dentist and Sunday school worker until 1914. He then relocated to London, becoming assistant secretary (1914–19) and secretary (1919–38) of the Shaftesbury Society and Ragged School Union. During 1915 and the first half of 1916, he enumerated Sunday morning or evening services at 200 churches, chapels or missions in London, mostly north of the River Thames, and nearly all in poorer areas. Comparing his data with the Daily News census of 1902–3, Black discovered there had been a substantial decline in churchgoing, by 50 per cent in poor districts, with generally no more than a quarter of sittings occupied even at the better attended evening services, including in flagship central halls. Enlistment in the armed forces was not the sole or primary explanation for the decrease. ‘It is not merely a question of the rapid disappearance of men of military age, but also of all other classes, including children.’Footnote 84 Black’s research was corroborated by a census taken in all metropolitan Primitive Methodist chapels towards the war’s close, Sunday morning and evening congregations in Inner London more than halving between 1902–3 and March 1918.Footnote 85
Black undertook additional fieldwork in 1927, which was written up in a series of articles for the religious press between November 1927 and April 1928.Footnote 86 Of particular importance were three articles commissioned by the British Weekly, published in March-April. Its editor asked Black to carry out in-depth surveys of churchgoing in two contrasting London districts, one a poor industrial area and the other a suburban area. These are now thought to be, respectively, a poor parliamentary division of the borough of Battersea and Putney/Roehampton in the borough of Wandsworth.Footnote 87 In the former, congregations at morning and evening services decreased by 61.81 per cent overall during the previous quarter-century (69.90 per cent in the Church of England, 74.76 per cent in the Free Churches), with an estimated one in twenty-two of the Protestant population worshipping on any given Sunday in 1927 (after adjusting for twicing).Footnote 88 In the latter, the drop in churchgoing since 1902–3 had been less steep, partly due to growth among Catholics and newer Protestant sects, but it was still a substantial 33.43 per cent (and 44.06 per cent for Free Churches), with one in eleven of the Protestant population in the pews weekly in 1927.Footnote 89 By way of cross-check, Black also visited more than 180 Protestant churches in poor industrial areas of twelve London boroughs; here there had been near universal decline in attendances at morning or evening services since 1902–3, by 63.89 per cent overall (58.39 per cent in the Church of England, 66.61 per cent in Free Churches).Footnote 90 Black concluded: ‘London is becoming paganised in its disregard of the outward corporate forms of religion.’Footnote 91
The 1933–4 religious census
Surprisingly little is known about a census of Inner London and Outer London churches begun in 1933–4. The project neither gained much news coverage at the time nor did it leave much documentation behind. It was the brainchild of Thomas Cochrane, former medical missionary in China, who was founder and president of the Mildmay Movement for World Evangelisation, housed at the Mildmay Centre in Islington (which Cochrane bought in 1931).Footnote 92 He was convinced that ‘London is the most pagan city in the country.’Footnote 93 The census of churchgoing was taken in stages during 1933–4, across three Sundays in each area, concentrating on areas where Mildmay evangelistic campaigns were about to be held. First results, for eight anonymised boroughs (see Table 11), were published in October 1934, accompanied by a metropolitan projection seemingly based on doubtful statistics.Footnote 94 From such garbled data emanated the deduction that only one Londoner in twenty went to church, which was probably not the case.Footnote 95 Almost six months later, it was reported that only eight boroughs had still been surveyed; the likelihood, therefore, is that the initiative had petered out.Footnote 96
The eight boroughs in Table 11 did not constitute a cross-section of Inner London and Outer London, and they underrepresented areas (particularly the most well-to-do) likely to have the highest rates of churchgoing. In aggregate, attendance in the boroughs decreased by 41.15 per cent between 1902–3 and 1933–4 while population had risen by 18.61 per cent; accordingly, the collective IA had halved, from 22.96 to 11.39. Individual borough IAs in 1933–4 ranged from 4.12 in Bermondsey to 19.47 in the unidentified borough 7. Cochrane was fond of highlighting the challenges faced in Islington, where he was based, the 132 churches left in 1933–4 competing with 312 public houses and eighteen cinemas, the latter alone attracting nearly twice as many patrons on Sundays as the churches did worshippers. Although Cochrane was incorrect in claiming Islington’s churchgoing had dropped from 25 per cent to 5 per cent in thirty years,Footnote 97 the enumeration of the eight boroughs is consistent with other English evidence that the interwar years were significant in the history of churchgoing decline.Footnote 98
The 1939–45 Mass Observation studies
The social research organisation Mass Observation (MO), founded by Tom Harrisson and Charles Madge in 1937, undertook considerable religion-related research during the Second World War, a few examples of which are relevant in a London churchgoing context.Footnote 99 A series of church censuses was arranged at morning services in Paddington in 1941, worshippers numbering 3,347 on 23 March (a National Day of Prayer, the weather wet and cold), 2,058 on 13 April (Easter Day, warm and dry), 1,254 on 11 May (aftermath of heavy bombing) and 1,808 on 8 June (a ‘normal’ Sunday, with fine weather). Morning and evening attendances combined on 8 June were 3,398, under 4 per cent of estimated population. Peak congregations on a National Day of Prayer were not unexpected; in a vox pop of Londoners, three-fifths told MO they considered such days a ‘good thing’ and a quarter participated in them, although only a minority had such confidence in the power of prayer as to think it would shorten the war. Insights into churchgoing towards the end of the war can be gleaned from MO’s Puzzled people study, based on interviews with Hammersmith residents in 1944–5; 28 per cent self-reported they had attended church within the past six months, compared with three-quarters who had been to the cinemas and three-fifths to public houses during the same period. Three-fifths admitted they never went to church or did so only for rites of passage, to the despair of local clergy: ‘they think about churchgoing as a sort of harmless hobby’.
The 1945–79 data vacuum
The third quarter of the twentieth century witnessed no censuses of church attendance in London and few elsewhere in England. This is frustrating given claims by Callum Brown that the period between the end of the Second World War and the late 1950s was one of ‘religious boom’,Footnote 100 a thesis contested by Simon Green and Clive Field.Footnote 101 Large-scale evangelistic crusades were certainly in vogue at the time, but there is little evidence they helped boost churchgoing in the long term. In London, American evangelist Billy Graham pulled in the crowds at his crusades in March–May 1954, May 1955, June 1966 and June 1967, but this did not swell numbers in the pews afterwards. For instance, during the twelve-week Greater London Crusade in 1954, 1,872,000 attended meetings addressed by Graham, just 36,431 of whom responded to his invitation to come forward, nine-tenths of them already in some church connection.Footnote 102 Evangelistic crusades were largely jamborees for the faithful.
In the absence of religious censuses for London in the third quarter of the century, it is tempting to turn to opinion poll evidence for churchgoing, often an inaccurate guide, prone to overstated self-reporting.Footnote 103 Two local surveys in Outer London touching on claimed church attendance by adults are known, at Dagenham (a predominantly working-class area, centred on the Becontree council estate) in 1958–9, where just 8 per cent frequented services at least monthly and 82 per cent not at all; and Woodford (more middle-class) in 1959, where 15 per cent went weekly, 12 per cent monthly and 46 per cent never.Footnote 104 However, the most general poll was conducted by Associated Rediffusion as part of the late David Glass’s unpublished Third Londoner Survey, for which 5,879 adults aged between twenty-two and fifty-nine were interviewed in 1960. Professed weekly or fortnightly churchgoing then stood at 16 per cent, with 57 per cent worshipping less often and 26 per cent never.Footnote 105
1979–2012 religious censuses
Peter Brierley is a church statistician who, after eleven years in the civil service, became programme director of the Bible Society (1978–82), director of MARC Europe (1982–93), director of Christian Research (1993–2007) and director of Brierley Consultancy (since 2007). Among his many projects, Brierley managed four ecumenical religious censuses of Trinitarian churches in England between 1979 and 2005, which naturally covered Greater London. Additionally, he organised a further census just in Greater London in 2012, on behalf of the LCM. The methodology was the same in each case, a questionnaire sent to the minister or other official of each place of worship, requesting statistics of churchgoing by adults and children (including Sunday scholars) at morning and afternoon/evening services for the census date. This date varied: a normal Sunday in November 1979, 15 October 1989, a typical Sunday in September 1998, 8 May 2005 and 14 October 2012. Response rates were also variable: 74 per cent in 1979, 70 per cent in 1989, 33 per cent in 1998, and 50 per cent in 2005 (national figures; unknown response rates for London) and 54 per cent in 2012.Footnote 106 Results were grossed up by Brierley for missing and defective returns and adjusted for twicing.
Table 12 provides an overview of attendances in Greater London at each census according to the denominational groupings assigned by Brierley, with national comparisons. The 1979 and 1989 censuses suggested ongoing decline in metropolitan churchgoing, with the Greater London IA lagging behind England’s, albeit the gap between them was narrowing. However, by 1998 Greater London’s IA was superior to England’s IA (remaining so in 2005), and between 1998 and 2005 aggregate attendances in London rose by 0.83 per cent, despite the IA continuing to fall (to 8.29 in 2005).Footnote 107 Then came unexpected growth in London churchgoing, both absolutely and relatively, from 2005 to 2012, with total attendances rising by 15.81 per cent and the IA climbing to 8.67. Underpinning this trend was a gradual reversal of the longstanding shift in the balance of attendances from Inner London to Outer London, as the churchgoing classes sought a brighter future in outlying suburbs. Between 1989 and 2012 Inner London’s share of worshippers actually increased from 38.73 per cent to 44.48 per cent.
The primary drivers of these changes were large-scale immigration and heightened ethnic diversity, including rapid development of black majority churches, whose flourishing was in stark contrast to the relative failure of an earlier generation of black immigrants to assimilate into (and be welcomed by) white majority churches.Footnote 108 The success of the millennium era migrants was exemplified in the 49.97 per cent increase in Pentecostal worshippers between 2005 and 2012 and of 30.14 per cent for a cluster of ‘other denominations’ (Independent, New, other Protestant and Orthodox). Several useful case studies of this socio-religious transformation appear in a recent monograph on contemporary London Churches, although the overarching editorial argument for desecularisation is far from proven.Footnote 109 Among the mainstream Churches in Table 12, only Baptists effectively held their own in absolute terms between 1979 and 2012. Anglican attendances in Greater London contracted by 39.64 per cent over this period, United Reformed by 59.18 per cent, Methodist by 47.71 per cent and Roman Catholic by 40.58 per cent (Catholic decline concentrated in 1979–2005 before flattening out).
Summary to 2012
The index of attendance (IA) has been our key metric for quantifying London churchgoing, expressing attendances on an average Sunday as a percentage of population. During the second quarter of the nineteenth century, IAs were erratic, but fewer than half of Londoners attended church weekly and often less than a quarter. A clearer pattern emerges from subsequent religious censuses (see Table 13). In Inner London, unadjusted for twicing, the IA in 1851 was one third, falling to one fifth by the turn of the century, when discounted for twicing. Attendance declined further before, during and after the First World War (as revealed by the Black and Mildmay studies) and, adjusted for twicing, the Inner London IA had reached 11.1 in 1989 and 8.9 in 1998 before a small uptick to 9.0 in 2005 and a larger one (principally fuelled by immigration) to 9.9 in 2012. In Greater London, the IA, again adjusted for twicing, halved between 1902–3 and 1979, continuing its shrinkage to 2005 (8.3) before rising to 8.7 in 2012. Throughout the nineteenth and twentieth centuries, churchgoing rates in London were mostly beneath those in other major British conurbations; not until 1998, 2005 and (presumably) 2012 did London seemingly exceed England’s IA (see Table 12).
Alongside changing IAs, there has also been redistribution of denominational shares of attendances (see Table 14). The Church of England has been the clear loser in this process. In the mid-nineteenth century, and doubtless long before, it commanded a majority position, but it progressively ceded ground to other Protestants thereafter and was overtaken by them around the 1902–3 census. By the early twenty-first century, only one in eight church attenders in Greater London was Anglican. In the twentieth century, other Protestants also lost market share as the historic Free Churches (particularly Methodist and Reformed traditions) contracted sharply, reaching a low of 31.11 in 1979, but the other Protestants sector was then re-energised by newer manifestations of Protestantism, including Pentecostal and black majority churches, which had secured it a majority position by the early twenty-first century. In the nineteenth century, Roman Catholics accounted for almost a tenth of attendances (the low proportion in 1886–7 was the result of undercounting morning masses), their share expanding substantially in the twentieth century until they, too, were affected by churchgoing decline from c.1980, their 2012 share being almost half that in 1979.
2012 to present
There has been no English church census since 2005 and no further London census either. Churches no longer have the appetite for ecumenical statistical projects that produce depressingly predictable results. So, what is known about the level of London churchgoing between 2012 and the present?
Five things seem clear. The first is that the pool of potential churchgoers has been reduced by deChristianisation in London. As the decennial censuses of 2001–21 have revealed (see Table 15), the proportion of professing Christians in the capital has decreased over two decades from 58.23 per cent to 40.66 per cent while religious nones and non-Christians have increased from, respectively, 15.76 per cent to 27.05 per cent and 17.34 per cent to 25.30 per cent.
Secondly, in London as elsewhere, the Covid-19 pandemic adversely affected in-person attendance at church, in that habits of churchgoing were broken by lockdowns and restrictions on public worship in 2020–1 and deaths from the disease disproportionately occurred among the elderly and ethnic minorities who constituted the backbone of most congregations. Alternative online/offline forms of worship showed initial promise during the pandemic but proved relatively unpopular with the faithful and have been progressively withdrawn.
Thirdly, denominations which collect and publish their own attendance statistics confirm ongoing decline in London since 2012. Three examples must suffice. In the Church of England, combined usual Sunday attendance (uSa) of the dioceses of London and Southwark decreased by 8.78 per cent between 2012 (year of last Brierley census) and 2019 (last year before the pandemic). Because of Covid-19, the uSa was not recorded for 2020–1, but when next measured in 2022, it stood 20.07 per cent below the 2019 level. The figure recovered somewhat in 2023 (last year available) but was still 15.85 per cent below 2019 and 23.23 per cent below 2012.Footnote 110 In the Methodist Church, collection of attendance data ceased in 2019, but between 2013 and 2019 average congregations in the London district fell by 33.17 per cent on a slightly inconsistent criterion.Footnote 111 In the Roman Catholic Church, mass attendance in the dioceses of Westminster and Southwark fell by 10.54 per cent between 2012 and 2019 and 22.77 per cent between 2019 and 2023 (again, the last year available); from 2012 to 2023, the drop was 30.91 per cent.Footnote 112
Fourthly, the large-scale immigration of people of Christian heritage underpinning much of the surge in London churchgoing in the early twenty-first century may not persist. Tighter immigration controls by government in response to the emergence of Reform UK and wider public concerns about legal/illegal migration may reduce the number of arrivals, just as implementation of Brexit curtailed migrants from EU countries. Current data suggest that net migration to the UK has fallen substantially since 2023, while the capital’s share of it decreased from nearly half in 2017 to a quarter in 2022–3.
Fifthly, Brierley, architect of the 1979–2012 censuses, is sceptical about prospects for churchgoing growth. When preparing the 2012 figures, he made a projection for 2020, anticipating an absolute decline in attendances in Greater London of 2.41 per cent over eight years and a fall relative to population (IA) from 8.67 to 7.94 (see Table 12).Footnote 113 In his chapter on the 2012 census in The desecularisation of the city (2019), Brierley swam against the tide of fellow contributors and his editors in counselling: ‘It is by no means certain that such growth will continue.’Footnote 114 Reviewing the situation in 2025, he thinks that, overall, London church attendance exhibits net decline, notwithstanding pockets of expansion. Black majority churches seem to have lost some of their former momentum and also lost many members from the inner city to suburbs. Brierley adds that the high cost of public transport and of vehicle taxation and parking inhibits travelling large distances to church, particularly into central districts of London.Footnote 115
This appraisal thus points towards the post-2012 era as one of net decline in church attendance in the capital. If we accept Brierley’s London IAs of 8.67 in 2012 and estimate of 7.94 in 2020 (see Table12), then the likelihood is that churchgoing on an average Sunday in 2025 is 6 per cent (maximum) of the population, but with a broad range from borough to borough. This is a higher proportion than in some other contemporary British cities, testimony to the brief uplift in religious practice around the millennium. Before that, religious census and other evidence synthesised here depicts fairly continuous relative decline (measured by IAs) since the late nineteenth century. The optimistic readings of London’s modern religious history proposed by William Jacob, John Wolffe and David Goodhew tend to confuse ‘religious vitality’ with religious advance. Our statistics of church attendance, a key metric of secularisation, confirm that, so far as this facet of organised Christianity is concerned, metropolitan culture and the secular society have converged.
APPENDIX
The Statistical Record
Church attendance, general congregation and Sunday scholars, Inner London, 1851

Table 1. Long description
From the top row downward, denominations are listed in the leftmost column: Church of England, Congregationalists, Baptists, Presbyterians, Wesleyans, Other Methodists, Other Protestants, Roman Catholics, Orthodox, Jews, and Total. Each row contains five attendance columns: Morning, Afternoon, Evening, Total, and IA. Church of England records 261,426 morning, 76,666 afternoon, 157,135 evening, 495,227 total, IA 20.96. Congregationalists: 69,631 morning, 6,684 afternoon, 61,863 evening, 138,178 total, IA 5.85. Baptists: 32,801 morning, 5,466 afternoon, 32,440 evening, 70,707 total, IA 2.99. Presbyterians: 10,527 morning, 100 afternoon, 7,244 evening, 17,871 total, IA 0.76. Wesleyans: 24,507 morning, 2,454 afternoon, 23,135 evening, 50,096 total, IA 2.12. Other Methodists: 11,242 morning, 866 afternoon, 9,048 evening, 21,156 total, IA 0.90. Other Protestants: 11,888 morning, 3,420 afternoon, 7,044 evening, 22,352 total, IA 0.95. Roman Catholics: 36,494 morning, 4,660 afternoon, 14,594 evening, 55,748 total, IA 2.36. Orthodox: 180 morning, no afternoon or evening values, 180 total, IA 0.01. Jews: 1,472 morning, 539 afternoon, 813 evening, 2,824 total, IA 0.12. The bottom row totals all denominations: 460,168 morning, 100,855 afternoon, 313,316 evening, 874,339 total, IA 37.01. IA represents attendance as a percentage of population. Church of England dominates attendance, followed by Congregationalists and Baptists. Orthodox and Jews have the lowest attendance. Notes clarify population size, attendance methodology, and reporting gaps.
Source: Census of Great Britain, 1851: religious worship, England and Wales, BPP 1852–3, lxxxix, p. clxxxiv.
Notes: Population 2,362,236. Attendance based upon general congregations and Sunday scholars assembling at same time as general congregations (but not otherwise). Returns of estimated attendance were self-reported by ministers/other officials of each place of worship. However, attendances were not given for fifty-three of 1,097 places of worship for which returns were made in Inner London, thirty-nine of these non-respondents from the Church of England, and no estimates for them have been made. Presbyterians include English and Scottish varieties. Welsh Calvinistic Methodists and Lady Huntingdon’s Connexion are included with other Methodists. Typographical/arithmetical error in original total of morning attendances has been corrected.
Church attendance, general congregation, Inner London, 1851

Table 2. Long description
Beginning at the top row, the denominations listed are Church of England, Congregationalists, Baptists, Presbyterians, Wesleyans, Other Methodists, Other Protestants, Roman Catholics, Orthodox, Jews, and Total. For each denomination, attendance is shown for Morning, Afternoon, Evening, Total, and IA. Church of England records 213,066 Morning, 61,948 Afternoon, 146,393 Evening, 421,407 Total, and 17.84 IA. Congregationalists have 49,898 Morning, 4,602 Afternoon, 55,169 Evening, 109,669 Total, and 4.64 IA. Baptists show 26,909 Morning, 3,725 Afternoon, 33,287 Evening, 63,921 Total, and 2.71 IA. Presbyterians report 12,270 Morning, 300 Afternoon, 10,299 Evening, 22,869 Total, and 0.97 IA. Wesleyans have 15,828 Morning, 2,039 Afternoon, 21,260 Evening, 39,127 Total, and 1.66 IA. Other Methodists show 8,158 Morning, 633 Afternoon, 9,367 Evening, 18,158 Total, and 0.77 IA. Other Protestants record 9,829 Morning, 2,969 Afternoon, 6,919 Evening, 19,717 Total, and 0.83 IA. Roman Catholics have 54,960 Morning, 4,399 Afternoon, 15,999 Evening, 75,358 Total, and 3.19 IA. Orthodox list 180 Morning, no Afternoon or Evening values, 180 Total, and 0.01 IA. Jews show 1,378 Morning, 451 Afternoon, 768 Evening, 2,597 Total, and 0.11 IA. The final row totals are 392,476 Morning, 81,066 Afternoon, 299,461 Evening, 773,003 Total, and 32.72 IA. IA represents attendance per 100 population. The Church of England has the highest attendance and IA, followed by Roman Catholics and Congregationalists. Orthodox and Jews have the lowest values. Notes clarify population size, attendance calculation, and data adjustments.
Source: TNA, HO 129/1–36.
Notes: Population 2,362,236. Attendance based upon general congregations only, omitting Sunday scholars. Where no estimate of general congregation on 30 March was given, average attendance has been used. Otherwise, no allowance has been made for missing data. Duplicate returns have been identified and weeded out; hence, there are twenty-five fewer places of worship in London than in the religious census parliamentary paper (1,072 compared with 1,097).
Church attendance, general congregation, Inner London, 1851, by registration district

Table 3. Long description
The table has nine columns: District number, District name, Population, Churches, Morning attendance, Afternoon attendance, Evening attendance, Total attendance, and IA. The header row lists these columns. Each subsequent row represents a district, numbered 1 to 36, with the district name and corresponding data. For example, row 1 is Kensington with a population of 120004, 56 churches, morning attendance 17535, afternoon 4079, evening 10806, total 32420, IA 27.02. The last row provides totals: population 2362236, churches 1072, morning attendance 392476, afternoon 81066, evening 299461, total attendance 773003, IA 32.72. IA values vary by district, with the highest in City of London at 83.17 and the lowest in Shoreditch at 15.41. The table is sourced from T N A, H O 129/1 to 36.
Source: TNA, HO 129/1–36.
Notes: See Table 2.
Places of worship, Inner London, 1851–1914

Table 4. Long description
Starting from the top row, denominations listed are Church of England, Congregationalists, Baptists, Wesleyans, Other Methodists, Presbyterians, Salvation Army, Other Protestants, Roman Catholics, Jews, followed by Total, Population, and Population per place of worship. Columns represent years: 1851, 1865, 1886–7, 1902–3, and 1914. Church of England increases from 458 in 1851 to 1,165 in 1914. Congregationalists rise from 161 to a peak of 256 in 1886–7, then decline to 203 in 1914. Baptists grow from 130 to 283 in 1902–3, then decrease to 242. Wesleyans fluctuate, peaking at 159 in 1902–3. Other Methodists rise from 62 to 119 in 1865, then decrease to 109. Presbyterians increase from 23 to 67. Salvation Army appears in 1886–7 with 44, rising to 93 in 1902–3, then 81. Other Protestants surge from 119 to 614. Roman Catholics grow from 35 to 118. Jews increase from 11 to 70. Total places of worship rise from 1,097 in 1851 to 2,810 in 1914. Population grows from 2,362,236 in 1851 to a peak of 4,533,600 in 1902–3, then slightly decreases to 4,500,000 in 1914. Population per place of worship decreases from 2,153.36 in 1851 to 1,601.42 in 1914, indicating more places of worship per capita over time.
Sources: (1851 and 1865) The Nonconformist, 15 Nov. 1865, 933–40; (1886–7) The religious census of London, reprinted from ‘The British Weekly’, London 1888; (1902–3) R. Mudie-Smith (ed.), The religious life of London, London 1904; (1914) W. Harris and M. Bryant, The Churches and London, London [1914], 378–429.
Notes: The area covered comprised the thirty-six districts (in 1851) and the twenty-nine boroughs (at all other dates) of Inner London. Places of worship included churches, chapels and missions. The 1884 statistics were a revision of those published in 1879 by the London Congregational Union and relating to 1878–9. The 1902–3 figures have been calculated afresh by the author and differ slightly from totals published in Mudie-Smith, Religious life of London, 447. Other Methodists included Primitive Methodists, Methodist New Connexion, United Methodist Free Churches (and predecessor bodies), Bible Christians and Calvinistic Methodists.
Sittings in places of worship, Inner London, 1851–86/7

Table 5. Long description
From the top row, denominations are listed in the first column: Church of England, Congregationalists, Baptists, Wesleyans, Other Methodists, Presbyterians, Salvation Army, Other Protestants, Roman Catholics, Jews. Each denomination’s number of sittings is shown for four years: 1851, 1865, 1884, and 1886/7. Church of England sittings rise from 409,834 in 1851 to a peak of 677,645 in 1884, then decrease to 645,766 in 1886/7. Congregationalists increase from 100,436 in 1851 to 172,547 in 1884, then slightly decrease to 167,942. Baptists grow from 54,234 in 1851 to 136,823 in 1886/7. Wesleyans rise from 44,162 in 1851 to 98,973 in 1886/7. Other Methodists increase from 12,326 in 1851 to 41,995 in 1884, then decrease to 35,085. Presbyterians rise from 18,231 in 1851 to 36,675 in 1886/7. Salvation Army data appears only for 1884 and 1886/7, with 35,180 and 32,830 sittings respectively. Other Protestants grow from 37,404 in 1851 to 153,148 in 1886/7. Roman Catholics increase from 18,230 in 1851 to 51,190 in 1884, then decrease to 47,700. Jews rise from 3,692 in 1851 to 9,150 in 1886/7. The total number of sittings increases from 698,549 in 1851 to 1,388,792 in 1884, then slightly decreases to 1,364,092 in 1886/7. Population figures rise from 2,362,236 in 1851 to 4,059,000 in 1886/7. Sittings as a percentage of population increase from 29.57 in 1851 to 34.55 in 1884, then decrease to 33.61 in 1886/7. Notes clarify that data include churches, chapels, and missions, with revisions for omissions and denominational breakdowns.
Sources: (1851 and 1865) The Nonconformist, 15 Nov. 1865, 933–40; (1884) The Nonconformist and Independent, 12 Feb. 1885, supplement, 1–4; (1886–7) The religious census of London, reprinted from ‘The British Weekly’, London 1888, 52–3 and insert.
Notes: Data refer to the number of sittings in churches, chapels and missions. The 1851 statistics were revised by The Nonconformist to take account of omissions from the returns to the official census in 1851. The 1884 statistics were a revision of those published in 1879 by the London Congregational Union and relating to 1878–9. Other Methodists included Primitive Methodists, Methodist New Connexion, United Methodist Free Churches (and predecessor bodies), Bible Christians and Calvinistic Methodists.
Church attendance, Inner London, 1886–7

Table 6. Long description
From the top row downward, denominations are listed: Church of England, Congregationalists, Baptists, Presbyterians, Wesleyans, Other Methodists, Salvation Army, Other Protestants, Roman Catholics, Orthodox, Jews, Public institutions, and Total. Columns from left to right are Denomination, Churches morning, Churches evening, Missions morning, Missions afternoon, Missions evening, Total, and I A. Church of England records 269,799 for churches morning, 265,916 for churches evening, 6,049 for missions morning, 4,416 for missions afternoon, 16,797 for missions evening, total 562,977, I A 13.87. Congregationalists: 50,051, 62,180, 1,339, 1,948, 11,341, total 126,859, I A 3.13. Baptists: 49,188, 58,711, 3,835, 2,375, 10,415, total 124,524, I A 3.07. Presbyterians: 14,886, 15,541, 703, 1,061, 2,332, total 34,523, I A 0.85. Wesleyans: 33,903, 37,538, 2,868, 2,132, 8,093, total 84,534, I A 2.08. Other Methodists: 11,706, 12,355, 144, 36, 204, total 24,445, I A 0.60. Salvation Army: missions morning 6,987, missions afternoon 12,217, missions evening 25,968, total 45,172, I A 1.11. Other Protestants: 11,597, 11,593, 12,311, 12,144, 57,789, total 105,434, I A 2.60. Roman Catholics: 26,090, 28,225, total 54,315, I A 1.34. Orthodox: 199 for churches morning, total 199, I A 0.01. Jews: 2,850, 1,480, total 4,330, I A 0.11. Public institutions: 12,492, 7,465, total 19,957, I A 0.49. The bottom row gives totals: churches morning 482,761, churches evening 501,004, missions morning 34,236, missions afternoon 36,329, missions evening 132,939, total 1,187,269, I A 29.25. Attendance is highest for Church of England, followed by Congregationalists and Baptists. Several denominations have missing values for certain service types. I A values indicate relative attendance per denomination.
Source: The religious census of London, reprinted from ‘The British Weekly’, London 1888, 52–3 and insert.
Notes: Estimated population 4,059,000. Census was undertaken at morning and evening services on Sunday, 24 October 1886 (churches); and at morning, afternoon and evening services on Sunday, 27 November 1887 (missions). The day of the church census saw many special services, harvest festivals in the Church of England and anniversary services in Nonconformist chapels. In Roman Catholic churches, only Sunday high mass at 11 a.m. was counted, despite every other morning Mass being attended by a distinct congregation; had these earlier morning Masses been enumerated, the British Weekly estimated Catholic worshippers would have been treble the number tabulated here.
Church attendance, Inner London, 1902–3

Table 7. Long description
From the top row downward, denominations are listed in the first column: Church of England, Congregationalists, Baptists, Presbyterians, Wesleyans, Other Methodists, Salvation Army, Other Protestants, Roman Catholics, Jews, and Total. Morning attendance is highest for Church of England at 220,422, followed by Roman Catholics at 73,680. Evening attendance is highest for Church of England at 209,400, with Baptists at 64,025 and Congregationalists at 61,236. Total attendance is led by Church of England at 429,822, then Baptists at 108,455, Congregationalists at 105,535, Roman Catholics at 93,572, Other Protestants at 84,984, Wesleyans at 78,139, Jews at 26,612, Presbyterians at 24,778, Salvation Army at 22,402, and Other Methodists at 29,062. IA values range from 9.48 for Church of England to 0.49 for Salvation Army. Jews have only morning attendance recorded. The bottom row sums all denominations: morning 498,941, evening 504,420, total 1,003,361, IA 22.13. Population context and census methodology are noted in the table foot.
Source: R. Mudie-Smith (ed.), The religious life of London, London 1904, 265, 271.
Notes: Population 4,533,600. Census was undertaken, at the principal Sunday morning and evening services, on a staggered basis between 30 November 1902 and 21 June 1903. All Roman Catholic Sunday morning masses were counted. Synagogue attendance was taken on first day in Passover week 1903. Children’s services distinct from Sunday schools and held at hour of the main Sunday morning/evening services were recorded but Sunday schools were excluded.
Church attendance, Outer London, 1903

Table 8. Long description
From the top row downward, denominations listed are Church of England, Congregationalists, Baptists, Presbyterians, Wesleyans, Other Methodists, Salvation Army, Other Protestants, and Roman Catholics. Columns from left to right are Denomination, Morning, Evening, Total, and I A. Church of England records 114,073 morning, 122,136 evening, 236,209 total, and 12.20 I A. Congregationalists: 25,088 morning, 29,326 evening, 54,414 total, 2.81 I A. Baptists: 23,653 morning, 31,024 evening, 54,677 total, 2.82 I A. Presbyterians: 6,355 morning, 6,888 evening, 13,243 total, 0.68 I A. Wesleyans: 19,092 morning, 25,408 evening, 44,500 total, 2.30 I A. Other Methodists: 9,780 morning, 13,695 evening, 23,475 total, 1.21 I A. Salvation Army: 5,247 morning, 11,247 evening, 16,494 total, 0.85 I A. Other Protestants: 13,628 morning, 27,091 evening, 40,719 total, 2.10 I A. Roman Catholics: 22,743 morning, 8,635 evening, 31,378 total, 1.62 I A. The final row totals are 239,659 morning, 275,450 evening, 515,109 total, and 26.61 I A. The highest attendance and I A values are for Church of England, while Presbyterians and Salvation Army have the lowest totals and I A values. All data reflect principal Sunday services, with population noted as 1,935,900 and census covering fifty-two districts.
Source: R. Mudie-Smith (ed.), The religious life of London, London 1904, 446, 462.
Notes: Population 1,935,900. Figures incorporate late enumerations of thirty places of worship listed in addenda but omitted from main totals. Census was undertaken in fifty-two districts of Outer London at principal Sunday morning and evening services, on a staggered basis between 19 July and 8 November 1903. All Roman Catholic Sunday morning masses were counted. Children’s services distinct from Sunday schools and held at the hour of main Sunday morning/evening services were recorded but Sunday schools were excluded.
Church attendance, adjusted for twicing, Inner London and Outer London, 1902–3

Table 9. Long description
Starting from the top, the table divides into Inner London and Outer London. For Inner London, denominations listed are Church of England, Other Protestants, Roman Catholics, and Jews. Columns display morning attendances, twicers (those attending both morning and evening), evening attendances, unique attenders, and IA. Church of England in Inner London records 220,422 morning attendances, minus 53,780 twicers, 209,400 evening attendances, 376,042 unique attenders, and IA of 8.29. Other Protestants show 178,227 morning attendances, minus 73,610 twicers, 275,128 evening attendances, 379,745 unique attenders, and IA of 8.38. Roman Catholics have 73,680 morning attendances, no twicers, 19,892 evening attendances, 93,572 unique attenders, and IA of 2.06. Jews have 26,612 morning attendances, no twicers or evening attendances, 26,612 unique attenders, and IA of 0.59. The Inner London total is 498,941 morning attendances, minus 127,390 twicers, 504,420 evening attendances, 875,971 unique attenders, and IA of 19.32. For Outer London, denominations are Church of England, Other Protestants, and Roman Catholics. Church of England records 114,073 morning attendances, minus 25,365 twicers, 122,136 evening attendances, 210,844 unique attenders, and IA of 10.89. Other Protestants show 102,843 morning attendances, minus 39,260 twicers, 144,679 evening attendances, 208,262 unique attenders, and IA of 10.76. Roman Catholics have 22,743 morning attendances, no twicers, 8,635 evening attendances, 31,378 unique attenders, and IA of 1.62. The Outer London total is 239,659 morning attendances, minus 64,625 twicers, 275,450 evening attendances, 450,484 unique attenders, and IA of 23.27. Population figures are 4,533,600 for Inner London and 1,935,900 for Outer London. Twicer estimates are based on sixty-nine Protestant places of worship, with assumptions that all Roman Catholics and Jews are oncers.
Source: R. Mudie-Smith (ed.), The religious life of London, London 1904, 449–50.
Notes: Population 4,533,600 (Inner London), 1,935,900 (Outer London). Estimates for twicers derive from sixty-nine places of worship, of which forty-eight were in Inner London and twenty-one in Outer London. All were Protestant, including seventeen Church of England. They are unlikely to have constituted a representative sample of all Protestant Churches. It was assumed all Roman Catholics were oncers. It is certain all Jews were oncers.
Church attendance by demographics, Inner London and Outer London, 1902–3

Table 10. Long description
The table lists denominations in the first column, followed by columns for men, women, children, and total attendance. Church of England: men 153,375, women 292,720, children 219,422, total 665,517. Congregationalists: men 46,820, women 63,649, children 48,444, total 158,913. Baptists: men 45,205, women 68,052, children 49,795, total 163,052. Wesleyans: men 34,900, women 46,361, children 41,346, total 122,607. Other Methodists: men 14,127, women 17,564, children 20,503, total 52,194. Presbyterians: men 12,150, women 17,710, children 8,161, total 38,021. Salvation Army: men 11,307, women 14,494, children 13,095, total 38,896. Other Protestants: men 33,808, women 47,685, children 41,963, total 123,456. Roman Catholics: men 32,276, women 55,596, children 36,885, total 124,757. Jews: men 15,157, women 4,375, children 7,080, total 26,612. The final row gives overall totals: men 399,125, women 628,206, children 486,694, total 1,514,025. The Church of England has the highest attendance in all demographic groups.
Source: R. Mudie-Smith (ed.), The religious life of London, London 1904, 265, 271, 446.
Notes: Population 4,533,600 (Inner London), 1,935,900 (Outer London). Attendances were disaggregated by demographics for every place of worship in the census. This table presents a very compressed summary of the demographic data, giving daily totals for the major denominational groups for Inner London and Outer London combined.
Church attendance, eight boroughs/districts, Inner London and Outer London, 1902–3 and 1933–4

Table 11. Long description
Beginning at the top, each borough or district is listed with two rows: first for 1902–3, then for 1933–4. Columns are Borough/district, Year, Population, Churches, Sittings, Attendance, and I A. Borough 1 (Islington): 1902–3 population 319,155, 181 churches, 95,270 sittings, 72,002 attendance, I A 22.56; 1933–4 population 321,712, 132 churches, 81,471 sittings, 41,123 attendance, I A 12.78. Borough 2 (Shoreditch): 1902–3 population 102,309, 58 churches, 25,780 sittings, 16,863 attendance, I A 16.48; 1933–4 population 157,748, 55 churches, 25,134 sittings, 18,302 attendance, I A 11.60. Borough 3 (East Ham): 1902–3 population 95,333, 52 churches, 29,500 sittings, 21,259 attendance, I A 22.30; 1933–4 population 142,460, 47 churches, 26,330 sittings, 15,760 attendance, I A 11.06. Borough 4 (Woolwich): 1902–3 population 116,985, 80 churches, 39,375 sittings, 31,500 attendance, I A 26.93; 1933–4 population 147,000, 54 churches, 28,600 sittings, 15,480 attendance, I A 10.53. Borough 5 (Edmonton): 1902–3 population 45,007, 28 churches, 11,160 sittings, 9,858 attendance, I A 21.90; 1933–4 population 77,652, 22 churches, 9,960 sittings, 5,937 attendance, I A 7.65. Borough 6 (Bermondsey): 1902–3 population 130,760, 83 churches, 45,480 sittings, 27,635 attendance, I A 21.13; 1933–4 population 111,526, 49 churches, 15,150 sittings, 4,600 attendance, I A 4.12. Borough 7 (unidentified): 1902–3 population 82,000, 56 churches, 27,260 sittings, 23,273 attendance, I A 28.38; 1933–4 population 88,914, 58 churches, 29,260 sittings, 17,315 attendance, I A 19.47. Borough 8 (East Barnet): 1902–3 population 10,850, 11 churches, 6,500 sittings, 4,762 attendance, I A 43.89; 1933–4 population 23,362, 9 churches, 5,200 sittings, 3,400 attendance, I A 14.55. At the bottom, totals for all boroughs: 1902–3 population 902,399, 549 churches, 280,325 sittings, 207,152 attendance, I A 22.96; 1933–4 population 1,070,374, 426 churches, 221,105 sittings, 121,917 attendance, I A 11.39. Across all boroughs, church attendance and I A declined from 1902–3 to 1933–4, while population increased and the number of churches decreased.
Source: Scrutineer, ‘Disquieting figures about London’, World Dominion xii (1934), 415.
Notes: Surveys were taken, each across three Sundays, by Mildmay Movement for World Evangelisation. Comparisons made with Daily News religious census of London (1902–3). However, researchers in 1933–4 seem to have adjusted some original totals for churches, population and attendance in 1902–3 to reflect boundary changes between 1902–3 and 1933–4 or because only part of particular boroughs was surveyed in 1933–4. Exact/close correlations between population/attendance for 1902–3 suggest following matches: Islington (1), Shoreditch (2), East Ham (3), Woolwich (4), Edmonton (5), Bermondsey (6), East Barnet (8), with borough 7 unidentified.
Church attendance, Greater London, 1979–2012

Table 12. Long description
Starting from the top row, denominations are listed in the first column: Anglican, Baptist, United Reformed, Methodist, Independent, New, Pentecostal, Other Protestant, Roman Catholic, Orthodox, followed by Total, London population, London I A, and England I A. For each denomination, attendance values are given for 1979, 1989, 1998, 2005, 2012, and 2020E, moving left to right. Anglican attendance decreases from 140,500 in 1979 to 78,800 in 2020E. Baptist fluctuates, starting at 46,600 in 1979 and ending at 43,000 in 2020E. United Reformed declines from 19,600 to 6,500. Methodist drops from 35,000 to 15,200. Independent rises from 29,800 in 1979 to 40,900 in 1989, then stabilizes near 29,600 by 2020E. New denomination grows from 8,100 in 1979 to 44,500 in 2020E. Pentecostal increases sharply from 57,500 to 237,100. Other Protestant fluctuates, ending at 34,000. Roman Catholic declines from 333,700 to 193,800. Orthodox rises from 5,300 to 21,600. The Total row shows overall attendance: 696,000 in 1979, decreasing to 617,900 in 1998, then rising to 721,500 in 2012, and ending at 704,100 in 2020E. London population increases from 6,824,300 in 1979 to 8,867,000 in 2020E. London I A (attendance per thousand) decreases from 10.20 in 1979 to 7.94 in 2020E. England I A drops from 11.65 in 1979 to 6.26 in 2005, with no data for later years. The table shows denominational shifts, overall decline in traditional denominations, growth in Pentecostal and New churches, and fluctuating total attendance against a rising population.
Sources: All written/edited by P. Brierley: UK Christian handbook: religious trends, no. 2, 2000/01, London 1999, 12.17; UK Christian handbook: religious trends, no. 6, 2006/2007, London 2006, 12.46; Capital growth: what the 2012 London church census reveals, Tonbridge 2013, 57; UK church statistics, number 2, 2010 to 2020, Tonbridge 2014, 12.0–12.17; ‘The 2012 London church census’, in D. Goodhew and A.-P. Cooper (eds), The desecularisation of the city, London 2019, 60–85 at p. 67. Additionally, Brierley compiled reports on 1979 and 1989 censuses giving somewhat different statistics from the above: Prospects for the eighties, London 1980–3, i. 65; ii. 74–5; Prospects for the nineties, London 1991, 285–335; London, borough by borough, London [1992]; Churchgoers in England, district by district, London [1995], 7–8.
Notes: Area covered was Greater London (Inner London and Outer London). Censuses excluded non-Trinitarian Churches. Churchgoers comprised children (including Sunday scholars) and adults. Figures incorporated estimates for missing and defective returns and were adjusted for twicing. IAs recalculated by present author based on official mid-year population estimates. Statistics for 2020 estimates made by Brierley at time of 2012 census.
Index of church attendance, London, 1851–2012

Table 13. Long description
The table is structured with years listed vertically on the left and three columns for Inner London, Outer London, and Greater London, read left to right. The first section, unadjusted for twicing, lists: 1851—Inner London 32.7; 1886–7—Inner London 29.3; 1902–3—Inner London 22.1, Outer London 26.6, Greater London 23.5. The next section, adjusted for twicing, lists: 1902–3—Inner London 19.3, Outer London 23.3, Greater London 20.5; 1979—Greater London 10.2; 1989—Inner London 11.1, Outer London 8.9, Greater London 9.6; 1998—Inner London 8.9, Outer London 8.5, Greater London 8.7; 2005—Inner London 9.0, Outer London 7.9, Greater London 8.3; 2012—Inner London 9.9, Outer London 8.1, Greater London 8.7. The data show a general decline in church attendance indices across all regions from 1851 to 2012, with Inner London consistently higher than Outer and Greater London in most years.
Denominational shares (percentages) of church attendance, London, 1851–2012

Table 14. Long description
The table is divided into Inner London and Greater London. For Inner London, in 1851, Church of England is 54.52 percent, Other Protestants 35.38 percent, Roman Catholics 9.75 percent. In 1886 to 1887, Church of England 49.10 percent, Other Protestants 45.95 percent, Roman Catholics 4.57 percent. In 1902 to 1903, Church of England 42.84 percent, Other Protestants 45.18 percent, Roman Catholics 9.33 percent. For Greater London, in 1902 to 1903, Church of England 43.86 percent, Other Protestants 46.16 percent, Roman Catholics 8.23 percent. In 1979, Church of England 20.19 percent, Other Protestants 31.11 percent, Roman Catholics 47.95 percent. In 1989, Church of England 15.16 percent, Other Protestants 38.75 percent, Roman Catholics 45.10 percent. In 1998, Church of England 16.36 percent, Other Protestants 42.60 percent, Roman Catholics 38.39 percent. In 2005, Church of England 14.49 percent, Other Protestants 51.48 percent, Roman Catholics 31.36 percent. In 2012, Church of England 11.75 percent, Other Protestants 58.00 percent, Roman Catholics 27.48 percent. Orthodox and Jews are not included.
Religious profession (percentages), Greater London, census of population, 2001–21

Table 15. Long description
Starting from the top row, the table lists religious groups and their percentage values for each census year. Christian: 58.23 in 2001, 48.42 in 2011, 40.66 in 2021. Buddhist: 0.76, 1.00, 0.88. Hindu: 4.07, 5.03, 5.15. Jewish: 2.09, 1.82, 1.65. Muslim: 8.46, 12.39, 14.99. Sikh: 1.45, 1.54, 1.64. Other religion: 0.51, 0.59, 0.99. No religion: 15.76, 20.73, 27.05. Not stated: 8.66, 8.47, 7.00. The Christian percentage shows a consistent decline, while Muslim and No religion categories increase over time. All values are presented as percentages.
Source: England and Wales 2001 census, table ST103; 2011 census, table KS209EW; 2021 census, table TS030; all at <https://www.nomisweb.co.uk/>.
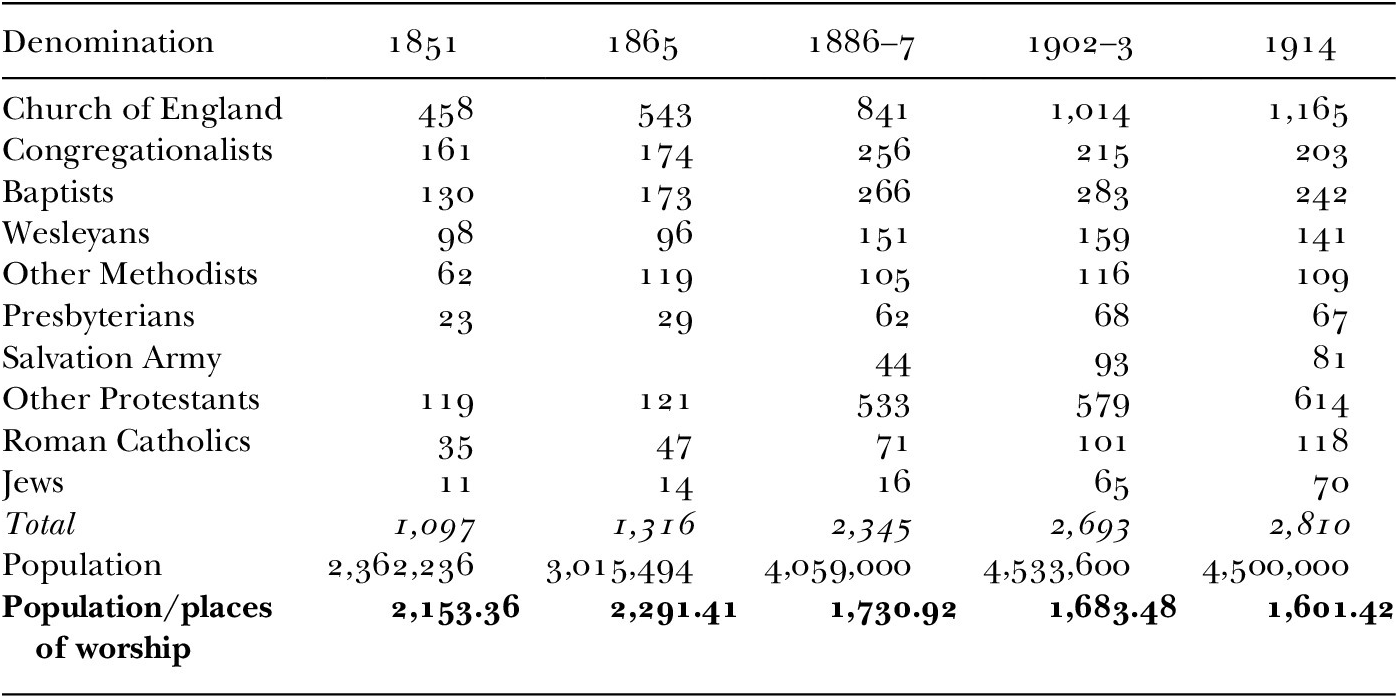
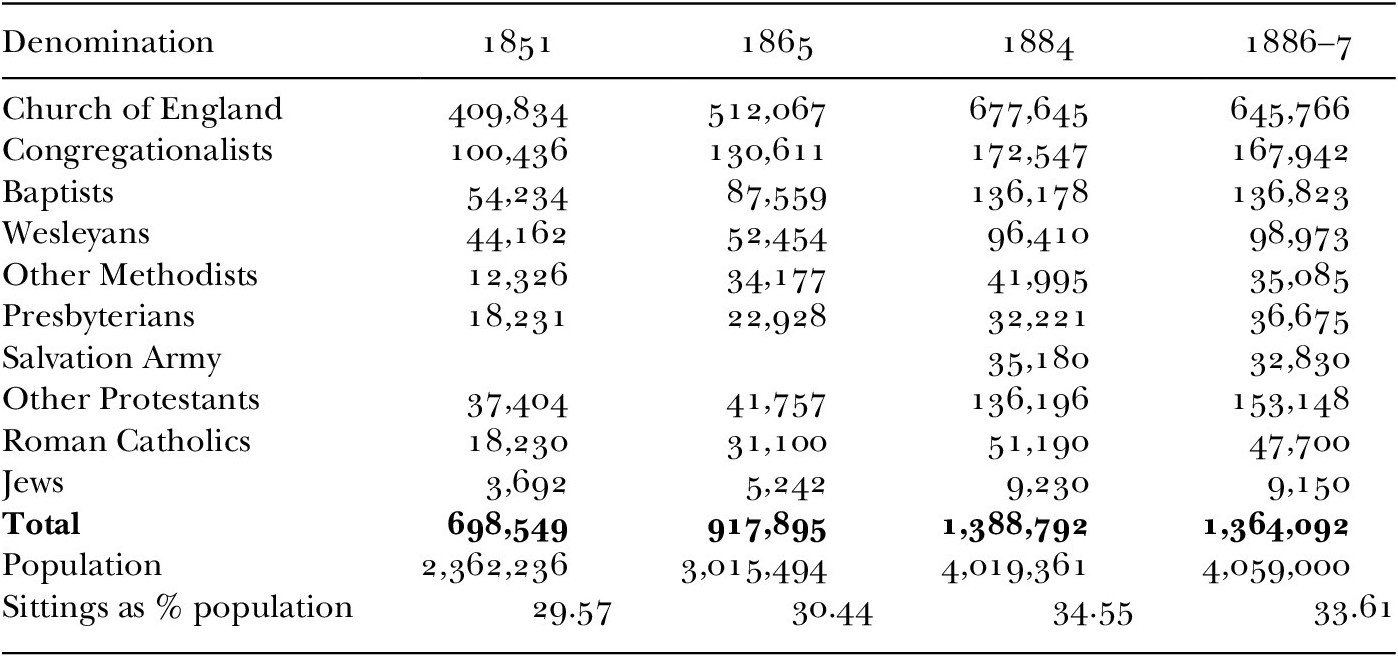
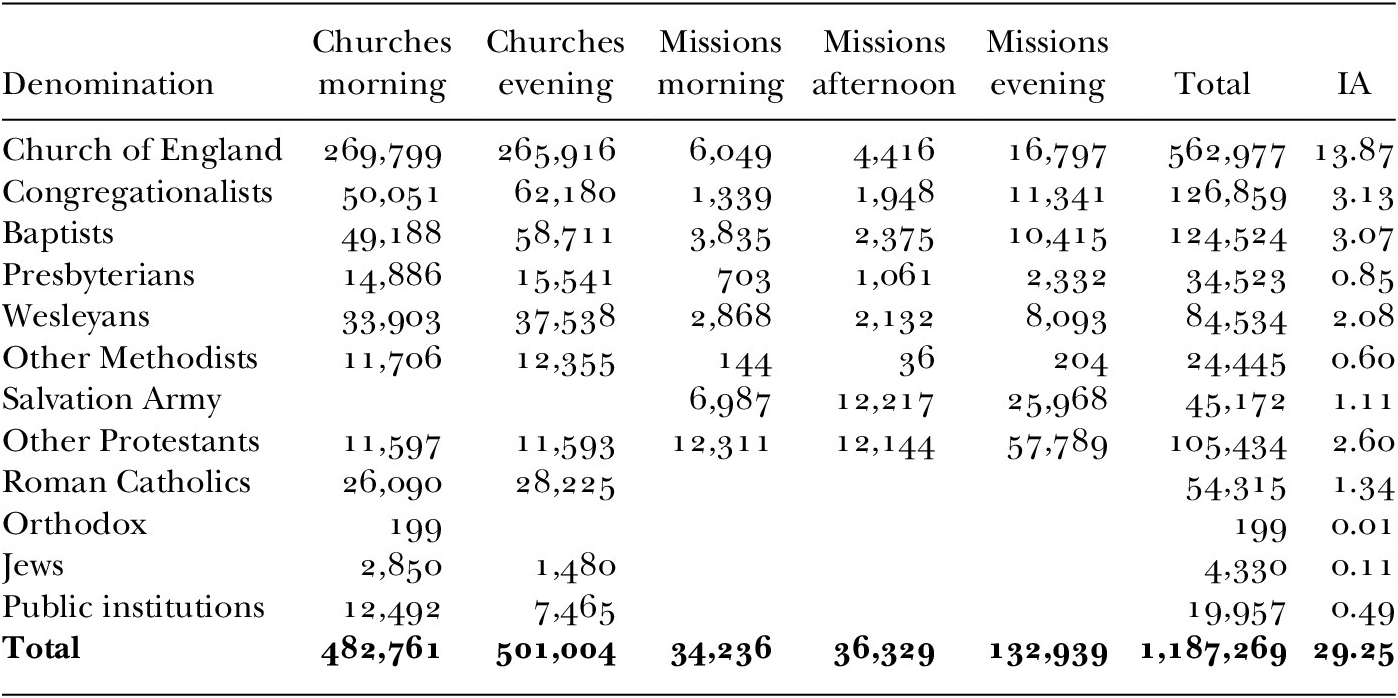
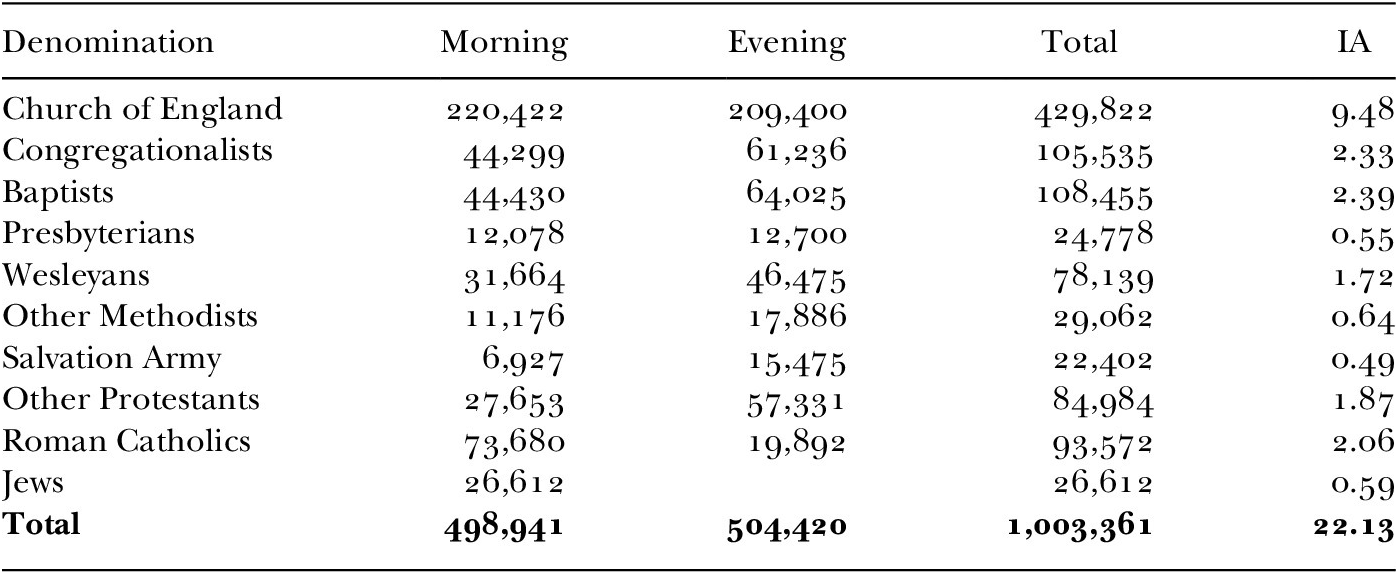
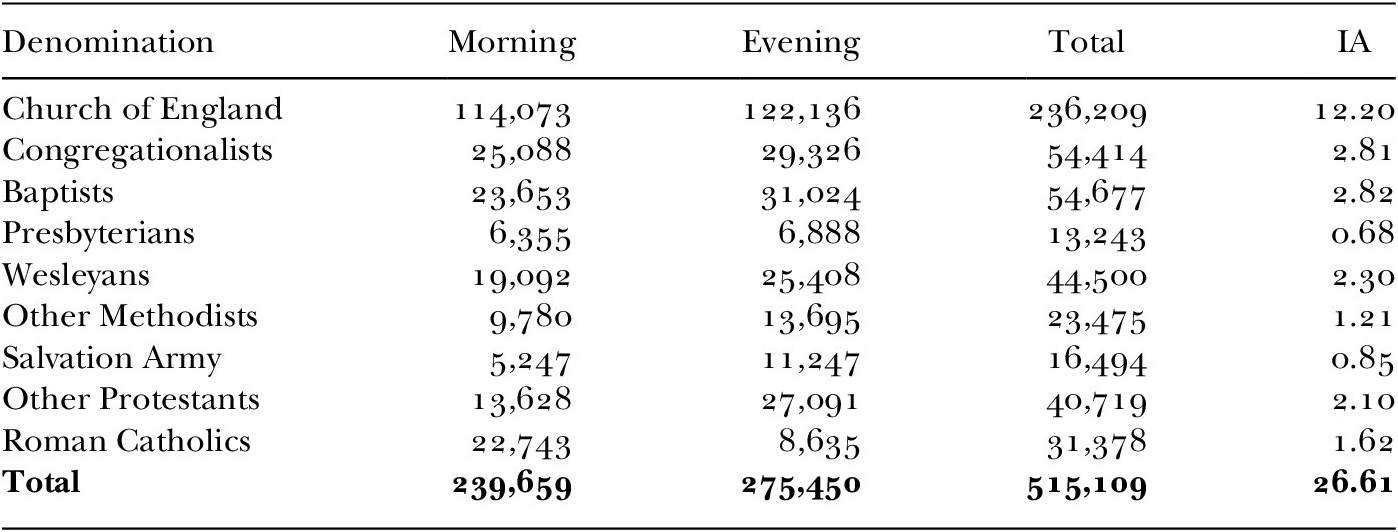
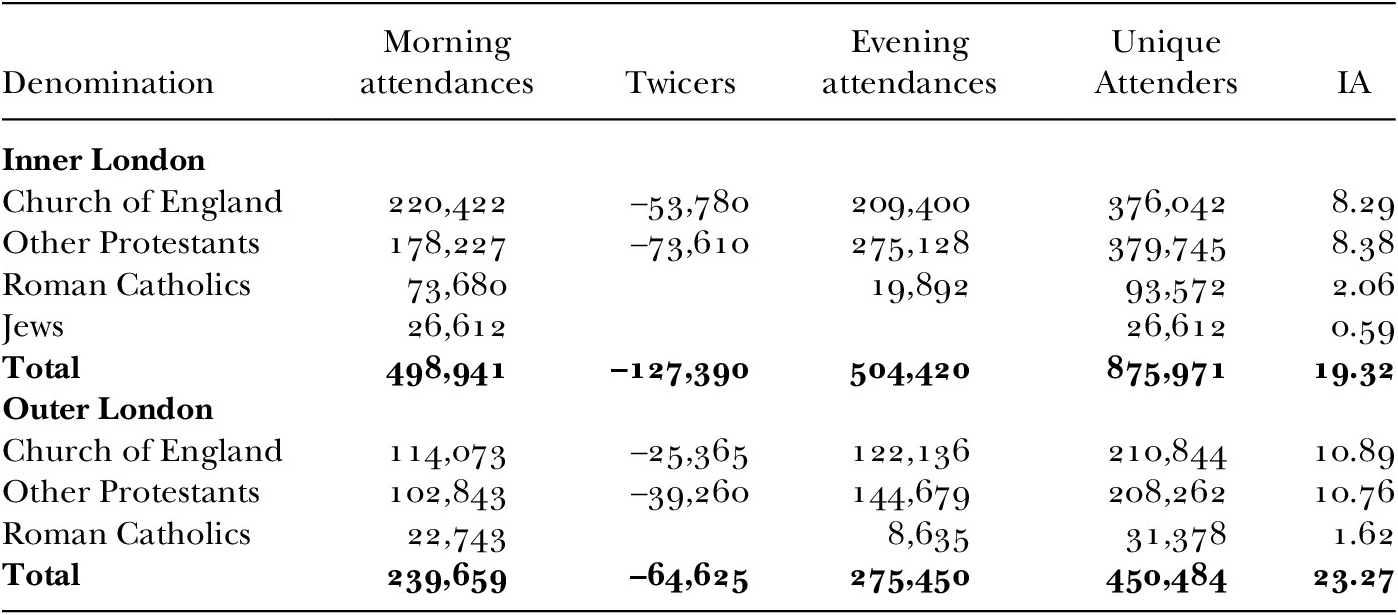
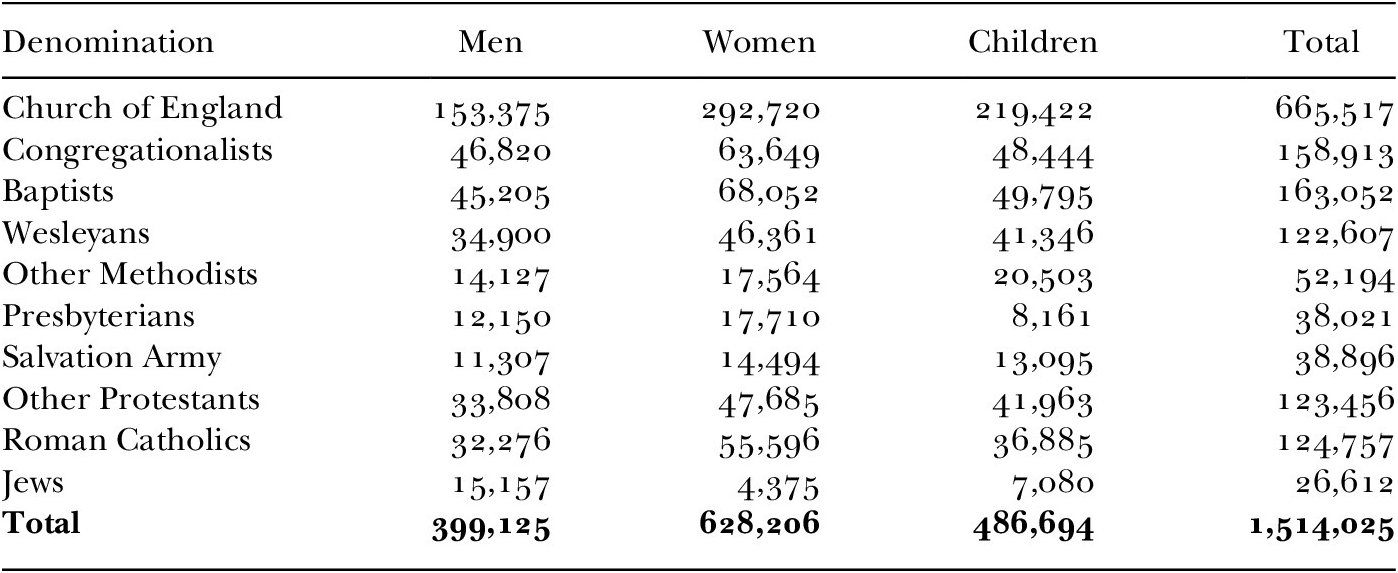
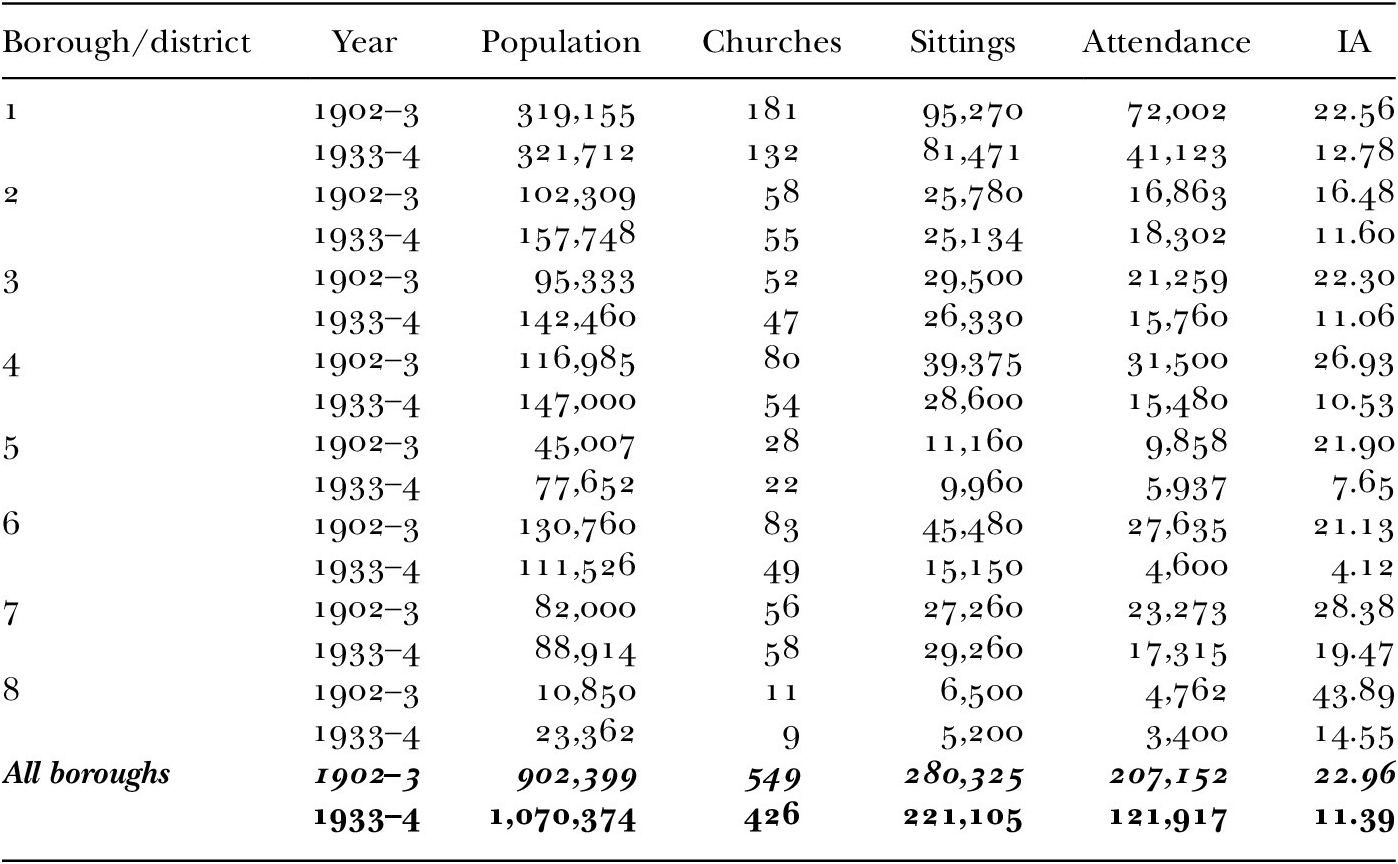
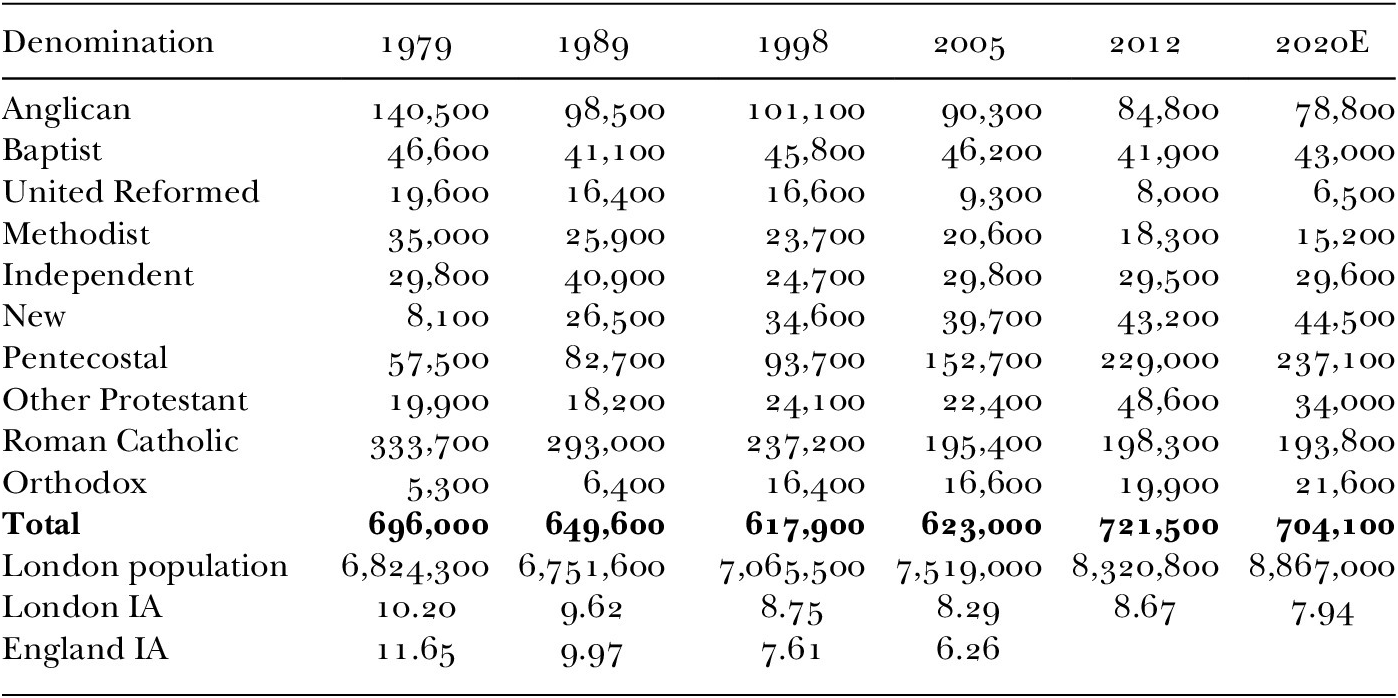
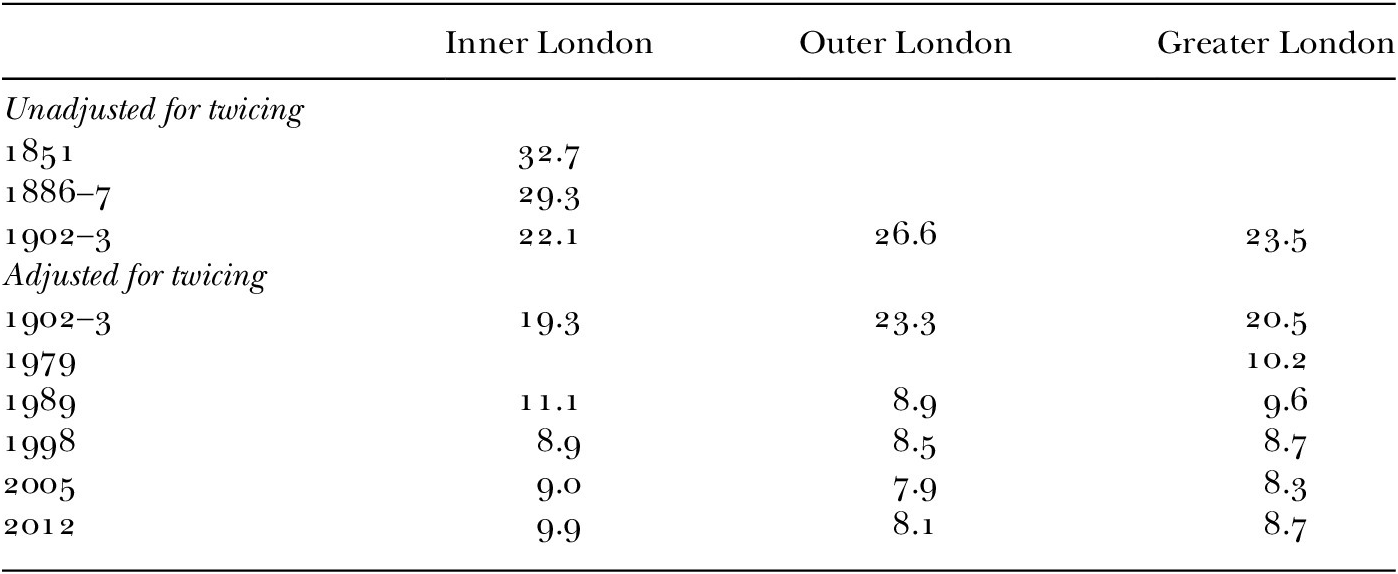
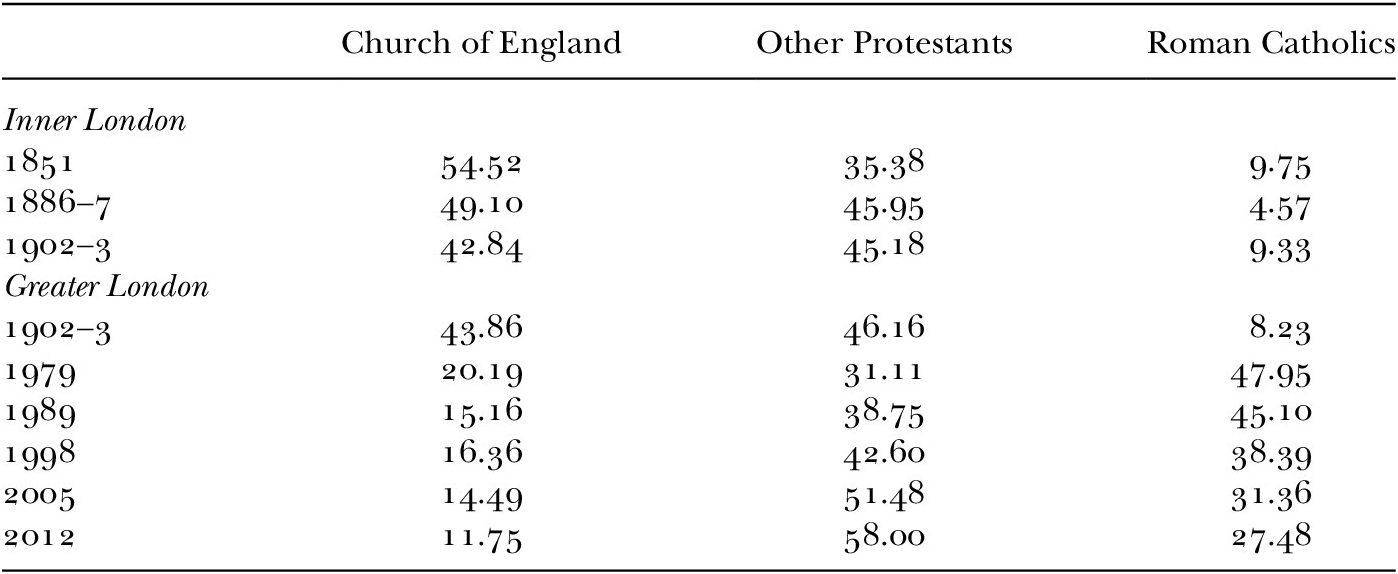
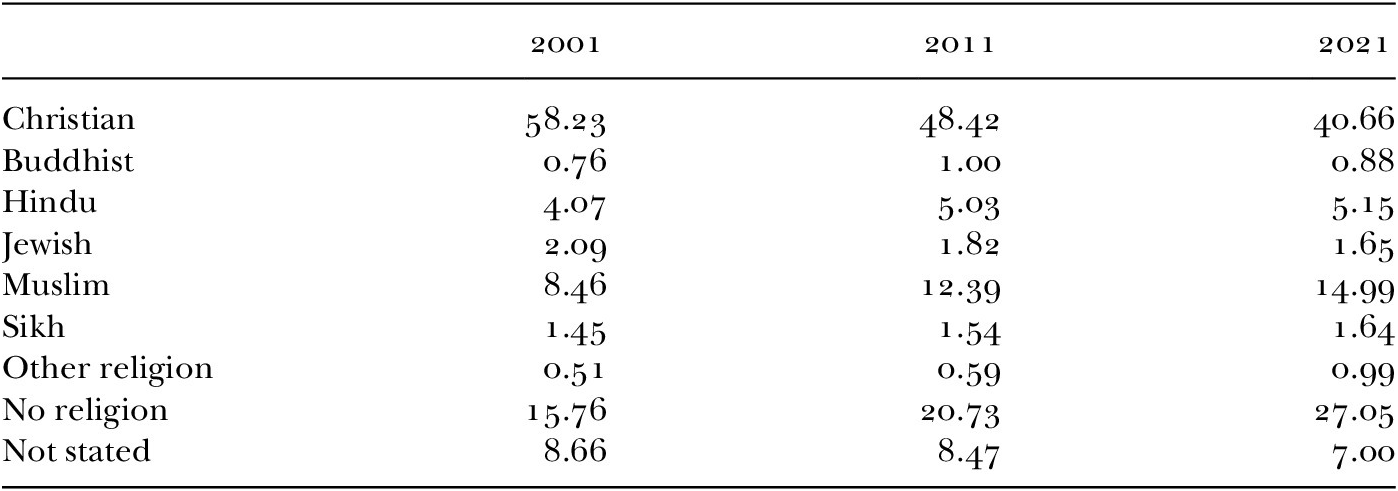

 Open access