

1 Introduction
Heuristics are shortcuts for making judgments and decisions. They provide a way to make decisions simply and quickly, based on limited information and uncertainty. One view, which we call the error view of heuristics, is that taking shortcuts often leads to inaccurate or illogical decisions (Reference Tversky and KahnemanTverskyKahneman, 1974). In this line of work, people’s decisions have consistently been shown to fall prey to logical fallacies or show irrational dependence on irrelevant information. Examples include the conjunction fallacy, the disjunction fallacy, and framing and order effects. This behavior is widely attributed to the use of heuristics such as representativeness, availability, and anchoring (Reference Anandarajan, Kleinnman and DanAnandarajan et al., 2008, Reference Newell, Lagnado and ShanksNewell et al., 2015, Reference PlousPlous, 2007).
A countering view, which we call the regularity view, is that heuristics are designed to take advantage of reliable environmental structures and can lead to fast and accurate decision making (Reference GigerenzerGigerenzer, 1996, Reference HoffrageHoffrage, 2019). This is the basis of the fast-and-frugal heuristics program, in which simple and robust decision heuristics, such as the recognition heuristic and take-the-best, lead to fast and accurate decisions and potentially outperform more complex decision strategies (Reference Gigerenzer and ToddGigerenzer et al., 1999, Reference Todd and GigerenzerToddGigerenzer, 2000). The key to the success of heuristics in this line of work is their alignment with the environment. For example, recognition works well as a basis for deciding which of two cities has the larger population because it is more likely people will be familiar with the name of an objectively larger city.
These different views of the role of heuristics in decision making lead to different understandings of how experts and novices use heuristics to make decisions. Under the error view, in which heuristics are error-prone shortcuts, inferior novice performance arises from their greater reliance on heuristics. For example, in the context of auditing, Reference Anandarajan, Kleinnman and Dan(Anandarajan et al., 2008), p. 360 argues that novices are more influenced by representativeness, availability, and anchoring, and this explains their inferior performance.
Under the regularity view, in contrast, part of what characterizes expertise in decision making is sensitivity to environmental regularities. Reference Shanteau(Shanteau, 1992), p. 82 argues that "[w]hat novices lack is the experience or ability to separate relevant information from irrelevant information sources. Thus, it is the type of information used — relevant vs. irrelevant — that distinguishes between experts and others.” The sensitivity of experts to the task environment, in turn, enables their use of heuristics. For example, the use of a fast-and-frugal heuristic like take-the-best depends on knowledge of the relevant cues and their validities. Thus, under the regularity view, the claim being made is the opposite one that experts perform better because they use heuristics.
Our goal is to study these two alternative theoretical perspectives using real-world decisions in the form of predictions about sporting events. In particular, we study expert and novice predictions for the 2017 American National Football League (NFL) season. One way to compare expert and novice behavior in this domain would be to model the decision processes they use. A good example of this approach is provided by Reference Garcia-Retamero and Dhami(Garcia-RetameroDhami, 2009), who examined expert and novice decision strategies in deciding which of two residential properties was more likely to be burgled. They found evidence that expert police officers used a non-compensatory take-the-best strategy, consistent with the regularity view. The empirical basis of this result, however, relied on characterizing residential properties in terms of eight pre-determined cues available to all decision makers in a controlled experiment.
Such an approach is not feasible for our goal of studying predictions of real-world sporting games. When choosing the winner of an NFL game, different people presumably use a variety of different sorts of cues, and the possible set of cues cannot be enumerated. Some cues are likely to be available to most or all decision makers, such as which team is the home team, which team has won more games, and so on. Other cues will vary by individual, such as which team is based in their home city, wears their favorite color, is supported by family and friends, and so on. Thus, trying to infer or model the details of the decision processes people use to predict NFL games is a difficult challenge.
Accordingly, we take a different approach towards understanding the nature of expertise as it relates to the use of heuristics. If the regularity view is correct, experts should be sensitive to environmental regularities that do have some objective relationship to the outcomes of games. For example, a well-studied regularity in sports is the home-team bias, also known as the home-team advantage (Reference Courneya and CarronCourneyaCarron, 1992, Reference Nevill and HolderNevillHolder, 1999, Reference Schnytzer and WeinbergSchnytzerWeinberg, 2008, Reference Vergin and ScriabinVerginScriabin, 1978). This is the “consistent finding that home teams in sporting competitions win over 50% of the games played under a balanced home and away schedule” (Reference Courneya and CarronCourneyaCarron, 1992, p. 13). Composite home team winning percentages from studies across the 1970–1990s, excluding ties, are reported to be 54% for baseball, 57% for football, 61% for ice hockey, 64% for basketball, and 69.0% for soccer (Reference Courneya and CarronCourneyaCarron, 1992). Within the NFL, home teams won 58% of their games between 1981 and 1996 (Reference Vergin and SosikVerginSosik, 1999). Given the existence of the home-team advantage, the regularity view would be that experts are aware of this environmental regularity and make predictions that are consistent with it. The alignment between expert predictions and the outcomes of games will then lead them to make more accurate predictions. Conceptually, this approach is closely related to the Brunswikian theory of probabilistic functionalism (e.g., Reference BrunswikBrunswik, 1952, see also (DhamiMumpower, 2018)). In that framework, expert use of cues like the home-team advantage in their predictions can be thought of as cue utilization, the impact of home-team status on game outcomes can be thought of as cue validity, and our aim is to study in the inter-relationships between these two patterns of correlation. In this way, measuring the sensitivity and calibration to environmental regularities between experts and novices provides a test of the basic assumptions of the regularity view of heuristics.
This approach could be used for any real-world decision domain. For example, in weather forecasting, the question would be whether expert predictions about days of precipitation matches the ground truth proportion of days that historically received precipitation. Our choice of a sporting prediction domain is motivated by the availability of both expert and novice predictions. It shares with other forecasting domains the ability to measure prediction accuracy because, once the game is played, the correct answer is known. Equally importantly, the ability to make accurate predictions about sporting outcomes has a significant basis in skill and knowledge rather than luck. This means it is possible for expertise to make a difference (Reference Lee and LeeLeeLee, 2017), but the task is difficult enough that perfect accuracy is impossible to achieve, which eliminates the possibility of ceiling effects (Reference Anandarajan, Kleinnman and DanAnandarajan et al., 2008).
The role of fast-and-frugal heuristics, especially the recognition heuristic, has previously been studied in making predictions about sporting outcomes. (Reference Serwe and FringsSerweFrings, 2006) compared the recognition heuristic to expert and novice predictions, as well as official rankings, in predicting the outcomes of tennis games. Reference Herzog and Hertwig(HerzogHertwig, 2011) compared the recognition heuristic to predictions based on official rankings and betting markets for soccer games and tennis matches. Reference Ayton, Önkal and McReynolds(Ayton et al., 2011) showed that Turkish participants, who knew relatively little about English soccer, often made predictions consistent with the recognition heuristic, and achieved a level of accuracy similar to more knowledgeable British participants. We are not aware, however, of previous studies that focused on expert and novice calibration to more general environmental regularities than recognition. Thus, we view our approach of studying people’s calibration with environmental regularities as occupying a useful niche between attempts to study detailed decision processes that use controlled experiments and studies of real-world predictions that consider only the environmental regularity of recognition.
In this article, we examine five sporting contest environmental regularities, including the home-team advantage, and assess how well expert and novice predictions are aligned with each. The structure of the article is as follows. We first describe our empirical data for the expert and novice predictions during the 2017 NFL season and the five environmental regularities. We then develop a signal detection model to test how consistent expert and novice predictions are with the regularities. Based on the model results, we discuss to what extent expert and novice predictions match the environmental regularities. We finish by discussing the implications of our findings for understanding how experts and novices differ in their sensitivity to environmental regularities, and the evidence this provides for and against the error and regularity views of heuristic decision making.
2 NFL prediction data
The NFL regular season involves 256 games played over 17 weeks, with each of the 32 teams playing 16 games and having one bye week. In the 2017 season, there were between 13 and 16 games played in each week, depending on how many teams had a scheduled bye-week.Footnote 1
2.1 Experts
Expert predictions were collected from the “NFL Straight Up Expert Picks” page on nflpickwatch.com, which collates predictions from various media sources, including a large number of human experts. The site did not report predictions for every human expert for every game. Only 26 made predictions for all 256 games, but 71 made predictions for 253 or more games. We use this subset of 71 human experts. Information about the NFL environment, including the home team, away team, and winning team for each game was also collected from nflpickwatch.com. We found demographic information about the gender of 64 of the experts and about the ages of 38 of the experts. Based on this information, about 90% of the experts are male and their average age is around 44 years old.
2.2 Novices
Our novice predictions come from data reported by Reference Lee, Danileiko and Vi(Lee et al., 2018). These predictions were collected from non-expert users on Amazon Mechanical Turk. 100 new participants were recruited each week and made predictions about every game to be played in the upcoming week. Thus, there are 1700 participants in total, each making between 13 and 16 predictions. About 67% of the participants were male and the most common age range was 25-to-34 years old.
2.3 Comparison of experts and novices
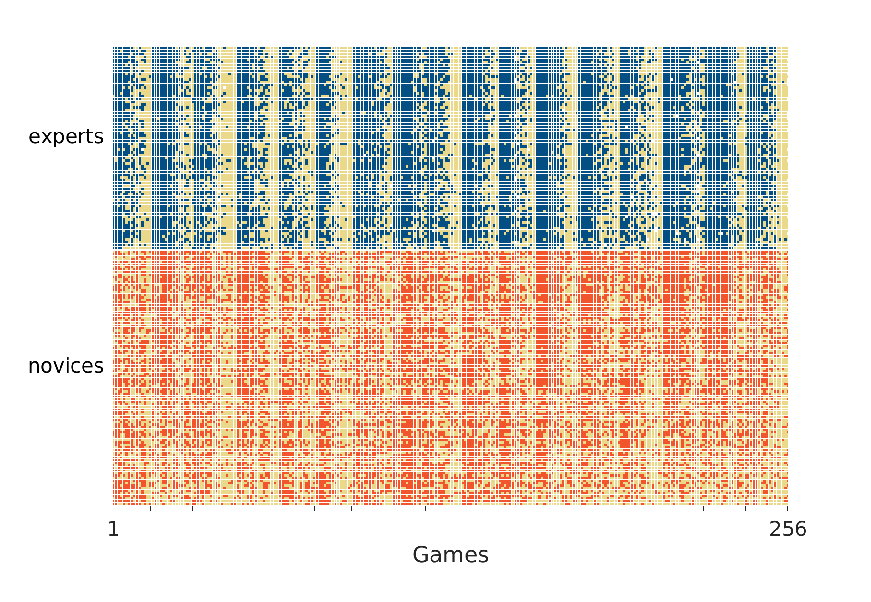
Figure 1 shows the accuracy of the expert and novice predictions for every game. The top panel corresponds to the experts. Each row represents one of the 71 experts and each column represents one of the 256 games. A blue square indicates that an expert predicted a game correctly while a yellow square indicates an incorrect prediction. The experts are ordered from most to least accurate from top to bottom. The games are ordered from left to right by the 17 weeks, with games within each week ordered from most to least accurately predicted from left to right.
The bottom panel of Figure 1 shows the accuracy of the novices, with red squares now indicating correct predictions. The games follow the same order used for experts. The novices are different from week to week, although they continue to be ordered in terms of accuracy within the week. Figure 1 clearly shows the variability in the accuracy of predictions for different games. In each week, some games are predicted correctly by almost every expert and novice, while some games are predicted incorrectly by almost everyone. It also seems clear that there is more variability in novice than expert accuracy and that the worst performing novices are less accurate than the worst performing experts.
The accuracy of expert (blue, top) and novice (red, bottom) predictions of each game for the 2017 NFL season. Blue and red squares indicate correctly predicted games while yellow squares indicate incorrect predictions. The experts and novices are ordered in decreasing overall accuracy from top to bottom. The games are ordered from left to right in terms of the 17 weeks in the season, and from most to least accurately predicted within each week.
As a basic test of the reasonableness of treating the media experts as experts and the Amazon Mechanical Turk participants as novices, Figure 2 shows the distribution of the number of games correctly predicted by each group. The accuracy of the 71 experts is shown in blue. Because the novices change from week to week, the distribution of their overall accuracy is based on creating artificial novices who predicted all games. This was done by aggregating the accuracies of one randomly chosen novice from each week. The distribution of these artificial novices is shown in red. Additionally, wisdom of the crowd performance, based on the majority prediction, is shown for both experts and novices by circular markers.
The distribution of the number of games correctly predicted for experts (blue) and novices (red). The novice distribution is based on many aggregations of randomly-chosen individual novices from each week. Wisdom of the crowd accuracies, based on taking the majority prediction, are also shown for experts and novices.

It is clear from Figure 2 that experts generally make more accurate predictions than novices. The mean number of games correctly predicted by experts is about 160 with a 5th percentile of 147 games and a 95th percentile of 172 games. A total of 59 of the 71 experts predict at least 155 games correctly. The distribution of aggregated novice accuracy, in contrast, has a mean of about 146 games, with a 5th percentile of 133 games and a 95th percentile of 158 games. The wisdom of the crowd accuracy, treating games for which predictions are tied as having chance accuracy, is 172 games for the experts and 158 games for the novices.
3 Five environmental regularities
We considered five environmental regularities in the context of predicting the outcomes of NFL games that could form the basis of heuristic decision making. The regularities were chosen because they seemed simple to apply, consistent with the possibility that they are relied upon by novices, but also had some potential systematic relationship to the outcomes of games, consistent with the possibility experts are well calibrated to the regularity. The first three regularities are well justified by previous literature, while the final two are more exploratory.
3.1 Home team
As mentioned earlier, the finding that the home team wins more often is well studied and often called the home-team bias or home-team advantage (Reference Courneya and CarronCourneyaCarron, 1992, Reference Nevill and HolderNevillHolder, 1999, Reference Vergin and SosikVerginSosik, 1999). A heuristic based on this regularity simply involves choosing the home team as the predicted winner. In principle, every NFL game has an unambiguous home team and away team, so this heuristic can be applied to all 256 games. One complication for the 2017 season is that there were five international games — four in London and one in Mexico City — for which the home team assignment is more arbitrary. We decided to include these games because the contractual basis of the international series means that it is often the case that the home team has more experience playing at the venue. Overall, the home team won 140 of the 256 games.
3.2 Win-loss
There is evidence that teams who have better win-loss records leading into a game are more likely to win that game. A win-loss heuristic based on this regularity simply chooses the team with the better win-loss record. In our data, there are 187 games for which one team has a better win-loss record than their opponent. In the other 69 games, both teams have the same win-loss record. In 116 out of the 187 games where a win-loss heuristic could be applied, the team with the better win-loss record won. The win-loss record, a factor in determining the power scores published in The New York Times is an informative predictor for the outcome of NFL games (Reference Boulier and SteklerBoulierStekler, 2003). Furthermore, different investigations into betting strategies for NFL games have found that betting on the strongest team according to the previous week’s performance appears to be a profitable one (Reference Vergin and ScriabinVerginScriabin, 1978).
3.3 Consensus
The basic finding of the wisdom of the crowd literature is that the aggregate of individual behavior can often form accurate group decisions (Reference SurowieckiSurowiecki, 2004). In the context of predicting NFL games, this finding means that the majority (mode) of individual predictions is expected to make accurate predictions. Reference Lee, Danileiko and Vi(Lee et al., 2018) and Reference Rutchick, Ross, Calvillo and Mesick(Rutchick et al., 2020) studied majority predictions for NFL games and found accuracies of 67% and 54%, respectively. We operationalize the consensus idea by using the majority prediction of all available sources on nflpickwatch.com, which represents publicly available consolidated media opinion. There was never a tie in these consensus predictions, so the heuristic could be applied to all 256 games. It makes the correct prediction for 172 games, which corresponds to 67% accuracy.
We note that the consensus regularity is a little different from the others we considered. It is based on social information from the opinions of other people, rather than the location or outcomes of games. We think people are sensitive to both social and non-social information in making predictions, so it makes sense to include both sorts of environmental information. It is also possible that differences between experts and novices may relate to their calibration with social versus non-social information.
3.4 Surprise win
A more novel and exploratory possible basis for a regularity is that unexpected results in the previous week inform the predictions of current games. The surprise win heuristic assumes that if one of the two teams playing a game had a surprise win in their previous game, operationally defined as one the consensus majority of media experts did not predict, then that team is more likely to win. Psychologically, surprise wins can be thought of as a prominent cue for a change in the team’s performance, and potentially a signal for the beginning of a winning streak. The use of a surprise win heuristic is consistent with research on people’s belief in the “hot hand” in basketball (Reference Bar-Eli, Avugos and RaabBar-Eli et al., 2006, Reference Gilovich, Vallone and TverskyGilovich et al., 1985). The parallel comes from how both involve people perceiving strong structure in what may be a series of near-independent random outcomes.
The surprise win heuristic only applies when one team had a surprise win the week before and the other team did not. In our data, there are 64 games that meet these conditions, but the team with the earlier surprise win won only 32 of these games. This suggests that the surprise win notion may not represent an environmental regularity, and certainly it is not evident in the current data. Accordingly, maintaining the surprise win as a potential heuristic provides a test of our analysis in terms of measuring expert and novice behavior when there potentially is no useful environmental regularity.
3.5 Surprise loss
The surprise loss regularity is the complement of the surprise win regularity. It applies in the situation where just one of the two teams playing had a surprise loss in their previous game. Once again, surprise losses are defined by media consensus. We assume a surprise loss heuristic involves predicting the team with the preceding surprise loss will lose again.
In our data, there are 54 games that meet these conditions, and the team with the earlier surprise win won 24 of these games. As with the surprise win outcome, this finding argues against the surprise loss heuristic. It may even provide weak support for an alternative interpretation, in which a team that has a surprise loss in the previous week “bounces back” to perform better in the next game. Once again, we maintain the surprise loss in our analyses to measure expert and novice prediction behavior for a potential heuristic that is not supported by an environmental regularity.
4 Signal Detection Theory analysis
Our goal is to understand the extent to which experts and novices make decisions consistent with the five environmental regularities. One way to measure this consistency is simply by counting how often individuals make the same predictions as the heuristics. Such an analysis, however, would ignore the different levels of difficulty and consensus across games observed in Figure 1. To appreciate the need to allow for this variability, consider predictions relative to the home-team heuristic. If the home team is the clear favorite and an individual predicts that team as the winner, their prediction provides relatively little evidence that they make decisions that are biased in favor of the home team. Their decision is consistent with any mechanism that leads to predicting an obvious winner. However, if there is no clear consensus, or if the consensus is that the away team will win, then an individual’s prediction of the home team provides much stronger evidence for being biased in favor of the home team. Thus, the same level of observed agreement carries different levels of evidence in terms of biases that match environmental regularities.
4.1 SDT framework
To allow for different game prediction difficulties and types of consensus, we use a signal detection theory (SDT) framework for analysis (Reference MacMillan and CreelmanMacMillanCreelman, 2004). SDT provides a useful framework for studying simple decisions and has been successfully applied to the study of classic predictions tasks such as weather forecasting (e.g., Reference Harvey, Hammond, Lusk and MrossHarvey Jr et al., 1992), as well as applied tasks such as medical decision making (e.g., Reference Cheyne, Dalgleish, Tucker, Kane, Shetty, McLeod and NivenCheyne et al., 2012, Reference Kostopoulou, Nurek, Cantarella, Okoli, Fiorentino and DelaneyKostopoulou et al., 2019, Reference Mumpower and McClellandMumpowerMcClelland, 2014). Some of these studies consider expertise, such as Reference Cheyne, Dalgleish, Tucker, Kane, Shetty, McLeod and Niven(Cheyne et al., 2012) who used SDT to study the differences between experts and non-experts in making medical decisions about patient transfer.
Our application of the SDT framework is demonstrated in Figure 3. The basic idea is to associate the signal distribution with the team predicted by a heuristic. Figure 3 uses the concrete example of the home-team heuristic, so the signal distribution is the home team and the noise distribution is the away team. As is always the case in SDT, decisions are made based on the probability a mental sample from the “true” distribution is greater than a decision criterion. Since the decision goal is to make accurate predictions, the true distribution is the team that actually won the game. Thus, the SDT analysis assumes a mental sample is drawn from either the signal distribution or the noise distribution, depending on which team won the game. The use of distributions represents the uncertainty inherent in making predictions and allows for a probabilistic account of people’s decisions. The probability the prediction will be the team corresponding to the signal distribution (i.e., the team consistent with the heuristic) is the probability the mental sample is greater than the decision criterion.
Signal detection theory (SDT) framework for analyzing the consistency of predictions with environmental regularities. The left panel corresponds to a game that is relatively easy to predict, with a larger discriminability d ′, while the right panel corresponds to a game that is more difficult to predict with a smaller d ′. In both cases, the concrete example of the home-team regularity is used, with the signal distribution representing the home team and the noise distribution representing the away team. The probability of choosing the home team is the probability that a sample from the winning team distribution falls above a threshold k, which depends on the bias c of the individual decision maker.

Under this framework, the difficulty of predicting the outcome of a game is naturally represented by the discriminability d ′, which is the difference between the means of the distributions. For games that are easy to predict accurately the d ′ will be large and positive, with the signal distribution well separated from the noise distribution. For more difficult games d ′ will be small, so that the two distributions overlap. For games that are very difficult to predict accurately, d ′ will be large and negative, Note that, unlike many applications of SDT in which accuracy rarely falls below chance, large negative discriminabilities are not just possible in this application, but are quite common. They occur for games that a large majority of people predict incorrectly. Figure 1 shows that there are many of these games.
Meanwhile, the tendency of an individual to be sensitive to a regularity is naturally represented by the bias c. This is the offset of the criterion k from the unbiased criterion of 1/2d ′. If the bias is negative, it is more likely the team corresponding to the signal distribution will be chosen, indicating predictions that are consistent with a regularity. In this sense, the name “bias” is potentially misleading since it often implies sub-optimality, even though that is not necessarily the case in this application. If the NFL environment is biased towards, for example, home teams winning more often, then it is appropriate for individuals to make predictions that match the bias. The bias parameter in SDT is routinely used in this sort of context, such as in cases where signal and noise stimuli are presented with different frequencies (Reference Abdi and SalkindAbdi, 2007), which is exactly the situation that the environmental regularities create. Thus, the more nuanced interpretation of bias applies in considering how people make decisions relative to environmental regularities. Accordingly, the differences between experts and novices that we are interested in should be reflected by different levels of bias.
The two panels in Figure 3 demonstrate the logic of the SDT analysis using concrete examples involving the predictions made by the same expert for two different games. The left panel shows the week 1 game between the Buffalo Bills and the New York Jets. A large majority, 69 of the 71 experts, correctly predicted the home team (Bills) to win. This means that the d ′ is large and positive, reflecting a game that was easy to predict correctly. The right panel shows the week 1 game between the Washington Football Team and the Philadelphia Eagles. A much smaller majority, 43 out of 71 experts, correctly predicted the away team (Eagles) to win. This means that the d ′ is also positive but smaller. There is less separation between the distributions representing the home and away teams for this more difficult game.
The bias c is a property of the individual decision maker and so is the same for both games. The expert whose bias is shown in Figure 3 predicted the home team to win in 157 out of the 255 games for which they made predictions. This corresponds to more than 60% home team predictions, consistent with a bias towards choosing the home team. Their bias, however, influences the probability of choosing the home team differently in games that are relatively easy or hard to predict. This is because the same bias c generates different criteria k with respect to the different d ′ values. For the easy Bills versus Jets game on the left, the bias has relatively little impact, because the distributions are well separated. Since the home team (Bills) won, the mental sample is drawn from the signal distribution, and would likely be greater than the criterion k whether or not the bias c was applied to the neutral criterion of 1/2d ′. For the more difficult Washington versus Eagles game on the right, however, the bias does have an impact, because the distributions overlap. Since the away team (Eagles) won, the mental sample is drawn from the noise distribution. With the bias c applied, there is close to a 50% probability the expert will nonetheless predict the home team (Washington) to win, because the resulting criterion k is near the median of the gray distribution. There is a near 50% probability a mental sample from the noise distribution will be greater than the criterion. This is, in fact, what occurred in the data: the expert incorrectly predicted the home team Washington to win this game.
4.2 Model specification
Formally, we denote the prediction made by the ith individual
for the jth game as ![]() = 1 if they predicted the
“signal” team relative to the hth heuristic, and
= 1 if they predicted the
“signal” team relative to the hth heuristic, and
![]() = 0 if they predicted the
“noise” team. Thus,
= 0 if they predicted the
“noise” team. Thus, ![]() indicates whether or not the
ith individual made a prediction consistent with a
hth heuristic for the jth game. We denote
indicates whether or not the
ith individual made a prediction consistent with a
hth heuristic for the jth game. We denote
![]() = 1 if the signal team wins the
game and
= 1 if the signal team wins the
game and ![]() = 0 if they lose. Thus,
= 0 if they lose. Thus,
![]() indicates whether the team
predicted by the hth heuristic won the jth
game. The discriminability of the jth game is
indicates whether the team
predicted by the hth heuristic won the jth
game. The discriminability of the jth game is ![]() , and the
bias of the ith individual is
c i. Given these
assumptions, the predictions are modeled using standard SDT results as
, and the
bias of the ith individual is
c i. Given these
assumptions, the predictions are modeled using standard SDT results as
We assume that the discriminabilities of all of the games are independent, and
they are each given the prior ![]() ∼Gaussian(0,1/32). We parameterize the
Gaussian distribution in terms of its mean and precision, consistent with the
JAGS software we use, so this prior corresponds to a mean of 0 and a standard
deviation of 3. The prior has a 95% credible interval from approximately -6 to
+6 as a range of plausible values for the discriminabilities of games. This is
an appropriately wide range, given the possibility that some games may be easy
or hard enough that they lead to near-unanimously correct or incorrect
predictions.
∼Gaussian(0,1/32). We parameterize the
Gaussian distribution in terms of its mean and precision, consistent with the
JAGS software we use, so this prior corresponds to a mean of 0 and a standard
deviation of 3. The prior has a 95% credible interval from approximately -6 to
+6 as a range of plausible values for the discriminabilities of games. This is
an appropriately wide range, given the possibility that some games may be easy
or hard enough that they lead to near-unanimously correct or incorrect
predictions.
The criteria are modeled using the hierarchical latent-trait approach developed by Reference Klauer(Klauer, 2010). This provides a way of linking the level of bias for the same individual across the five heuristics and allows for inferences about the correlations between them. For example, it allows an assessment of whether or not individuals who tend to make predictions consistent with the home-team heuristic also make predictions consistent with the media consensus. Formally, the five bias parameters are sampled jointly from a multivariate Gaussian:
where µh∼Gaussian(0,1/32) and Σ−1∼Wishart(I n,n+1), for n=5 heuristics, where I n is the n× n identity matrix. This means that
is the correlation between the hth and h ′th heuristics. The implied prior for these correlations is ρh,h ′∼uniform(−1,+1).
Finally, we considered the posterior representative distribution (Reference Lee, Bock, Cushman and ShankleLee et al., 2020)
which does not involve a subscript for the ih individual, but instead corresponds to a “representative” or “random” individual among the group being modeled. By applying the model separately to the expert and novice data, the posterior representative distribution provides a characterization of a generic expert or novice based on the behavior of the actual experts and novices who made predictions.
We implemented the SDT model as a probabilistic graphical model in JAGS (Reference Plummer, Hornik, Leisch and ZeileisPlummer, 2003) to facilitate
computational Bayesian analysis. The JAGS script is provided in the
supplementary information. All of the results reported in this article are based
on 8 independent chains with 5000 samples each. We discarded 2000 initial
burn-in samples for the expert data and 10,000 for the novice data. For both
data sets we used thinning by collecting the 10th sample of every chain.
Convergence was assessed by visual inspection and using the standard
![]() metric (Reference Brooks and GelmanBrooksGelman, 1997).
metric (Reference Brooks and GelmanBrooksGelman, 1997).
5 Results
Often inferences about discriminability are the key results in SDT analyses. In the current analysis however, as for other studies focused on the bias in decisions (e.g. Reference Kostopoulou, Nurek, Cantarella, Okoli, Fiorentino and DelaneyKostopoulou et al., 2019), they are nuisance parameters that exist to improve the measurement of bias. For the 71 experts, individual inferences about the level of bias for each of the environmental regularities are useful, as is the posterior representative inference. For the 1700 novices, individual-level inferences are not very useful because each individual made predictions for at most 16 games. The posterior representative inference for novices continues to be useful and provides a natural mechanism for comparing experts and novices.
5.1 Experts
Figure 4 shows the inferences for the biases of the experts. The top panel shows the inferred posterior representative distribution for each heuristic. The bottom panel shows the 95% credible intervals and the posterior mean of the inferred bias for each heuristic for each expert. The dotted lines in all panels show a zero value of bias.
Inferences about the biases of experts. The top panel shows the posterior representative distribution for each heuristic. The bottom panel shows the 95% credible intervals and posterior mean for each of the experts, ordered from most to least accurate from top to bottom.
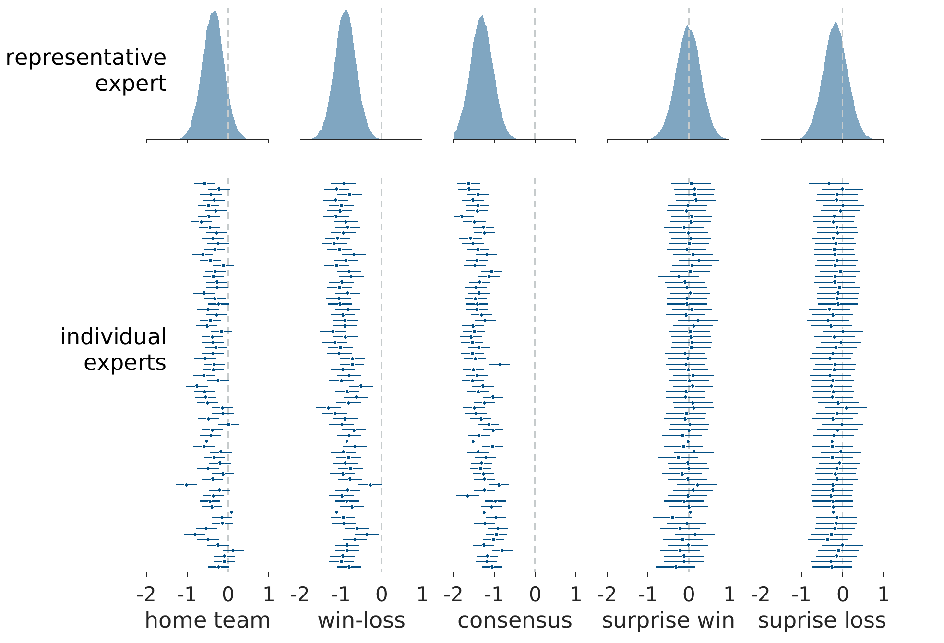
It is clear that most of the individual experts show some bias consistent with the home-team regularity, and the representative expert reflects this bias. The negative biases are consistent with a tendency to favor predicting the home team, in accord with the environmental regularity. The same pattern of individual and representative bias can be seen, even more strongly, for the win-loss and consensus heuristics. For these regularities, every individual expert shows a bias toward favoring the team with the better win-loss record and the team with media consensus. The results for the surprise win and surprise loss heuristics show a different pattern. There is no evidence of any expert making decisions consistent with the idea of surprise wins or losses, and this is reflected in the representative expert inferences.
5.2 Comparison of experts and novices
Figure 5 shows the posterior representative distributions for both experts and novices for all five heuristics, and their correspondence with prediction accuracy. The expert posterior representative distributions in the bottom panel are the same as those shown in Figure 4. The addition of the novice posterior representative distributions allow for direct comparison to those of the experts. For the home-team, win-loss, and consensus heuristics, the representative novice distributions all show some bias in favor of the regularity, but the extent of this bias is much smaller than for the representative expert. For the surprise win and surprise loss heuristics, the expert and novice representative distributions are very similar, and neither shows evidence of bias. Overall, these comparisons provide evidence that experts and novices differ in the biases reflected in their predictions for the three well-justified environmental regularities.
Expert and novice biases for the five heuristics and their correspondence with prediction accuracy. The bottom panel shows the posterior representative distributions for experts (blue) and novices (red). The curved lines in the upper panel show, for experts (blue) and novices (red), the number of games correctly predicted for different values of bias. The vertical lines show the value of bias that maximizes the number of correct predictions. Dashed lines in all panels show zero value of bias.
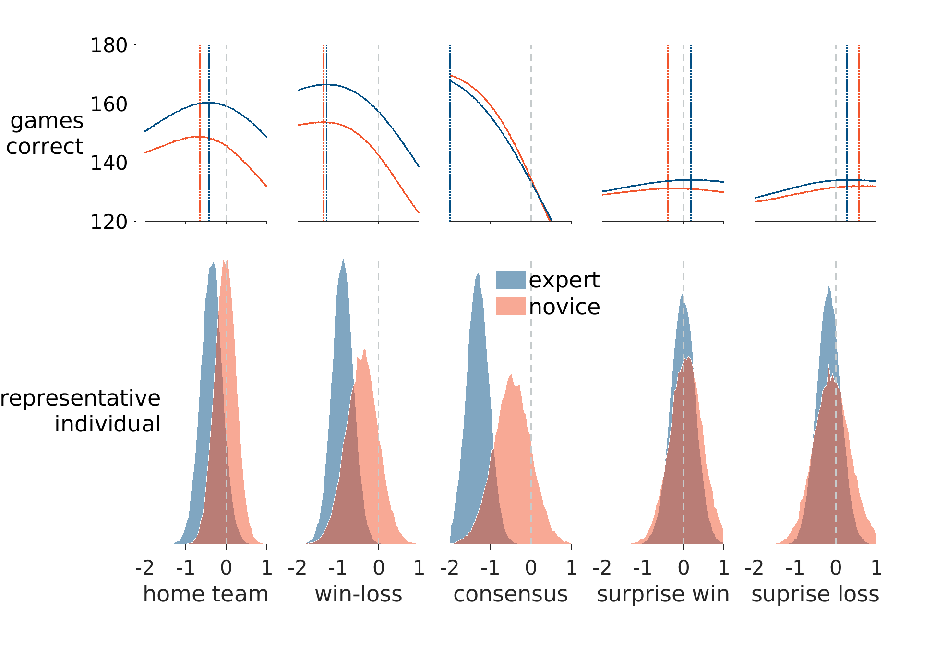
The upper panel in Figure 5 shows how different possible values of bias lead to different levels of prediction accuracy. The curved lines show how many games are correctly predicted if only the heuristic was used to make predictions and a specific bias value was used. Once again, chance accuracy was assumed for the games for which a heuristic does not make a prediction. These accuracies are different for the experts and novices because of their different discriminabilities for the games. Intuitively, experts are better able to separate the two teams playing, and so make more accurate predictions for the level of same decision bias. The important feature of the curves is that, for the home-team, win-loss, and consensus heuristics, they show accuracy increasing as some level of bias is used. This reflects the existence of the environmental regularities. For example, because home teams really do win more often, predictions are more accurate if there is at least some bias toward choosing them. For these heuristics, the level of bias inferred for the representative expert closely aligns with the maximization of prediction accuracy, whereas the representative novice distributions correspond to less prediction accuracy than is possible. These differences are especially impactful for the win-loss and consensus heuristics because the differences between the levels of bias for experts and novices correspond to a change in accuracy of more than 10 games.
For the surprise win and surprise loss heuristics, the overall levels of accuracy are lower because the heuristics make predictions for fewer games, and there is little change in accuracy for different levels of bias. This suggests that surprise wins and losses convey limited information to help in making predictions more accurate. This corresponds to what is called low task predictability in Lens model analysis (Reference Hammond, Hursch and ToddHammond et al., 1964, Reference Dhami and MumpowerDhamiMumpower, 2018). Both the representative expert and novice distributions are aligned with levels of bias that are about as well-performed as these heuristics can achieve.
Overall the results comparing expert and novice biases show that experts are sensitive to the three strong regularities in the environment, relating to the home-team advantage, the teams’ win-loss records, and media consensus. Most individual experts show clear biases that lead to predictions consistent with these regularities, and many show near-optimal levels of bias, in terms of maximizing prediction accuracy under the constraints of each heuristic and the difficulty of predicting games. Novices, in contrast, show almost no sensitivity to the home-team advantage and relatively little sensitivity to the win-loss records and media consensus. The representative novice has levels of bias that are far from optimal for the win-loss and consensus regularities.
5.3 Individual differences
The correlations between the levels of bias individuals use for the different regularities provides insights into individual differences. Table 1 shows the posterior mean correlations between each pair of regularities for both experts and novices. Correlations that correspond to strong evidence in favor of a significant difference, as measured by a Bayes factor greater than 100, are shown in bold.
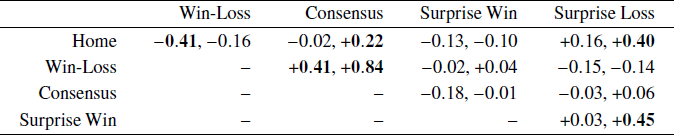
Experts show two significant correlations between home team and win-loss and between consensus and win-loss. The negative correlation between home team and win-loss suggests experts vary in how they trade-off these two competing biases. Since home teams are fixed by the season schedule, they are not related to which team has the better win-loss record, and the two heuristics often make competing predictions. In our data the home-team and win-loss heuristics make the same prediction for 95 of the 187 games for which they both make predictions.Footnote 2 The -0.41 correlation for experts suggests that some emphasize the home-team advantage while others emphasize the win-loss record in making their predictions. The positive correlation between consensus and win-loss, meanwhile, is better interpreted as an individual difference in adhering to the accepted wisdom. It is often the case that the media consensus agrees with the team with the better win-loss record. In our data, they agree for 160 of the 187 games for which they both made predictions. The 0.44 correlation suggests that some experts follow these compatible indicators in making their predictions, while others are more willing to predict against conventional wisdom.
The same interpretation could be applied to the 0.84 correlation between consensus and win-loss for novices, but we think a different interpretation is more plausible. The subset of experts who do not follow the consensus and the teams’ win-loss records is naturally interpreted as deliberately predicting against conventional wisdom, perhaps making newsworthy “dark horse” predictions. The subset of novices who do not follow the consensus and the teams’ win-loss record is probably better interpreted as simply being ignorant of the accepted wisdom. That is, the key difference between novices is that some are aware of previous results and the media opinion but others are not. These individual differences are consistent with both the correlations in Table 1 and the small levels of bias the representative novice has for the win-loss and consensus regularities, as seen in Figure 2. Many novices have near-zero levels of bias while others show some level of bias in favor of the win-loss and consensus regularities, and the net effect is that novices show sub-optimally small levels of bias overall.
Finally, the novice correlations involving the surprise loss regularity are more difficult to interpret. A tentative account is that they are related to the two different interpretations of a surprise loss discussed earlier. One interpretation is that a surprise loss indicates a “loss of form” and leads to the prediction that the team will continue losing. The other interpretation is that teams that suffer surprise losses “bounce back” the next week or simply regress back to their mean level of performance, which does not lead to a prediction of losing. It is possible different subsets of novices subscribe to these alternate views, creating correlation of surprise loss with other regularities.
6 Discussion
We found evidence that the outcomes of NFL games favor the home team, the team with the better win-loss record, and the team that consensus media opinion believes will win. We did not find evidence that surprising outcomes of the previous game had a systematic effect on the outcome of the next game. Thus, the home-team, win-loss, and consensus regularities potentially support simple and accurate heuristics for making predictions. We found evidence that experts are near-optimal in the extent of their sensitivity to these regularities. Novices, in contrast, showed less than optimal sensitivity. The sensitivity of experts is consistent with the regularity view that simple heuristics can make fast, robust, and accurate predictions. In contrast, the surprise win and surprise loss regularities appeared to provide little evidence that they would form the basis of useful heuristics for making predictions. Both experts and novices were well calibrated to this lack of information. Different biases for these regularities have little impact on prediction accuracy. It is impossible to know, however, whether this calibration is based on knowing previous results have little impact or simply being ignorant of previous results.
More speculatively, we also found interesting patterns of individual differences among experts and novices. Experts possibly differ in how they balance the often competing predictions of choosing the home team or the one with the better win-loss record. It may also be the case that some experts are more willing than others to predict against accepted wisdom as this might draw desirable attention to their unique predictions and help meet goals beyond prediction accuracy, such as increasing their media profile. Novices seem more likely to differ in terms of how much relevant knowledge they have, such as whether they are aware of the previous performance of teams or the media opinion about the current game.
Our results are based on only one NFL season, and it would be worthwhile testing how well they are replicated for other seasons. In addition, there are no major obvious differences between predicting NFL games and games from other sports, aside from the variability in how predictable outcomes are, so it would also be interesting to test the generalizability of our findings beyond professional football in the NFL. All five of the environmental regularities we considered are applicable to most sports, and some, like the home-team advantage, are well studied in baseball, ice hockey, basketball, and soccer (Reference Courneya and CarronCourneyaCarron, 1992).
Beyond sport, our model-based approach is well-suited to domains that have high learnability, in the sense that they provide regular feedback. Expertise has been studied in a number these domains, including weather forecasting, medical decision making, bridge, race handicapping, horse betting, and banking (Reference Bolger and WrightBolgerWright, 1994). For example, the ability of weather forecasters to make predictions about temperatures and the probability of precipitation have been studied in terms of cues like the previous day’s temperature, cloud thickness, and the presence of snow on the ground (Reference Stewart, Roebber and BosartStewart et al., 1997). Weather forecasters are observed to be well calibrated in these predictions and our model potentially provides a way to quantify the match between cues and environments that underlie this expertise (Reference Koehler, Brenner, Griffin, Gilovich, Griffin and KahnemanKoehler et al., 2002). Similarly, evaluating whether symptoms like coughing are prognostically relevant to making hospitalization decisions or prescribing antibiotics provides a way to investigate how well those environmental cues are attended to by medical professionals (Reference Nurek, Delaney and KostopoulouNurek et al., 2020).
For the domains in which it can be applied, we believe the model has potential application as an assessment and training tool for developing expertise. It is able to infer the extent to which individual predictions match environmental regularities and the impact of the alignment or misalignment on prediction accuracy. Because the regularities are simple to express and understand, it should also be possible to give meaningful feedback to help individuals improve their predictions. For example, a person who is told that they make predictions in favor of the home team too often could presumably use this information to improve their prediction accuracy by adjusting their predictions accordingly.
A limitation of our model is that we did not allow for learning or adaptation in predictions. This is likely to be important in both sporting and non-sporting domains. Future work should attempt to extend the model to allow for changes in bias over time. These extensions would preferably be based on a psychological theory of learning or adaptation, but could also be achieved statistically by, for example, allowing bias to change hierarchically over the course of a season. The current data are also not well suited for studying learning. Each novice only made a small number of predictions that were confined to be within one week, which restricts the ability to understand the detailed structure of the individual differences between them. We think it is appropriate to limit novices in this way because a “novice” willing to make predictions about an entire season may well have some significant amount of expertise. There are certainly sports fans who have as much knowledge of the NFL as the media pundits we used as experts. But in our current analysis, it is hard to make detailed claims about individual novices and, due to the lack of week-by-week predictions, it is obviously not possible to examine whether they learned over the course of the season. Reference Bingham and Eisenhardt(BinghamEisenhardt, 2011), p. 1456 argue that “replacing superficial heuristics with higher-quality ones (i.e., more strategic, abstract, and precise) again resembles the transition from novice to expert.” An extended model and different data would be needed to study this account of the development of expertise.
Finally, an ambitious cognitive modeling goal is to understand the decision processes that lead to predictions. As we mentioned earlier, an issue for this modeling is to what extent simple environmental regularities are sufficient for predictions (Reference DubbsDubbs, 2018). Our model does not attempt to gain insight into this detailed understanding, instead focusing on whether predictions are consistent with environmental regularities. A number of elements of the model, however, lay the groundwork for a model of decision making. How individuals weigh and combine cues like who is the home team, who has the better win-loss record, and so on, is an interesting challenge for future research. Such a model could provide deeper insight into the differences between expert and novice predictions of sporting outcomes.


 Open access