


1. Introduction
Subglacial water is stored and transported in a system that varies in form both spatially and temporally (Sharp and others, Reference Sharp1993; Hubbard and others, Reference Hubbard, Sharp, Willis, Nielsen and Smart1995; Nienow and others, Reference Nienow, Sharp and Willis1998; Schoof, Reference Schoof2010; Bartholomew and others, Reference Bartholomew2012; Meierbachtol and others, Reference Meierbachtol, Harper and Humphrey2013; Andrews and others, Reference Andrews2014; Chandler and others, Reference Chandler2021). The general direction of travel is towards the ice margin, along the hydraulic potential gradient imposed by the ice surface slope and altered by bed elevation (Shreve, Reference Shreve1972). The hydraulic potential gradient determines the route water takes, with storage also occurring in subglacial lakes (e.g. Dowdeswell and Siegert, Reference Dowdeswell and Siegert1999; Bell and others, Reference Bell, Studinger, Shuman, Fahnestock and Joughin2007; Bowling and others, Reference Bowling, Livingstone, Sole and Chu2019; Livingstone and others, Reference Livingstone2022). On hard (rock) beds, the subglacial hydraulic system is traditionally envisioned in two ways: (1) distributed drainage via a series of cavities between which water slowly moves (Lliboutry, Reference Lliboutry1979; Kamb, Reference Kamb1987) or (2) channelised drainage with water flow concentrated into channels either cut into the overlying ice (R-channels; Röthlisberger, Reference Röthlisberger1972) or underlying bedrock (N-channels; Nye, Reference Nye1973). Processes related to subglacial sediment, such as the creation of sediment by bedrock erosion, sediment transport and deposition, complicate the subglacial hydraulic system. Sediment can act as a medium through which water can flow (e.g. Hubbard and others, Reference Hubbard, Sharp, Willis, Nielsen and Smart1995), and the erosion of sediment alters the bed geometry (Beaud and others, Reference Beaud, Flowers and Venditti2016). Furthermore, inferences from palaeo-landforms indicate that sediment can fill or choke a subglacial channel (Burke and others, Reference Burke, Brennand and Sjogren2015).
Basal water alters ice motion, which can act as a lubricant causing sliding at the ice–water interface (Weertman, Reference Weertman1957; Lliboutry, Reference Lliboutry1959; Iken, Reference Iken1981; Schoof, Reference Schoof2005), and reduces the shear strength of subglacial sediments enhancing till deformation (Alley and others, Reference Alley, Blankenship, Bentley and Rooney1987; Boulton and Hindmarsh, Reference Boulton and Hindmarsh1987; Zoet and Iverson, Reference Zoet and Iverson2020). The erosion, transport and deposition of sediment by subglacial water also have a geomorphological impact, which over repeated glacial cycles has contributed to the glacial landscapes we observe today (Herman and others, Reference Herman, Beaud, Champagnac, Lemieux and Sternai2011; Beaud and others, Reference Beaud, Flowers and Pimentel2014). The distribution, and redistribution, of subglacial sediment by water influences the rate at which subglacial bedrock erosion can occur (Swift and others, Reference Swift, Nienow, Spedding and Hoey2002). Sediment can act as a shield, protecting the underlying bedrock from glacier erosion (Alley and others, Reference Alley, Cuffey and Zoet2019). This sediment shield can remain intact or be eroded by water or ice. Subglacial erosion by water is primarily determined by the carrying capacity of water, which in turn depends on the nature of the subglacial hydrological system. It has been inferred that inefficient drainage in cavities likely leads to little geomorphic work (Alley and others, Reference Alley1997), while efficient channels with high water fluxes can effectively remove sediment due to their high carrying capacity (Alley and others, Reference Alley1997; Spedding, Reference Spedding2000; Swift and others, Reference Swift, Nienow, Spedding and Hoey2002). This inference is supported by the numerical model of Beaud and others (Reference Beaud, Flowers and Venditti2016), which showed that channels concentrate subglacial erosion. Diurnal and seasonal fluctuations in water pressure overwhelm and then change the size of channels (Hubbard and others, Reference Hubbard, Sharp, Willis, Nielsen and Smart1995; Tedstone and others, Reference Tedstone, Nienow, Gourmelen and Sole2014; Rada and Schoof, Reference Rada and Schoof2018), altering the spatial extent of sediment transport (Swift and others, Reference Swift, Nienow, Hoey and Mair2005; Delaney and others, Reference Delaney, Bauder, Werder and Farinotti2018; Perolo and others, Reference Perolo2019). The net effect of the above is recorded in glacial landforms, with extensive networks of subglacial meltwater systems revealed by the retreat of palaeo-ice masses (e.g. Storrar and others, Reference Storrar, Stokes and Evans2014; Greenwood and others, Reference Greenwood, Clason, Helanow and Margold2016; Lewington and others, Reference Lewington, Livingstone, Clark, Sole and Storrar2020). These networks contain both channels eroded into the subglacial substrate (e.g. Greenwood and others, Reference Greenwood, Clark and Hughes2007), and depositional landforms such as eskers; sinuous ridges of glaciofluvial sediment formed by the infilling of a subglacial channel (e.g. Shreve, Reference Shreve1985; Brennand, Reference Brennand2000; Hooke and Fastook, Reference Hooke and Fastook2007). When water is present within the sediment layer, the interaction between water and deforming sediment is also key for producing subglacial bedforms such as drumlins (e.g. Fannon and others, Reference Fannon, Fowler and Moyles2017). Interpretation of these landforms can provide insight into the dynamics of palaeo-ice masses and the properties of the subglacial hydrological system (Greenwood and others, Reference Greenwood, Clark and Hughes2007; Stokes and others, Reference Stokes2015).
A growing number of observations have been made of the contemporary subglacial environment (e.g. Hubbard and others, Reference Hubbard, Sharp, Willis, Nielsen and Smart1995; Iken and others, Reference Iken, Fabri and Funk1996; Meierbachtol and others, Reference Meierbachtol, Harper and Humphrey2013; Andrews and others, Reference Andrews2014; Wright and others, Reference Wright, Harper, Humphrey and Meierbachtol2016; Rada and Schoof, Reference Rada and Schoof2018), and insight has been gained from the glacial landforms exposed by the retreat of palaeo-ice masses (Greenwood and others, Reference Greenwood, Clason, Helanow and Margold2016; Lewington and others, Reference Lewington, Livingstone, Clark, Sole and Storrar2020) and by studying proglacial sediment yields (Swift and others, Reference Swift, Nienow, Spedding and Hoey2002, Reference Swift, Nienow, Hoey and Mair2005; Riihimaki and others, Reference Riihimaki, MacGregor, Anderson, Anderson and Loso2005). Such observations reveal dynamically evolving bed topography due to erosion and deposition (e.g. King and others, Reference King, Hindmarsh and Stokes2009), and the seasonal evolution of subglacial drainage (Chandler and others, Reference Chandler2013). Current techniques preclude a holistic image of the subglacial drainage system being acquired; boreholes only grant access to a point at the bed, palaeo-landscapes are static imprints of deglaciation and interpretations of the contemporary subglacial environment must be made from proglacial sediment yields. Therefore, physics-based numerical models provide an ideal complementary approach for exploring and extending understanding of subglacial sediment transport (e.g. de Winter and others, Reference de Winter, Storms and Overeem2012) and water flow (Flowers, Reference Flowers2015).
A handful of modelling studies have examined aspects of the subglacial meltwater-sediment system. These vary in their focus on different system components and timescales. Walder and Fowler (Reference Walder and Fowler1994), and later Ng (Reference Ng2000), considered the effect of channelised drainage on subglacial sediment movement, creating a model of a subglacial ‘canal’ – a channel which is partially incised in basal sediment and the overlying ice. These canal models highlighted the important relationship between the form of the subglacial meltwater system and the amount of sediment transport (Walder and Fowler, Reference Walder and Fowler1994; Ng, Reference Ng2000). Beaud and others (Reference Beaud, Flowers and Pimentel2014) used a coupled model of distributed and channelised water flow to simulate the erosion of bedrock channels, and later adapted the model to examine the role of seasonal variations in meltwater input and floods (Beaud and others, Reference Beaud, Venditti, Flowers and Koppes2018a). Their work focused on erosion, rather than sediment transport, but again highlighted the importance of the form of the subglacial meltwater system, showing that erosion is concentrated along subglacial channels (Beaud and others, Reference Beaud, Flowers and Venditti2016, Reference Beaud, Venditti, Flowers and Koppes2018a). Recently, the problem of glaciofluvial sediment transport and deposition within a subglacial R-channel has been considered by two models (Beaud and others, Reference Beaud, Flowers and Venditti2018b; Hewitt and Creyts, Reference Hewitt and Creyts2019). These two models differed in the timescales examined: Beaud and others (Reference Beaud, Flowers and Venditti2018b) focused on the seasonal meltwater evolution, whereas Hewitt and Creyts (Reference Hewitt and Creyts2019) focused on steady deposition over longer timescales. Both models found that sediment deposition was concentrated at the glacier terminus, interpreting this as the likely location of esker formation.
The majority of subglacial meltwater-sediment models have focused on idealised bed geometries, typically a flat surface. There are a few notable exceptions to this. Creyts and others (Reference Creyts, Clarke and Church2013) modelled subglacial sediment transport in a distributed water system along an overdeepened basin, finding that the uphill portion of an overdeepening that opposes ice flow promotes sediment deposition. Delaney and others (Reference Delaney, Werder and Farinotti2019) developed a 1-D model to describe bedrock erosion and sediment transport processes. They coupled a till layer model and water flow model, which accounts for the effect of an R-channel on hydraulic gradient across a glacier bed. This model has been applied to synthetic test cases and been shown to reproduce sediment discharges throughout a season from realistic glacier geometries (Delaney and others, Reference Delaney, Werder and Farinotti2019; Delaney and Adhikari, Reference Delaney and Adhikari2020).
For subglacial hydrological models simulating R-channels, the effect of two important geometric controls; the ice surface slope and the bed topography, upon subglacial sediment transport remain understudied. Here, we conduct a suite of sensitivity experiments using the Hewitt and Creyts (Reference Hewitt and Creyts2019) model, exploring a range of scenarios with various basal topographies and ice surface slopes. The primary aim is to study the effect of basal topography and ice surface slope on the rate of sediment deposition within a modelled subglacial channel and the extent to which this varies with distance from the ice margin.
2. Methods
We use the model described by Hewitt and Creyts (Reference Hewitt and Creyts2019), which is summarised below with further details in the Supplementary material. It is important to note that the model provides quasi-steady solutions for the rate of sediment deposition within a subglacial channel; specifically, the model provides a steady solution to the governing equations within a moving coordinate system that is set in the frame of the retreating ice margin (i.e. the ice margin always lies at x = 0 as it retreats). In this way we can observe the rates of sediment deposition at the margin and elsewhere, focusing on their magnitude, without concern for their variation due to transient effects. Therefore, the results presented here should be considered as snapshots in time, with the aim of highlighting the effect that various topographical and ice surface features have upon channel and glaciofluvial sediment deposition rates, rather than computing the total volume of accumulated sediment over time or its ultimate fate. Alternative models have shown that seasonal or flood events can be important for entraining sediment (e.g. Beaud and others, Reference Beaud, Flowers and Venditti2018b). However, our aim is to capture the broad behaviour of the subglacial system, rather than replicate a specific event or real glacier configuration. Predictions that include transient effects, such as seasonal variations in water fluxes, margin retreat, channel migration and thermal regime switches are the subject of ongoing work. Furthermore, the model only considers an R-channel, where it is anticipated that most of the sediment movement and transport occurs (Alley and others, Reference Alley1997; Beaud and others, Reference Beaud, Flowers and Venditti2016). Therefore, results for other forms of subglacial drainage or parts of the bed are not considered here.
2.1. Model background
A qualitative outline of the approach is provided here, discussing the physical processes that drive the evolution of the channel and the transport of sediment within it. The reader is directed to the paper by Hewitt and Creyts (Reference Hewitt and Creyts2019) for a complete mathematical description and further details.
The model takes a quasi-steady approach to the deposition cycle. This approach considers the accumulation of sediment under conditions of temporally constant meltwater and sediment supply. Such conditions are unlikely in reality, but enable us to examine the broad behaviour of the R-channel system. While the quasi-steady approximation does not allow us to investigate episodic deposition through the seasonal variation of meltwater and sediment supply (e.g. Beaud and others, Reference Beaud, Flowers and Venditti2018b; Delaney and others, Reference Delaney, Werder and Farinotti2019), it does provide a sound base from which to investigate how changes in basal topography impact the deposition of sediment under idealised conditions.
In the model, a single R-channel in the ice is considered (Fig. 1a; Röthlisberger, Reference Röthlisberger1972). The channel boundary is sufficiently porous to allow the inflow of sediment-laden water (Fig. 1b). This single-channel approach represents one member within a system of subglacial channels that are presumed to constitute the subglacial drainage system. Channels are presumed to be regularly spaced, with an associated catchment region from which they drain water, from both the bed and the surface of the ice sheet. Distributed drainage, the mechanism of channel initiation and bedrock channels (i.e. Nye channels), are not considered. In the present model, basal meltwater fluxes are prescribed using a temporally fixed value per unit area of the drainage region. Surface meltwater fluxes vary spatially depending on the altitude of the ice surface, with the generation of surface meltwater presumed to occur and drain to the bed below a threshold altitude (Hewitt and Creyts, Reference Hewitt and Creyts2019; Fig. 1a). This threshold altitude is set at 1000 m for the numerical experiments performed here.
Schematic of model set-up and key findings from Hewitt and Creyts (Reference Hewitt and Creyts2019). (a) Overall model configuration. An R-channel transports sediment and water towards the ice margin, driven by the ice surface gradient. Water below the ablation altitude is routed to the bed. (b) Water and sediment flow into the porous walls of the channel. In the initial channel, this sediment is carried away due to the high carrying capacity. (c) Channel growth is determined by the competition between creep closure and wall melting. Downstream, the channel enlarges due to increased water fluxes and lower rates of creep closure due to reduced overburden pressure beneath thinner ice. In this larger channel, sediment supply exceeds carrying capacity, leading to deposition. (d) Continued channel growth and thinner ice results in deposition of a sediment mound.

The cross-sectional area of the modelled R-channel evolves as a function of local flow conditions. Wall melting acts to increase the cross-sectional area of the channel, whereas creep closure and sediment deposition act to reduce it (Fig. 1c). Sediment brought into the channel is either deposited on the channel floor, or mobilised for transport downstream. The sediment carrying capacity of the channel is the critical parameter required to determine whether mobilisation or deposition of sediment occurs at a given location. For a given sediment grain size, a critical Shields stress required for sediment mobilisation is applied. Above this mobilisation stress, an approximate carrying capacity for the channel can be determined, based on local flow conditions and channel dimensions. Where the supply of sediment within the channel remains below this carrying capacity, the sediment is transported down the whole length of the ice mass, and no deposition occurs. Where the supply of sediment locally exceeds the carrying capacity, excess sediment is deposited within the channel. This deposited sediment reduces the channel area, modifying flow parameters and, in turn, the carrying capacity. This leads to a strong coupling between sediment deposition and the transport characteristics of the channel.
The typical evolution of a channel, as found by Hewitt and Creyts (Reference Hewitt and Creyts2019), is summarised in Figures 1b–d. Far from the ice margin, the channel is small and highly pressurised. All sediment is transported downstream along with the flowing water (Fig. 1b). Here, wall melting and creep closure are typically closely balanced, leading to slow and gradual growth of the channel to accommodate the additional influx of water. Towards the margin, the sediment supply typically exceeds the carrying capacity of the channel, leading to excess sediment deposition within the channel. This occurs because the channel expands, leading to a lower carrying capacity. Channel expansion is caused by lower rates of creep closure, a consequence of thinner ice imparting less overburden pressure (Fig. 1c). Behind the margin, this leads to the accumulation of large sediment deposits (Fig. 1d), and the formation of an ice-terminal esker, as reported in Hewitt and Creyts (Reference Hewitt and Creyts2019).
Ultimately, the model determines the evolution of the channel cross-sectional area, the location of sediment deposition and the flux of water and sediment within an R-channel. Required inputs are the surface and basal meltwater fluxes, the volume-fraction of sediment contained within the meltwater, grain size of the sediment and the basal and surface topography.
2.2. Experimental design
Using the model described above, we perform a set of sensitivity experiments designed to simulate idealised settings. These can be divided into two categories: basal topography and ice surface slope, both of which impact the basal hydraulic potential gradient.
For the basal topography experiments, we investigate four types of bed geometry. First, the case of a moderately sized (500 m high, ~15 km in width) subglacial ridge is considered, comparing the properties of the modelled channel both with and without the presence of sediment transport and deposition. Second, we consider four ridges (50–500 m high, ~5 km in width), spaced at both regular (20 and 40 km) and irregular intervals. We vary the size and position of these ridges to explore typical behaviours. Third, we investigate geometries where the bed comprises small repetitive undulations (5–20 m high, 2 km spacing), again varying the amplitude of these small bumps. Our final experiment considers ice flowing across a subglacial trough, similar in dimensions to a glacially overdeepened basin (Patton and others, Reference Patton, Swift, Clark, Livingstone and Cook2016). In every experiment, the bed gradient is adjusted to account for isostatic depression from the ice loading, producing the larger scale gradient of the bed. Since the initial bed is horizontal with imposed undulations, the isostatic depression results in an overall uphill gradient across the model domain.
To determine the ice-surface topography, we use surface profiles calculated using a plastic ice approximation (Cuffey and Paterson, Reference Cuffey and Paterson2010). For each configuration analysed, the effect of basal topography on perturbations of the ice surface is also considered. To translate changes in basal topography to the ice surface we implement the surface transfer functions described in Ng and others (Reference Ng, Ignéczi, Sole and Livingstone2018). In the context of the cases tested here, the impact of the ice-surface modification is relatively minor; typically adjusting the ice thickness by ~10% of the size of the basal undulation, which itself is typically much smaller than the ice thickness.
A second set of experiments was conducted to isolate the effect of ice-surface elevation in the model. Here, the bed topography was kept constant, but the ice surface elevation (and thus ice thickness) was altered in two ways. First, the initial profile derived from the plastic ice flow approximation was altered to produce three ice surface slopes, resulting in: (1) thin ice with a gradual surface slope; (2) moderate ice thickness and slope and (3) thick ice with a steep slope. Second, we produced a profile where the margin is steep, but beyond ~40 km from the margin the ice surface is nearly flat. In the steep margin experiment, the ice geometry has a shallow sloping interior, a steep front towards the ice margin, but an ice thickness at 100 km upstream that is the same as the parabolic profile.
Surface meltwater fluxes are elevation dependent, with no surface melting occurring above 1000 m, and increased surface melting occurring at lower altitudes (Eqn (S7)). As the experiments are designed to isolate the effects of basal topography and ice surface slope, all other parameters (e.g. channel roughness, sediment density, gravity, grain size, water and ice density) are held constant between the experiments. Hewitt and Creyts (Reference Hewitt and Creyts2019) showed that changing these parameters altered the magnitudes of sediment deposition, but not the broad behaviour of the model. One assumption of the experiments presented here is that the mass fraction of sediment to water is constant; i.e. 0.3%. As demonstrated in Hewitt and Creyts (Reference Hewitt and Creyts2019), variation of sediment mass fraction can affect the rate of deposition, and dynamic variation of this fraction may lead to different deposition patterns to those observed here. We do not vary the sediment mass fraction as we aim to isolate the effects of basal topography on sediment deposition.
3. Results
3.1. Basal topography
We present a series of computational experiments to investigate the effect of varying basal topography on sediment deposition. The presented cases have been selected as representative examples of behaviours observed within a wide range of examined scenarios.
Results from experiments where a single subglacial ridge is situated 50 km from the ice margin, with a height of 250 m, are shown in Figure 2. To isolate the effect of the ridge on channel size and sediment carrying capacity, the left-hand panels (Figs 2b–d) show an experiment with sediment not present, with the right-hand panel showing an experiment where sediment transport is enabled (Figs 2e–g). For both experiments, the ice surface, bed topography and hydrostatic potential are identical (Fig. 2a).
Channel dynamics over a single subglacial ridge, without (panels b–d) and with (panels e–g) sediment. The top row shows the ice surface, bed topography (black lines) and channel pressure (a; blue line). Channel cross-sectional area (S) is shown in the second row (b, e). The third row shows sediment flux (Q; solid blue line) and carrying capacity (c, f; dashed line). The lowest row shows the rate of sediment deposition (D) (d, g). The light grey column highlights the stoss of the ridge, while the darker grey highlights the lee.
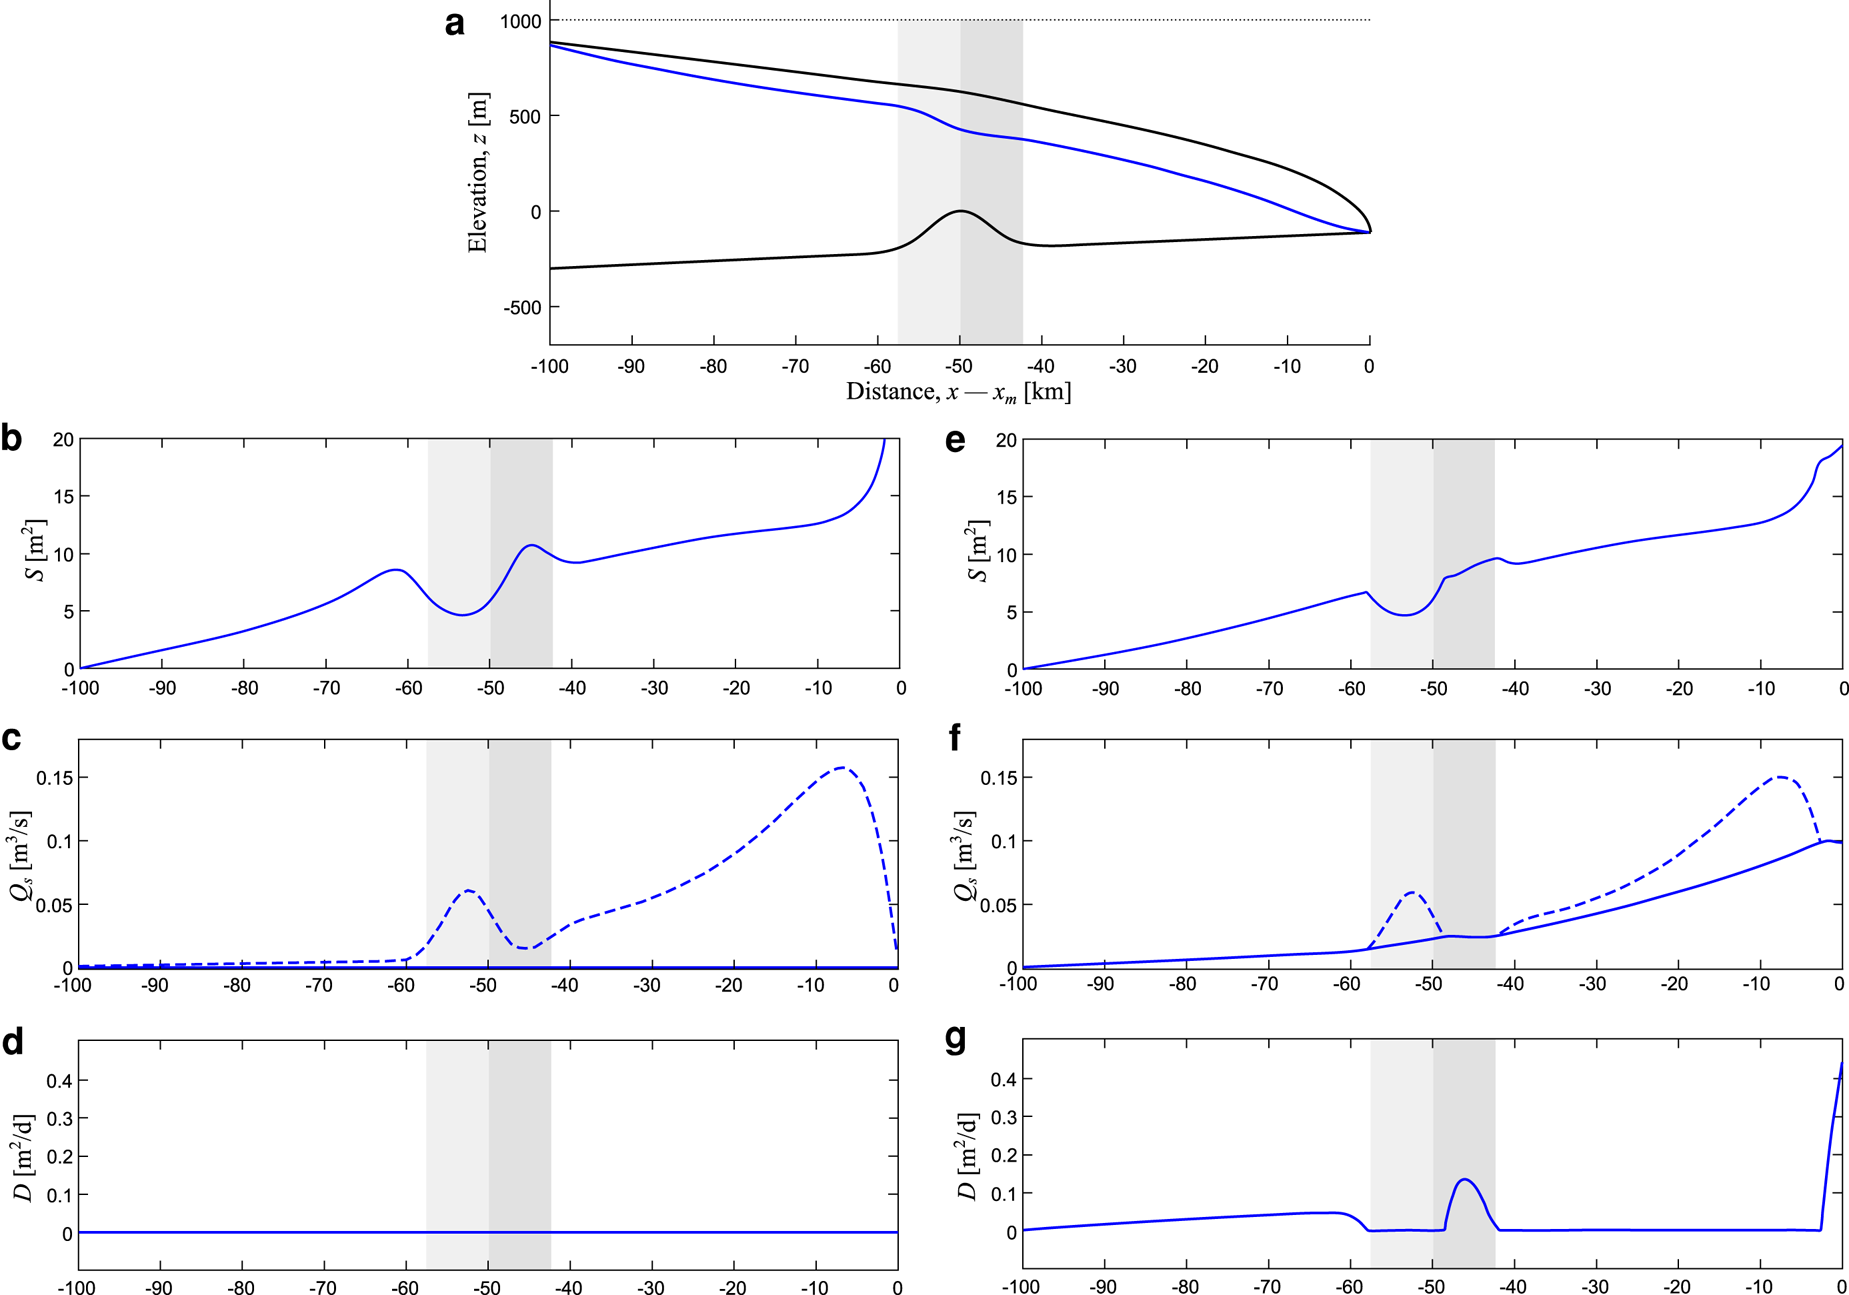
The variation in channel area, shown for the two experiments in Figures 2b, e, controls the rate of sediment deposition, due to its influence on sediment transport capacity. If we first consider the no-sediment case (Fig. 2b), the channel begins to grow several kilometres upstream from the ridge (100 to ~70 km from the ice margin). The channel narrows at the approach to the upstream foot of the ridge (~60 km from ice margin). Widening of the channel then occurs near the peak of the ridge (50 km from ice margin). On the lee side of the ridge (~50 to ~45 km from the ice margin), the channel widens rapidly again. Beyond the ridge (~40 to ~10 km from the ice margin), the channel settles back towards a long-term trend of gradual growth.
Water velocity is a key driving factor in determining the sediment carrying capacity (see Eqn (S5) in the Supplemental material for more details). Therefore, when the channel width shrinks we expect an increase in flow velocity and a corresponding increase in sediment carrying capacity. Conversely, when the channel width grows rapidly (i.e. outpacing the growth rate expected from the steady influx of water into the channel), such as on the lee side of a ridge, we expect a decrease in flow velocity and therefore a corresponding drop in carrying capacity. It is under these circumstances that we may expect to observe sediment deposition within the channel.
When sediment transport is included in the model (Figs 2e–g), the coupled dynamics between channel width, sediment carrying capacity and sediment deposition can be observed. Deposition occurs when the sediment supply exceeds the carrying capacity on the approach (~80 to ~60 km from the ice margin) and lee side (~50 to 40 km) of the ridge (Figs 2f, g). Deposition on the approach to the ridge is gradual, but takes place over a large extent of the channel (~40 km). Deposition on the lee side of the ridge is larger in magnitude and shorter in extent. Sediment deposition in the channel restricts its width, flattening out the peak in channel area in comparison with the no-sediment experiment (Fig. 2e). Therefore, the addition of sediment transport and deposition leads to a dampening in the variability of channel cross-sectional area when variable topography is considered.
In both cases there is a dramatic drop-off in sediment carrying capacity within the final few kilometres before the ice margin. It is in this region that the most significant deposition of sediment tends to occur, leading to the formation of a submarginal deposit which can be interpreted as an esker. This mechanism was studied in greater depth by Hewitt and Creyts (Reference Hewitt and Creyts2019).
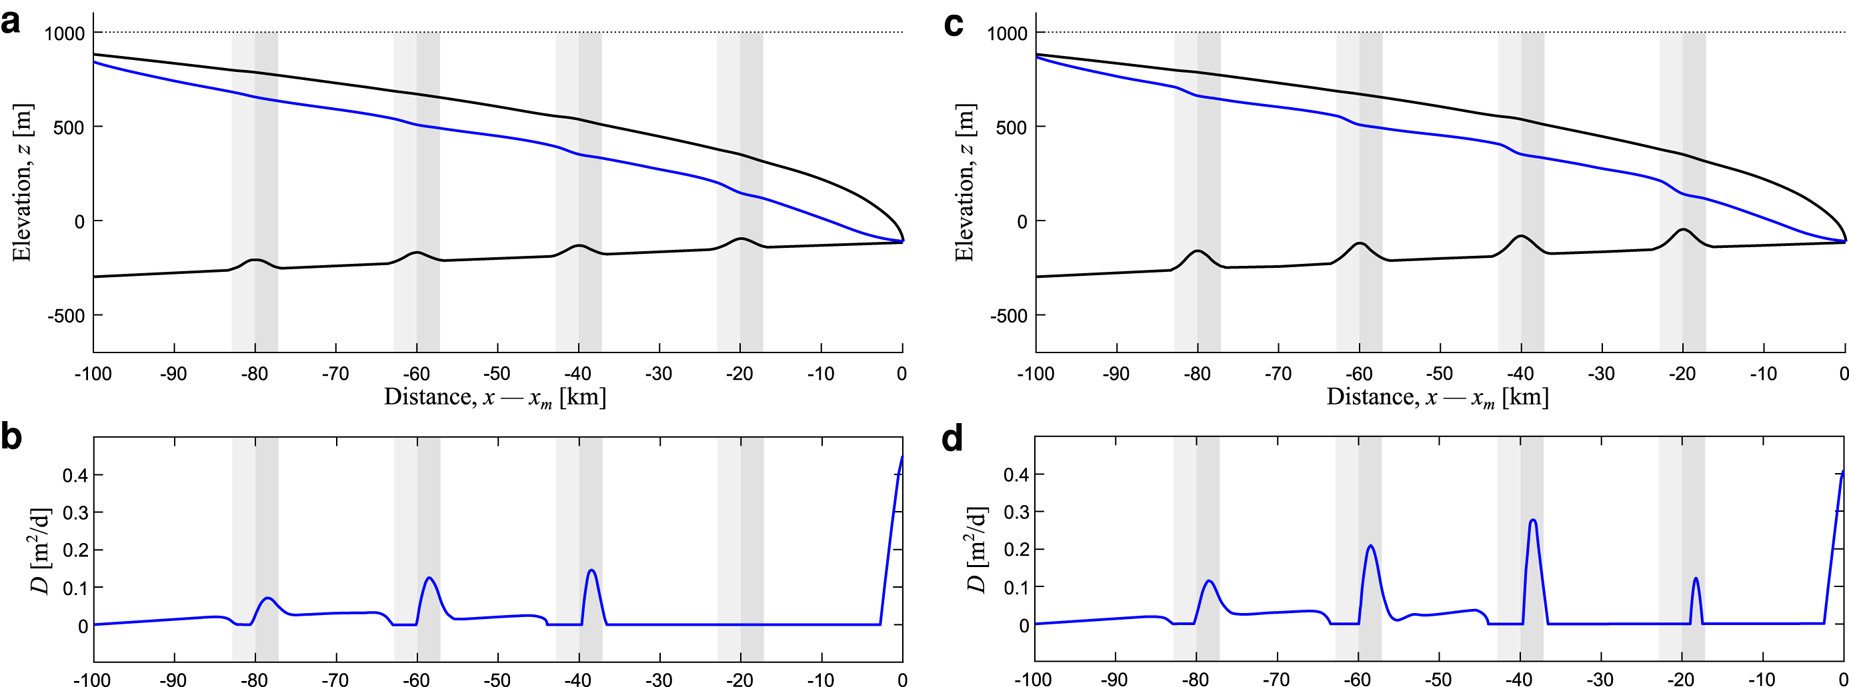
Results from experiments with multiple subglacial ridges are shown in Figure 3. This produces a similar pattern of sediment deposition to the single ridge experiments (Figs 2e–g) for the majority of ridges the channel passes over (Fig. 3); sediment is deposited within the channel both upstream of a ridge and on its downstream flank (Figs 3b, d). The larger ridges lead to greater rates of sediment deposition. However, the volume and intensity of deposition is also strongly dependent on distance from the ice margin. The largest volume of sediment is deposited around the ridge placed 40 km from the ice margin, with smaller deposits occurring further upstream (Figs 3b, d). Whether deposition occurs around the ridge situated 20 km from the ice margin is dependent upon its size. For the experiment with smaller ridges (50 m in height), no deposition occurs at the 20 km ridge (Fig. 3b). Conversely, a small amount of deposition occurs at the 20 km ridge when the height is increased to 100 m. Additional simulations show that deposition only occurs 20 km from the ice margin when large amplitude and short span topography is present (Fig. S1). The large accumulation of sediment within the final 2–3 km (an esker) is once again visible.
Deposition over Gaussian ridges, placed at 20, 40, 60 and 80 km from the ice margin. Panels (a) and (c) show the ice and bed geometry, while panels (b) and (d) plot the sediment deposition rate. Ridges of 50 m amplitude are considered in (a) and (b). Note that deposition does not occur at the 20 km ridge. For the 100 m amplitude ridges shown in (c) and (d), deposition rates are higher overall, and deposition does occur at the ridge situated 20 km from the ice margin.
The effect that distance from the ice margin has upon rates of sediment deposition within the channel is further highlighted by experiments that consider a regular sequence of subglacial bumps (Fig. 4). Here, we placed very shallow Gaussian-shaped subglacial bumps, separated by 4 km, with heights of 5 m (Figs 4a, b) and 20 m (Figs 4c, d), across the extent of the domain. Surprisingly, the presence of these small and extremely gentle bumps still leads to sediment deposition far from the ice margin. A configuration with bumps of a height as low as 2 m leads to a similar, though less pronounced pattern of deposition (Fig. S2). Bump size also alters where deposition occurs. For the smaller (5 m high) bumps no deposition occurs at the bump 28 km from the ice margin (Fig. 4b). When bump height is increased (20 m high), deposition occurs around the bumps placed 28 and 24 km from the ice margin (Fig. 4d).
Deposition of sediment over regularly spaced bumps. The height of the bumps varies between experiments. Panels (a) and (c) show the ice and bed geometry, while panels (b) and (d) plot the sediment deposition rate. In panels (a) and (b), the bumps are 5 m in height, whereas bump height is increased to 20 m in panels (c) and (d). Note how this changes the magnitude and spatial extent of sediment deposition.
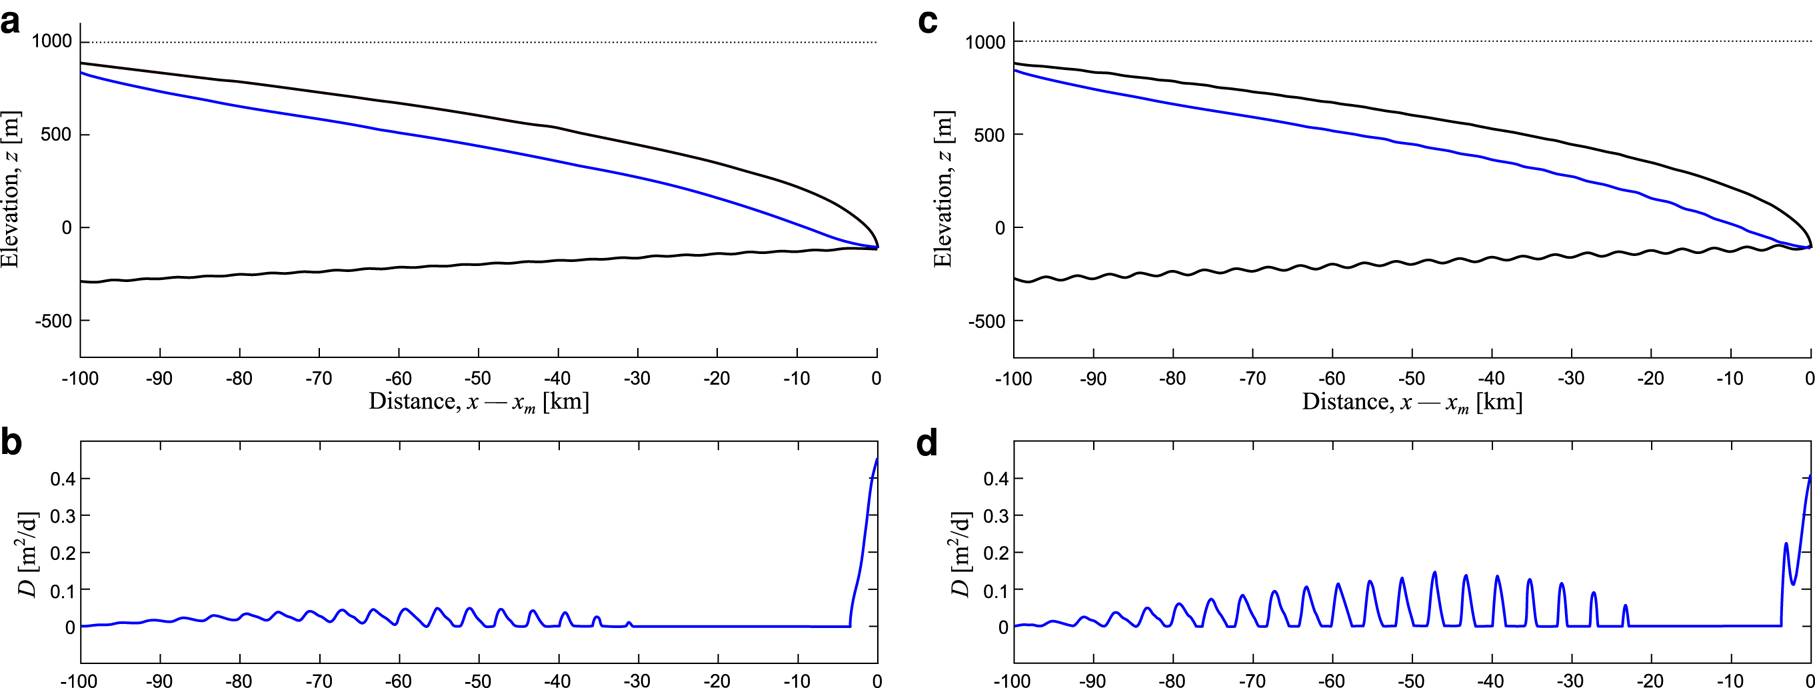
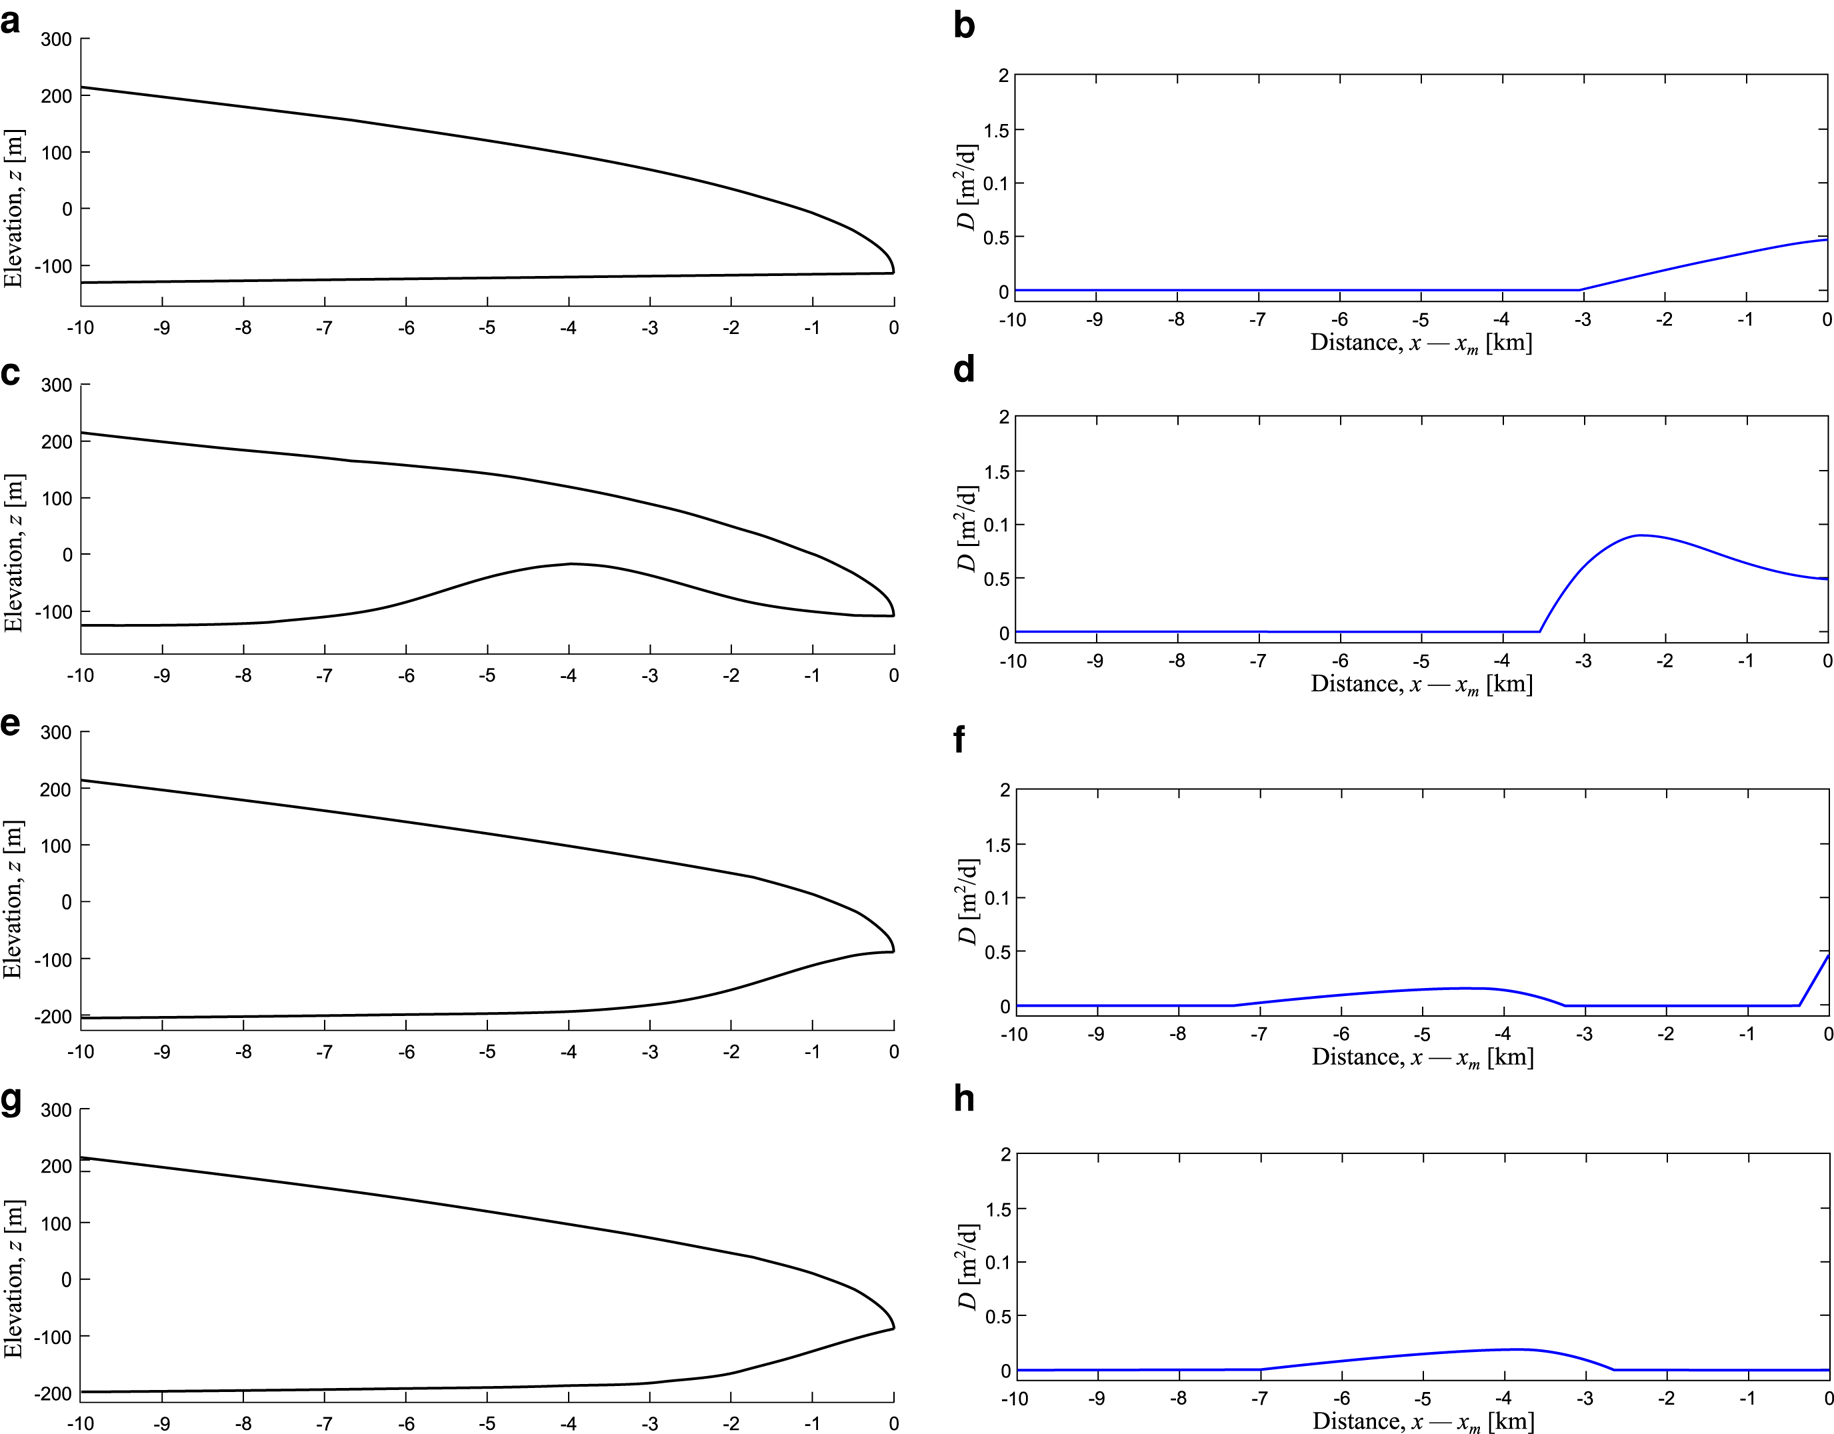
Basal topography can also influence deposition near the ice margin. For bumps of height 20 m, note the effect that the bump closest (4 km) to the ice margin has upon submarginal deposition; the rate of deposition is modified, enhancing deposition on the lee side of the bump (Fig. 4d). That such gradual changes of gradient can modify the deposition of sediment near the margin suggests that basal topography may alter the size of eskers formed from submarginal deposition. This finding prompted an additional set of experiments, examining scenarios where a subglacial ridge is located close to or at the ice margin (Fig. 5). These experiments show that a subglacial ridge can either enhance (Figs 5c, d) or inhibit (Figs 5e–h) sediment deposition near the ice margin, depending on the location of the ridge relative to the ice margin. Deposition is enhanced on the lee side of ridges, due to widening of channels decreasing carrying capacity (Figs 2, 3). Therefore, when the lee of a ridge is located near the ice margin (Fig. 5c), deposition rates are increased (Fig. 5d) compared to a situation where the bed is flat (Fig. 5b). Deposition is inhibited on the upstream side of hills, where narrower channels have a higher carrying capacity. Thus, if the upward sloping portion of a ridge is situated close to an ice margin, deposition may be restricted in extent (Fig. 5f) or prevented from occurring at the ice margin (Fig. 5h). Figures 5e–h also show that broad regions of low deposition rates close to the foot of the upstream side of a subglacial ridge can occur, with sediment in this region being deposited ~3 to ~7 km from the ice margin. Further to this, our experiments have shown that placing multiple ridges within the submarginal deposition zone can lead to multiple deposition peaks on the lee side of the ridges, with the deposition peaks separated by flushing zones between them, corresponding to the upstream side of the ridges (Fig. S3).
Influence of subglacial topography close to or at the ice margin. Note the horizontal scale is 10 km, unlike previous and subsequent plots. Each row corresponds to an experiment. The left-hand panels (a, c, e and g) show the ice and bed geometry. The right hand panels (b, d, f and h) plot the corresponding sediment deposition rate. Panels (a) and (b) show a flat bed for reference; note that submarginal deposition 3 km from the margin. Panels (c) to (h) include subglacial ridges ~4 km wide (2 km Gaussian variance) and 100 m amplitude, situated at various positions from the ice margin. Panels (c) and (d) show results where a ridge is centred 4 km from the margin, note that deposition is enhanced in this scenario (d). In (e) and (f), the peak of the ridge is located at the ice margin. No deposition occurs on the majority of the ridge (f). Instead, a broad region of sediment deposition occurs upstream of the ridge, separate from a second zone of deposition close to the margin. In (g) and (h), the peak of the ridge is located 0.5 km in front of the ice margin. In this experiment, no deposition occurs at the ice margin, with only a broad region of sediment occurring at the base of the ridge (~2.7 to 7 km from the ice margin in panel (h)).
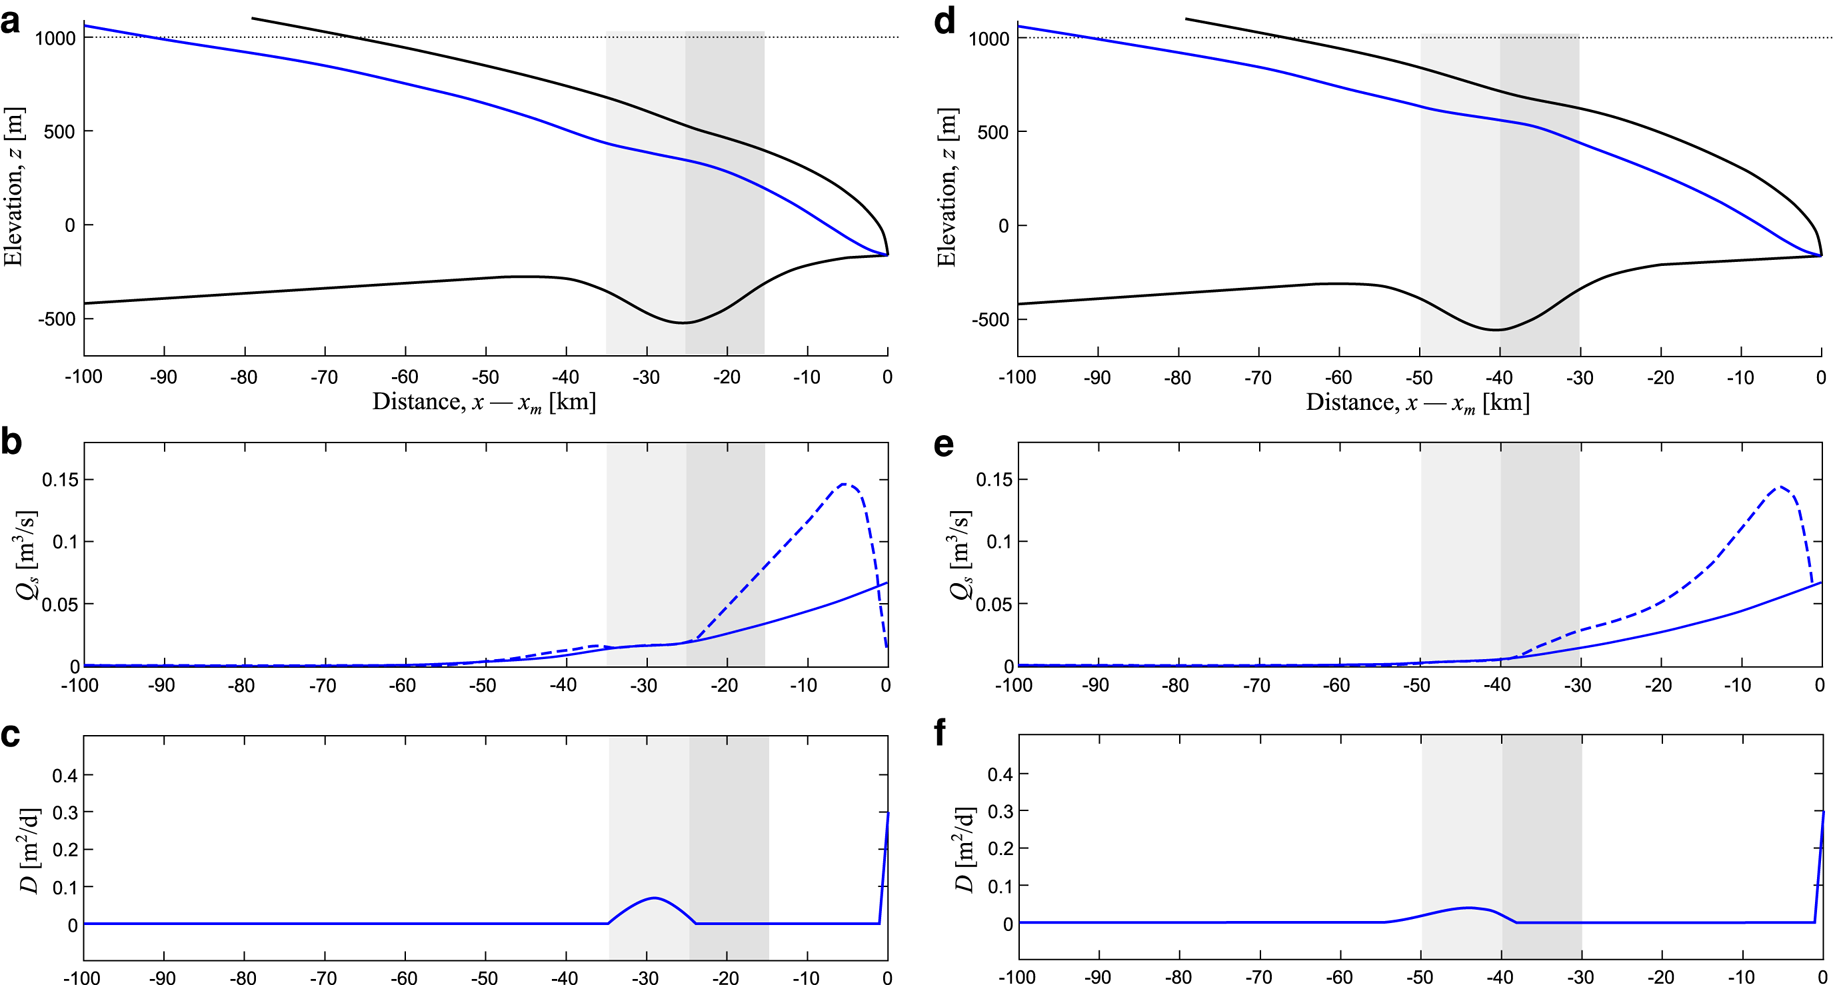
A further experiment, the results of which can be seen in Figure 6, considers how channel geometry and deposition change in response to flow across a subglacial depression, which can be envisaged as a cross-cutting valley or trough. The trough is Gaussian in shape, with a variance of 10 km making it ~20 km wide, and is 300 m deep. We test how the trough position with respect to the ice margin changes the deposition patterns, with experiments shown where the centre of the trough is situated at 25 km (Fig. 6c) and 40 km (Figs 6d–f) from the ice margin. Results are similar to those for subglacial ridges, albeit with a reversed direction, with sediment deposited on the downward sloping side of the trough. However, the slow accumulation behind the upward sloping side, which is observed with subglacial ridges (see Figs 2, 3), has no analogue in this case. Although the general characteristics are similar between the two presented cases, the position of the trough alters the rate of sediment deposition, with larger peak deposition rates found when the trough is situated closer to the ice margin (Fig. 6c).
Deposition across a glacial trough transverse to flow direction. Each column corresponds to an experiment. The top panels (a and d) show the ice and bed geometry. The middle panels show the sediment flux (solid blue line) and carrying capacity (dashed line). The bottom panels show the deposition rate. A Gaussian shaped trough of 10 km variance (~20 km wide), and with a depth of 300 m, is considered. The trough is situated at 25 km from the ice margin in the left-hand panels (a–c) and 40 km from the ice margin in the right-hand panels (d–f). Note how deposition occurs on the upstream (downhill) of the trough.
3.2. Ice surface
Our experiments show that ice thickness and ice surface slope are also key contributors to the magnitude and spatial distribution of deposition within the modelled subglacial channel. Figure 7 demonstrates the effect of different ice surfaces on sediment deposition over an undulating basal surface. Note that without any basal topography, no deposition would occur except at the ice margin in the form of a submarginal esker (Hewitt and Creyts, Reference Hewitt and Creyts2019). Three parabolic ice surface profiles of varying slope and thickness are shown (Fig. 7). Higher rates of deposition occur under shallower ice profiles (Figs 7a, b), with deposition suppressed when the ice slope is higher, and thus the ice is thicker (Figs 7c–f). Under the shallowest ice slopes, deposition occurs in the lee of the bump 20 km from the ice margin, and persists 100 km upstream of the ice margin (Figs 7a, b). The medium gradient slope also has deposition 20 km from the ice margin, but at 84 km sediment deposition is suppressed (Figs 7c, d). The area where deposition occurs upstream from the margin is reduced further under steeper and thicker ice, starting at 60 km from the ice margin (Figs 7e, f). In this experiment, the closest bump to the ice margin where sediment is deposited occurs 24 km up-ice (Fig. 7). In the modelled upstream region, under the thick ice, only narrow channels can form, leading to fast-flowing water with a high carrying capacity. In reality, it may be expected that a channelised drainage system simply would not form under thick ice. Furthermore, low water discharges upstream may lead to a situation where water fluxes are insufficient to entrain sediment into the channel.
Effect of ice slope and thickness on subglacial deposition within a channel. Each row corresponds to an experiment. The left-hand panels (a, b and c) show the ice and bed geometry. The right-hand panels (d, e and f) plot the corresponding sediment deposition rate. In each experiment, regular bumps of the same magnitude and spacing are placed at the bed (a, c, e). Ice surface slope, and thus overall thickness, increases from top to bottom. Note how this alters the patterns and magnitudes of sediment deposition (b, d, f).
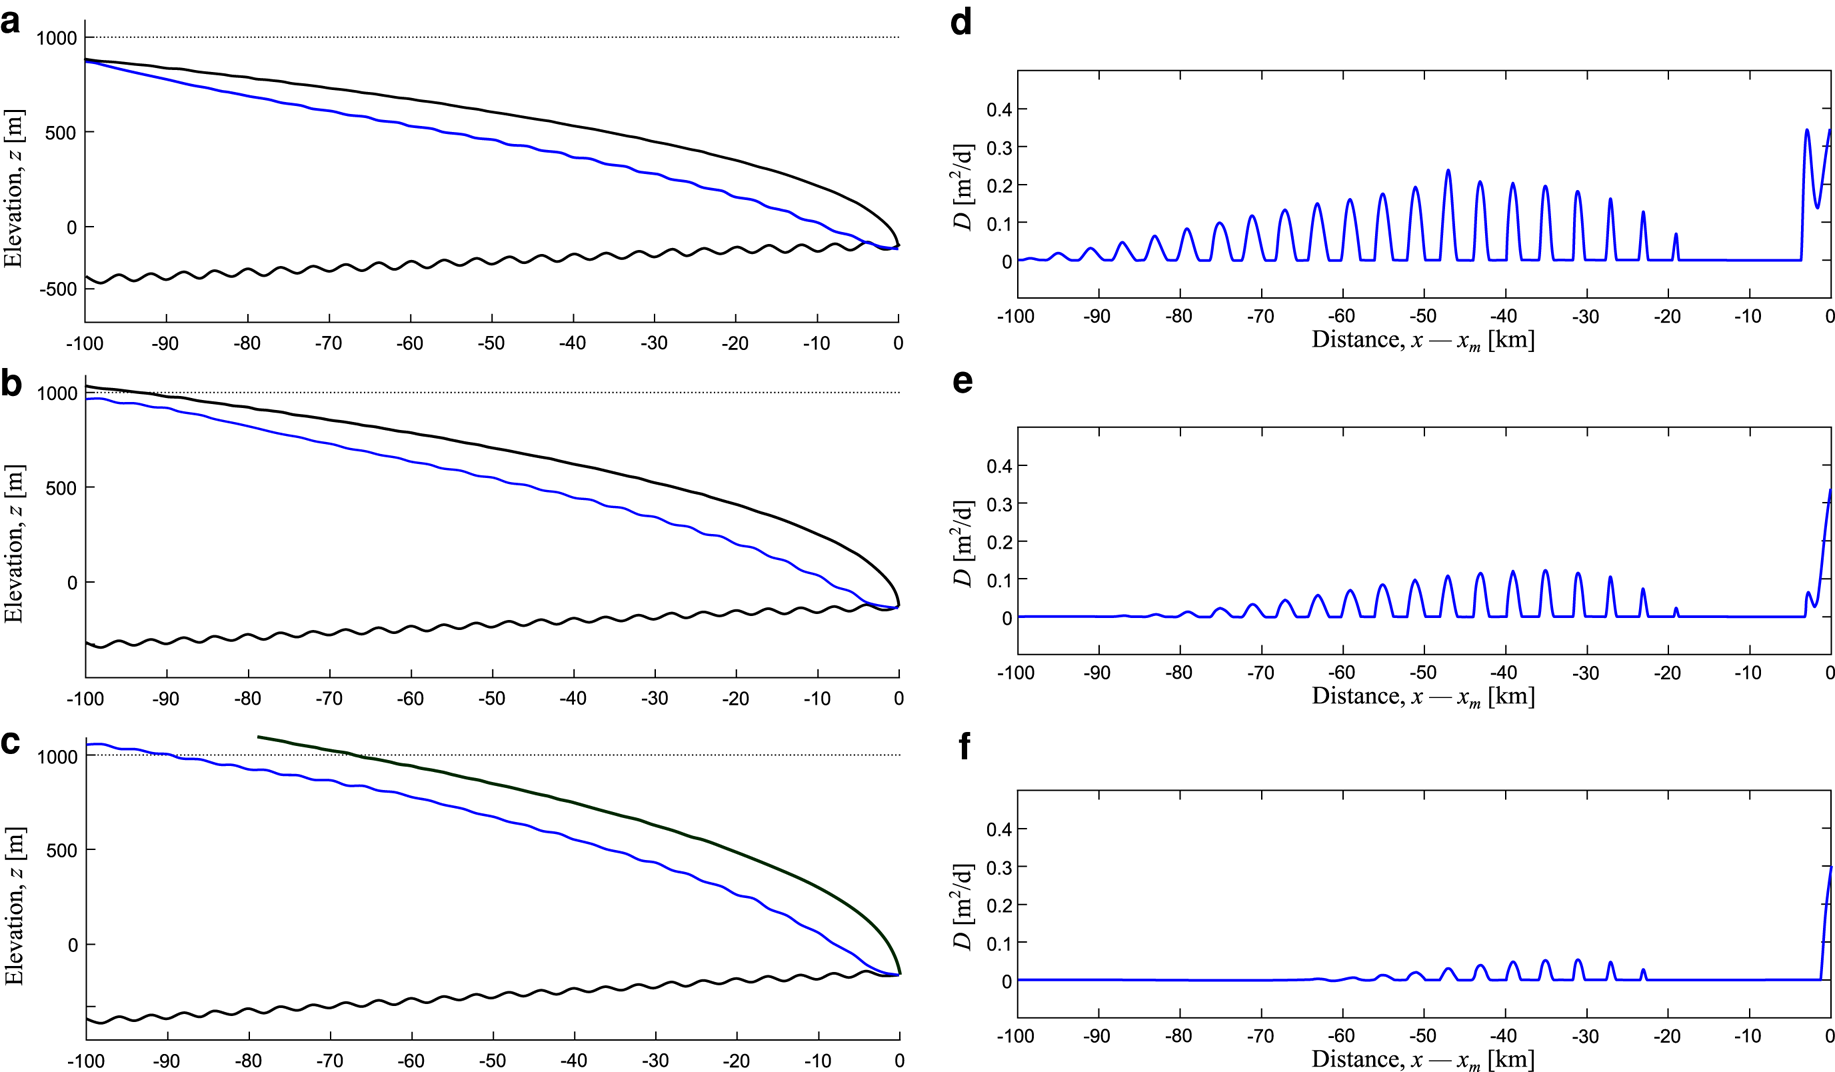
The ice surface slope and ice thickness also alter the pattern of deposition near the ice margin. A shallow ice profile creates a larger region of sediment deposition near the margin (Fig. 7d) compared to the steeper and thicker ice profiles (Figs 7e, f). However, the introduction of bed topography can alter the pattern of deposition. In the shallower ice-sheet profiles, sediment accumulates around the basal bump at 4 km from the ice margin (Figs 7d, e). This is absent from the steeper (thicker) ice profile (Figs 7c, f).
To explore further the effect of ice slope on sediment deposition within the channel we constructed an alternative ice geometry to the parabolic ice profile used thus far. Figure 8a shows a classical parabolic ice profile, which approaches an ice thickness of 1120 m at 100 km from the margin. In the alternative ice geometry, an equivalent ice thickness is reached closer to the ice margin (Fig. 8d). The alternative geometry has a steep ice front and then a shallow profile beyond 35 km from the ice margin. Rates of deposition are similar in the region 50–100 km from the ice margin (Figs 8c, f); however, it is evident that the greater ice thickness due to a steeper ice front suppresses deposition in the region 25–50 km from the margin (Fig. 8f). Examining the channel cross-sectional area highlights the primary effect of steeper ice slopes; channels are smaller, and thus tend to carry faster flowing water with a higher carrying capacity (for the same water flux) (Figs 8b, e).
Sediment deposition and channel width using two different ice profiles. The top panels (a and d) show the ice and bed geometry. The middle panels show the sediment flux. The bottom panels show the deposition rate. The left-hand panels show results from a classical parabolic profile (a, b, c). Results using an alternative geometry, with a steep ice margin and shallow interior, are shown in the right-hand panels (d, e, f). Note that both geometries have a similar maximum ice thickness.

4. Discussion
4.1. Summary and interpretation of results
Our model experiments show that variations in basal topography can influence the location and volumes of sediment deposited within a subglacial channel. The model predicts deposition far from the ice margin, and even occurring in response to small and gradual basal ridges. We find that deposition is expected across a wide range of geometric conditions, dependent upon the location of the basal topographic features in relation to the ice margin and the ice surface slope. This contrasts with the constant bed and surface morphology experiments of Beaud and others (Reference Beaud, Venditti, Flowers and Koppes2018a, Reference Beaud, Flowers and Venditti2018b) and Hewitt and Creyts (Reference Hewitt and Creyts2019), where all sediment deposition was concentrated at the glacier margin, resulting in esker formation.
The effects of basal undulations on sediment deposition are summarised in Figure 9. To understand the way that basal undulations effect sediment deposition rates we must examine the primary mechanisms driving deposition. In our model deposition occurs when the sediment supply exceeds the carrying capacity of the channel, and carrying capacity is strongly coupled to the cross-sectional area of the channel. Specifically, for a water flux Q and a channel cross-sectional area S, the carrying capacity (C) scales as:

(see Hewitt and Creyts, Reference Hewitt and Creyts2019, their Eqn (5)). Therefore, given a constant water flux, as the channel cross-sectional area grows, the carrying capacity drops rapidly and sediment deposition is more likely. The factors which influence growth and constriction of the channel are therefore critical. The rate of change for the channel cross-sectional area can be written as:

Here, k 1, k 2 and k 3 are positive constants, defined fully in Eqn (4) of Hewitt and Creyts (Reference Hewitt and Creyts2019), S is the channel cross-sectional area, N is the effective pressure, n is the exponent in Glen's flow law and D is the rate of deposition. ρ w and ρ i are the density of water and ice respectively, and β is a positive term that accounts for the pressure dependence of the melting point, typically taking a value ~0.5. Therefore, expansion or contraction of the channel works in opposition to both the bed gradient b x, and the ice surface slope s x.
Summary of the effects of basal topography on deposition and identified behaviour zones (not to scale). (a) Stylised overall model geometry. (b) Channel geometry and deposition over a subglacial ridge. Channel size decreases when going up a ridge, leading to increased water flux and sediment carrying capacity, inhibiting sediment deposition on the upstream of the ridge and summit. Channel size increases on the downstream side of the ridge, leading to sediment deposition. (c) Channel flow and deposition in response to crossing a subglacial trough. The same situation to (b) occurs in a reverse fashion. (d) Flow and deposition over small undulations. The response is the same as in (b) and (c), but we find that even small perturbations (2 m) can lead to sediment deposition. (e) A zone of no deposition occurs even if undulations, moderately sized ridges or troughs exist. The high carrying capacity, which prevents deposition, is due to downstream increases in water input and higher potential gradients imposed by the surface slope. We call this the flushing zone. Note that especially large basal relief can induce deposition. (f) In the submarginal zone, high deposition rates form eskers due to rapid channel enlargement close behind the ice margin.

For a typical ice surface profile we expect s x to be negative throughout the domain, and therefore the ice surface slope will work to grow the channel in the downstream direction. Close to the ice margin the ice surface slope will typically drop rapidly, leading to rapid channel growth and therefore a rapid drop in carrying capacity, resulting in the sediment deposition that will ultimately form an esker. In a similar fashion, a steepening of the bed-gradient in a downstream direction, such as on the downhill of a subglacial ridge, will further enhance channel growth leading to the potential for sediment deposition. Conversely, an increase in the reverse gradient of an uphill portion of the bed will work to shrink the channel, increasing the carrying capacity and reducing the chance of sediment deposition. Given the magnitude of the b x and s x terms in Eqn (2), we expect that a positive uphill gradient of magnitude roughly twice the negative surface slope will lead to a net contraction of the channel. This relationship between basal gradient and channel growth, and the resulting potential for deposition, are summarised in Figure 9.
Very far upstream, ~100 km from the ice margin, low volumes of water and high ice overburden pressures lead to narrow channels with minimal deposition (Fig. S4). A region of inhibited deposition also occurs from ~20 km upstream to the final 2–3 km near the terminus (Fig. 9e). Within this area, which we henceforth refer to as the ‘flushing zone’, suspended sediment is carried away by the channel. This is due to two factors. First, there is an increase in meltwater input to the channel from the ice surface, leading to higher water fluxes. Furthermore, the increased surface slope near the terminus increases the hydraulic gradient in this region. This latter factor is demonstrated by the experiment with a steep ice margin (Figs 8d–f) the effect of which is to increase the region of no sediment deposition.
In all the modelled scenarios, deposition occurs within the channel close (~5 km) to the ice terminus (Fig. 9f), in a submarginal position. Variations in the rates of submarginal deposition are strongly tied to ice surface slope. Gradual slopes allow deposition further upstream of the ice margin (Figs 7a, b). Conversely, steeper ice-surface slopes suppress submarginal sediment deposition (Figs 7e, f). Bed topography also influences the patterns of deposition in the submarginal zone, with deposition enhanced on the downstream side of subglacial undulations. This is especially the case when the ice surface slope is gradual (Fig. 7b).
Overall, our results broadly show three zones of differing behaviour, the exact dimensions and location of which alter according to ice surface slope. Further experiments are likely to show that these alter with differing sediment and water supply. First, the interior zone of sediment deposition (~100 to ~20 km from the ice margin; Figs 9b–d), where if basal topographic conditions are favourable, subglacial deposition within a channel can occur. Second, a flushing zone (~20 to ~5 km from the ice margin), where high water inputs and hydraulic potential gradients inhibit sediment deposition (Fig. 9e). In this flushing zone, only basal topographic features which have a high aspect ratio can induce sediment deposition (Fig. S1). Finally, a submarginal zone (~5 km from the ice margin towards the margin), where low confining pressures and hydraulic gradients lead to high rates of sediment deposition (Fig. 9f). Notably, these three zones are similar in characteristics and extent to those predicted by Boulton (Reference Boulton1996) to occur as a result of subglacial erosion and till transport. Therefore, glaciofluvial sediment transport is likely to enhance patterns in the distribution of sediment across the landscape caused by other subglacial processes.
It is important to note that, for consistency, the presented experiments are performed with a fixed sediment grain size and fixed mass fraction of sediment suspended within water. However, additional experiments altering the critical Shields stress for mobilisation of the sediment ($\tau _{\rm c}^\ast$ ) have been performed, and are presented in the Supplemental material (Fig. S5). Variation of the critical Shields stress in this manner can be conceptualised as a proxy for the transport of different sediment types. The experiments reveal that the same patterns of deposition occur for a wide range of $\tau _{\rm c}^\ast$
 , and that a very large increase in the critical Shields stress is required (around two orders of magnitude) to significantly affect the pattern of deposition. This suggests that the zones highlighted in Figure 9 may occur regardless of sediment type. Further work is required to confirm this.
4.2. Relevance for esker formation
That deposition is concentrated submarginally was demonstrated by Beaud and others (Reference Beaud, Venditti, Flowers and Koppes2018a, Reference Beaud, Flowers and Venditti2018b) and Hewitt and Creyts (Reference Hewitt and Creyts2019), who interpreted this to be a cause for esker formation. In their experiments, esker sections are progressively deposited as the submarginal zone migrates upstream during margin retreat. We note that in our experiments, the margin position is fixed in relation to the subglacial topography. Therefore, we can only account for the formation of one submarginal esker fragment, which may be preserved to form a longer esker ridge as an ice margin retreats. Despite these limitations, our results have some implications for understanding esker formation.
That low ice surface slopes increase the length-scale over which submarginal deposition within a channel can occur (and vice versa) is well examined by Beaud and others (Reference Beaud, Venditti, Flowers and Koppes2018a, Reference Beaud, Flowers and Venditti2018b) and Hewitt and Creyts (Reference Hewitt and Creyts2019). The relationship they found between the length of a depositional feature and ice surface slope, is replicated here. This is consistent with long esker systems associated with shallow ice-sheet slopes during ice retreat (e.g. Storrar and others, Reference Storrar, Stokes and Evans2014; Drews and others, Reference Drews2017).
The addition of topographic variations adds some complexity to the relationship between ice surface slope and submarginal deposition length. At a catchment scale, sediment deposition in the interior zone reduces the availability of sediment downstream for esker formation. Sediment sourced closer to the margin however, in the flushing zone, is likely to be transported to the submarginal zone to form an esker. The position of the boundary between the interior and flushing zones is dependent on ice surface slope, with shallower slopes reducing the size of the flushing zone (Fig. 8). Therefore, shallow ice slopes not only promote deposition in the interior zone, but reduce the size of the flushing zone.
When the ice surface slope is sufficiently shallow, basal topography within the submarginal zone can alter the spatial pattern of the rate of sediment deposition (e.g. Figs 5, 7b). Variations in bed gradient relative to ice flow have been invoked to explain changes in the morphology of esker crests, and predict zones of non-deposition at the crests of basal ridges (Shreve, Reference Shreve1985). Our results raise the potential that bed topography can also control esker occurrence and size. The model suggests that larger eskers form on downward gradients (e.g. Fig. 5d), while on uphill gradients opposed to ice flow sediment deposition is limited (Figs 5e, f), and potentially totally inhibited when the apex of the ridge is situated at the ice margin (Fig. 5h). Although not modelled here, such sediment-free conditions could lead to the incision of a channel into the stoss-side of a ridge. In reality, any relationship between esker morphology and bed slope is likely complicated by other previously suggested factors such as sediment availability (Thomas and Montague, Reference Thomas and Montague1997), speed of deglaciation (Stoker and others, Reference Stoker2021) and water availability (Boulton and others, Reference Boulton, Hagdorn, Maillot and Zatsepin2009). However, the described pattern of channels incised on the stoss-side of ridges trending into eskers on the lee side has been observed in Canada (Livingstone and others, Reference Livingstone2016) and on Mars (Butcher and others, Reference Butcher2020). The prevalence of this pattern awaits confirmation from a systematic study.
That the model shows that sediment can be deposited in a subglacial channel far (e.g. 50 km) from the ice margin (as summarised in Fig. 9) also raises the possibility of eskers forming upstream of the submarginal zone. If deposition within channels in the interior zone is of sufficient magnitude, it is plausible that sediment may build up to partially or completely block a subglacial channel, creating a ‘proto-esker’ beneath the ice sheet, and that might differ in characteristics to the typical and familiar submarginal esker ridges. To our knowledge, proto-eskers have not been observed beneath contemporary ice sheets. Whether such phenomena exist requires high-resolution imaging of contemporary ice-sheet beds. In existing ice sheets, the upstream extent of channelised drainage is rarely known and is likely to be limited by high overburden pressures, reduced melt and reduced hydraulic potential gradients (Davison and others, Reference Davison, Sole, Livingstone, Cowton and Nienow2019). Nonetheless, channels have been inferred under ~900 m thick ice ~50 km from the ice margin in Greenland (Chandler and others, Reference Chandler2021), and models show extensive meltwater drainage networks could extend hundreds of kilometres into the Antarctic ice sheet (Willis and others, Reference Willis, Pope, Gwendolyn, Arnold and Long2016). The preservation potential of any ‘proto-eskers’ formed in the interior zone is likely to be low, as without a change in ice dynamics or thermal regime, retreat is likely to cause migration of the flushing zone over a proto-esker feature, likely eroding any sediment that has previously been deposited. Nevertheless, our results raise the question of whether the eskers we observe on palaeo-landscapes are only formed in submarginal positions or whether some could also have been deposited deeper within the ice sheet. When reconstructing palaeo-ice masses (e.g. Storrar and others, Reference Storrar, Stokes and Evans2014; Livingstone and others, Reference Livingstone2015) only the submarginal position is usually assumed. However, the following scenarios may preserve proto-eskers: (1) a switch to cold-based ice, which is known to preserve delicate landforms (e.g. Kleman, Reference Kleman1994); (2) a persistently low surface slope, or a sufficiently large bed perturbation could promote conditions where deposition occurs throughout periods of margin retreat and (3) the subglacial channel may migrate, leaving behind a remnant proto-esker. Therefore, in rare cases, retreat may preserve eskers formed far from the ice margin, within the interior zone. A further implication of the presence of the flushing zone is that it likely precludes the preservation of eskers should be an ice mass advance over its immediate forefield. Other glacial erosion processes also likely limit the preservation potential of eskers during ice-sheet growth. In the context of an advancing ice margin, sediment deposited submarginally will be overridden by the flushing zone. Future transient model runs will be used to model how the boundaries between these zones change during advance and retreat, rates of sediment entrainment, fluctuations in water pressure and to test the potential for esker preservation.
4.3. Implications for the subglacial environment
That deposition can happen far from the margin of an ice mass potentially has implications for the mechanics of the subglacial environment and other subglacial phenomena. If subglacial sediment is unable to escape the interior zone of subglacial deposition, it is plausible that over time sediment may accumulate. A potential mechanism for this is the partial or complete blockage of a subglacial channel, which then avulses. Avulsion of fluvial channels is common on deltas (e.g. Jones and Schumm, Reference Jones and Schumm1999) and has been interpreted to occur within esker systems (e.g. Gorrell and Shaw, Reference Gorrell and Shaw1991; Burke and others, Reference Burke, Brennand and Perkins2012). Furthermore, clogging of subglacial channels has been suggested to occur on a diurnal timescale (Perolo and others, Reference Perolo2019). Channel abandonment may route water in a different direction downstream, altering the subglacial meltwater dynamics and allowing the channel to access new areas of the bed.
Over time, if sediment builds up in the interior zone it may be compacted and stored, creating depocentres of sediment, which could be subjected to other processes such as till deformation (e.g. Boulton and Jones, Reference Boulton and Jones1979; Alley and others, Reference Alley, Blankenship, Bentley and Rooney1987). Given their low surface slopes, and abundance of low amplitude relief in the form of subglacial bedforms (e.g. Spagnolo and others, Reference Spagnolo2014), regions of an ice stream within the interior zone are likely to be candidate depocentres. Other candidates include the lee sides of large subglacial ridges far from the ice margin (e.g. Fig. 3). If deposition is concentrated around the lee side of hills far from the ice margin, as opposed to the 2-D ridges considered by our model, these may be streamlined into crag and tails. These depocentres impede the transit of sediment towards the margin, and may lead to pulses of sediment transport due to changing water pressures imposed by a number of transient effects such as margin retreat and surface meltwater drainage.
In reality, time-variant conditions are likely to lead to changes in the availability of water and the spatial extent of the three zones of channel behaviour. Such changes are yet to be included in our model. On seasonal timescales, increases in water flux during the melt season may lead to migration of the flushing zone upstream, potentially entraining sediments accumulated around topography. In winter, less water could lead to increased storage of sediment around topography. Such winter storage has been inferred from observations (e.g. Harper and others, Reference Harper, Humphrey and Greenwood2002; Riihimaki and others, Reference Riihimaki, MacGregor, Anderson, Anderson and Loso2005; Delaney and others, Reference Delaney, Bauder, Werder and Farinotti2018). On interannual timescales, differences in climate will lead to changes in the ablation zone extent, altering the amount of water delivered to the bed. The full influence of changes to climate, margin retreat and time-varying water inputs upon rates of proglacial sediment delivery requires the development of a transient model, which accounts for diurnal, seasonal and interannual timescales.
5. Summary and conclusions
We have used a mathematical model, developed by Hewitt and Creyts (Reference Hewitt and Creyts2019), to investigate the effect of variations in basal topography and ice surface slope on the deposition of sediment within subglacial channels. Unlike previous studies, which for flat beds showed that all sediment within a subglacial channel is transported down-glacier to build a submarginal esker (Beaud and others, Reference Beaud, Flowers and Venditti2018b; Hewitt and Creyts, Reference Hewitt and Creyts2019), our experiments show that basal topography can promote sediment deposition within a channel far from the ice margin. Consistently, three zones of behaviour are observed in the model results. Their precise location and magnitude of deposition varies under different surface slopes and is dependent upon the size of basal topographic perturbations. In the interiors of our modelled ice sheets (~20–100 km from the ice margin), even very small and gradual changes in basal topography (bumps of ~5 m amplitude with 2 km width) can induce sediment deposition. Closer to the margin (~20–3 km from the ice margin), a ‘flushing’ zone exists, where only extremely large amplitude changes in basal topography can induce sediment deposition. Finally, sediment transported to within ~3 km from the margin is deposited as a submarginal esker. The magnitude and extent of submarginal deposition is also altered by basal topography. In cases where the apex of a ridge is positioned at the margin, esker formation can be inhibited entirely. Although this spatial pattern remains broadly similar with different ice surface slopes, deposition rates increase beneath shallower and thinner ice profiles. Thick and steep ice profiles dampen the impact of basal topography on deposition within the modelled subglacial channel. These findings have implications for our understanding of esker formation, suggesting that eskers are more likely to form on the lee side (downhill portion) of subglacial ridges, as well as the downhill portions of subglacial troughs. Furthermore, there is the potential for ‘proto-esker’ formation within the interior of an ice sheet, although the preservation potential of such features is likely low. The three observed zones of deposition within a channel are similar to those expected from other glacial processes (erosion and till deformation), suggesting that glaciofluvial sediment transport augments the ice-sheet scale patterns of erosion and deposition.
Supplementary material
The supplementary material for this article can be found at https://doi.org/10.1017/jog.2022.71
Acknowledgements
This project has benefited from the PALGLAC team of researchers and received funding from the European Research Council (ERC) to CDC, and supporting DS and FEGB, under the European Union's Horizon 2020 research and innovation programme (Grant agreement No. 787263). JCE was funded by a NERC independent fellowship award (NE/R014574/1). The authors thank the editors, Flavien Beaud and two anonymous reviewers for their constructive comments on the manuscript.


 Open access