


INTRODUCTION
Gastroenteritis due to infection remains a common illness in both underdeveloped and developed countries. Children are especially vulnerable and the rate of gastroenteritis in those aged <5 years in underdeveloped countries is estimated at 3·2 episodes per child-year [Reference Kosek, Bern and Guerrant1]. Children aged 6–12 months have the highest rate of disease with a median of 4·8 episodes per child per year. The consequences of gastroenteritis can be serious, especially in young children and the elderly, with infectious diarrhoea accounting for over two million deaths each year [2]. The illness is usually well managed in developed countries and deaths are uncommon but gastroenteritis still causes a considerable burden in terms of lost productivity and cost [Reference Mead3, Reference Hall4]. The estimated incidence of all infectious gastroenteritis in USA, Canada and Australia is around one case per person per year [Reference Scallan5].
The cause of gastroenteritis is unknown in most people even in developed countries. In cases where a pathogen is found, the most commonly identified pathogens include bacteria (e.g. Salmonella and Campylobacter), viruses (e.g. rotavirus and norovirus) and parasites (e.g. Giardia, Cryptosporidium). Many pathogens show seasonality of infection but the pattern varies. Peak rates have been noted in winter (rotavirus), summer (Salmonella) or spring (Campylobacter) [Reference Kovats6–Reference D'Souza, Hall and Becker8]. Salmonella and Campylobacter rates are higher in younger children although they occur fairly frequently at all ages [Reference Thapar and Sanderson9]. The pathogen mix varies by age group with some pathogens like rotavirus making up most of known pathogens in young children, while they form only a small proportion of known cases in adults [Reference Thapar and Sanderson9]. Studies in different parts of the world have found a relationship between various types of gastroenteritis and underlying seasonal temperature and rainfall changes [Reference Kovats6, Reference Kovats7, Reference Singh10–Reference Lake14]. However, the pathways underlying variation in seasonal rates are not well understood.
Gastroenteritis is caused by transmission of pathogens from other people, animals, water or food, with the proportion of illness occurring via each route varying across pathogens. Local weather conditions can potentially influence the risk of gastroenteritis in humans by affecting proliferation and carriage of pathogens in the local environment – in locally produced or contaminated food or water, or directly from animals or the general environs [Reference Haley, Cole and Lipp15]. Weather can also affect human behaviour, which in turn can influence the risk of acquiring gastroenteritis, such as through increased exposure to animal droppings by camping or eating outside [Reference Ashbolt and Kirk16] which is more likely in warmer weather. Other seasonal factors apart from weather can also impact on risk of gastroenteritis, such as eating particular foods or engaging in certain activities at holiday times that lead to increase risk through increased exposure to pathogens.
In Australia as elsewhere, gastroenteritis is a common problem and there are an estimated 17 million cases of gastroenteritis annually (defined as three loose stools or two vomits in 24 h) [Reference Hall4]. Australia spans a wide range of latitudes and there is variation in weather patterns from hot and wet in the north, to dry inland, and to cooler temperatures in southern regions. Both seasonal patterns and a latitudinal gradient of rates of illness have been noted for certain pathogens. For example, mandatory notifications of Salmonella show that it is more common in late summer and in the hotter Northern Territory [17]. However, factors other than weather can also vary across the country. There is a different demographic pattern in the most northern areas where a greater proportion of the population are Indigenous (over 25% in Northern Territory) compared to about 2% in the country as a whole [18]. In addition, socioeconomic status and community facilities for sewerage and water supply may be poor in some northern areas, which may confound any apparent correlation between weather and infectious diarrhoeal disease.
The national survey of gastroenteritis in Australia in 2001–2002 found that overall there was a higher incidence of gastroenteritis in summer across the whole country, and in the Northern Territory across the whole year, suggesting that spatial and temporal weather patterns may be a causal factor [Reference Hall19]. The survey also collected information on socioeconomic status. In this study we use data collected from this survey to explore the relationship between gastroenteritis and localized spatio-temporal variations in temperature and rainfall in Australia, while controlling for socioeconomic status. The objective was to quantify any relationship between localized climatic factors and diarrhoeal illness.
METHODS
Survey design
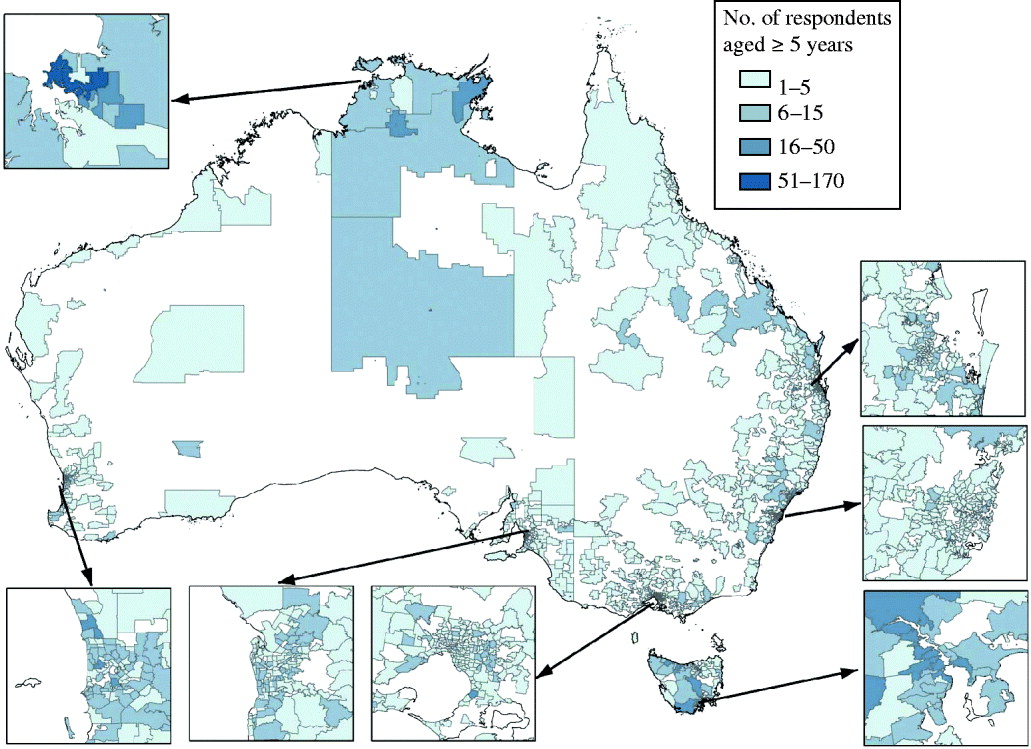
Data on gastroenteritis were acquired through a national computer-assisted telephone survey conducted from September 2001 to August 2002. A stratified random sample was drawn of over 800 households in each state. The spatial distribution of the households is shown by postal area in Figure 1. There were more households sampled in densely populated capital cities in each state with lower numbers in rural areas since the sample was a random selection in each state. The size of the postal areas varies considerably with large areas in central regions and small areas in urban localities.
Distribution of respondents by postal area.
Households were selected by random digit dialling, and the respondent was selected to be the person in the household with the next birthday. The response rate for those households that were contacted and eligible was 68% and interviews were completed with 6087 respondents. Of these, 322 children aged <5 years were excluded for the analysis in this study as different pathogens and seasonality are to be expected in this group. Respondents were asked about episodes of being sick with vomiting or diarrhoea in the 4 weeks prior to interview. For those with chronic illness with diarrhoea, the episode had to be different from their usual pattern. The postcode of the household and date of onset of episodes were recorded. Information was also collected on age, sex, education level, household income, health insurance status (private or not), and Indigenous status. The case definition of gastroenteritis was three loose stools or two vomits in 24 h. There were 677 respondents who met this definition of gastroenteritis of whom 618 had complete data on postcode and date of onset. More details on the survey methodology and the other information that was collected are given elsewhere [Reference Hall20].
Weather data
Weather data were obtained from the Bureau of Meteorology for average daily temperature, daily rainfall and relative humidity during the time of the gastroenteritis survey and for 90 days prior to commencement of the survey. Data were from all weather stations operating at the time that were within 50 km radius of the centroid of the Australian Bureau of Statistics ‘census collectors’ districts. The data were aggregated at the census collector's district level and subsequently at the postal area level (approximating postcodes), using a technique that weights data from different weather stations according to population density. Details of the methodology are given elsewhere [Reference Hanigan, Hall and Dear21].
The gastroenteritis survey data were arranged with each of the respondents contributing up to 28 days of data. For each day, the respondent either had no gastroenteritis, or had onset of gastroenteritis (first day of gastroenteritis). Where gastroenteritis occurred, the days after the onset of gastroenteritis were censored. Weather data were merged with the gastroenteritis survey data at the daily postal area level. Weather data were incomplete for a few respondents, and the final dataset contained 5670 respondents, 536 cases and about 158 000 person-days of data.
Descriptive seasonal and spatial analysis
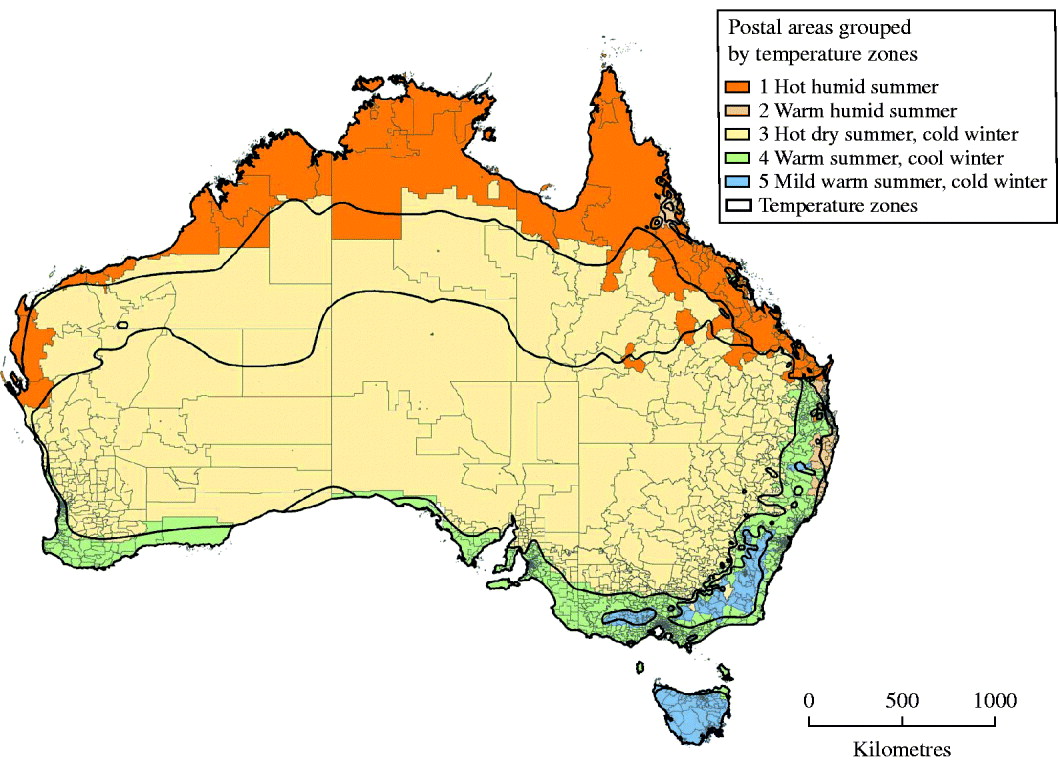
To examine the spatio-temporal pattern of gastroenteritis over the observation period, data were examined by five temperature climatic zones. These were based on six zones described by the Bureau of Meteorology with two zones in Central Australia with hot dry summers coalesced into one [22]. The five zones are: hot humid summer; warm humid summer; hot dry summer; warm summer cold winter; mild warm summer cold winter. These zones are shown in Figure 2.
Postal areas mapped to the six temperature zones in Australia (two zones in Central Australia were merged into one).
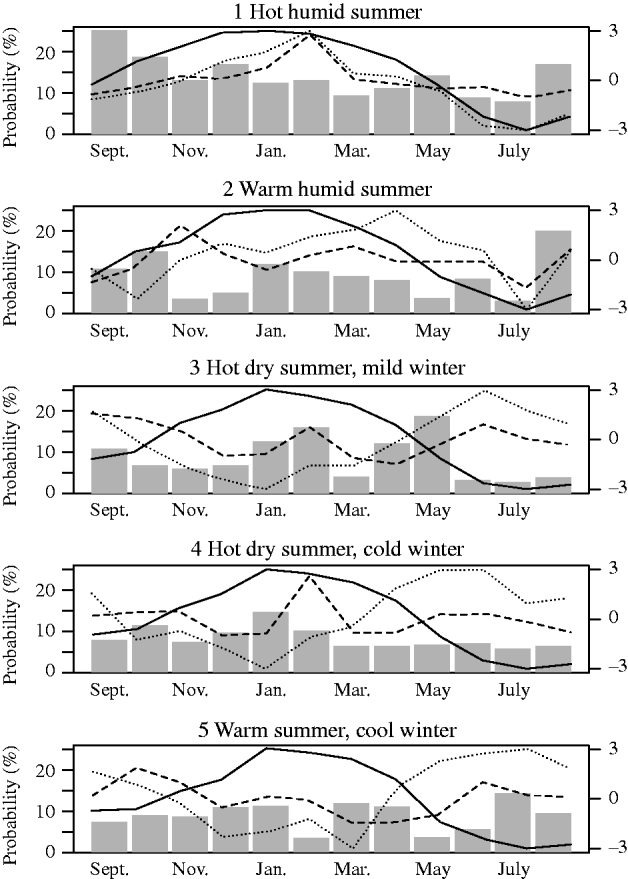
The proportion of respondents interviewed in that month who had gastroenteritis in the preceding 28 days was graphed in each of the five temperature climatic zones. The average monthly temperature, rainfall and relative humidity were then plotted on these graphs (Fig. 3).
Monthly percentage of respondents with gastroenteritis and average monthly temperature (—), rainfall (- - -) and relative humidity (······) in the survey postal areas 2001–2002, by climatic zone (weather variables are plotted with normalized weather on the secondary y-axis as the magnitude changes between zones and parameter).
Model for testing the association between local climatic factors and gastroenteritis
Associations between local ambient temperature, rainfall or relative humidity in the recent past and the development of gastroenteritis were examined using survival analysis (Cox proportional hazard model) in respondents aged >5 years. Each respondent contributed 28 days of outcome data; subjects who had an episode were deemed to have ‘failed’ at the first day of onset, while subjects who had no episodes were censored at 28 days. Individual variables were tested for statistical significance in the models using Wald tests. When comparing models, the likelihood ratio test was used if the models were nested and Akaike's Information Criterion (AIC) was used to test comparative models containing different explanatory variables that were not nested. Statistical significance was set at P<0·05 to assist with the model-building process.
To control for sociodemographic factors, an initial model was run containing the following variables: age, sex, education level (at least year-10 high school vs. less), household income (<$50 000/yr or more than), private health insurance (yes/no) and Indigenous status (yes/no). Statistically significant variables were then retained in all further models.
Categorical variables for climate zone and season were constructed in order to allow for effects due to season or zone other than temperature and other weather variables that might influence gastroenteritis.
Postal areas were mapped and aggregated to the six climatic zones based on their population weighted centre and the result is shown in Figure 2. The four seasons were based on the dates of the 4-week period of interest regarding onset of gastroenteritis (or not) for each respondent. The season for each day of analysis was categorized as spring (September–November), summer (December–February), autumn (March–May) or winter (June–August).
Distributed lag modelling
To assess the influence of local daily weather over time on the onset of gastroenteritis, time-varying covariates were constructed representing the weather in each postcode for up to 90 days preceding each of the 28 days of interest for each respondent. The effects of these lagged variables were assessed using polynomial distributed lag models, modified to impose continuity with the assumption of no effect beyond a chosen extent of lag effects [Reference Dear23]. These models allow a distinct effect at each lag, but constrain the effects to lie on a polynomial curve to avoid collinearity and overparameterizing the model [Reference Schwartz24]. Polynomials with 2, 3 and 4 degrees of freedom (d.f.) in each variable were explored as follows.
We allowed X i to represent a variable X at lag i, for i=0, 1, …, 90. Then instead of the model including 91 separate terms of the form βiX i, we constrained the parameters βi to lie on a polynomial of the form (for the 3 d.f. model):

This polynomial was designed to have both value zero and slope zero at lag 91, 1 day beyond the maximum lag considered in the models. The model is fitted by including constructed covariates U j to represent temperature:

We assessed the possibility that the temperature effect was curved at each lag within a constrained distributed lag model by modelling a 2–4 d.f. natural spline basis in place of linear terms in temperature X. We explored the constrained lag-modelling strategy by fitting a series of models, using a 2 d.f. spline of temperature in a 3 d.f. polynomial lag structure, constrained at weekly intervals up to 90 days, and then at each day near the optimum. We used AIC to select the optimal lag at which to constrain the effect estimate polynomial to zero. The choice of degrees of freedom of the spline of temperature was then checked in the constrained 3 d.f. polynomial lag structure by comparing models from spline of 4 d.f. to 1 d.f.
Selection of final model
While holding the statistically significant sociodemographic variables in all models, a series of models were explored to examine the relationship between temperature, zone and season with gastroenteritis. As well as accounting for possible influences relating to season or zone other than weather, the terms for climate zone and season also both contain information on temperature and other weather factors. A high degree of correlation is therefore to be expected between the local temperature variable and these categorical variables. Zone and season were first modelled separately from the temperature distributed lag polynomial and then together with the temperature polynomial, and the models were compared. The explanatory variables in each model are listed below:
Model 1: Season and zone,
Model 2: Temperature,
Model 3: Season, zone and temperature,
Model 4: Season and temperature,
Model 5: Zone and temperature.
Interactions were explored between the temperature polynomial and zone and season, and between temperature and sociodemographic variables. The variables for rain and relative humidity were explored in a similar way to the temperature variables.
Finally, variables that were statistically significant in any of the above five models were put into a combined model. Variables that remained statistically significant in the combined model were retained as the final model. The model fit of the largest possible model with all weather, zone and season variables was then compared with the final parsimonious model. Confidence intervals (CI) are at 95%. Analysis was done using Stata 9.2 [Reference Statacorp25].
RESULTS
Spatial and seasonal distribution of gastroenteritis
The probability of gastroenteritis in each temperature climatic zone is shown in Table 1. There is a higher percentage of cases in the northern zone of Australia where the temperatures are higher and the summers are wet.
Probability (%) of gastroenteritis by temperature/humidity zone
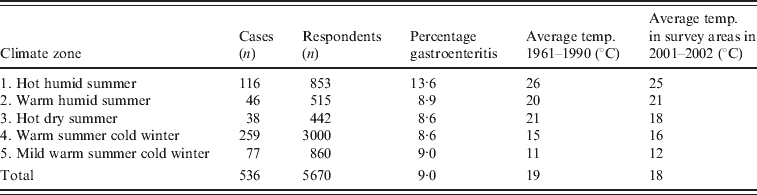
Figure 3 shows the monthly incidence of gastroenteritis for the period September 2001 to August 2002 in each of the five climatic zones along with monthly average temperature, relative humidity and rainfall.
Rainfall is higher in northern Australian (zone 1) and peaks in summer. By comparison, rainfall is more evenly distributed over the year in the other zones and is considerably less in central Australia (zone 3), eastern coastal areas (zone 4) and mountains in the south (zone 5). The northeastern coastal region (zone 2) has intermediate rainfall. Temperatures are higher in summer (December–February) in all zones. Overall temperatures are highest in the north (zone 1) at about 25°C, decreasing as the zones become more southerly to about 12°C (zone 5). Relative humidity shows most seasonality in the central region (zone 3) where it drops in summer. Other regions remain at around 70% for the whole year.
The probability of gastroenteritis in the previous 4 weeks was highest in northern Australia (zone 1) ranging from about 7% of respondents in winter to 25% in early spring (August–October) when temperatures start to rise. The probability of gastroenteritis did not continue to rise through the summer months. Zone 2 also had higher rates in spring while zones 3 and 4 had higher rates in summer (January). These descriptive statistics suggest that the potential relationship between weather and gastroenteritis may vary across climate zones.
Controlling for sociodemographic status
The dependence of risk on age in years was best modelled as a linear term plus a square-root-transformed term. Age, sex and health insurance were statistically significant, and were held in all further models used to assess the influence of weather on the outcome of gastroenteritis. Indigenous status, income and education level were no longer statistically significant when the other sociodemographic variables were in the model, and so were dropped.
Distributed lag models
A statistically significant association was found between temperature as a distributed lag model with 3 d.f. and the outcome of gastroenteritis, while the variables for rain and relative humidity were not statistically significant in any form, or as any distributed lag polynomial. The model fit for temperature was best when the polynomial was 3 d.f. (AIC 8915·01 compared to 2 d.f., AIC 8918·37). The range of average daily temperatures included in the model was from −2°C to 36°C. In comparing the extent of the temperature-distributed lag function, constraining to zero at day 8 was optimal (Fig. 4).
Akaikes Information Criteria (AIC) for models constrained at 3–15 days. Optimal model found with maximum lag at day 7 (constrained to zero at day 8).
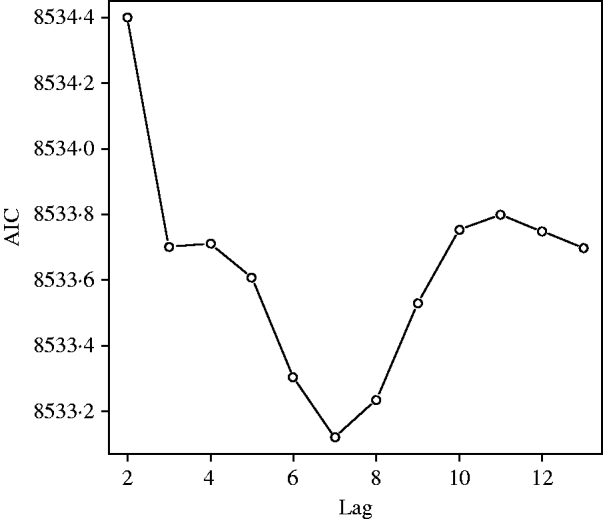
In testing natural spline temperature response functions to assess if the temperature effect was curved at each lag, none fitted the data significantly better than a straight line model. The likelihood ratio test statistic comparing 2 d.f. with a straight line was 1·54 (P=0·67). The temperature effect was therefore modelled as a 3 d.f. polynomial distributed lag model constrained to zero at day 8, with a straight line temperature response function at each lag.
Models 1–5 were constructed while controlling for the sociodemographic variables for age, sex and health insurance. The influence of sociodemographic factors are explored more fully elsewhere [Reference Hall19]. When zone and season were in a model together (model 1) without temperature, both variables were statistically significant and AIC was 8918·78. When temperature was in a model without zone and season (model 2), this variable was highly statistically significant (P<0·001) and AIC was 8915·01. When all three variables were in a model together (model 3), none were significant suggesting a high degree of correlation between the variables, and AIC was 8921·30. When temperature was in a model with either season (model 4) or zone (model 5), temperature was significant and zone and season were not. Interaction terms were explored and no interaction terms involving season or zone gave a model with a better fit. The temperature model (model 2) had the lowest AIC indicating the best fit and was therefore adopted as the final parsimonious model with explanatory factors of age (linear and square root terms), sex, health insurance, and temperature as a 3 d.f. polynomial distributed lag model constrained to zero at day 8. The effect of temperature over the 8 days in this model is shown in Figure 5.
Distributed lag effect: hazard ratio per °C with 95% CIs (constrained lag model at day 8), controlling for sociodemographic factors.
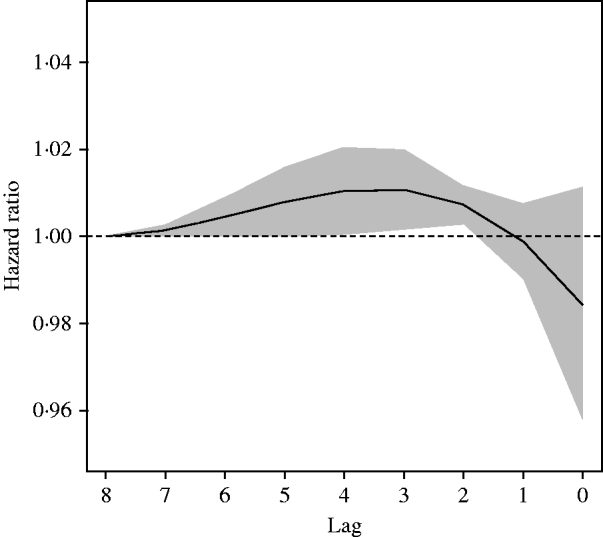
The effect at day zero (i.e. day of onset of gastroenteritis) is negative but the 95% CI there includes the value of no effect [hazard ratio (HR) of 1]. The temperature effect is highest on days 2–5 where the HR is about 1·01 (1% increase relative to baseline) per °C for any one day. The cumulative effect across the 8 days gives an HR of 1·0248 or an increase of 2·48% (95% CI 1·01–3·97) relative to the baseline probability of gastroenteritis. That is, for a 1°C rise in temperature maintained for 8 days, there is a 2·48% increase relative to baseline in the probability of diarrhoea on the eighth day. For an increase in temperature of 5°C, the relative risk (HR) is (1·0248)5 or 1·13, an increase of 13% from the baseline probability of gastroenteritis. The same modelling process was repeated for rainfall and relative humidity. Neither of these variables were statistically significant in any model.
DISCUSSION
The average cumulative incidence of gastroenteritis over a 4-week period in those aged >5 years was over 50% higher in northern Australia in the hot and humid climatic zone (14%) compared with other climatic zones (~9%). While controlling for socioeconomic status, a statistically significant positive association was found between the probability of onset of gastroenteritis and local temperature, but no association was found between gastroenteritis and rainfall or relative humidity. There was no statistically significant interaction between temperature and climate zone or season, suggesting that the effect of temperature in the preceding week does not vary greatly by location or season. The temperature effect was highest on days 2–5 prior to the day of interest and the cumulative effect across eight previous days was 2·48% (95% CI 1·01–3·97). That is, for every 1°C rise in temperature across the 8 days, there was a 2·48% increased risk of gastroenteritis and for a 5°C rise across the 8 days we would expect a 13% increased risk of gastroenteritis. Given the very large total burden of gastroenteritis of over 15 million episodes per year in people aged >5 years in Australia [Reference Hall20] this suggests a large potential effect in this population. For average baseline days of about 41 000 cases, there could potentially be over 5000 extra cases following a 5°C rise sustained over 8 days.
Within the outcome of total gastroenteritis episodes, there are many different viruses, bacteria and parasites that cause infectious gastroenteritis – some common pathogens in Australia include norovirus, rotavirus, Giardia lamblia, Cryptosporidium, pathogenic E. coli, Campylobacter jejuni and Salmonella spp. [Reference Hall4]. The types of pathogens are likely to vary in different parts of the world and each pathogen has its own properties, preferred habitat and possible modes of transmission to humans. Each can be expected to have its own unique association with climatic variability as temperature and other weather variables can impact differently on the replication and survival capacity of different microorganisms in different environments. For example, rotavirus is thought to be primarily spread via person-to-person contact and this virus causes a winter seasonal peak in human illness [Reference Parashar26]. Increased temperatures are likely to have a different effect on rotavirus compared to the rates of Salmonella and Campylobacter gastroenteritis that have peak numbers in summer and spring, respectively, and are thought to be largely foodborne [Reference Kovats6, Reference Kovats7, Reference D'Souza12].
A number of studies have quantified the relationship between temperature, humidity, rainfall and specific types of diarrhoeal disease incidence across the world. For example, increased rates of Salmonella and Campylobacter infection have been consistently associated with increased temperatures [Reference Kovats6, Reference Kovats7, Reference D'Souza12, Reference Lake27]. By contrast, rates of rotavirus hospitalizations in Australian children decrease with raised temperatures [Reference D'Souza, Hall and Becker8]. These examples demonstrate that it is not reasonable to extrapolate the effect of changed temperatures from one pathogen to another. However, estimating the effect of climatic variability on the outcome of all gastroenteritis has the potential to increase our understanding of the possible effect of climate change on the total burden of diarrhoea although this may well be context specific, depending on the mix of pathogens found in an area. Given the different pathogen patterns among children compared with adults it is also sensible to consider these two groups separately.
The relationship between all-cause diarrhoea and climatic variables has been examined in a few studies elsewhere using different methods and data with various strengths and weaknesses [Reference Singh10, Reference Checkley11]. The data in this study are from a survey that allowed for control of sociodemographic factors but has the potential for bias as it relied on a recall period of 4 weeks. However, a sub-study with a recall of 2 weeks suggests that the longer period was not a major cause of bias compared with the shorter period [Reference Hall20]. Consistent with the findings in this Australian study, a positive association was found between temperature and diarrhoea in other studies also. In a study in Peru, hospital admissions for diarrhoea in children increased by 8% for each 1°C rise in mean temperature and there was an added El Nino effect [Reference Checkley11]. In a Fiji study, reported diarrhoea episodes in adults were associated positively with monthly temperature and extremes of rainfall over a 20-year period [Reference Singh10]. In this Australian study we have used daily local postal area data which implies that interpretation of effect should be at this localized level also. The distributed lag model gave a temperature effect spread over a week which is consistent with local acquisition of the microorganism and a plausible incubation period. As the categorical variables for season and zone were not in the final model, the results should be interpreted as the effect of several days actual local temperature, not as the effect of a temperature difference over and above a variation from an average. It is possible that variations in temperature over time and place could be correlated with some other variation that occurs with seasonality or location that is not related to temperature and causes gastroenteritis. However, this seems unlikely given the combined spatio-temporal effect, the fact that temperature gave a better model fit than the variables for season and zone and the biological plausibility of temperature as a factor that could increase pathogen loads that humans are exposed to. The localized nature of the data are consistent with increased temperatures causing increases of some microorganisms in the local environs or animals, or of local temperature having an effect through inadequate local food handling or increased exposure due to changed human behaviour.
While this study demonstrates short-term effects operating at a local level, these results are still very relevant to climate change. The results suggest that hotter localized weather over a week, a scenario that is likely to be more common with climate change, is likely to increase gastroenteritis unless we adapt to counteract this. The variation by temperature while controlling for socioeconomic status suggests we have not currently ‘adapted’ to keep gastroenteritis risk the same across different locations and times that vary by temperature, even within a wealthy country like Australia. Much attention has been focused on malaria and vectorborne diseases; however, gastroenteritis is linked with a considerable global burden of disease, and as shown in this study and others, is also sensitive to variations in climate. These data suggest that projections of increased temperature and changing climate conditions are likely to affect the distribution and incidence of infectious gastrointestinal disease. The association between climatic variability and gastroenteritis may well vary in different parts of the world given the probable different mix of pathogens, and different methodologies to determine associations may also lead to the need for care with interpretations. However, given this caveat, these data may be useful to assist in predicting changes in incidence in gastroenteritis with increased temperatures under climate change [Reference Bambrick28]. Those populations already at highest risk of gastroenteritis are likely to be the most affected by climate change unless adaptive strategies are undertaken.
ACKNOWLEDGEMENTS
We are grateful to OzFoodNet of the Australian Department of Health and Ageing who funded the gastroenteritis survey and the Australian Government Bureau of Meteorology for providing the climate data.
DECLARATION OF INTEREST
None.



