


1. Introduction
Modern economic thinking has come down to the side of Milton Friedman’s view, that inflation is a monetary phenomenon and, as such, there has been a move over the past number of decades towards giving central banks explicit responsibility for meeting an inflation target. For many European countries, a strong motivation for joining the euro was the dissatisfaction with the inflation performance that had been delivered by their national central banks during the 1970s and 1980s. With the European Central Bank (ECB) having an institutional structure that resembled that of the Bundesbank, many states joined EMU with an expectation that the ECB would deliver low and stable inflation rates to all participating member states.
The recent financial crisis and its strong impact on several Euro area countries with higher inflation rates have strengthened this interest, especially in the light of the ECB’s objective of price stability. Since 1999, the ECB has clearly stated that Euro Area inflation should be maintained below, but close to, 2 per cent in the medium run. The Economic and Monetary Union (EMU) is an essential tool used by the European Union (EU), which aims toward progressive lives of Euro-countries. Accordingly, the EMU’s main objectives are price stability, sustainable growth and positive low inflation at 2 per cent (ECB, 2005). If these objectives are achieved, the expectations of inflation will be low, as a result of ECB’s credibility and, consequently, will improve market integration, investment and competitiveness of the Euro-countries. However, starting from the introduction of the euro currency up to now, the differentials of inflation among these countries have been persistent due to the temporary supply and demand shocks, which is associated with a constant high level of inflation. ECB is EMU’s monetary authority that has a single monetary policy, which may not be appropriate for every country, according to some experts (De Grauwe, Reference De Grauwe2020; Tomann, Reference Tomann2017). Thus, there is a tendency for an additional increase in inflation to those who are already experiencing a high inflation, and a further decrease in inflation to those who have already an inflation below the target level.
Overall, the ECB has done well in delivering the promised low rates of inflation. However, it has still been the case, that there are often significant deviations in the inflation rates prevailing across different euro-area countries. This is not the fault of the ECB, as it has neither the mandate nor the tools, to deliver the same inflation rate to each member state. In relation to its mandate, monetary policy can act to complement or counteract the other forces that influence aggregate demand in a region, such as fiscal policy and credit conditions. This should allow it to set monetary policy in a way, that generally achieves its medium-term price stability goals in the euro area, by correctly matching aggregate demand with the economy’s aggregate supply capacity. However, if fiscal and financial conditions vary across member states, then it is likely that inflation rates will also vary, with the euro area experiencing periods of systematic variations in inflation across countries, most notably between core and periphery countries.
As highlighted by the Optimum Currency Area literature, large inflation differentials may undermine the success of a monetary union. Differences in inflation rates can be caused by temporary asymmetric shocks, such as demand shocks, but the ability to deal with these impacts is limited in the absence of a national monetary policy. Inflation differentials cannot be corrected by nominal currency depreciation of high-inflation countries. Although countries may use expansionary fiscal policy to solve the problem of deflationary shocks, this could lead to a violation of the Stability and Growth Pact, with negative effects on the euro area financial markets (Honohan et al., Reference Honohan, Lane, Ventura and Begg2003). Inflation differentials in the euro area are larger and more structural than in the US, because the mechanisms for adjustments to asymmetric impacts are less effective (Zdárek and Aldasoro, Reference Zdárek and Aldasoro2009). It is well known, that the euro area has less wage flexibility and wages are influenced by national labour market institutions. Also, there is lower labour mobility across countries, and the EU budget does not permit significant transfers to countries in crisis. European Treaties also limit national fiscal policies when they try to act as effective adjustment mechanisms, and in some cases, these policies even create inflation differentials (European Central Bank, 2003). Households’ financial portfolios are poorly diversified across euro area countries, thus making financial markets a weak mechanism for adjusting to asymmetric shocks (Lane, Reference Lane2006).
Additionally, the creation of the euro produced inflation differentials with destabilizing macroeconomic consequences. Convergence to the euro meant a bigger decline in real interest rates in peripheral countries, causing faster growth in credit, house prices, aggregate demand, and therefore inflation. This one-off expansionary shock dissipated over time, notably because higher inflation led to the real appreciation of currencies. Higher than average inflation rates in a monetary union produce lower than average real interest rates, which may lead to both excessive debt accumulation and growth of property prices, along with the subsequent painful adjustment process. Subsequently, this can exacerbate the differences in business cycles among European countries, further widening inflation differentials in a cycle of divergence (Dullien and Fritshe, Reference Dullien and Fritshe2008; Honohan et al., Reference Honohan, Lane, Ventura and Begg2003). Vines et al. (Reference Vines, Kirsanova and Wren-Lewis2006) theoretical model shows that when there is significant persistence of inflation, countries in a monetary union may be subject to large business cycles, after asymmetric shocks.
In the early years of the Economic Monetary Unit (EMU), most of the discussion on potential sources of inflation differentials within a currency area focused on two main factors: on the one hand, the convergence effects entailed by the price-level convergence process and the Balassa–Samuelson hypothesis, and on the other hand, the remaining cyclical divergence between the member countries. More recently, many empirical researchers have highlighted the key role played by other factors in explaining inflation differentials in the euro area: structural differences in the wage—and price-settings across countries, different degrees of exposure to fluctuations in the euro/dollar exchange rate, differences in oil dependency, as well as differences in the conduct of fiscal policies. Understanding the causes of inflation differentials is of major importance, since their implications for relative competitiveness may differ widely depending on the process at works: inflation differentials partly reflect cross-country differences in real variables, such as prices and productivity growth, and are, in this respect, not only unavoidable but also desirable. Inflation differentials may however also be linked to asymmetric shocks or asymmetric effects of common shocks, which could combine with imperfections in product and labor markets to generate long-lasting inflation differentials. Such inflation differentials would, in turn, distort relative price-competitiveness between EMU countries. Summing up, despite equilibrium mechanisms, inflation differentials are potentially dangerous for a monetary union. This constitutes the motivation for studying the determinants of inflation differences. Through descriptive statistics and econometric evidence, we are trying to present some of the main causes of inflation differentials in Eurozone.
The article is organized as follows: the first section describes the main stylized facts related to recent inflation differentials observed within the euro area. Then, we are trying to investigate the main theoretical arguments that can explain inflation differentials within the monetary union, before trying to quantify the relative contributions of those potential explanations in driving inflation differentials within the euro area, over the period 1999–2018. We finally conclude and provide some insights.
2. Literature review
European Economic and Monetary Union (EMU) was expected to foster greater macroeconomic stability, prosperity, and convergence. The introduction of the single currency would stabilize exchange rates and lower interest rates across the union. The policymakers assumed that, by eliminating the exchange rate uncertainty and reducing the cross-border transaction costs, a common currency would increase capital mobility and intra-regional trade, thereby boosting growth and helping per capita income levels to converge between poorer and richer countries (Aglietta and Brand, Reference Aglietta and Brand2013).
The EMU succeeded in establishing a credible monetary policy framework and deepened the financial integration, but many of the national governments failed to exercise sufficient fiscal discipline as well as undertaking sufficient structural reforms. In the first years of the euro, countries benefited from a stability-oriented monetary policy framework with low interest rates, low expected inflation, and a stable, common exchange rate. However, national fiscal policies were pro-cyclical and the structural reform momentum faded, leading to macroeconomic imbalances, and widening competitiveness gaps. With weak financial supervision, rapidly increasing cross-border capital flows ultimately served as a destabilizing force (Franks et al. (Reference Franks, Barkbu, Blavy, Oman, Schoelermann and Pradhan2018).
The Maastricht treaty established convergence criteria for countries to join the euro, focusing on nominal and fiscal indicators of harmonization such as: inflation, long-term interest rates, exchange rate stability, fiscal deficit and the government debt-to-GDP ratio. The criteria were aimed at achieving price stability and lowering the dispersion of inflation rates, while reducing excessive deficits before locking the exchange rates (Bini-Smaghi et al., Reference Bini-Smaghi, Padoa-Schioppa and Papadia1993; Emerson et al., 1992). The expectation was that the price level of tradeable goods would be equalized across countries, and that inflation would generally converge, though with some scope for countries that were catching up in level of productivity and incomes, to having higher inflation as non-tradable prices adjusted more slowly. The fiscal criteria aimed to reconcile a common monetary policy with decentralized fiscal policies, preventing spillovers from national policies (Andrle et al., Reference Andrle, Bluedorn, Eyraud, Kinda, Brooks, Schwartz and Weber2015; European Commission, 2013).
This expectation is confirmed by a several of studies, such as Busetti et al. (Reference Busetti, Forni, Harvey and Venditti2007), Engel and Rogers (Reference Engel and Rogers2004), Rogers et al. (Reference Rogers, Hufbauer and Wada2001, 2007)), and Weber and Beck (Reference Weber and Beck2005), all of which agree that prices were less dispersed and inflation rates among Euro area countries have converged in the mid-1990s. Contrary, research investigating the post-1998 period, including ECB (2003), Engel and Rogers (Reference Engel and Rogers2004), Fritsche and Kuzin (Reference Fritsche and Kuzin2008), Honohan et al. (Reference Honohan, Lane, Ventura and Begg2003), Rogers (Reference Rogers2007), and Weber and Beck (Reference Weber and Beck2005) concludes that the advent of the Euro resulted in the weakening of inflation convergence among the Euro area countries and in an increase in their price dispersion. An exception is Honohan and Lane (Reference Honohan and Lane2004), who report sharp convergence in inflation rates, since 2002.
Pirovano and Van Poeck (Reference Pirovano and Van Poeck2011), test for the stability of inflation differentials. The authors found that for the period from 1999 to 2006, data do not reject the hypothesis of convergence for the majority of countries. On the other hand, by considering the whole sample period 1999–2010, there is evidence of persistent divergence in inflationary dynamics for the Euro-area countries. Although the authors conclude that the inflationary dynamics are more unstable in the Euro area in recent years, that is, during the years characterized by the Great Recession, it is worth stressing that it is difficult to draw sound conclusions about the evolution of inflation differentials, when such limited sample periods are considered.
Beck et al. (Reference Beck, Hubrich and Marcellino2009) have analyzed the dynamics of regional inflation in a group of Euro-area countries. They aim to identify the empirical relevance of the national factors, in explaining the inflation differentials over the period from 1996 to 2004. The main conclusion of the investigation is that local, structural factors, such as limited competition in labour and good markets, have played a dominant role in explaining the variability of inflation.
Altissimo et al. (Reference Altissimo, Ehrmann and Smets2006) have studied the underlying factors of inflation differentials in a currency area. On the empirical ground, they found two key results: (a) persistent inflation differentials affect the euro area; (b) a pre-eminent role, in explaining the evolution of the inflation differentials, is played by the different responses of Eurozone countries to common, Euro-area shocks.
A degree of inflation convergence is undoubtedly necessary for a well-functioning monetary policy. With a common monetary policy and decentralized fiscal policies that are bound by a common set of rules, it is difficult for policymakers to deal with large cyclical inflation differentials across countries. However, under a single currency, some inflation differentials may be needed to facilitate real exchange rate adjustment. Particularly, any accumulated competitiveness gaps will need to be unwound by inflation differentials, instead of exchange rate adjustments.
A group in the literature focuses on the combination of descriptive and regression analysis and has its main starting point in Honohan et al. (Reference Honohan, Lane, Ventura and Begg2003), whose approach we largely follow in our analysis. The authors tried to analyze inflation differentials in the Euro area over the period 1999–2001 through a multivariate panel data model estimated by Ordinary Least Squares (OLS) and Generalized Method of Moments (GMM). They proposed a fairly general specification for inflation differentials, including measures of cyclical position (output gap), fiscal position (primary surplus), price level convergence (lagged price level) and external position (lagged differenced nominal effective exchange rate). Their evidence points to a highly significant price level convergence effect, external position and output gap across almost all specifications. On the other hand, the evidence on fiscal position is inconclusive, being insignificant and significant, but contrary in sign to prior expectations, in the OLS and GMM regressions, respectively. In the wake of these results, the output gap is thought to capture most of the effect, that can come through the fiscal channel.
De Grauwe (Reference De Grauwe1996) has tried to investigate the essential subject of convergence of inflation rates prior to the acceptance of a country into the monetary union. He found that, in the year of 1991, the degree of inflation convergence among the countries participating in the European Monetary System achieved the highest level and he concluded that further narrowing of the differences among inflation rates is unrealistic. He also stated, that the inflation convergence criterion is too tight to fulfill. Few years later, in a continuation of his previous research, he found that a further drop in inflation differentials occurred after 1991. The author cautioned against the tight nominal convergence criteria, and he argued that the transition to a successful monetary union should put less emphasis on such convergence requirements and more on strengthening the future monetary institutions of the union.
Hofmann and Remsperger (Reference Hofmann and Remsperger2005) found that the real exchange rate together with the short-term real interest rate have a crucial effect on aggregate demand. That means, that in the long run, the inflation differentials subside because the impact of inflation differentials on the real exchange rate is accumulated. They concluded that persistence of inflation differentials among Euro-countries, who already experience a low and stable inflation rate, is small. Additionally, they believe that the credibility of ECB will aid this problem among the countries that currently have a high and unstable level of inflation rate. Girardi and Paruolo (Reference Girardi and Paruolo2013) examined the pre and post-EMU Phillips curve of EMU counties namely Germany, France, Italy and Spain. Aside from these member states of EMU, they included UK as the control factor in their test. They find that, during EMU period unemployment is proven to be influenced by the ECB, as was anticipated, where the Phillips curves of 4 EMU countries are similarly common, while the slope of UK’s Phillips curve is found to be positive. Nevertheless, EMU does not have control over the ongoing high level of the wage—and price systems.
During 1997–2001, there were four observations that emerged, according to Fase (Reference Fase2002). Firstly, inflation differentials were wide and systematic. Secondly, convergence started to grow due to the common monetary policy. Thirdly, Germany, France and Italy had continuously showed lower inflation rates than the rest of the Euro-countries. And lastly, the inflation differentials have escalated after the launch of EMU. The increased convergence that is mentioned above implies, that the differences in growth, productivity and income, decline over time. Amidst a real convergence process, the inflation differentials may increase significantly, and this may persist until real convergence is achieved. Meriküll and Rõõm (Reference Meriküll and Rõõm2014) agree with this, since they find that the Euro-changeover contributed to higher price expectations in Estonia. Fase (Reference Fase2002) argues that monetary phenomenon is not the primary source of this differential and, hence, cannot be assisted by monetary policy alone. However, differentials are rather developed as a consequence of a particular country’s sensitivity to external shocks, as well as an adjustment process of new economic structure and market mechanism. Finally, according to Neaime et al. (Reference Neaime, Gaysset and Badra2018), Greek’s economy is an example of a country that is sensitive to external shocks, since they are the only country that experiences deep recession among the rest of EU countries.
In addition, Lopez and Papell (Reference Lopez and Papell2012) have studied the convergence of the inflation rates of countries constituting the initial members of the euro area and they found robust evidence of convergence, after the introduction of the Maastricht Treaty and, especially, after the adoption of the common currency in 1999. They also found that, after the onset of the global financial crisis, the inflation rates of the euro area members mostly do not deviate from the path dictated by ECB monetary policy. Arestis et al. (Reference Arestis, Chortareas, Magkonis and Moschos2014) investigate whether the inflation rates of the countries that pursue inflation targeting, have converged in contradistinction to the experience of the OECD non-inflation targeters. Their results indicated that the inflation rates converge regardless of the monetary policy framework.
Busetti et al. (Reference Busetti, Forni, Harvey and Venditti2007) have studied the convergence properties of in inflation rates among the countries of the European Monetary Union over the period 1980–2004. They detected two separate clusters, or convergence clubs: a lower inflation group that comprises Germany, France, Belgium, Austria, Finland and a higher in inflation one with Spain, Netherlands, Greece, Portugal and Ireland. Italy appears to form a cluster of its own, standing in between the other two. In a similar recent research Karanasos et al. (Reference Karanasos, Koutroumpis, Karavias, Kartsaklas and Arakelian2016) studied the convergence properties of inflation rates among the countries of the European Monetary Union, over the period 1980–2013. They detected three absolute convergence clubs in the pre-euro period, which comprise early accession countries namely Luxembourg, Austria and Belgium. A second sub-group included Germany and France and the third The Netherlands and Finland. They have also detected two separate clusters of early accession countries in the post-1997 period: the first with Germany, Austria, Belgium and Luxembourg, and the other one with France and Finland. For the rest of the countries/cases they found evidence of divergent behavior.
3. Causes of inflation differentials
In order to ascertain any of the potential policy implications of persistent inflation differentials, it is more than necessary to properly identify their underlying causes. However, this is not an easy task because, in a large monetary union such as the euro area several factors may contribute to inflation divergence. We will try to present a brief description of the main factors, which have been put forward to explain the existence of long-lasting inflation differentials in the euro area. In particular, a distinction is made between structural and cyclical factors related to the convergence process.
3.1. Structural factors
According to literacy, the structural factors that effect in shaping inflation differential are the externalities, the convergence of market, the non-tradable goods sector and market rigidities.
3.1.1. External factors
The divergence of inflation rates may have an outer dimension of a structural nature, which is linked to disturbances in oil prices and changes in exchange rates. If economies are more dependent on each other, than on oil or have different transmission mechanisms of the effects of changes in exchange rates, the contribution to the deviation of inflation will be very weak (Pujol and Griffiths, Reference Pujol and Griffiths1996). The different country’s dependence on oil is measured as the share of net oil imports, as a percentage of GDP and appears to differ from country to country (Eurostat). At that point, we must note that the relationship between the country’s dependence on oil and the inflation differential does not seem to be so strong, if we take into consideration the impacts of a price change of the former in an economy. That means that the change in oil price will enable governments to react, which are likely to differ from country to country. For example, the large increase in oil prices in 1999–2000 was accompanied by additional control measures by the governments and as a result, the price index was affected in different ways in each country.
3.1.1.1. Tradable goods price convergence
The literature often assumes that the true Purchasing Power Parity (PPP) for tradable goods (prices of homogeneous goods denominated in the same currency differ from country to country) is valid. Despite this, there are still differences in the prices of tradable goods, even within the Eurozone. Although these differences are small compared to those of non-tradable goods, it seems to correlate with the latter. The differences in prices for traded goods are likely to be affected by the level of national and international competition, which, in turn, depends on factors such as the effectiveness of national competition policy in each country and a country’s exposure to international trade. We can observe a sharp decrease of the dispersion of prices of traded goods in the first half of 1990s, due to the implementation of the Single Market. But the pace of price convergence has decreased in recent years (Rogers, Reference Rogers2007). The single currency contributed positively to reducing these differences. The reason of their existence is that there are still differences in indirect taxation, the structure of distribution networks, the existence of monopoly power and inefficient service sectors (European Commission, 2002a). For example, the car market shows a wide divergence in prices between countries. The decomposition of the Single Market might have played an important role in the fact that prices of traded goods vary from country to country, and policies that will reduce this divergence will increase competition in the tradable goods and services could help reduce the spread of inflation, such as the exclusion of national regulations that prevent free trade, improvements in national and European competition policies, and so forth (though it remains still difficult to assess the impact of one of these measures to variations in commodity prices and inflation). It is important to mention that, there is no connection between the dispersion of price levels and dispersion of price changes between the members—countries of the tradable goods sector. The convergence of price levels of tradable sector could accompany both, convergence and divergence of changes in prices of traded goods, each time depending on the nature of changes in national competitiveness. However, we should always consider that even after the completion of the Single Market, there are differences in price levels to the extent that each national market has nominal rigidities together with price discrimination practices.
3.1.1.2. Non-tradable goods price convergence
The Model of Balassa–Samuelson (BS), which explains the differences in prices of non-traded goods between countries, has been much discussed recently in relation to inflation differentials occurring in countries of a monetary union. The main reason for the deviations of inflation is the productivity differential that exists between tradable and non-tradable goods (Cottarelli et al., Reference Cottarelli, Griffiths and Moghadam1998). The tradable sector is mainly the industrial sector, which is predominantly capital intensive and more competitive than the second, which consists mainly of the service industry and is labour intensive and less competitive. When productivity in the tradable goods increases, then wages increase without leading to higher prices. Because of the mobility of labour, wages in the non-tradable goods will also increase until they will be equal to those of the first sector, but it will lead to higher prices of non-traded goods, since the factor productivity has not increased accordingly. The higher factor productivity in tradable goods but also the biggest inflationary pressure in the non-tradable goods is verified from 1960 and onwards, in all euro area countries. The greater the productivity differential of both sectors, the higher the inflation differentials. Because of the differences in productivity among member—countries, there are also differences in the rates of inflation, which may be regarded as “equilibrium” deviations (steady-state inflation). Also, it should be noted that, as increases in wages in the tradable sector reflect gains in terms of productivity, the issue of competitiveness arises too. The BS model assumes that the true PPP for the tradable sector holds. But, although it has been rejected by many studies, at least in the short run, the results given by the model are consistent with historical data for longer periods. But there are some disadvantages, which make it difficult to quantify the potential effects of the BS model. These are mainly related to the assumptions made, and the difficulties that arise, in order to isolate the effects of the BS model by other factors that influence inflation in the past, mainly differences in monetary and exchange rate policies among countries. These disadvantages have led to a wide range of studies made for the BS effect and led to mixed results for each one. But it should be noted that these studies are not directly comparable, because of the different methodology used each time and the different samples. Some of these studies, however, clearly show that Germany and France were below the Eurozone average while Greece and Ireland above.
3.1.1.3. Market rigidities, structural reforms and inflation differentials
As mentioned above, the level of inflation differentials and their persistence can be affected by nominal and real rigidities, that affect the productivity. Reducing these rigidities, through structural changes, may improve conditions and may facilitate the absorption of shocks and therefore, reduce the persistence of the effect on inflation. However, structural reforms in each country individually may have a temporary negative impact on wage and price formation and, of course, on inflation differentials. For example, short-run effects on demand followed by a reduction in income tax could lead to increased inflation (Beck et al., Reference Beck, Hubrich and Marcellino2009). This effect depends on several factors including the nature of these reforms, the time horizon, and so forth.
We can distinguish between two main types of structural reforms: First, structural reforms in specific sectors (such as network industries) are likely to have a temporary effect on inflation, until the price level in both the sector and the economy reaches a new stable equilibrium point (steady state). Second, measures of “horizontal” structural reforms, including reforms designed to increase supply and demand in the labor market is likely to enhance the overall level of economic activity. This, in turn, will result in higher inflation, assuming some constraints (capacity constraints).
Now, regarding the timing of the above, it is difficult to predict the effect of structural changes in inflation in a particular country, during the adjustment period following the policy changes. This adjustment period can last up to several years and is always dependent on the nature of reform. In the long term, however, well-planned structural changes should reduce nominal and real rigidities. The greater the degree of price and wage flexibility, the easier and faster the economy adjusts to shocks and, therefore, reduces the likelihood of persistent inflation differentials in a monetary union.
The effect of structural reforms on inflation depends on the symmetry with which these reforms take place in the Eurozone. On the one hand, reforms aimed at reducing the level of prices in countries with asymmetric inflation rates above the average and it is likely to contribute to a temporary reduction in inflation differentials. On the other hand, the asymmetric implementation of reforms aimed at stimulating demand in rapidly developing economies may temporarily increase inflation differentials among euro area countries.
3.2. Cyclical factors
Three mechanisms are significant for inflation differentials in a monetary union. First, since all countries have the same nominal interest rates, a country with high inflation rate will have lower real interest rate compared to the one in the union, as a whole, assuming that the underlying inflationary expectations are specific to each individual country. Under these conditions, the deviations of inflation will be enhanced through demand (dis-equilibrating mechanism). Second, a country with inflation above the average of the currency area tends to have a loss in competitiveness due to higher prices, reducing demand (dampen) the product domestically (re-equilibrating mechanism). Third, the toughness of the dynamic evolution of inflation and output is possible to reproduce and expand the deviations.
3.2.1. Economic cycle and inflation
The differential inflation in the Eurozone countries can be caused (at least part of) due to their different positions during the economic cycle. To the extent that inflation in each country is affected by the output gap, inflation differentials in the member states might reflect differences in the size of the output gap between them.
Several studies (Alberola and Tyrvinen, Reference Alberola and Tyrvinen1998; Sinn and Reutter, Reference Sinn and Reutter2001; Tsintzos and Dergiades, Reference Tsintzos and Dergiades2011) showed a positive correlation between the measures of the cyclical positions of countries in the euro area and the relevant rate of inflation rates. Since the start of Stage Three of EMU in 1999, countries with inflation above the average had a higher overall growth of their output compared to the eurozone average and vice versa. Moreover, inflationary pressures are greatest in those countries with relatively large (positive) out- put gap (Eurostat, ECB).
Focusing on the demand side of the economy, it is evident that several of factors related to the economic cycle could have resulted in differences in the output gap, and hence to differences in inflation in the Eurozone countries. Wages and unemployment may also have a role. Inflation in countries that are above average are in line with high increases in wages and significant reductions in unemployment for some Eurozone countries. In some countries however, such as Ireland and the Netherlands, lower unemployment is likely to reflect not only changes in the economic cycle, but also some improvement due to structural changes in the labor market.
4. Methodology
With the purpose of establishing the relative contributions of some of the causes of driving inflation divergence in EMU, we ran multivariate regressions using annual data for the period from 1999 to 2018. A general specification for explaining inflation differentials can be written as follows:
 $$ {\pi}_{it}-{\pi}_t^{EMU}\hskip0.35em =\hskip0.35em {\alpha}_i+\beta \left({P}_{i,t-1}-{P}_{t-1}^{EMU}\right)+\gamma \left({x}_{i,t-}{x}_t^{EMU}\right)+{\varepsilon}_{i,t} $$
where
πi,t is the inflation rate of country i for period t, $ {\pi}_t^{EMU} $
is the average inflation rate for the euro area,
$ {\pi}_t^{EMU} $
is the average inflation rate for the euro area,
αi is the unobserved country—specific effect, $ {P}_{i,t-1}\hskip0.35em and\hskip0.35em {P}_{t-1}^{EMU} $
the national and euro area price levels respectively and
$ {P}_{i,t-1}\hskip0.35em and\hskip0.35em {P}_{t-1}^{EMU} $
the national and euro area price levels respectively and $ {x}_{i,t}\hskip0.35em and\hskip0.35em {x}_t^{EMU} $
are the vectors of national and eurozone variables, which play a key role in determining inflation differentials in the short run. In order to get a simpler version of the above equation, we can follow Honohan et al. (Reference Honohan, Lane, Ventura and Begg2003) and linearly combine into a time variable the euro area variables and obtain the following equation:
$ {x}_{i,t}\hskip0.35em and\hskip0.35em {x}_t^{EMU} $
are the vectors of national and eurozone variables, which play a key role in determining inflation differentials in the short run. In order to get a simpler version of the above equation, we can follow Honohan et al. (Reference Honohan, Lane, Ventura and Begg2003) and linearly combine into a time variable the euro area variables and obtain the following equation:
 $$ {\pi}_{it}\hskip0.35em =\hskip0.35em {\alpha}_i+\beta {P}_{i,t-1}+\gamma {x}_{i,t}+{\varphi}_t+{\varepsilon}_{i,t} $$
where
 $$ {\varphi}_t\hskip0.35em =\hskip0.35em {\pi}_t^{EMU}-\beta {P}_{t-1}^{EMU}-\gamma {x}_t^{EMU} $$
The explanatory variables that are included in the xi,t vector, are a measure of Balassa–Samuelson effect, output gap, a measure of fiscal stance and the growth rate of the nominal effective exchange rate. At that point, we must note that the time dummies in the regression capture the euro—area common movements in inflation and in the regressors (Honohan et al., Reference Honohan, Lane, Ventura and Begg2003). This leaves the regression to explain inflation differentials coming from idiosyncratic national movements in the determinants. So, our empirical specification is as follows:
 $$ {\pi}_{it}\hskip0.35em =\hskip0.35em {\alpha}_i+\beta {P}_{i,t-1}+{\gamma}_1{BS}_{i,t}+{\gamma}_2{GAP}_{i,t}+{\gamma}_3{FISC}_{i,t}+{\gamma}_4{NEER}_{i,t}+{\varphi}_t+{\varepsilon}_{i,t} $$
where πi,t is the quarterly inflation rate in country i, BSi,t captures the Balassa–Samuelson effect through the difference between the CPI and PPI, GAPi,t is the output gap, FISCi,t is the fiscal stance, where we have included the deficit and the public debt as a measure for that, and NEERi,t is the growth rate of the nominal effective exchange rate.
According to our model, equation (4.3) will be as follows:
 $$ {\pi}_{it}\hskip0.35em =\hskip0.35em {\alpha}_i+\beta PG+{\gamma}_1 PD+{\gamma}_2 BD+{\gamma}_3 OG+{\gamma}_4 ER+{\varphi}_t+{\varepsilon}_{i,t} $$
where PG productivity growth, PD is public debt, BD is budget deficit, OG is output gap and ER is exchange rate.
5. Data
We use data for the 19-euro area countries over the EMU for the period 1999–2018. Our baseline proxy for the Balassa–Samuelson effects is constructed as the annual growth rate of labour productivity in the business sector. The output gap is obtained using the Hodrick–Prescott filter (with a smoothing parameter set to 30) on initial series of GDP at constant price. The indicator for the exchange rates variations is constructed as the growth rate of the nominal effective exchange rate weighted by the ratio of imports to GDP. All the data are taken from Eurostat and are in annual frequency.
6. Results
6.1. Descriptive statistics
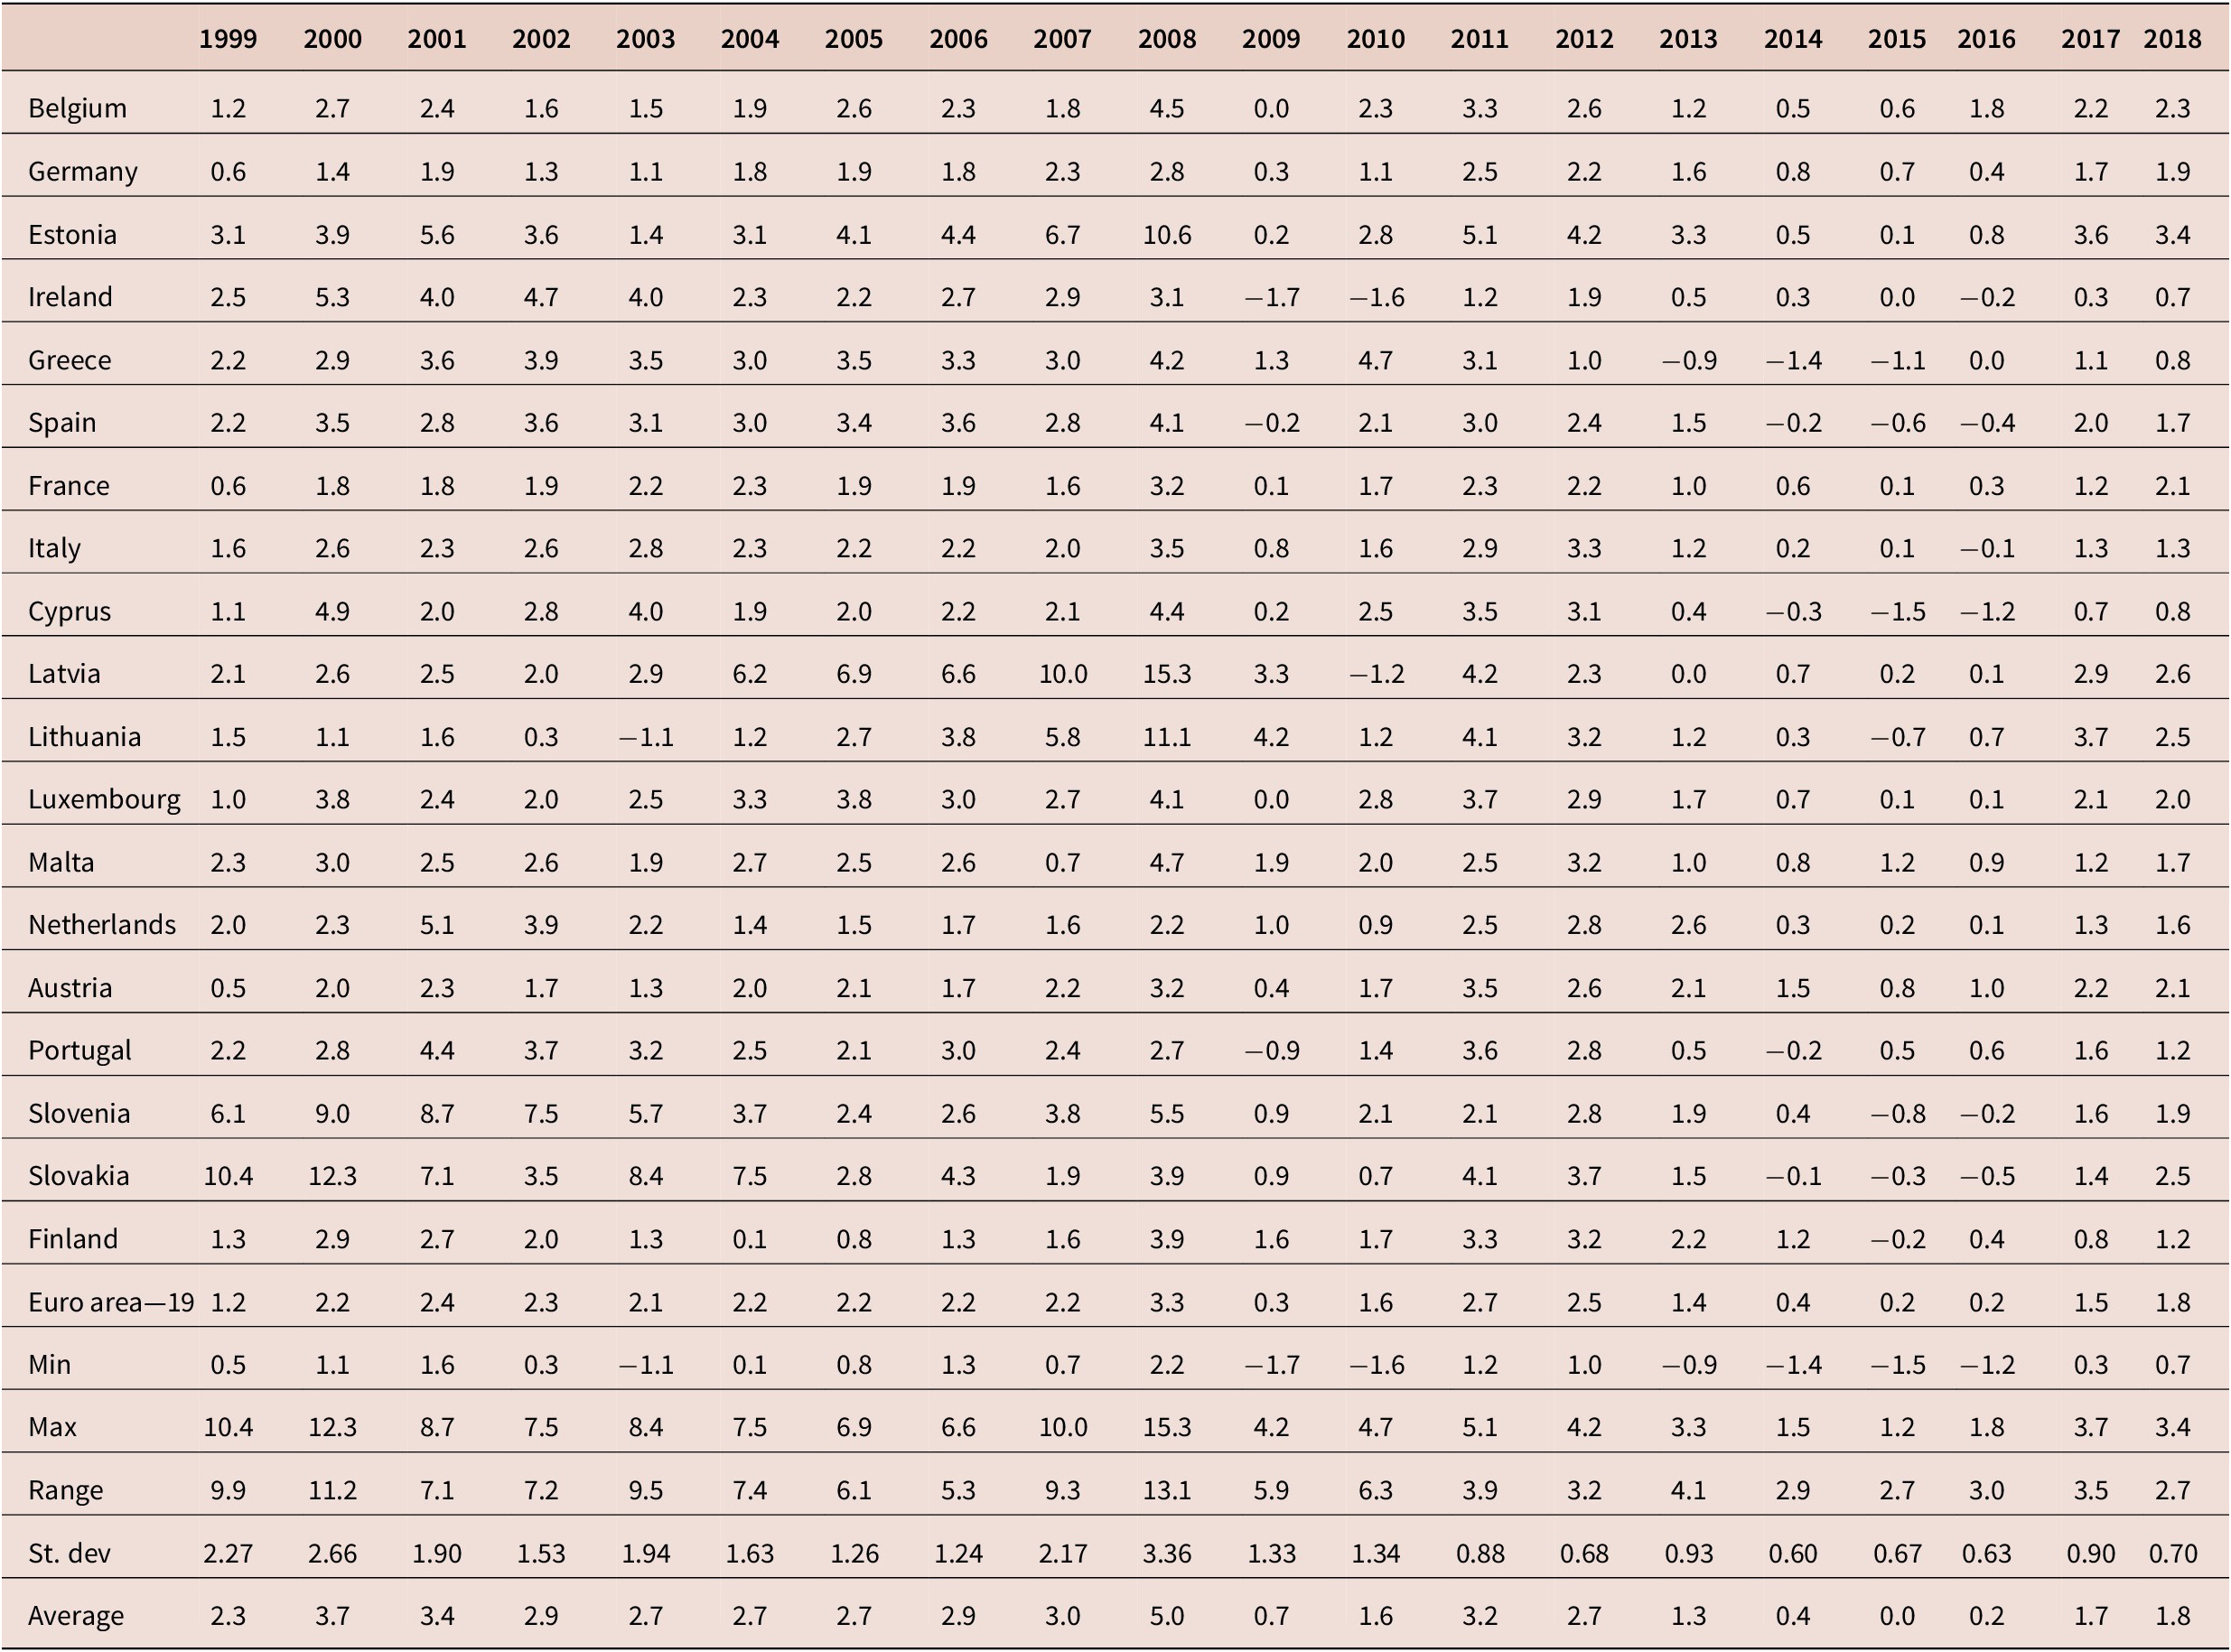
Table 1 represents the inflation rates for each member—country from the beginning of the union until 2018, and some basic statistics for each one of them. We can clearly see that inflation differentials were apparent from the beginning of the monetary union with Slovakia, Slovenia, Estonia, Ireland and Greece and Spain having the highest rates and the larger differentials. On the other hand, Austria, Germany and France had the lowest rates. Of course, there is a similar behavior of the inflations among all the countries during the period of the financial crisis, where the decline of the inflations in all countries is obvious. We can also see that, except for France and Germany where their inflations were around the target of 2 per cent, in all other countries of the subset the inflation is above for most of the time under consideration.
EMU inflation rates
Source: Eurostat.
Many recent empirical studies, such as Angeloni and Ehrmann (Reference Angeloni and Ehrmann2007)) and Hofmann and Remsperger (Reference Hofmann and Remsperger2005), highlight the high persistence level of inflation differentials in the euro area. This is illustrated also in table 1, which figures out annual deviations of national inflation rates from the official euro area aggregate inflation rate, since the launch of the euro. The relative positions of EMU countries, in terms of inflation rates, do not seem to have changed much between 1999 and 2006: Germany and Austria systematically displayed HICP inflation rates below the euro area average, whereas Slovakia, Slovenia, Estonia, Spain, Greece, Ireland and Portugal have almost always been among the most inflationary countries. Those countries often exhibited inflation rates one percentage point above the euro average. Belgium, Finland, France and the Netherlands are the only member—countries that exhibited inflation rates fluctuating around the euro average, without being systematically higher or lower. It is obvious, that European inflation differentials have been very persistent since 1999, and this high persistence appears as a specific feature of the euro area: such phenomenon has not been observed within the United States at the same time. None of the Metropolitan Statistical Areas (MSA) exhibited an inflation rate systematically above or below the United States average, and relative positions often reversed over the period 1999–2006. In other words, none of the MSA experienced the same situation as Spain, Greece, Ireland or Portugal, with inflation differentials well above one percentage point and persistent almost over the whole period.
Figure 1 presents inflation rates of Euro area—19. The experience of monetary policy over the years 2000–2007 has indicated that the European Central Bank has not been able to achieve the main objective of inflation, which was initially inflation rate, across the European Monetary Union (Eurozone), between 0 and 2 per cent per annum. That target was modified in May 2003 to “below but close to 2 per cent”. The degree to which the target was missed, was rather small but persistent. The financial crisis has pushed inflation rate over 3 per cent in 2008, which could be seen as cost-push inflation from world oil and food prices. The experience of differential inflation between member—countries has highlighted the ‘one size fits all’ problem of monetary policy. The manner in which monetary policy has operated, may have exacerbated the problem, in so far as the arguments underlying monetary policy and inflation targeting are correct (Arestis and Sawyer, Reference Arestis and Sawyer2010). Under inflation targeting, monetary policy (in the form of interest rate setting) is said to operate on the basis, that the threat of higher inflation is met by a rise in nominal interest rate sufficient to lead to a rise in the real rate of interest, which should then dampen down demand and thereby inflation. But, with the interest rate set by the ECB applying across all EMU countries meant that a country with a relatively high rate of inflation had a relatively low real rate of interest, which would imply, according to the monetary transmission mechanism, a higher, rather than lower, rate of inflation (Arestis and Sawyer, Reference Arestis and Sawyer2010).
Inflation rates of euro area—19

6.2. Econometric results
We are testing our data for the presence of structural breaks in the series of inflation differentials in the euro area for the period 1999–2018 using the test by Bai and Perron (Reference Bai and Perron1998). Without accounting for structural breaks, our results could be biased towards not rejecting the null hypothesis of no convergence (Perron, Reference Perron1989). Consequently, we include detected breaks in our model for the EU members. The model is estimated by least squares, treating the dates of structural breaks as unknown and endogenous events. The rationale for performing the Bai–Perron test is to determine the break points statistically and objectively, not setting the break dates based on a priori information. The changes in the inflation levels across the members of EU economies are confirmed, when carrying out Bai and Perron’s (Reference Bai and Perron2003) multiple break test on differential. Table 2 presents the break dates, and it indicates that for our model, we have three structural breaks, in 2004, 2008 and in 2010. These dates correspond to, or immediately precede, such events as the 2004 EU accession of 10 new members, the financial and sovereign debt crisis in 2008 and 2010 when the debt crisis emerged in the Eurozone.
Structural break points

Note. Number of breaks, 3; Breaks: 2004, 2008, 2010.
Tables 3 and 4 show the results for the panel estimation, using four different measures of inflation, namely Harmonized Index of Consumer Prices (HICP), HICP excluding energy, GDP deflator and private consumption deflator. Table 2 displays the pooled OLS estimations and table 4 the GMM estimations. We use the system-GMM estimator from Blundell and Bond (Reference Blundell and Bond1998) to estimate our baseline model. The output gap is treated as endogenous, keeping its lagged value three periods before as instrument in the first-difference equation, and its once lagged first difference in the level’s equations. The other explanatory variables are treated as pre-determined (productivity growth, Public Debt and Budget Deficit) or strictly exogenous (log of exchange rate): we use their lagged values one period before (for exogenous variables) or two periods before (for pre-determined variables) as instruments in the first-difference equation and their once lagged first differences in the levels equations.
Euro area inflation differentials: pooled least square estimates

Note. The dependent variables in columns (1)–(4) are the inflation differentials based on: (1) HICP; (2) HICP excluding energy; (3) GDP deflator; (4) private consumption deflator Time—fixed effects included; The t-statistics are based on White—corrected standard errors. *, **, *** denote significance at the 10, 5 and 1 per cent levels respectively.
Euro area inflation differentials: pooled GMM estimates

Note. The dependent variables in columns (1)–(4) are the inflation differentials based on: (1) HICP; (2) HICP excluding energy; (3) GDP deflator; (4) private consumption deflator Time—fixed effects included; The t-statistics are based on White—corrected standard errors. *, **, *** denote significance at the 10, 5 and 1 per cent levels respectively.
Abbreviation: GMM, generalized method of moments.
We choose to keep only a limited subset of instruments. In fact, Roodman (Reference Roodman2006, Reference Roodman2007) shows, that too many instruments can fail to expunge the endogenous components of explanatory variables, thus leading to biased coefficient estimates. We also “collapse” instruments, as suggested by Roodman (Reference Roodman2006, Reference Roodman2007). When we are estimating the factors of inflation differentials using the OLS method, we can imply that exchange rate has a significant impact on this phenomenon in euro area. The explanation is simple and straightforward: when a member—country experiences a nominal exchange rate depreciation, it will also experience higher inflation relatively to the rest of the currency area. In the HICP equation (first row) we see that the estimator is 0.27, meaning that a relative depreciation of 3 percent will result in almost 1 percent higher inflation, in comparison to the rest of the union. The output gap is mainly important for HICP. The fiscal measures affect the GDP deflator, rather than the HICP. The estimators for public debt are very small, thus its impact is almost negligible. Finally, the results show that differences in productivity growth (Balassa–Samuelson effect) are an important factor for producing inflation differentials in EMU countries.
As mentioned above, table 4 displays the GMM estimations. We have conducted GMM estimation in order to defend the case of a probable opposite causation, between inflation and fiscal policy and output levels.
The output gap is highly significant over the estimated period, which entails that the countries with positive cumulative output gaps tend to experiment inflationary pressures, and thus to have higher inflation rates, ceteris paribus. The estimated coefficient, close to 0.5, is rather similar to the one obtained in Rogers (Reference Rogers2002) over the period 1997–2001, or in Honohan et al. (Reference Honohan, Lane, Ventura and Begg2003) over the period 1999–2001. As expected, different exposure to exchange rates variations is a potential cause for inflation differentials within the euro area: the negative coefficient associated with this variable is in line with the estimates of Honohan et al. (Reference Honohan, Lane, Ventura and Begg2003) and indicates that a depreciation of the nominal effective exchange rate of a country is associated with a relative upsurge in its inflation rate.
If we compare the results of the OLS estimation above and the results of the GMM method, it is more than obvious, that are very close. The fact that is worth mentioning is the change of the significance levels in the case of the exchange rate, and the Balassa–Samuelson effect (productivity growth). Overall, we can conclude that both estimations (OLS and GMM) underline the result that the exchange rate, the output gap and the BS effect play a significant role for the inflation differentials in eurozone.
6.3. Robustness checks
In this section, we will check if our results are very sensitive to a change in the estimation methodology, in our indicator of cyclical positioning (one of the key explanatory variables) or in the definition of the dependent variable. Results of these robustness checks over the period 1999–2018 are reported in table 4.
Table 5 displays the results of GMM estimation, using alternative measures of fiscal stance. Instead of budget deficit and debt in the same regression, we exclude one each time (column 1 contains only budget deficit and column 2 contains only public debt). In column 3, we use the fiscal surplus in first differences, as an indicator of fiscal stance for the examined period. The results remain almost unaffected from this change in the data.
Euro area inflation differentials (Alternative specification for fiscal stance): pooled GMM estimations
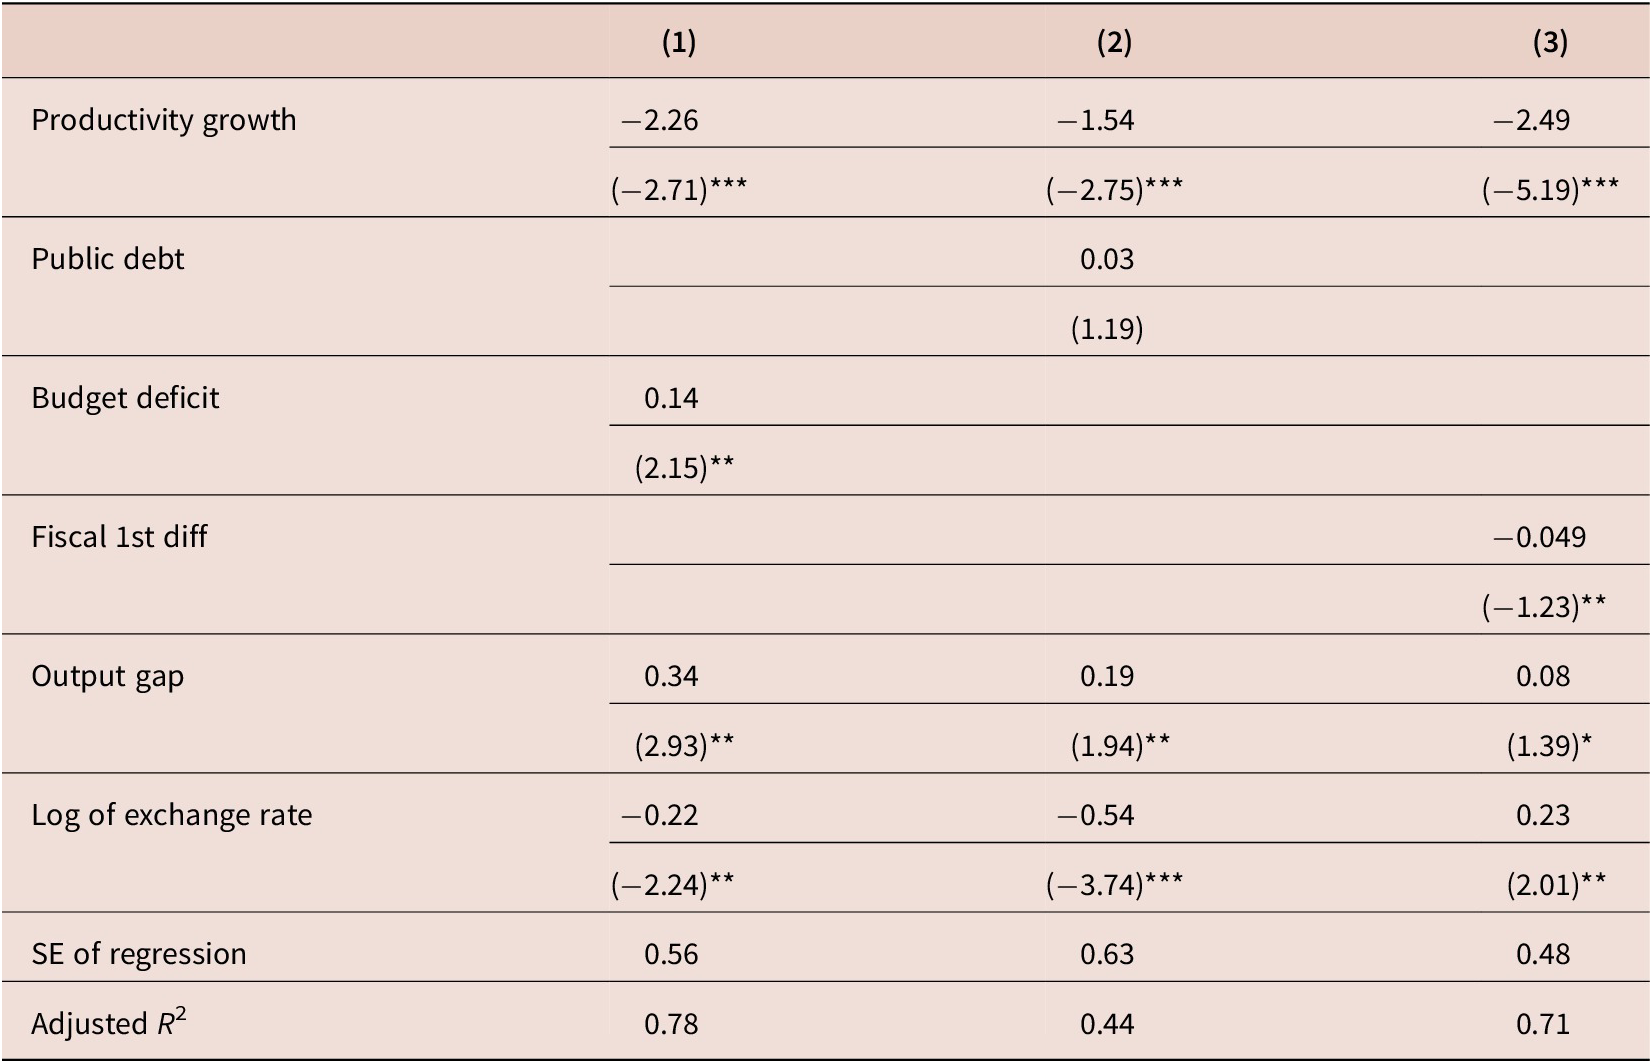
Note. The dependent variable in columns (1)–(3) is the inflation differentials based on HICP; Time—fixed effects included; The t-statistics are based on White—corrected standard errors. *, **, *** denote significance at the 10, 5 and 1 per cent levels respectively.
Abbreviation: GMM, generalized method of moments.
Table 5 reflects again, as previously, the result that the exchange rate, the output gap, and the Balassa–Samuelson effect (productivity growth) play a significant role for the inflation differentials in eurozone.
In table 6, we excluded countries from the sample which are considered to be outliers (Ireland and Greece because of the high inflation differentials especially at the beginning of the period, and Luxembourg because of the very different economic performance especially in fiscal numbers). The results also are not very different from the previous models.
Euro area inflation differentials (excluding Ireland, Greece and Luxembourg): pooled GMM estimates

The dependent variables in columns (1)–(4) are the inflation differentials based on: (1) HICP; (2) HICP excluding energy; (3) GDP deflator; (4) private consumption deflator Time—fixed effects included; The t-statistics are based on White—corrected standard errors. *, **, *** denote significance at the 10, 5 and 1 per cent levels respectively.
Abbreviation: GMM, generalized method of moments.
7. Conclusions and policy implications
The main goal of this article was to identify the determinants of inflation differences in the euro area for the period 1999–2018. The stability of inflation differentials is an important condition for the smooth working of a currency area, such as the European Economic and Monetary Union. Unfortunately, the inflation rates have diverged more widely among the members of the Eurozone than expected, and the recent surge in inflation dispersion illustrates that there is no tendency for inflation differentials to decline or to disappear.
We estimated the factors of inflation differentials using the OLS and GMM method. Results based on a dynamic panel data model estimated using the OLS estimator and system-GMM estimator, defined in Blundell and Bond (Reference Blundell and Bond1998), suggest that the main sources of euro area inflation differentials are twofold. They partly stem from differences in the exposure to external shocks, that is, nominal effective exchange deviations, as well the Balassa–Samuelson effect (defined as productivity growth in the estimations). Inflation differentials seem to be the result of different position of the countries in the economic cycle (the output gap in the estimations). Our empirical estimates appear to suggest that a one-percentage-point increase in the positive output gap, typically leads to an increase of about 20 basis points in the inflation rate of EMU countries. However, and even surprisingly, fiscal stance does not seem to strongly affect the inflation differentials, only slightly.
Finally, the growing interest of the ECB, regarding national inflation differentials within the euro area, clearly reveals its concern about the potential implications of such lasting inflation disparities. Lasting inflation differentials may also complicate the task of the ECB for the definition of its single monetary policy: a “one size fits all” policy, and should thus induce a too restrictive policy for countries exhibiting the lowest inflation rates and simultaneously an excessively accommodating policy for the most inflationary countries. However, our analysis also reveals the key role played by productivity growth exchange rates in amplifying inflation differentials. Since the monetary policy of the ECB is geared at maintaining a low and stable inflation, productivity growth should be increased, and the real effective exchange rates should be decreased and become more homogenous among EMU countries, as suggested by Altissimo et al. (Reference Altissimo, Ehrmann and Smets2006). Inflation differentials may therefore become less persistent.
Undesirably low inflation rates have been very costly to the euro area economy. At the Zero Lower Bound (ZLB), the macroeconomic risks associated with undesirably low inflation can be particularly high, as shown by Arias et al. (Reference Arias, Erceg and Trabandt2016)). With the coexistence of low inflation and the ZLB, many of the other policy options may become difficult or detrimental for the economy. For example, as Eggertsson et al. (Reference Eggertsson, Ferrero and Raffo2014)) show, structural reforms that ordinarily could support growth, when they could be accompanied by interest rate reductions, may instead be unwise and prove contractionary at the ZLB when short-term rates cannot adjust.
The Recovery and Resilience Facility (RRF) is a new key instrument at the heart of NextGenerationEU to help the European Union emerge stronger and more resilient from the current and future crises. Also, if the inflation rates will diverge more widely among the members of the Eurozone than expected, then the RRF will help towards the normalization and the conversion of the inflation rates. The RRF confirms the EU’s aim to pursue a new growth strategy, based on the European Green Deal and on the concept of competitive sustainability. The four dimensions of competitive sustainability, namely the environmental sustainability, productivity, fairness and macroeconomic stability, identified in last year’s ASGS, should remain the guiding principles for the implementation of the Facility (European Commission, 2020). The proposed Recovery and Resilience Facility will offer large scale financial support for public investments and reforms, that make Member States economies more resilient and better prepared for the future. It will help Member States to address the economic and social challenges they are facing, in an even more critical manner in the aftermath of the crisis, in various areas such as social, employment, skills, education, research and innovation, health issues, but also, issues related to the business environment, including public administration and the financial sector.
Also, the RRF will help to have smart, sustainable and inclusive growth including economic cohesion, jobs, productivity, competitiveness, research, development and innovation, as well as a well-functioning internal market, with strong SMEs. The investments will aim to support companies that increase productivity, and also, the grants through the Facility will give us production externalities from public investment, and finally, we will have higher productivity of private inputs. The Member State economies will have projects that strengthen the resilience, increase productivity, leading to higher competitiveness of the Member States and reduce inequalities and divergences in the Union.
Crucially, it will also ensure that these investments and reforms focus on the challenges and investment needs related to the green and digital transitions, thereby ensuring a sustainable recovery. It will also help make the Union more resilient and less dependent by diversifying key supply chains (European Commission, 2020).


 Open access