


Introduction
The COVID-19 pandemic was a historic shock to the food supply chain. The pandemic resulted in significant economic losses for some food companies (Akbulaev et al., Reference Akbulaev, Mammadov and Aliyev2020; Barman et al., Reference Barman, Das and De2021; Swinnen and Vos, Reference Swinnen and Vos2021) and increased food insecurity (Dietrich et al., Reference Dietrich, Giuffrida, Martorano and Schmerzeck2022). It also forced growers, manufacturers, and retailers to adapt to unique conditions, thereby offering lessons for the viability of the food supply chain in the face of future challenges and other unanticipated phenomena. Perhaps the largest and most immediate change affecting the food supply chain was the widespread shutdown of the foodservice industry, which diverted billions of dollars in food sales to the retail sector in March 2020 (USDA ERS 2023a). This shift had major impacts on companies throughout the supply chain, but especially so for specialty crop producers, due to the precise timing of their harvests, the perishability of the commodities, and the pressures facing refrigerated truck transportation.
Our study seeks to build on the growing body of literature aimed at learning from the lessons of COVID-19 and developing a more sustainable agriculture production system (e.g. Mofijur et al., Reference Mofijur, Fattah, Alam, Islam, Ong, Rahman, Najafi, Ahmed, Uddin and Mahlia2021). The focus of this paper is specialty crop production in California. While prior work has studied the impacts of COVID-19 on specialty crop production in other states, California is uniquely important in this regard. California leads the nation in agricultural production, accounting for 11.7% of the total value of commodity receipts as of 2021 (USDA ERS, 2023b). More specifically, California is by far the largest US producer of specialty crops, including fruits, vegetables, and tree nuts. There are at least 72 commercially grown specialty crops for which California is the largest producer in the U.S., and for several crops (e.g. almonds, walnuts, celery, artichokes, olives, and nectarines), California grows more than 99% of domestic production (CDFA, 2022). In 2020, California accounted for 73% of the nation’s fruit and nut cash receipts, and 46% of the vegetable and melon cash receipts, both of which are the largest shares of all states (Skorbiansky et al., Reference Skorbiansky, Astill, Rosch, Higgins, Ifft and Richard2022). The issues affecting specialty crop production in California, and the related solutions, are thus of great economic importance.
We seek to understand how the COVID-19 pandemic, related lockdowns, and aftermath affected this vast, varied, and economically vital industrial sector. Our study has three main objectives. First, we develop a primary data set to understand the scope and magnitude of the largest challenges faced by CA specialty crop growers and how they coped with those challenges during the pandemic. Second, we use federal and state data on input costs, prices, and production to corroborate the findings drawn from the primary data. Finally, based on our analysis of both the qualitative grower responses and the publicly available data, we develop a series of recommendations for ensuring the stability and viability of specialty crop producers and the supply chain in general in face of future shocks, disruptions, and challenges.
We conducted phone and written interviews with 28 California specialty crop producers in later 2022 and early 2023 to investigate the challenges they faced, the impacts they perceived on their operations with respect to sales and inputs, and the solutions they implemented to address the challenges of the COVID-19 pandemic, 2020 through 2022. Our interview questions were motivated by the extant literature on COVID-19 and the food supply chain, and our interviewees spanned a wide range of fruit, vegetable, and tree nut production. We identify a series of findings related to the impacts of COVID-19 on CA specialty crop growers and related solutions, as well as the sources for those solutions. We then analyze secondary data on input costs, production, and prices received. We develop generalized facts about the economic and industry impacts of COVID-19 on the CA specialty crop sector and assess the extent to which the state and federal data corroborate the findings drawn from our interviews. Finally, we develop and discuss key findings and recommendations for supply chain resiliency moving forward.
We contribute to the research on COVID-19 and the US food supply chain. Much of the work to date has focused on commodity markets and industrial sectors affected by widely publicized shutdowns and other disruptions. These include broilers (Maples et al., Reference Maples, Thompson, Anderson and Anderson2021), beef and pork (Lusk et al., Reference Lusk, Tonsor and Schulz2021; Bina et al., Reference Bina, Tonsor, Schulz and Hahn2022), corn and soybeans (Mallory, Reference Mallory2021; Yaddanapudi and Mishra, Reference Yaddanapudi and Mishra2022), and dairy (Wang et al., Reference Wang, Liu, Zhao, Kitsos, Cannella, Wang and Lei2020). The common thread in these studies is that labor constraints were a major issue throughout 2020 and 2021, increasing production costs and reducing output, while the shutdown and gradual reopening of the foodservice sector resulted in uncertainty, food loss, and a realignment across marketing channels throughout the supply chain. The shutdown of food service motivated us to investigate potential differences between conventional and organic operations. Labor challenges also make this distinction salient, given that organic production is more labor intensive than conventional (Lohr and Park, Reference Lohr and Park2009; Crowder and Reganold, Reference Crowder and Reganold2015).
The work on specialty crop production and supply chains during COVID-19 has focused on transactional issues facing producers, particularly those selling to foodservice outlets, and operational challenges. Several of the findings in the studies cited above are broadly applicable to fruit and vegetable production. Early in the pandemic, Richards and Rickard (Reference Richards and Rickard2020) cited the transition from foodservice sales to retail sales for many fruit and vegetable producers as the most pressing challenge and predicted that labor would prove to be the most challenging input for produce markets. Dankbar et al. documented this transition and related challenges for specialty crop growers in North Carolina. Lewnard et al. (Reference Lewnard, Mora, Nkwocha, Kogut, Rauch, Morga, Hernandez, Wong, Huen, Andrejko and Jewell2021) and Charlton (Reference Charlton2022) demonstrated the prevalence of COVID-19 among farmworkers in California, which resulted in illnesses and labor shortages throughout the pandemic. Finally, Sumner (Reference Sumner2021) and Chenarides et al. (Reference Chenarides, Manfredo and Richards2021) use state and federal agricultural data to study the impacts of COVID-19 on economic indicators such as prices, production, and trade flows. Both studies demonstrate evidence of significant challenges, largely related to labor and foodservice lockdowns, but also attest to the resilience of the produce supply chain, arguing that 2020 did not stand out relative to previous years, given the historical volatility endemic to these commodity markets.
Using both primary and secondary data, we describe the California specialty crop sector as one that faced substantial challenges during COVID-19. Similar to Patillo et al.’s findings on the specialty crop industry in Missouri, we argue that the sector also showed resiliency. Growers cite transportation issues, labor, and input costs as significant concerns during the pandemic, and faced wild fluctuations in demand. Our grower interviews point to remote work as a promising path for shoring up administrative and other office labor given the changes in worker availability and labor force participation due to the COVID lockdowns and point to trade associations as valuable sources for collecting and disseminating solutions to shocks or disruptions. We analyze data from USDA to investigate how the pandemic shaped input costs, production, shipment volumes, and prices received, and we corroborate several of the findings drawn from our grower interviews, while illustrating the overall resiliency of the specialty crop sector. Truck transportation has been a persistent challenge to the industry, due to rising and volatility rates and increased labor shortages. Perhaps contrary to conventional wisdom, we do not find evidence for widespread food loss or production or distribution disruptions. Moreover, while growers expressed challenges related to increased input costs of packaging, transportation, safety protocols, and labor, many categories of production expenses were stable throughout the pandemic from the federal data. We discuss several avenues for future research that follow from our findings.
Insights from grower interviews
To create a primary data set to investigate the effects of COVID-19 on California specialty crop producers, we collaborated with the International Fresh Produce Association (IFPA). We developed a series of ten interview questions, all of which are open-ended and hence allow respondents to provide as much information as they wish.Footnote 1 The questions were then revised with feedback from professionals at IFPA and were all motivated by the extant literature on the impacts of COVID-19, in both trade publications and academic journals. The complete list of questions is provided in the appendix.
To connect with growers, we obtained from IFPA the contact information for member companies that met two criteria: they produced and/or distributed fruits, vegetables, tree nuts, or some combination of those products, and they operated in California. We emailed the members that met these criteria and offered the opportunity to participate by phone interview or by submitting written responses to our questions. Our study has IRB approval for research on human subjects, under the condition that no responses from interviewees are shared in any research output and that no identifying characteristics are used or released.
In September 2022, we reached out to over 100 produce companies and received 28 usable responses, which are evenly split between written and phone interviews. Responses are from growers specializing in fruits, vegetables, and tree nuts, but the data are not rich enough to allow us to calculate statistics or identify patterns within these three groups. Respondents were informed they could skip any questions, and questions 3 and 10 were skipped by a meaningful share of respondents. For one, most respondents were unwilling or unable to divulge the approximate, numerical shares of their sales by marketing channel (e.g. retail, foodservice, and institutional). We revisit this below as an avenue for future research. The other question frequently skipped or passed inquired as to the sources for solutions implemented in response to the challenges of the pandemic.
Table 1 summarizes the grower responses. Most responses are from fruit growers, but several companies in this category also reported growing vegetables or tree nuts. As noted above, our data set is not rich enough to cut the responses by fruit, vegetable, or tree nut companies, and this also provides motivation for future research. We asked growers to indicate the greatest challenge they faced during the COVID-19 pandemic, considering the time from March 2020 through September 2022. As with all questions, this question was left open and interviewees were not constrained by predetermined selections, nor were they asked to limit their response to a set number of choices. We organize the responses into five categories. The most common response, shared by 63% of interviewees, is increases to lag and lead times. Gray (Reference Gray2020) and Walters et al. (Reference Walters, Wade and Suttles2020) both discussed transportation as a sector likely to face disruptions and challenges during the pandemic in the U.S. and Canada, while Aday and Aday (Reference Aday and Aday2020) identified significant issues with air and sea cargo during the lockdowns. Respondents consistently noted that they were forced to adjust to longer wait time for inputs, and for trucks to move their commodities.
Summary of grower responses, N = 28 interviews

Survey question numbers are included in parentheses.
Respondents had the opportunity to select multiple responses for most questions and were also allowed to skip any questions they wished. Therefore, in most cases the percentages do not add up to one.
a Personal protective equipment.
b Western Growers Association.
c Center for Disease Control and Prevention.
Other challenges reported by interviewees, in descending share of responses, are sales (43%), labor (25%), raw materials (25%), and international trade (11%). With respect to sales, we asked all growers about the direction of the perceived sales impacts, if any. About one-fifth of growers reported no significant impact on sales during the pandemic, while 46% said sales increased and 32% said sales decreased. Perhaps not surprisingly, those respondents reporting increases were almost exclusively selling to retailers, while those reporting decreases were selling to foodservice outlets. Several of those who reported sales increases also reported sales as a challenge in the preceding question, noting that demand exceeded their available supply or their logistical capacity to handle the larger, accelerated orders. Our final question related to sales asked growers if they perceived a sales difference between organic and conventional commodities, if applicable. Those growers with both types of commodities were almost evenly split on this answer, with 29% reporting “yes” and 32% reporting “no.” Those that reported yes uniformly stated that organic sales were stronger than conventional sales during the pandemic. The reported reasons for this were that organic commodities were used to supplement orders to conventional retail buyers due to heightened demand and that the demand for foods perceived as healthier seemed to be higher during the lockdowns. In general, even though the supply of organic produce went down because of supply chain disruptions and labor shortage, the demand for organic produce did not decrease during the pandemic. Most consumers of organic foods have high incomes and are less price-sensitive. Furthermore, the increased organic produce sales could be attributed to the fact that consumers became more conscious of health and sustainability during COVID, as noted in discussions with several growers.
The grower interview included three questions about specific operational impacts during COVID-19, all drawn from the literature. It is widely understood that the early months of the pandemic were associated with an increase in food loss and waste throughout the food supply chain, largely due to supply and demand disruptions (Ellison and Kalaitzandonakes, Reference Ellison and Kalaitzandonakes2020; Borghesi and Morone, Reference Borghesi and Morone2023). But to our knowledge, these impacts have not been quantified, and we asked our grower sample if they experienced a meaningful increase in food loss or waste during the pandemic. The share of respondents indicating “yes” was 28%, which is closely comparable to the 32% of respondents who indicated that they experienced a significant decrease in demand. It stands to reason that those growers with sales concentrated in foodservice are those who both saw sales decline and food waste increase during the pandemic.
Given the established issues related to labor during COVID-19, we asked growers if they experienced significant issues with labor availability, and 71% indicated that they did. This finding also speaks to the severity of the transportation-related issues discussed above, in that most respondents faced labor issues, but still cited lag and lead times as their biggest challenge during the pandemic. We also asked growers where they perceived the largest increase in their operating costs. Though the question was open-ended, all responses fell into the following categories: non-labor operating costs (64%), COVID-related safety measures (54%), and wages (39%).
Our interview also covered the solutions implemented and the sources for solutions, if applicable. Two of the most common solutions reported by interviewees pertained to managing labor. One-quarter of respondents indicated that they increased the availability and opportunities for remote work among office staff (e.g. sales and marketing, human resources, and bookkeeping). World Economic Forum (2023) identified farming, fishing, and forestry as one of the industries with the lowest rates of remote work as of 2022, and as an industry that experienced a relatively low growth in remote work between 2019 and 2022. To the extent that this puts agriculture at a disadvantage relative to other industries when seeking to attract and retain workers who demand flexibility, our finding suggests that specialty crop operations should identify all positions and tasks that can be performed remotely and without a loss of productivity, and capitalize on this opportunity in their recruitment and retention efforts. Another 29% of respondents indicated that they implemented social distancing for workers indoors and decreased the size of work crews wherever possible. The smaller work crews during the pandemic provide a natural experiment for producers to assess the impact of crew size on productivity and to potentially identify operational efficiencies. The remaining responses were characterized by implementing better sanitation practices, and a series of other responses, which tended to be specific to operations and commodities and are therefore too granular to report in this study.
Half of respondents declined to answer the question asking for the sources for solutions. However, the most common source reported among those who responded was trade associations, in many cases the Western Growers Association (WGA). Several growers also reported drawing insights from colleagues in industry, working for other operations. This finding highlights the role that trade associations play in disseminating information to members, and the value of membership, particularly during disruptions and shocks. There also seems to be value in compiling and sharing information drawn from member companies, to help inform growers about potential pitfalls and solutions as challenges arise.
Evidence from secondary data
The grower interviews provided several insights that call for further analysis. While some of the insights and questions raised from the grower conversations are beyond the scope of this paper to investigate further, secondary data can be used to assess the extent to which the findings from the primary data reflect patterns and trends that apply throughout the specialty crop sector. This section of the paper seeks to corroborate findings drawn from the grower interviews and to provide a broad statistical overview of key metrics defining the California specialty crop industry during the COVID-19 pandemic.
Truck transportation
Owing to the frequently cited issues related to lag and lead times in our grower interviews, we analyze data on truck transportation for specialty crops. The USDA Agricultural Marketing Service (AMS) maintains a rich database of information on refrigerated truck transportation in the U.S., much of it categorized by origin, route, and commodity. The data are aggregated from the Fruit and Vegetable Truck Rate Report and therefore pertain to fruits and vegetables and not tree nuts, which typically do not require refrigeration. To investigate truck rates paid by California specialty crop producers, which are relevant for their role in shaping costs and are also reflective of the impacts the transportation sector has had on specialty crops more broadly, we calculate statistics for refrigerated truck rates originating in California. The results are summarized in Table 2.
Refrigerated truck rates for routes originating in California, 2020–2022

Source: USDA Agricultural Marketing Service.
a Average yearly changes, for the reported time periods.
b The coefficient of variation (CV) is a unitless measure of volatility, calculated as the sample standard deviation divided by the sample mean.
For each of the destination cities for which data are available, we demonstrate three generalized empirical facts. For one, whether measured by rate per mile or rate per truckload, average truck rates increased at an accelerated rate during 2020–2022, as compared to the preceding decade, for nearly all routes. In some cases, e.g. Dallas and Los Angeles, the rate of increase was dramatic. City-specific impacts are beyond the scope of this paper to analyze, but it is worth pointing out many routes ending in Los Angeles also originate in California, and rate increases have been most acute for short routes. The second generalized fact is that truck rates increased substantially during the pandemic, as measured by the change from the beginning of 2020 to the end of 2022. For every destination city, truck rates experienced double-digit inflation during this three-year period, in most cases significantly outpacing economy-wide inflation, as measured by the CPI. And finally, for every destination city, the volatility of truck rates, as measured by the coefficient of variation, increased substantially in 2020–2022, as compared to the preceding three years. Taken together, we see that truck rates increased rapidly and substantially during the pandemic, and also became less predictable, which is a challenge for operators typically selling their commodities at thin margins (e.g. Huang et al., Reference Huang, Guan and Hammami2022).
We are also able to examine refrigerated truck shortages using USDA AMS data. The AMS data on shortages are weekly and are highly granular, with entries for a large number of commodities and route origins. To improve tractability and readability, we calculate average truck availability monthly and according to origin, differentiating between California and all other geographic origins. The results are reported in Figure 1. Truck availability is reported by an index ranging from one, indicating surplus, to five, indicating shortage. We are able to discern four generalized empirical facts about refrigerated truck availability for CA specialty crops. First, truck availability decreased substantially during COVID-19, with availability falling sharply during the late summer/early fall of 2020 and remaining depressed for approximately two years. Based on the AMS index, refrigerated truck availability fell for routes originating in California by an average of 0.24% every month in 2020 through 2022, and availability at the end of 2020 was nearly 30% lower than it was at the start of 2020. Second, truck availability is highly volatile over time, not just in the pandemic. Given that an index score of three indicates adequate availability it is common to observe swings between surplus and shortage month to month. Third, truck availability is consistently tight. During the 2020–2022 pandemic years, the average index in California was 3.30, which is significantly higher than 3, meaning that shortages were common. But even during the preceding years 2010–2019 pre-COVID, the monthly average was 3.14, indicating that shortages occurred regularly to some extent. These three facts all corroborate the finding from our interviews that truck transportation, and therefore lag and lead times, were significant challenges for CA specialty crop growers during COVID-19.
Monthly Average Refrigerated Truck Shortages, 2010–2022.
Source: USDA Agricultural Marketing Service.
Note: USDA-AMS uses a 5-point index to measure refrigerated truck availability weekly, by route and commodity, with 1 indicating surplus and 5 indicating shortage. We calculated monthly averages for all routes and commodities separately for California and all other origins.

The fourth and final generalized fact drawn from the availability data is that, on average, shortages were more acute for routes originating outside of California. This is perhaps counterintuitive, due to the comments and responses from our interviewees, but also in light of the sheer volume of agricultural commodities moved by truck originating in California.
Figure 2 visualizes total shipments over time. The key takeaway from the volume data is that shipments in California accelerated considerably between 2017 and 2018 and, while they fell somewhat in 2022, remain elevated above pre-2017 levels. A closer look at commodity-level shipments reveals that this surge was driven by historical year-over-year increases in the movement of broccoli, strawberries, processed lettuce, avocados, cauliflower, artichokes, and table grapes. The underlying causes of these surges in production are likely a function of water availability, climatic conditions, global commodity markets, and prices, and their analysis is beyond the scope of this paper. The volume data indicate that the refrigerated truck industry was under stress before the pandemic hit, relative to recent history, but we find limited evidence that the COVID-19 pandemic was associated with disruptions in production or distribution for California specialty crops. In line with the findings of Gray (Reference Gray2020), we find that the industry proved resilient during the pandemic at these heightened levels of demand, despite upticks in truck rates and shortages.
Total Volume of Fruit and Vegetable Commodity Shipments Originating from California, 2010–2022.
Source: USDA Agricultural Marketing Service.

As a final note on trucking and specialty crops, it is important to note that for some commodities and routes, domestic and imported commodities may be competing for truck carrying capacity. The international trade of specialty crops proved resilient throughout COVID-19 (Arita et al., Reference Arita, Grant, Sydow and Beckman2022), and the U.S. is a major importer of fruits and vegetables from Mexico, Peru, and Chile, and Canada (USDA ERS, 2023c). These commodities, even if imported via the ports, then rely on trucks to reach their final destinations, meaning that truck-related challenges for California specialty crop producers may be more pronounced than is suggested by the statistics presented in this paper. The AMS data do not distinguish commodities by country of origin.
Input costs
To investigate changes in input costs during the pandemic, we rely on USDA National Agriculture Statistics Services (NASS), which compiles statistics on various costs across US agriculture. Table 3 compiles average levels and annual percent changes, 2019–2021, for a comprehensive list of major input cost categories for agricultural producers in the U.S. It is important to note that these statistics apply to all crops and commodities grown in the U.S. and are not specific to specialty crops.
Changes in agricultural input costs, 2019–2021

Source: USDA NASS Quick Stats.
Reported values are based on a survey of agricultural producers across the United States.
Most input costs experienced surges during the pandemic, to varying degrees. The interviewees indicated that the largest source of increased costs during COVID-19 was supplies, and the NASS data readily corroborate this. Other capital expenses, though small as a share of total expenses, increased over 300% in 2020 and another 50% in 2021. Improvement and construction costs increased 57% in 2020, which likely reflects the implementation of physical barriers, handwashing stations, and other means to promote social distancing and prevent the spread of COVID-19. Other machinery also increased 11% in 2020, which may reflect investments made to substitute lost or diminished labor. Recall that safety measures were the second largest cited source of costs by interviewees, and this is also consistent with all of these categories that showed substantial growth in 2020 and again in 2021.
Wages were also noted by many specialty crop growers as a major source of increased costs during the pandemic. On this front, the NASS data are mixed. Total labor expenditures increased by 2% in 2020 but then fell 11% in 2021, to pre-COVID levels. But these dynamics reflect a tradeoff between increasing hourly wages and decreasing labor availability. Total agricultural labor, whether measured by worked count or hours worked, fell in both 2020 and 2021 while wages increased considerably, by 8% in 2020 and another 7% in 2021. COVID-19 outbreaks and illnesses kept many agricultural workers away from job sites for extended stretches (Luckstead et al., Reference Luckstead, Nayga and Snell2021). The availability of temporary workers, particularly those visiting the U.S. via H-2A visas, has increased substantially in the past two decades to augment the production sector labor force (Castillo, Reference Castillo2023). But travel restrictions limited international travel in 2020 and constrained this growth during COVID-19 pandemic (Escalante et al., Reference Escalante, Luo and Taylor2020). We argue that the statistical portrait of input costs during COVID-19 supports the notion that labor was a challenge for growers and shippers, and total labor expenditures do not take into account lost productivity or the cost of turnover.
Table 3 also supports the notion of overall supply chain resilience during the pandemic. While there are surely costs not accounted for in the table, such as the aforementioned lost labor productivity, overall costs remained flat between 2019 and 2021. Surges in capital expenses and Ag services were offset by lower costs in other major categories, including rent, supplies and repairs, and automobiles. Hence, input costs did not increase across the board during the pandemic, and it is not clear that operating margins decreased between 2019 and 2021. This finding is worth investigating further specifically for California specialty crops.
Production
The challenges, disruptions, and shortages discussed in the literature on COVID-19 and agriculture and highlighted in the popular press, as well as our discussions with growers, motivate us to investigate the total production of California specialty crops during the pandemic. The AMS shipment data suggests that specialty crop production in California remained strong throughout the pandemic, but total volume may mask large fluctuations across commodities with specific supply chain challenges. Table 4 presents statistics on total production, for the specialty crop commodities produced by the interviewees, based on data from USDA NASS.
Total production in California by specialty crop product, 2019–2021

Source: USDA NASS Quick Stats.
California specialty crop production during COVID-19 was mixed, but consistent with our findings thus far, we see no evidence of widespread production disruptions or shortages. Many commodities saw dips in production in 2020 but then rebounded in 2021, in some cases ending at higher levels than those seen in 2019. Like all other agricultural products, the specialty crop sector faces many uncertainties and risks related to weather, pests, crop diseases, government regulations, labor supply, and market access. However, different from the grain products, the specialty crop producers have access to a much smaller market, and growing specialty crops is more labor intensive. Therefore, specialty crop production tends to be volatile in general. The pandemic growing seasons were marked by volatility but, as is the case with other economic indicators that describe the specialty crop sector, it is not clear that this volatility is remarkable by historical standards.
Most specialty crops in Table 4 saw overall production decreases between 2019 and 2021, typically modest in magnitude. Almonds, one of California’s largest crops, experienced overall growth in total production between 2019 and 2021, as did pistachios and walnuts. Peaches, avocados, and blueberries all ended the 2021 season with more production than in 2019, as well. Potatoes, a low value crop by weight, fell sharply during the pandemic, and this may have been in part due to expectations of difficulty with transportation and logistics, as well as the decline in demand among foodservice buyers. Melons, also heavy and bulky, saw production fall as well. For the most part, lettuce production fell during COVID-19, excepting leaf and romaine lettuce. This was most dramatic for head lettuce, but that may have been driven by a combination of decreased foodservice demand and factors unrelated to the pandemic, such as fusarium wilt (Paugh and Gordon, Reference Paugh and Gordon2019). More work is needed to understand the extent to which production was affected by COVID-19 and issues related to labor, transportation, and the foodservice sector, but both our primary and statistics drawn from secondary data suggest that production overall was robust.
Prices received
Finally, we turn our attention to prices received for CA specialty crops. The prices received by growers are relevant to our interviews with growers, as we have established concerns related to input costs and sales, and therefore flat or decreasing farm prices likely reflect shrinking margins for growers. As with other economic indicators discussed in this paper, our investigation of commodity prices is exploratory, and we are unable to disentangle supply and demand effects on price dynamics. Table 5 reports average annual prices received for the selected California specialty crops grown by the growers interviewed, 2019–2021.
Prices received for California specialty crops, 2019–2021
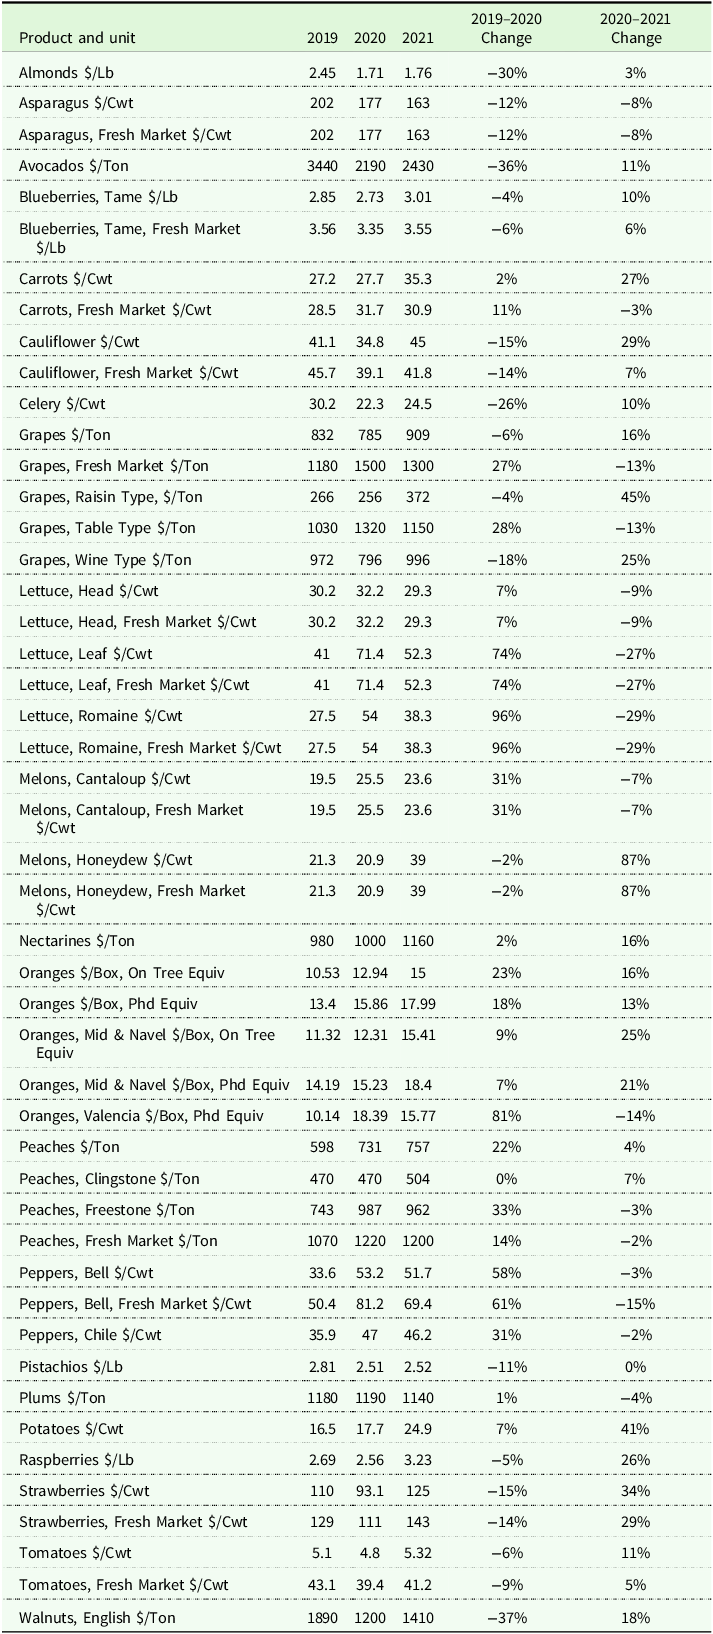
Source: USDA ERS Fruit and Tree Nuts Yearbooks and USDA Agricultural Marketing Service.
Of the 48 specialty crop items reported in Table 5, only 13 demonstrated an overall price decrease between 2019 and 2021. We therefore do not find broad evidence that margin compression was rampant for growers during the pandemic, but prices fell for several of the commodities that saw production expand during this time, including almonds, pistachios, walnuts, avocados, and fresh market blueberries. Notably, these are all perennial crops and growers are less able to adjust production in response to market pressures and labor availability. In the case of the tree nuts, transportation challenges and other COVID-related disruptions lead to sharp declines in export demand, and consequently, an increase in domestic inventories.
Perhaps the most striking narrative drawn from Table 5 is that prices were highly volatile in 2020, with many commodities exhibiting dramatic increases, and in some cases decreases, for the first growing season of the pandemic. Lettuce prices nearly doubled for some products, Valencia orange prices increased 81%, bell pepper prices increased by more than 50%, and melons, peaches, and fresh grapes all saw substantial increases. But as a further testament to the robustness of the supply chain and the effectiveness of the solutions implemented by growers, most prices that changed dramatically in 2020 reversed course in 2021, showing stabilization and reversion to a normal price trajectory. More granular data, paired with controls for sales by marketing channel and input costs, are needed to fully understand these price dynamics. However, our findings suggest that the pandemic drove price volatility for growers and generally saw prices received increase.
Discussion and concluding remarks
Via primary data drawn from interviews with growers and secondary USDA data sets, we develop a statistical portrait of the California specialty crop production sector during COVID-19. Growers consistently indicated that COVID-19 was challenging for their operations, and issues related to transportation were cited more often than any other concerns. Input costs also increased, largely due to expenditures on supplies. Many growers expressed issues related to sales, in some cases due to excessive retail demand and in others due to crashing foodservice demand. Supplies, including those related to addressing worker safety and abiding by COVID-19 protocols, were cited as the largest source of increased operating costs, and most growers identified issues related to labor, including shortages and high turnover.
We use USDA data on input costs, total production, shipment volumes, and prices received to further investigate the claims and findings drawn from our interviews. We corroborate many of the patterns shown in the qualitative grower data. As with earlier studies on the fruit and vegetable supply chains during COVID-19, we demonstrate specialty crops to be a largely resilient economic sector. We do not find evidence for widespread food loss, shipment disruptions, or sustained increases in input costs. Grower prices exhibited substantial volatility during the pandemic and for some crops increased dramatically, but for the most part were reverting to pre-COVID levels by 2021. Declining prices may indicate shrinking operating margins for some crops, particularly those with recent production growth and significant reliance on export markets, including almonds and walnuts. Truck transportation is a persistent problem for the specialty crop sector, as truck rates have increased substantially and have also become more volatile, while shortages are on the rise.
Policy implications
Corroborating extant work on agricultural production and the US food system more broadly, we find evidence that labor and truck transportation are persistent, structural issues affecting performance and output. While both problems were accelerated during the COVID-19 pandemic, neither our primary data nor the secondary USDA data exhibit signs of relief for producers with respect to availability or expense for labor or refrigerated truck transportation. Therefore, these sectors stand out as the points in the specialty crop supply chain where policy-related work on the design and costs and benefits of potential regulations or implementations are most motivated. Calvin et al. (Reference Calvin, Martin and Simnitt2022) discuss proposed policy solutions related to labor, and Schiller et al. (Reference Schiller, Bruun and Kenworthy2010) provide an overview of policy ideas and implementations for the trucking industry.
Our interviews with specialty crop growers highlight the role that trade associations played in aggregating, curating, and disseminating solutions for growers to address the challenges of COVID-19. The information networks are worth investigating further in the context of public/private collaborations. There may be a role for state and federal agencies to play in helping to understand the impacts and potential consequences of industry solutions and supporting efforts to disseminate this information. This is particularly true for producers operating in rural areas with limited internet or broadband access.
Implications for future work
Our study is exploratory, and it motivates several directions for future research. In most cases, causal analyses will call for longitudinal data with more granularity than is available publicly, which calls for the use of mixed methods, including more interviews and survey work with industry. Perhaps most pertinent for understanding the impacts of COVID-19 on growers and developing solutions to strengthen the supply chain for future shocks, we need to understand how sales, prices, shipments, and other factors differed by marketing channel and by commodity. Future work that collects and leverages data on the labor supply and transportation availability before, during, and after the pandemic could yield meaningful findings that quantify and flesh out some of the findings drawn from our interviews. The US Census maintains sector-level data on labor and employment that may provide valuable insights in this respect.
Our interviews suggest important differences for growers selling to retailers versus foodservice providers, and the USDS data indicate some important differences for fruits, vegetables, tree nuts, and possibly even for some specific commodity supply chains. Somewhat to our surprise, the USDA data indicate that input costs did not increase across the board for agricultural producers during COVID-19, and on average may have even fallen. It is important to understand if this is true specifically for specialty crop producers, but our grower interviews suggest that it may be. And if this is the case, we need to understand to what extent solutions and strategies implemented by growers mitigated increased costs.
Total production and grower prices exhibited volatile and intriguing behavior during the pandemic. For the most part, the specialty crop sector demonstrates resiliency, but questions remain as to the underlying causes of surging grower prices, decreased production, and the margin math for specialty crop growers. California is responsible for 99% of the domestic production for several commodities that are recommended for increased consumption by the U.S. Dietary Guidelines for Americans (DGA), and future research can help understand the implications of COVID-19 on the prices and availability of these foods, and help develop a set of recommendations, practices, and policies to prepare the production sector for these foods for future disruptions and challenges.
Funding statement
This research is supported by California Department of Food and Agriculture Block Grant # 21-0433-033-SF, USDA Economic Research Service cooperative agreement #58-4000-0-0069, and Cal Poly Agricultural Research Institute award #58864.
Disclaimer
The survey component was solely funded by the CDFA Block Grant and is unrelated to the scope of the ERS cooperative agreement. The findings and conclusions in this publication are those of the authors and should not be construed to represent any official USDA or U.S. Government determination or policy.
Appendix
Interview Questions
Supply Chain Disruptions and Grower Solutions: Lessons from COVID-19
1) What are the agricultural commodities you produce and/or ship?
2) What are the primary marketing channels for your commodities? We are primarily interested in grocery, foodservice, institutional sales, and direct-to-consumer. If you utilize additional marketing channels, please feel free to describe them.
3) What are the approximate revenue shares of each marketing channel for your operation? If the revenue shares vary importantly by commodity, please share that information if you are able.
4) What were the immediate impacts of COVID-19 on your operation? Please discuss impacts on product availability, sales, prices, product quality, and anything else you deem relevant.
5) If applicable, did you perceive a difference in the effect of COVID-19 on sales between organic and conventional commodities?
6) Did COVID-19 result in an increase in food waste or food loss for your operation? If so, can you explain why?
7) Did COVID-19 have impacts on your labor supply? If so, please describe impacts on hiring, turnover, retention, and more.
8) Did COVID-19 increase your operating costs? If so please discuss the important mechanisms by which this happened.
9) Please discuss any solutions implemented by your operation to mitigate the impacts of COVID-19. For each, indicate if this was a temporary change or a permanent change to your operation.
10) What were the sources you drew upon for solutions during the pandemic, if they did not originate internally from your operation?


 Open access