


The Pharmaceutical Benefits Scheme (PBS) began as a limited scheme in 1948, with free medicines for pensioners and a list of 139 “life-saving and disease-preventing” medicines free of charge for others in the community (1).
Today the PBS provides timely, reliable, and affordable access to necessary medicines for Australians. PBS is a part of the Australian Government's broader National Medicines Policy (2).
There has been continuous public interest and debate on timely access to new medicines on the PBS, especially for cancer medicines and medicines for patients with a rare disease/condition. Much of the attention has been focused on the operations of the Pharmaceutical Benefits Advisory Committee (PBAC), an independent expert body appointed by the Australian Government, whose primary role is to recommend new medicines for listing on the PBS. The process of listing a new medicine on the PBS and the operations of the PBAC, including its decision-making criteria, are well established (3).
Many analyses have been conducted on PBAC submissions and their related outcomes and timelines over the years (Reference Wonder, Neville and Parsons4–Reference Phan, De Abreu Lourenco, Haas and van der Linden8). The last analysis was published in 2018. The most recent analyses were limited to a given therapeutic area (cancer) or disease (multiple sclerosis).
Our objective was to examine PBAC submissions and their related outcomes and timelines since 2010. We updated the results of previous analyses and developed new performance metrics to reflect contemporary PBS issues, such as the use of risk sharing agreements and the availability and listing of new biosimilar medicines.
Methods
We examined the PBS Website—PBAC outcomes and PBAC Public Summary Documents (PSDs)—to identify submissions and their related PBAC outcomes for new medicines, new indications, and new combination products that had been considered by the PBAC on or after the March meeting of 2010, until the March meeting of 2018, for possible listing on the PBS. In some instances, the PBAC had considered an earlier submission before 2010.
We excluded submissions for medicinal preparations (nutritional supplements), vaccines for listing on the National Immunisation Program (NIP), and medicines reviewed and subsequently listed on the Life Saving Drugs Program (LSDP). We also excluded resubmissions for medicines that had been considered by the PBAC for the same disease/patient population prior to 2010.
We used a broad definition of “medicine” to ensure our study sample included new cellular and gene therapies.
We examined serial issues of the Schedule of Pharmaceutical Benefits to identify the PBAC recommendations that had resulted in a PBS listing as at 1 April 2019.
PBAC submissions often contain multiple requests for a single medicine or two or more related medicines. A PBAC submission may include a request to list a given medicine on the PBS for use by patients with disease X as well as for use by patients with disease Y. Another common example is a submission that includes a request to list a medicine on the PBS for use by patients with disease X as monotherapy, as well as in combination with another medicine.
Given PBAC submissions with multiple requests yield multiple outcomes, the number of outcomes in a given study period will be greater than the number of submissions. This is especially important for submissions with multiple requests that yield different PBAC outcomes. For example, the PBAC may recommend the listing of a given medicine for use by patients with disease X as monotherapy but reject the use of the medicine by patients with disease X in combination with another medicine. It would be problematic for researchers to determine if submissions like this should be classified as either a “recommendation” or a “rejection” if one adopted a “one submission, one outcome” approach, and as such the choice to categorize, where appropriate, as “one submission, multiple outcomes,” was taken. Our analysis of PBAC outcomes was therefore based on discrete medicine/patient population pairings. Each pairing was allocated a discrete PBAC outcome. Previous analyses have been conducted on a “one submission, one outcome” approach.
We created multiple patient populations and thus multiple pairings for a submission if at least one of the following criteria was met:
• The submission was for more than one technology
• The submission for the technology spanned more than one disease
• The patient population covered by the TGA-approved indication clearly describes two or more patient populations (by way of discrete bullet points/statements/paragraphs)
• The patient population described by the sponsor/PBAC clearly describes two or more patient populations (by way of discrete bullet points/statements/paragraphs/documents)
• The submissions for the patient populations are supported by different clinical evidence
• The TGA and/or PBAC outcomes for the patient populations are different
• A collective term (i.e., acute coronary syndrome/s) was used to describe the patient population
We set out to determine:
• The number of PBAC submissions/medicine patient population pairings (whole study period and by calendar year, i.e., year of consideration by the PBAC)
• The number of PBAC outcomes (whole study period and by calendar year)
• The mean period from the date of initial PBAC submission to the date of PBS listing (whole study period and by calendar year)
• The mean period from the date of PBAC recommendation to the date of PBS listing (whole study period and by calendar year)
• The mean number of submissions required to obtain a PBAC recommendation by economic evaluation type
• The number of recommended medicine/patient population pairings with an associated risk sharing arrangement (study period and by calendar year)
We assumed the date of a PBAC submission was the advertised date of the PBAC cut-off for the initial submission. We assumed the date of a PBAC recommendation was the last day of its relevant meeting.
Whilst we examined the economic evaluation/s in all submissions, the analysis was conducted using the economic evaluation/s in the most recent submission.
Our analysis of risk sharing arrangements was based on actual agreements; we were mindful that there would be rejected submissions with a proposed RSA.
We also sought to identify/examine:
• The number of medicine/patient population pairings with a base-case incremental cost-effectiveness ratio (ICER) in various bands
• The number of medicine/patient population pairings with a budget impact estimate in various bands
• Submissions and their related outcomes for new biosimilar medicines
For the analysis of base-case ICERs, we only examined medicine/patient population pairings that were supported by a cost-effectiveness analysis (CEA). We used the same bands as used by Mauskopf et al. (upper bound cost/QALY of the final base-case scenario) (Reference Mauskopf, Chirila, Masaquel, Boye, Bowman and Birt9). While the PBAC adjudicates a submission based on a particular ICER, the final agreed ICER is seldom (if ever) published for commercial-in-confidence reasons. PSDs report ICERs for outcomes in bands, and the bands used in this analysis are consistent with those used within the PSDs (10). To analyze budget impact, we only examined medicine/patient population pairings with an estimated net cost to Government, as determined by the sponsor and/or the PBAC. Again, we used the same bands as used by Mauskopf et al., which are consistent with those used within the PSDs (9;10).
Our aim was to identify and collect the band/estimate of the sponsor as well as that of the PBAC for the final patient population; we were aware that the sponsor's band/estimate might have been different to that of the PBAC or was for a different patient population.
The Department of Health has published a list of biosimilar medicines that have been approved by the Therapeutic Goods Administration (11). This list was used to identify all PBAC submissions for a biosimilar medicine.
We were mindful that our study was based on information in the PSDs and that some analyses would be conducted with missing data.
Results
Thirty-five PBAC meetings were held during the study period, at which the Committee considered 781 submissions (1,074 medicine/patient population pairings) (Table 1A). The results reveal an increase in the annual number of submissions (medicine/patient population parings) considered by the PBAC in recent times.
PBAC Submissions and Outcomes/Medicine Patient Population Pairings (2010–18)

a Submissions that included other requests were excluded from the analysis.
b Submissions included other requests that were excluded from the analysis.
c March meeting only.
d Percentages are in brackets (may not add to 100% due to rounding).
The 781 submissions yielded 1,074 PBAC outcomes (i.e., 1,074 medicine/patient population pairings) (Table 1B). The results show an increase in the annual number of PBAC outcomes for the submissions of interest over the 7-year period (from approximately 100/yr to a high of 173 in 2015).
The recommendation rate for the study period was higher than the rejection rate. The annual recommendation rate ranged from 32 percent in 2012 to 64 percent in 2013, and the annual rejection rate ranged from 22 percent in 2013 to 56 percent in 2012. The annual deferral rate increased threefold, although remained low across the analysis period (~10%).
The annual recommendation, rejection, and deferral rates are presented graphically in Figure 1.
PBAC outcome categories (annual proportions) (2010–18).

The linear trend line for the annual recommendation rate shows a small increase over time, and the linear trend line for the annual rejection rate shows a decline over time. However, there is considerable inter-year variation across the period studied.
The results for the analysis of the period from the date of initial PBAC submission to the date of PBS listing are presented in Supplementary Table 1 and Figure 2. They indicate considerable fluctuation on an annual basis; the annual mean value ranged from 357 days in 2011 to 644 days in 2014. The result for 2014 was driven by a small number of medicine/patient population pairings that took five submissions to obtain a PBAC recommendation.
Period from the date of initial PBAC submission to the date of PBS listing.

The linear trend line for the mean annual period from the date of the initial PBAC submission to the date of PBS listing indicates a slight increase over time. However, there is considerable inter-year variation across the period studied.
The results for the analysis of the period from the date of PBAC recommendation to the date of PBS listing are presented in Supplementary Table 2 and Figure 3. The results in Supplementary Table 2 indicate modest fluctuation on an annual basis; the annual mean value ranged from 187 days in 2013 to 245 days in 2014. The value/s for 2018 may increase as more medicine/patient population pairings recommended by the PBAC at the March 2018 meeting are listed on the PBS.
Period from the date of PBAC recommendation to the date of PBS listing.
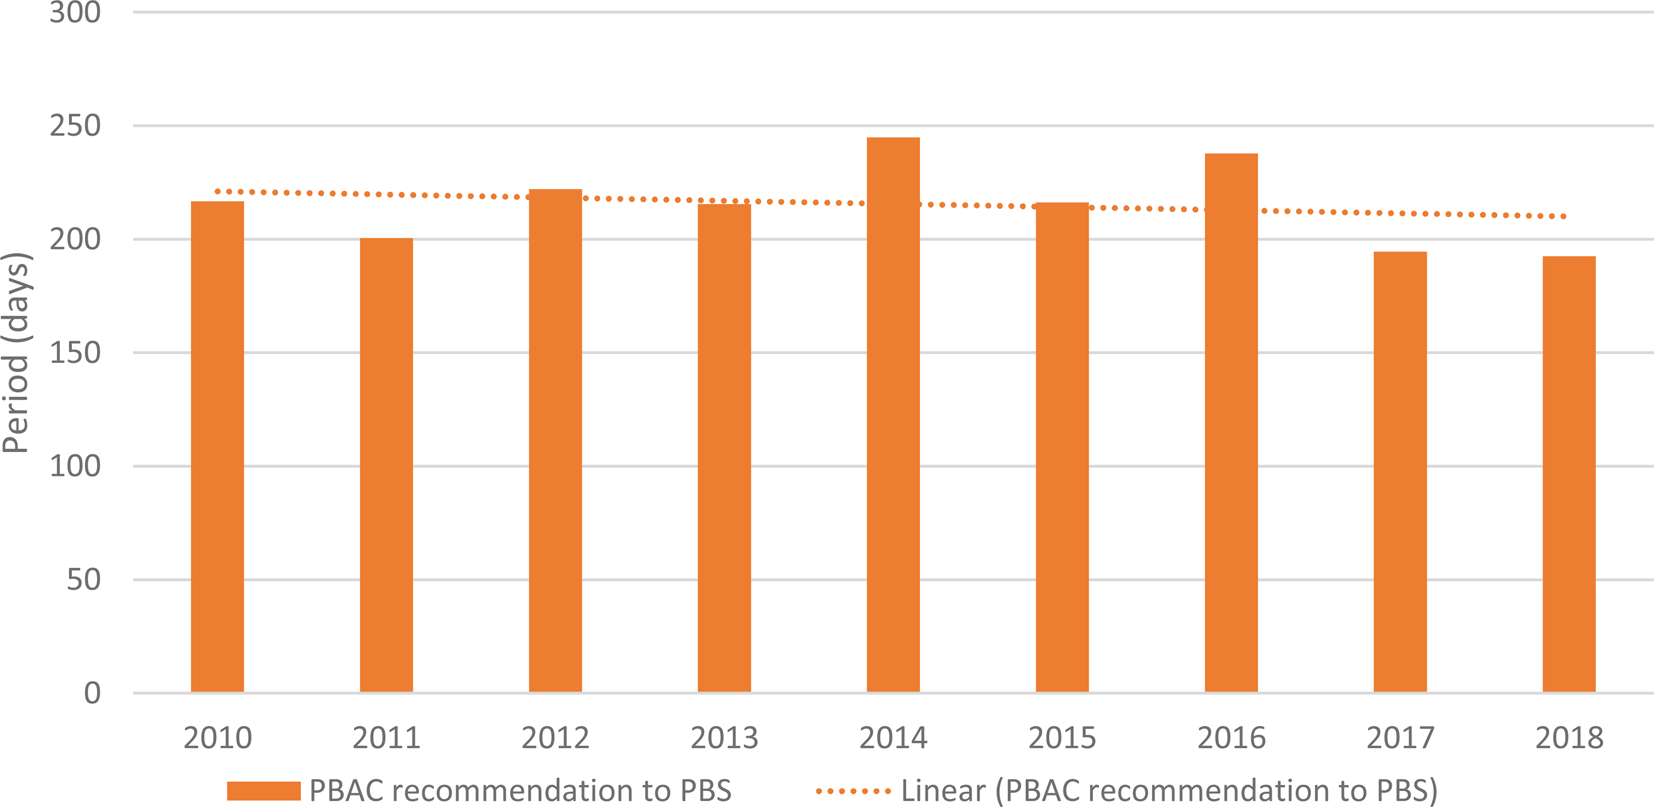
The linear trend line for the mean annual period from the date of PBAC recommendation to the date of PBS listing shows a slight decline over time, with some inter-year variation across the period studied.
The results for the analysis of the mean number of submissions required to obtain a PBAC recommendation are presented in Table 2.
Number of Submissions Required to Obtain a PBAC Recommendation

a Cost consequences analysis.
b Cost analysis.
c An economic evaluation was not included in the submission but should have been.
d Unknown because there is no PSD.
The results in Table 2 indicate that it took, on average, 1.70 submissions that included a full economic evaluation of any type, to obtain a PBAC recommendation.
It took more submissions to obtain a PBAC recommendation for a submission that included a CEA than it did for a submission that included a cost-minimization analysis (CMA).
The results for the analysis of recommended medicine/patient population pairings with an associated RSA are presented in Supplementary Table 3. The results in Supplementary Table 3 clearly show that risk sharing arrangements have become more common, in both absolute and relative terms, in recent years.
The results for the analysis of acceptable ICERs are presented in Table 3A.
Acceptable ICERs and Budget Impact Analysis (2010–18)
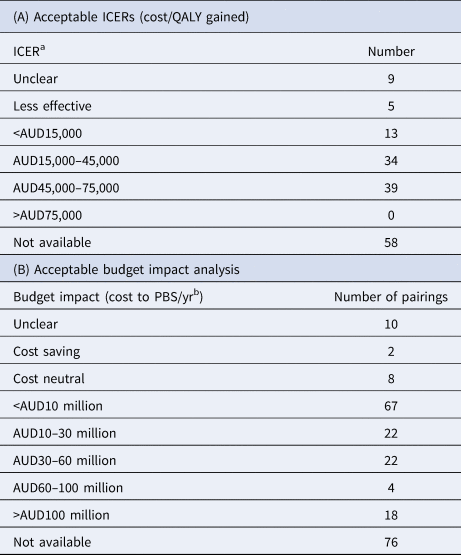
a It is important to note that the reported ICER bands may be impacted by whether a sponsor has a “special pricing arrangement” with the Commonwealth.
b It is important to note that the reported budget impact of a submission may be impacted by whether a sponsor has a “special pricing arrangement” with the Commonwealth.
The results indicate the PBAC was willing to recommend medicines in most acceptable base-case ICER bands, and the majority of the PBAC's recommendations lie within an ICER range of AUD15–75,000/QALY (Table 3). Based on the reported information, the PBAC did not recommend a medicine with an ICER >AUD75,000/QALY (USD52,500; EUR47,250 as at 1 April 2019), although the number of submissions that did not have an ICER reported is the single greatest category of outcomes. Whether this skews the results of the analysis is not clear.
The results for the analysis of acceptable budget impact estimates are presented in Table 3B. The results indicate that almost 40 percent of all medicine/patient population pairings recommended for listing on the PBS on a CEA basis during the study period were estimated to have a modest budget impact (cost <AUD10 million/yr; <USD7.1 million/yr; EUR6.3 million/yr).
Many of the submissions in the >AUD30 million/year (>USD21.3 million/yr; EUR18.9 million/yr) budget impact would likely to have exceeded the budget threshold for Cabinet consideration (>AUD20 million/yr (>USD14.2 million/yr; EUR12.6 million/yr) in any of the first 5 years of listing), and at least some of the submissions in the AUD10–30 million threshold. As the true budget impact of the listing may have been withheld due to reasons of confidentiality, and the Cabinet papers are also confidential, it is impossible to ascertain with confidence precisely how many of these submissions would have been reviewed by Cabinet.
Twelve (67%) of the eighteen medicine/patient population pairings with an estimated budget impact >AUD100 million (>USD71 million; EUR63 million/yr) relate to the new direct antiviral medicines for patients with chronic hepatitis C virus infection. This does not suggest that each patient population was estimated to have an estimated budget impact >AUD100 million.
The highest single category of outcomes is the seventy-six submissions for the budget impact were not available. Whether this skews the outcomes of the other categories is not clear.
Summary information on the submissions and their related outcomes for new biosimilar medicines is presented in Supplementary Table 4. The results in Supplementary Table 4 show the PBAC has considered a small number of submissions for a new biosimilar medicine from a variety of sponsors for a wide range of diseases/conditions. While all have been recommended, not all have been recommended/listed on the PBS with an “a” flag which permits substitution by a pharmacist at the point of dispensing.
Discussion
The PBS has served the Australian community well over many decades. New medicines across multiple diseases/therapeutic areas continue to be listed on the PBS, within the boundaries of the legislative remit of the PBAC; that is, taking into account the medical conditions for which the medicine was registered for use in Australia, and the clinical effectiveness, safety, and cost-effectiveness (“value for money”) of the medicine when compared with other treatments. Nineteen new medicines were listed in 2018, and forty-eight were listed between 2016 and 2018.
The reported cost of the PBS to the Australian Government is a combination of on-patent and off-patent medicines with generic or biosimilar competition. Total expenditure on an accrual accounting basis for the 2016–17 financial year was AUD12,058 million (excluding revenue) (USD8,500 million/EUR7,600 million), compared with AUD10,838 million for the previous year (USD7,690 million/EUR6,830 million) (12). However, it is important to note that the total cost of the PBS is somewhat mitigated by the presence of Special Pricing Arrangements, which allow the Commonwealth and a sponsor to enter into an arrangement that lists a medicine at a particular list price, while having a lower net price. This ensures that Australians can have earlier access to new medicines than might be the case if such arrangements did not exist. The estimated net cost of the PBS over the 2011–17 Federal Budget periods remained generally flat. This has been outlined in a Medicines Australia (the industry body representing Australia's research-based pharmaceutical industry) submission to the 2018 Federal Budget, using data derived from Federal Budget figures (13). The value of the rebates paid by sponsors to the Commonwealth increased over the 2011–17 period, and it is possible that this is one reason for the evidence of an increase in RSAs observed in this analysis.
The Government needs to ensure that the PBS continues to be both sustainable and flexible to accommodate the emergence of new technologies (e.g., medicines with a co-dependent technology) and new technology types (e.g., cellular therapies, gene therapies).
In accordance with the National Medicines Policy, the Government also needs to ensure that necessary new medicines are listed on the PBS in a timely manner. While the Government has implemented several reforms in recent times to improve timely access to new medicines (e.g., Cabinet review timelines, TGA-PBAC parallel processes, the Managed Entry Scheme/Program), no baseline/benchmark metrics were established, so it is yet to be determined if any of these reforms have had any meaningful effect on access timeliness. Ongoing scrutiny and analysis, such as our primary research generated for this paper, is required to ensure researchers can monitor the timeliness of access to new medicines, and where possible, seek efficiencies and improvements in various parts of the review and listing pathway.
Multiple metrics of the PBS listing process are possible. An examination of the number of submissions considered by the PBAC is an obvious metric. Our analysis revealed an increase in the annual number of submissions (medicine/patient population parings) for new medicines, new indications, and new combinations considered by the PBAC in recent times. This is not a surprising finding; nonetheless, it shows that the developers of new healthcare technologies are continuing to launch innovative products in Australia.
An examination of the number of PBAC outcomes/outcome mix is another obvious metric. The fluctuation in the annual recommendation and rejection rates is also not a surprise, but it is pleasing that the recommendation rate for the study period was higher than the rejection rate and that the linear trend line for the recommendation rate suggests a slight increase over time. Accordingly, the linear trend line for the annual rejection rate shows a decline over time.
In terms of possible metrics of access timeliness (i.e., the period from the date of event A to the date of event B), there are several milestone events and thus multiple possible options:
• Date of TGA registration
• Date of initial PBAC submission
• Date of last PBAC submission
• Date of PBAC recommendation
• Date of PBS listing
Insofar as PBS listing is the ultimate objective, the date of PBS listing is the obvious choice for event B. Each option has its merits and demerits. The data for all analyses are unlikely to be normally distributed.
The period from the date of TGA registration to the date of PBS listing is perhaps the best summary metric as it captures the period from the commencement of non-subsidized access to subsidized access. Its shortcoming is that it does not explain possible issues/delays within the evaluation process. Further analysis would be required to examine possible causes of any extreme values. This metric does not capture the potential benefits of the TGA-PBAC parallel process.
The period from the date of the initial PBAC submission to the date of PBS listing captures an activity solely in the PBS domain. The period from the date of the last PBAC submission to the date of PBS listing is more relevant for resubmissions. The period from the date of PBAC recommendation to the date of PBS listing enables an examination of the efficiency of the post-PBAC processes.
The results for the period from the date of the initial PBAC submission to the date of PBS listing indicate considerable fluctuation on an annual basis; the annual mean value ranged from 357 days for 2011 to 644 days for 2014. The result for 2014 was driven by a small number of medicine/patient population pairings that took five submissions to obtain a PBAC recommendation. While there is no consensus on what constitutes a reasonable mean period, the average mean of 17 months over the analysis period would appear to be a relatively long time to obtain access to a new medicine (or new indication) on the PBS. Further, the trend of this metric was generally flat over the analysis period. This trend would ideally decrease over time due to the implementation of various policy initiatives to improve PBS listing times. However, the analysis we have performed has not attempted to assess the complexity of submissions or the disease area, and it cannot be discounted that more recent submissions have presented more complex considerations for the PBAC. The fact that the trend is not increasing is a positive sign, as is the decreasing trend for the period from the date of PBS recommendation to the date of PBS listing.
The results for the period from the date of PBAC recommendation to the date of PBS listing indicate modest fluctuation on an annual basis; the annual mean value ranged from 195 days in 2013 to 245 days in 2014. Once again, there is no consensus on what constitutes a reasonable mean period. The trend line shows a slight decrease (i.e., a shorter period) over time. In May 2017, a new Strategic Agreement between Medicines Australia and the Australian Department of Health was signed, with the intent of delivering a more stable PBS environment, where funding for the listing of new medicines is further supported through delivering price reductions for on-patent medicines that are reaching the end of their patent life and become subject to competition (14). A commitment by Government within that Agreement is to work with Medicines Australia to improve timeliness, transparency, and efficiency in PBS listing process. It is hopeful that the trend for listing times will reduce, and that standardized metrics such as those proposed in this paper are used for tracking and outcomes measurement purposes.
With respect to the commitments to improve timeliness, transparency, and efficiency in the PBS listing process, the Australian Government has recently begun consultation on, and has now begun to implement, process improvements to the PBS listing process (15). This new analysis is well-placed to establish benchmark analyses to measure outcomes and assess the commitments that are outlined in the Strategic Agreement.
As expected, the average number of submissions required to obtain a PBAC recommendation was higher for initial submissions that included a CEA than it was for those that included a CMA. Initial submissions for a new medicine with a high clinical need (i.e., no viable treatment alternative), or a new first-in-class medicine, are more likely to include a CEA. Whilst we made no attempt to conduct any sub-group analyses in this regard, the results of such research would be very interesting from a public health policy perspective and is an avenue for future research.
Our analysis of RSAs was based on a review of the PSDs. We identified 130 medicine/patient population pairings with an RSA. Some of the RSAs were associated with a managed entry agreement. The results need to be interpreted with caution given some assumptions have been made due to missing PSDs and the incomplete and/or unclear reporting on risk sharing arrangements agreements in the PSDs.
The results clearly show that risk-sharing arrangements have become more common, in both absolute and relative terms, in recent years. This suggests the PBAC may have become more risk averse in a financial sense, or more aware of the need of Government for certainty in the cost of the PBS. Alternatively, the PBAC may have become less risk averse if the counterfactual would have been to reject the submission.
Like previous authors, we examined the PBAC's outcomes to obtain insights on the Committee's apparent acceptable incremental cost-effectiveness threshold (ICER; incremental cost/QALY gained), as the Australian Government does not report explicit cost-effectiveness thresholds for medicines. We examined the PSDs (as opposed to the PBAC papers) and limited our sample to recommendations (as opposed to all outcomes). Our analysis was limited by the inconsistent reporting of the base-case ICER for the final patient population for many medicine/patient population pairings and many missing values (highest value in Table 3).
We found very little evidence to indicate the PBAC's apparent cost-effectiveness threshold has changed over time. Whilst we found evidence of the PBAC's continued willingness to recommend a medicine/patient population pairing with a base-case ICER >AUD45,000 (USD32,400/EUR28,350), we could not determine whether the base-case estimate was closer to AUD75,000 (USD53,250/EUR47,250) than it was to AUD45,000. We did not find any examples where the PBAC recommended a medicine/patient population pairing with a base-case ICER >AUD75,000.
Our hypothesis is that the PBAC may have been prepared to accept a higher base-case ICER (i.e., AUD45,000–75,000) if there was a compelling case on other decision-making criteria (e.g., rare or high-need disease area, few if any viable treatment alternatives, low to moderate budget impact). Further analysis of the available data is required to test this hypothesis. In a recent paper (Reference Garner, Rintoul and Hill16), the authors (one a previous PBAC Chair) noted that using CE ratios as the sole basis for decision making is fraught with difficulties. While there may be insufficient information in the public domain to test the hypothesis that the PBAC is becoming more (or less) stringent in accepting a base-case ICER >AUD45,000, we postulate that the PBAC will continue to make recommendations for medicines in the AUD45,000–75,000/QALY range where sufficient rationale exists on the basis of clinical need, exceptional clinical outcomes, or other factors. What is clear is that there does appear to be a maximum threshold above which the PBAC is very unlikely to make a funding recommendation, regardless of any factor (except perhaps if the medicine is a candidate for the LSDP, which is an extremely limited list of items for very rare, life-threatening conditions).
Our examination of acceptable budget impact analyses was limited by the inconsistent reporting in the PSDs of the PBAC's estimate for the final patient population for many medicine/patient population pairings. Nonetheless, we found that approximately 40 percent of all recommended medicine/patient population pairings were considered to have a modest cost to the PBS (i.e., <AUD10 million/yr). The PBAC was prepared to recommend a small number of medicine/patient population pairings with a very high cost to the PBS (i.e., >AUD100 million/yr).
The highest single category of outcomes is the seventy-six submissions for which the budget impact was not available. Whether these skew the outcomes of the other categories is not clear. However, the absence of any published budget impact assessment for this number of submissions represents an opportunity for clarity in reporting in matters of public interest. This observation of missing data is unlikely to be noted by reviewing individual PSDs.
The number of submissions/outcomes for a new biosimilar medicine is small but will undoubtedly increase over time. All submissions considered by the PBAC were recommended, some without an “a” flag (pharmacy-level substitution), and most have since been listed on the PBS.
We were mindful that a submission's outcome and its related timelines are influenced by its quality and the evaluation process (evaluators, PBAC subcommittees, PBAC Secretariat, company responses). The information provided in the PSDs does not permit meaningful analysis of these issues.
In light of our research, we offer the following recommendations for stakeholders:
• Establish acceptable benchmarks for the period from initial submission to PBS listing and the period from PBAC recommendation to PBS listing.
• Ensure there are clear, measurable targets for future PBS reforms aimed at improving timely access. Such targets should be set before the policy change takes effect.
• The PSDs should be more consistent with the reporting of acceptable ICERs, accepted budget impact estimates, and whether risk share agreements are recommended.
• The PSDs should provide further granularity with respect to the PBAC's acceptable ICERs and accepted budget impact estimates. However, where possible, sponsors should seek to represent data with a minimum of redaction, and potentially to allow a discussion about the publication of narrower budget impact and ICER bands. While commercially sensitive information should be redactable, a balance of transparency should be considered important for the use of public funds, and narrower reporting bands may assist in discourse surrounding the PBS. Recently, in other jurisdictions, consultations or agreements have occurred on the nature of transparency in health technology reviews (17;18) and the Australian Department of Health has recently conducted a public consultation regarding standardized redactions of PSDs (19).
• Previously, a set of “PBS activity indicators” was published on the Department of Health Website (20). This was a collaborative project between Medicines Australia, the Department of Health and Ageing, and the PBAC to jointly develop indicators that can be used to monitor the listing processes as they apply to the PBS and NIP. The primary purpose of those indicators was to facilitate the identification of trends in the process of adding items to the PBS/NIP that may provide the basis for further dialogue. While reporting of these indicators has not occurred for some time, it is feasible that these indicators should be assessed contemporaneously by stakeholders and the process of reporting re-initiated to improve discourse surrounding the PBS.
In conclusion, the results reveal no major improvements in PBS listing timelines. Several analyses were hampered by a high proportion of missing data. We trust the publication of our research and the recommendations made within the paper will stimulate further public discussion and debate on the PBS listing process, improved reporting of PBAC outcomes (especially clearer reporting of specific measures in each PSD) and the establishment of PBS listing timeline benchmarks.
Supplementary material
The supplementary material for this article can be found at https://doi.org/10.1017/S026646232000029X.
Conflicts of interest
Lybrand reports support from Amgen Australia Pty Ltd, outside the submitted work. Lybrand is a salaried employee of Amgen Australia Pty Ltd, a pharmaceutical company with medicines either funded by the Commonwealth, or under consideration for reimbursement by the Pharmaceutical Benefits Advisory Committee. The paper does not contain analyses specific to Amgen products, nor comments on any specific funding or reimbursement considerations of Amgen products.


 Open access