





1. Introduction
Year-round monitoring of environmental or geophysical systems is a key part of understanding the processes governing their evolution and identifying the events that characterize a response to change (e.g. climate change), leading to improvements in forecasting how the system will evolve. Establishing long-term automated monitoring is particularly difficult for polar locations because of the challenges imposed by the polar winter environment. Although a wide variety of autonomous observational systems for polar work have been developed since an earlier publication on similar stations (Scambos and others, Reference Scambos2013), most automated systems to date are aimed at a specific primary measurement (e.g. seismicity, ice or rock movement, weather monitoring or ocean state). Here we describe a system designed to observe several environmental and geophysical parameters simultaneously, in regions where complex and interconnected changes are occurring. The areas of rapid ice-surface or basal melting, unusual ice-shelf or glacier dynamics or free-drifting icebergs are all potential sites for this kind of multi-sensor, multi-year observation system. Climate–ice–ocean observations, collected continuously for several years, greatly facilitate the understanding and modeling of local-scale interactions between climate (or weather), ocean circulation, ice loss and glacier acceleration. Automated Meteorology–Ice–Geophysics–Observation System-3 (hereafter, ‘AMIGOS-3’) stations have already contributed to several published studies spanning climate, ocean and glaciological processes on ice shelves (Lee and others, Reference Lee2019; Alley and others, Reference Alley2021; Wåhlin and others, Reference Wåhlin2021; Dotto and others, Reference Dotto2022, Reference Dotto2022; Maclennan and others, Reference Maclennan2023).
Recent ice–ocean monitoring systems (sometimes called on-ice moorings) have mainly been developed for measurements of sea ice and the underlying near-surface ocean layer, and have generally been installed on Arctic sea ice in regions of high sea-ice concentration on thick, large, stable floes (e.g. Krishfield and others, Reference Krishfield, Toole, Proshutinsky and Timmermans2008). Autonomous systems have been developed for measuring sea-ice mass balance, wave action within the pack, and upper ocean conditions, summarized in a paper discussing their application for the Marginal Ice Zone and Sea State program (Lee and others, Reference Lee, Thomson and Marginal2017). Several sea-ice mass-balance stations were developed by the Office of Naval Research, the US Army Cold Regions Research and Engineering Laboratory and the British Antarctic Survey (Shaw and others, Reference Shaw, Stanton, McPhee and Kikuchi2008; Polashenski and others, Reference Polashenski, Perovich, Richter-Menge and Elder2011; Doble and others, Reference Doble, Wilkinson, Valcic, Robst, Tait and Preston2017). Automated ice–ocean systems on ice shelves have a less wide-ranging history and relatively few types of installations (e.g., Hatterman and others, Reference Hattermann, Nøst, Lilly and Smedsrud2012). A broadly similar station to the AMIGOS-3 was deployed on the Petermann Glacier floating ice tongue (briefly described in Münchow and others, Reference Münchow, Padman, Washam and Nicholls2016; Washam and others, Reference Washam, Nicholls, Münchow and Padman2019) consisting of several conductivities, temperatures and depths (CTDs), a GPS and a weather station installed through a borehole, with access to some data and sensor control through an Iridium link. Several systems deployed on the Amery, Ross and Ronne ice shelves recorded data for longer periods for later downloading during a return visit (e.g. Herraiz-Borreguero, Reference Herraiz‐Borreguero2016; Arzeno and others, Reference Arzeno2014). The British Antarctic Survey and the Naval Postgraduate School pioneered an early attempt at automated through-the-ice moorings as part of the Pine Island Glacier drilling project in 2012–13 and a series of projects on the Ronne and Larsen C ice shelves since then (Stanton and others, Reference Stanton2013; Nicholls, Reference Nicholls2018; Hattermann and others, Reference Hattermann2021). These moorings variously featured an ascending/descending CTD profiler, a turbulent-flux sensor suite and two-way communications for both data uploading and managing the data acquisition protocol.
The AMIGOS-3 is an augmented version of an earlier system intended for surface and subsurface glacier and ice-shelf observations. The early versions of the AMIGOS stations, used during 2006–18 (Scambos and others, Reference Scambos2013), were deployed extensively in the Larsen B embayment region (e.g. Cape and others, Reference Cape, Vernet, Skvarca, Marinsek, Scambos and Domack2015; Wellner and others, Reference Wellner2019), on the Drygalski Ice Tongue in the Ross Sea (Lee and others, Reference Lee2016) and on icebergs drifting north from the Antarctic Peninsula to the South Atlantic Ocean (Scambos and others, Reference Scambos2008). The stations provide point or profile observations of a wide array of climate, ice and ocean characteristics. Data are uploaded daily by these systems using Iridium modems, several of which could not be revisited due to decreasing ice-shelf stability or late-stage break-up of the host icebergs. The stations were able to operate well past a typical polar field season. Stations installed on the icebergs documented the changing climate and ice-surface changes as they drifted northward until just before their collapse, strengthening conceptual models of ice-shelf disintegration (Scambos and others, Reference Scambos2009). Stations in the Larsen B region contributed weather data to studies of foehn wind frequency (Cape and others, Reference Cape, Vernet, Skvarca, Marinsek, Scambos and Domack2015) and validation of an accumulation model for the Antarctic Peninsula (Van Wessem and others, Reference Van Wessem2016). These stations did not include ocean or deep ice instrumentation, but did include a temperature profile of the upper firn for melt percolation and seasonal thermal variations (e.g. Scambos and others, Reference Scambos2013).
The AMIGOS-3 incorporates several new components and operational improvements over earlier systems, some of which were deployed on a prototype system installed on the Nansen Ice Shelf in early 2017 (Figure S2 and associated text). That system incorporated an ocean sensor suite and a distributed temperature sensing (DTS) system, installed through a hot-water borehole in the shelf, with goals similar to Tyler and others (Reference Tyler2013) and an installatino similar to the installation described in Kobs and others (Reference Kobs, Holland, Zagorodnov, Stern and Tyler2014). While this system was operational only briefly (see Section 2.7), it proved the value of combining climate, ice and ocean measurements (Lee and others, Reference Lee2019).
The Thwaites Eastern Ice Shelf (TEIS) AMIGOS-3 systems were initially developed in 2018 and 2019 by a diverse undergraduate engineering team at the University of Colorado’s Space Grant as part of a team-building training exercise (Figure S3). The team pioneered the initial sensor integrations, some sensor calibrations and the first operating code.
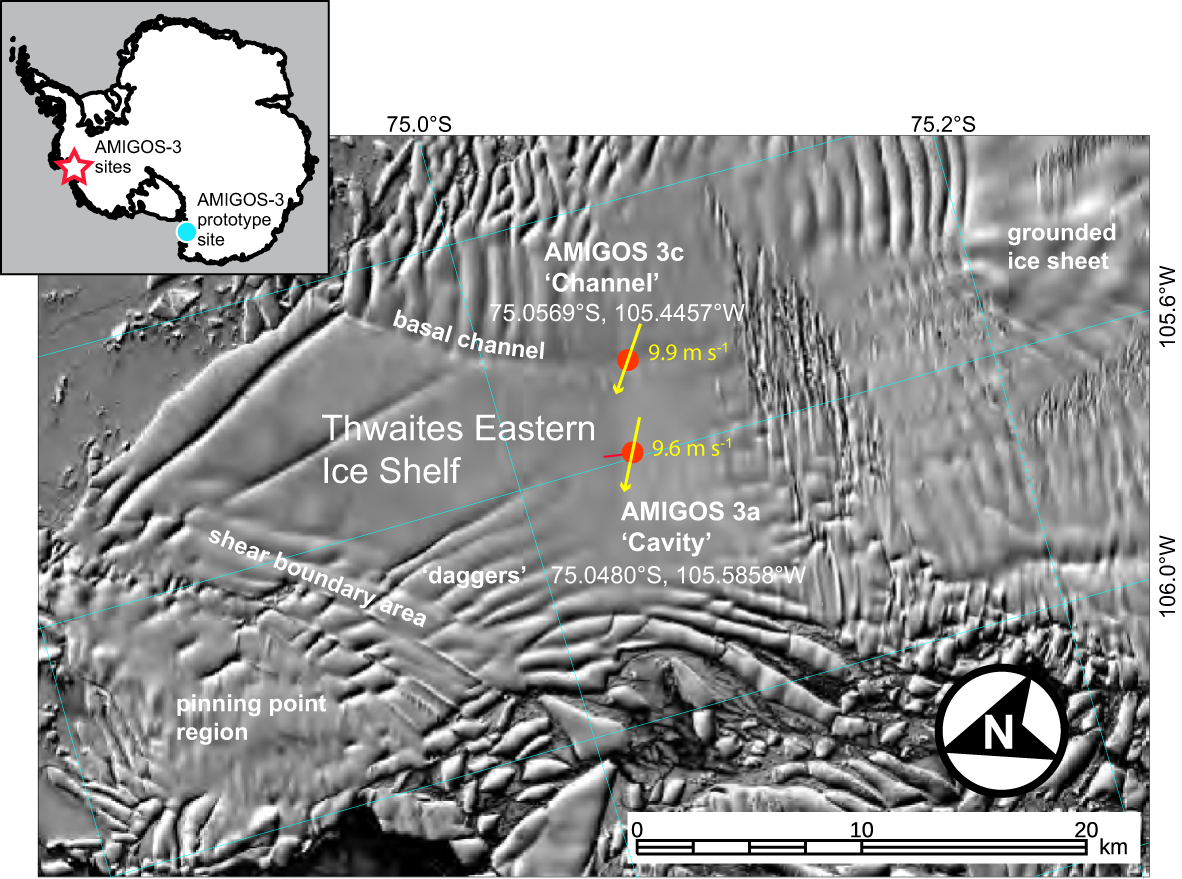
Two AMIGOS-3 stations were installed on the TEIS in early 2020, at the ‘Cavity Camp’ (75.0480° S, 105.5858° W) and ‘Channel Camp’ (75.0569° S, 105.4457° W) as part of the Thwaites-Amundsen Regional Survey and Network (TARSAN) project, a part of the International Thwaites Glacier Collaboration (ITGC: www.thwaitesglacier.org) providing regular in situ data beginning on 15 January. TARSAN is part of the International Thwaites Glacier Collaboration (see www.thwaitesglacier.org). Here, we present an overview of the components, physical structure and software as well as present the available data sets and some of the information they contain regarding the climate, ice and ocean conditions of the TEIS. The summarized quality-controlled monthly weather records for 22 months on the TEIS from the two stations are provided, including the 2020–21 mean annual surface air temperature and pressure (at 5–7 m height above the surface), and average thermistor firn temperatures. Snow accumulation from a sensor and field observations are given. Additional metadata and data visualizations from the GNSS receivers, ocean sensors and DTS are provided to show the data sets’ information content and to present the general conditions present in the TEIS environment.
2. AMIGOS-3 processing and software
2.1. AMIGOS station overview
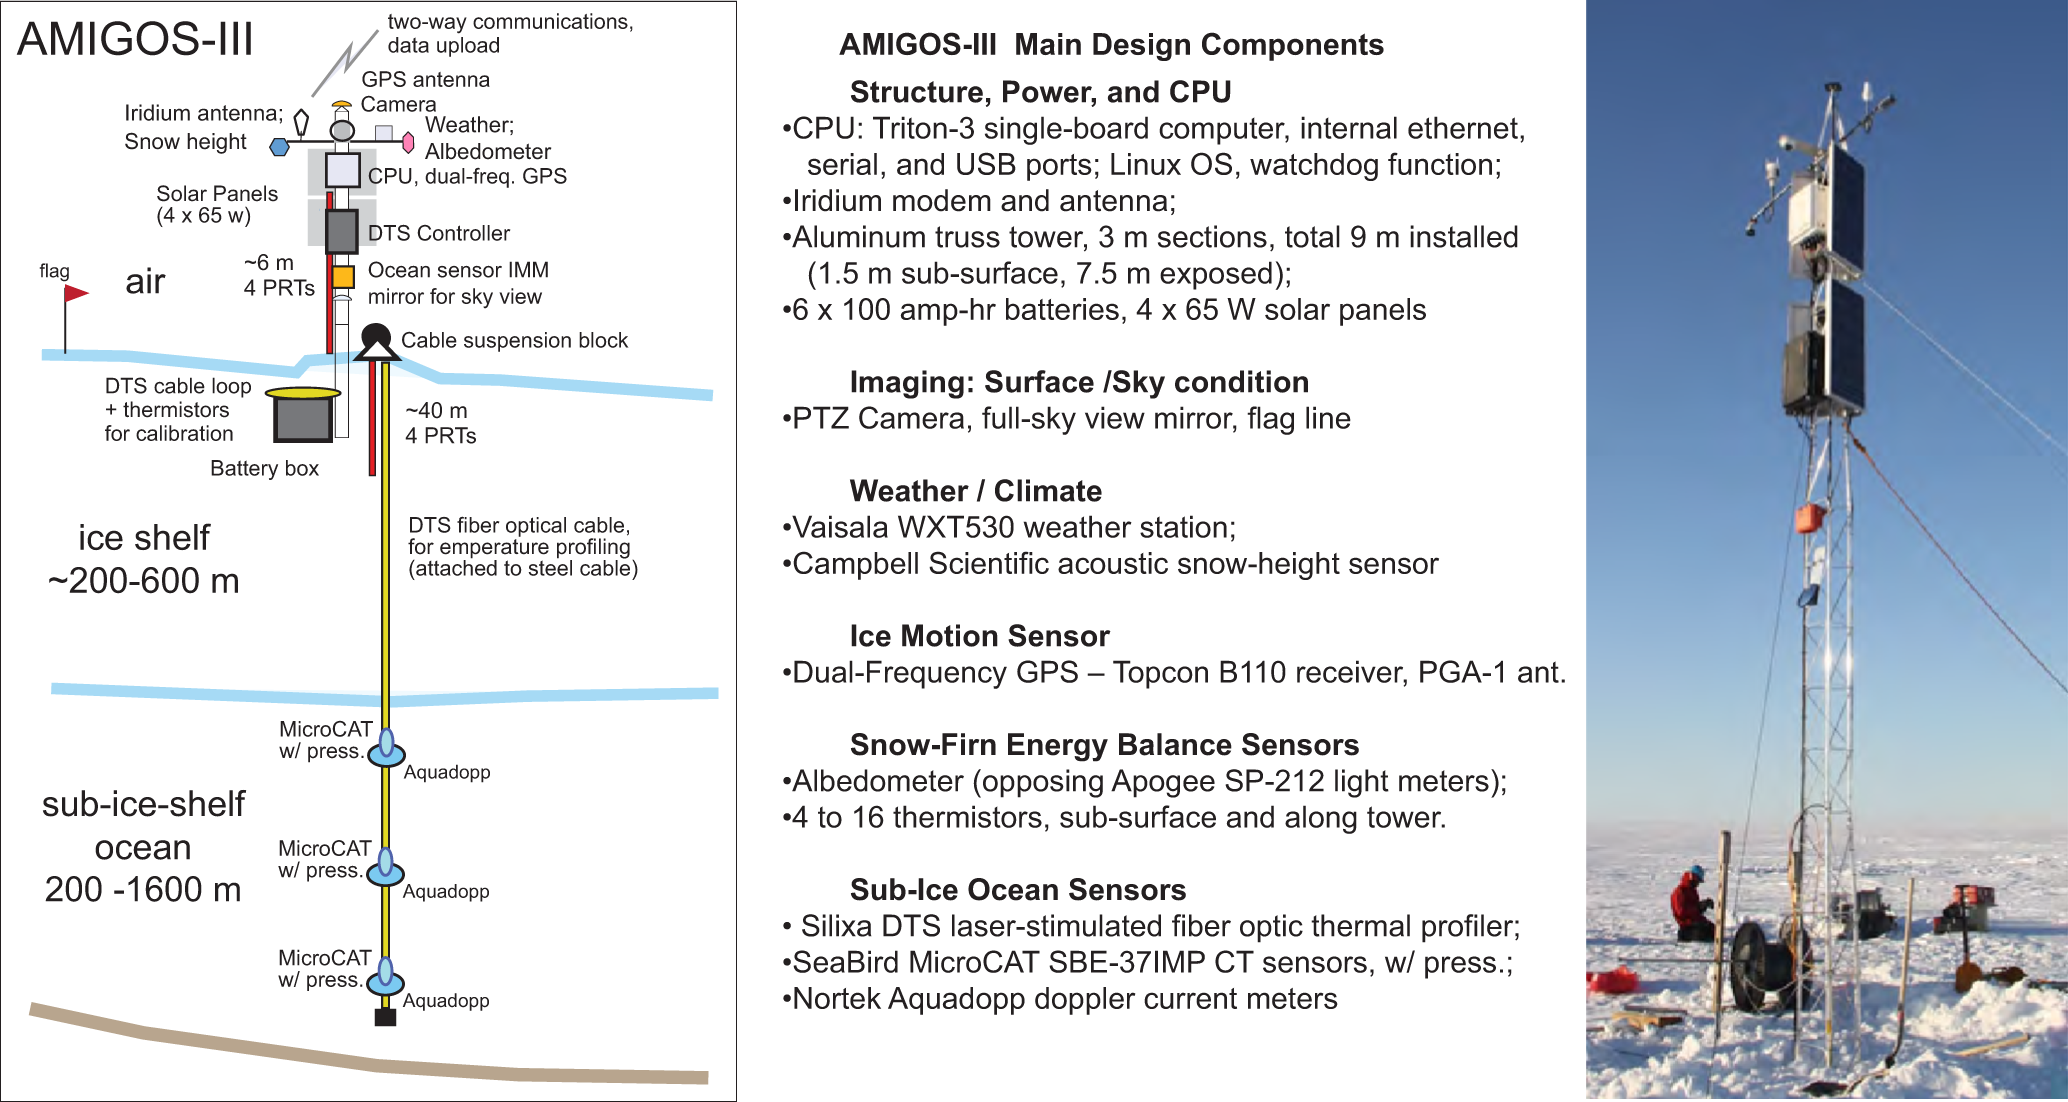
Figure 1 provides a tabular listing of the main operating components and sensors for the AMIGOS-3 system, and a diagram and photo of an installation. Further details and photos are provided in the Appendix, Supplemental Information Table S1, and Figures S1 and S2. The station sensor suite includes weather and albedo instruments, an acoustic snow height sensor, a camera, a GPS receiver, multiple ocean sensors—ncluding SeaBird MicroCAT CTD sensors Nortek Aquadopp single-point current meters—and a Silixa DTS fiber-optic interrogator and 1600 m fiber cable extending through the snow, ice and ocean beneath the sensor installation. The AMIGOS-3 and prototype installation locations are shown in Figure 2.
Listing of major components of the AMIGOS station (left) and sketch of an idealized installation of the AMIGOS-3 ice–ocean–atmosphere station (center). Installed AMIGOS-3a at Cavity Camp, TEIS in January 2020 (right). See also Appendix, Table S1 and Figures S1a, S1b and S2.
Location of the two AMIGOS-3 stations on the Thwaites Eastern Ice Shelf and structural features of the shelf at the time of installation. GPS track of movement of AMIGOS-3a ‘Cavity’ for January 2020–October 2021 is shown as short red line extending from initial position; total GPS recorded motion of AMIGOS-3c ‘Channel’ is within the site marker. Yellow arrows indicate mean wind direction for the two sites, with mean wind speed shown next to them. Landsat 8 image (Path 3, Row 113) acquired 31 January 2020. Inset, map of Antarctica showing AMIGOS-3 sites (red star) and the AMIGOS-3 prototype site (cyan dot) on the Nansen Ice Shelf.
2.2. Main control board
The Triton-3 CPU board was developed by co-author R. Ross in 2013. (For the following section, see the technical acronym list in Appendix 1.) The main board is designed to have sufficient capability to manage the operating system, coordinate measurements and interface with the sensors, perform some data preprocessing and file configuration, and then manage the upload of the data within hours of data acquisition. The system can retrieve commands from a remote directory that updates internal operating code, reconfigures the data-acquisition schedule, and supports troubleshooting. The Triton-3 board controller consists of a single commercial system-on-module (SoM) 144-pin SODIMM form factor plugged into a custom carrier board. (A SoM is a small, embedded module that contains the core components of a microprocessor-based computer on a single interchangeable card.) The SoM is an EMAC Atmel ARM9 Jazelle AT91SAM9260 200 MHz processor with 64 MB SDRAM and 64 MB flash memory in a form factor of 67 mm × 38 mm (Table S1a), with a 128 MB serial data flash and an SD/MMC flash card interface. The CPU has very low power requirements (1.5 W run mode, 40 mW sleep mode) and is rated for low-temperature operation (to −40°C).
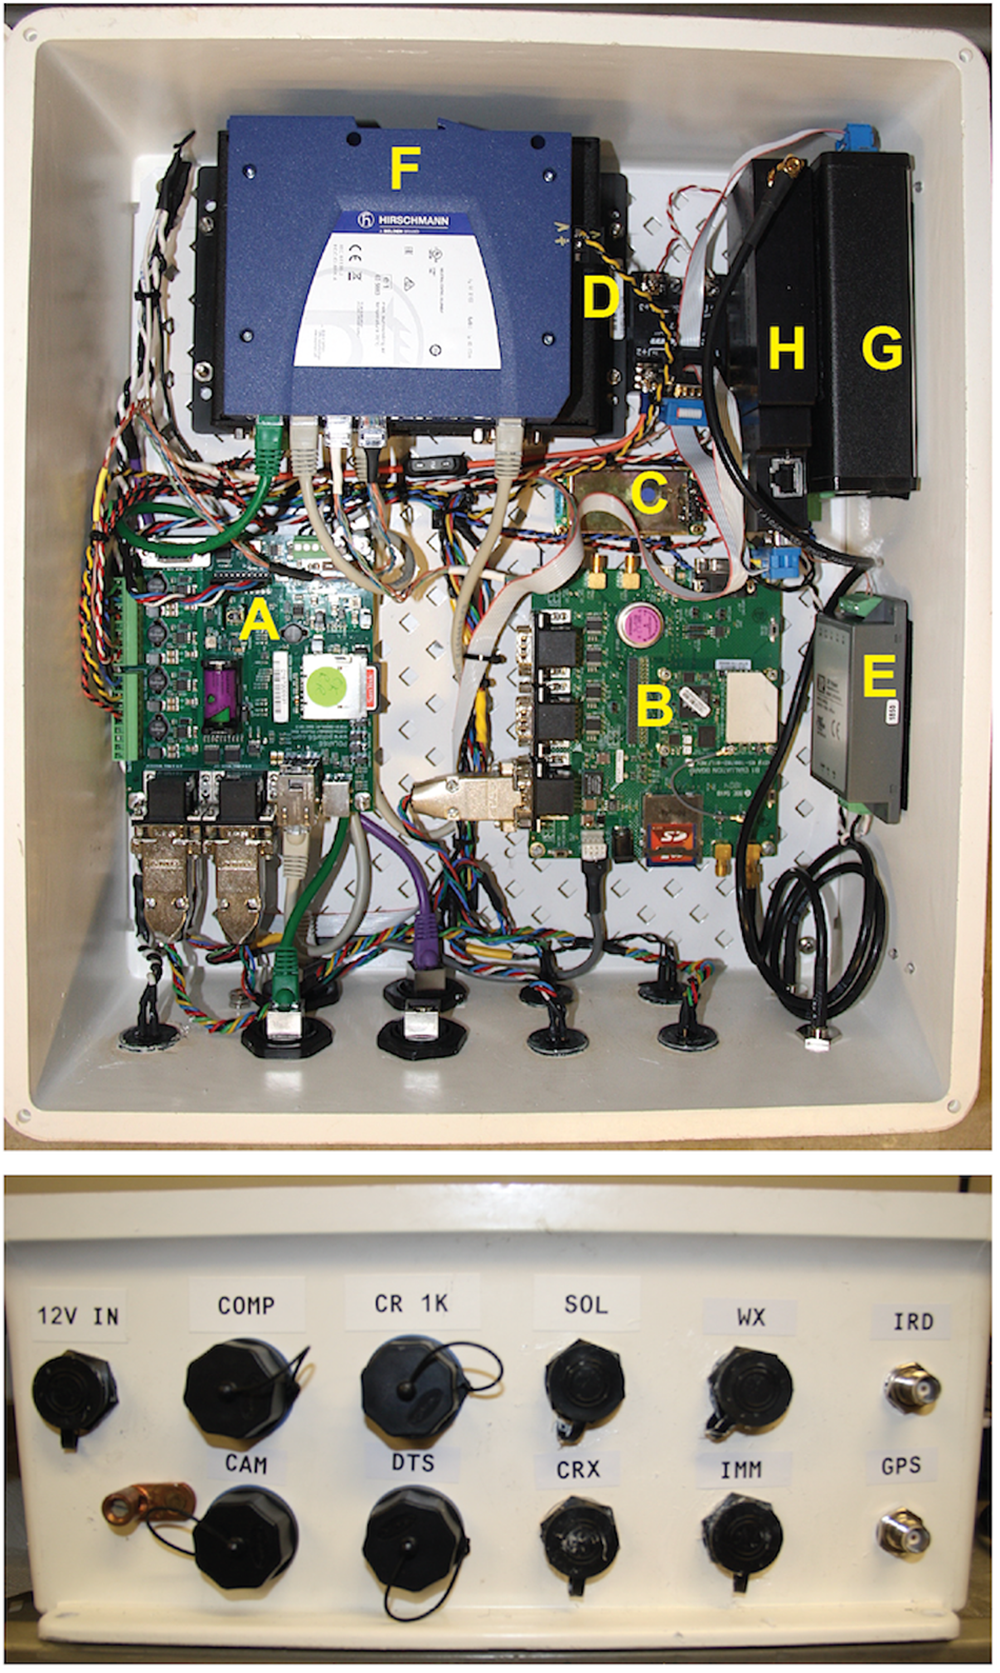
A custom carrier board was designed for the SoM (hereafter, we refer to this board with the SoM as the ‘Triton-3 board’; Figure 3). The carrier board, measuring 114 × 127 mm, is equipped with an SD/MMC flash card interface, a 10/100 BaseT Ethernet interface, two USB-2.0 host ports, a device port, four RS-232 serial ports and a console RS-232 port, an I2C port, four 10-bit ADC channels, three GPIO-controlled pass-through voltage outputs, seven GPIO-controlled switched voltage outputs (4 × 5 V, 3 × 11.6 V), a single LIN bus and a CAN bus. The carrier board supplies regulated power to the module and has over/under voltage protection, reverse polarity protection, electrostatic discharge protection and a four-channel ADC for measuring input voltage and current draw. In addition, the carrier board includes sensors for temperature, humidity, pressure, a three-axis compass and a three-axis accelerometer, although these were not used in the described installations. The system includes an external PIC microcontroller-based watchdog timer to reset the system in case of software malfunction.
Interior of electronics enclosure box (top) and electronics box connector panel (bottom). Top panel has the major electronic components labeled: A, Triton board from Polar66 Engineering (R. Ross); B, TopCon B110 GPS receiver and carrier board; C, SeaBird Inductive Modem Module (IMM) for decoding inductive data transmission from the ocean sensors; D, WinSystems Windows-OS computer for interfacing with the DTS controller; E, a power regulator to provide 12.0 V to the PTZ camera; F, Ethernet hub; G, dial-up router; H, NAL AL3A-R Iridium modem. The white electronics enclosure box is 40 × 30 × 25 cm. Lower panel is an image of the exterior bottom wall of the enclosure, showing the port arrangements for the AMIGOS-3. Port functions clockwise from upper left: power, Ethernet access (for operator), Campbell Scientific CR-1000X Ethernet, four-wire input for albedometer, five-wire input for Vaisala weather data and sensor power; two-wire input from SeaBird inductive coupler circuit (ICC) to IMM; three-wire power input to the CR-1000X; DTS Ethernet; camera Ethernet (with power-over-Ethernet); grounding lug.
2.3. Operating system
The operating system is based on the OpenEmbedded 4.0 Linux distribution, running the Linux 2.6 kernel. A selection of basic cross-compiled utilities and services—such as SFTP, SSH, as well as a collection of scripts, system configurations and Python code—is included, which forms the core of the operating software system. The operating system runs from a high-performance built-in flash drive, while data storage and high-level operations software utilizes the high-capacity removable SD card. The operations software is flexible and configurable, making it easy to adapt to new sensor suite configurations or collection schedules. The central scheduler and supervisor scripts manage the collection and transmission of sensor measurements, data uplinks, and file and sensor maintenance activities. It is designed to be robust to hardware failures and intermittent power. Shared resources (e.g. networking hardware, processing) are managed to avoid conflicts and interactions, and to minimize power usage as much as possible.
2.4. Software architecture
The AMIGOS-3 units operate on a daily cycle of two main processes. The first is the scheduler, which is generally always running, sequencing the sensor measurements, data uplink periods and sleep/hibernation. The scheduler manages shared resources, powering and operating peripherals, and handling errors/failures in subsystems. The scheduler also monitors the power and initiates a sleep mode for the station when idle or when the supply voltage is low, resuming operation once power is restored. The second major process is the supervisor, which is independently triggered twice a day and performs maintenance activities (e.g. archiving logs/data, cleaning queues, stopping/starting the scheduler), system health monitoring and execution of remote commands, software updates, etc.
2.5. Sensor and uplink communications
In addition to the main Triton board, the main electronics enclosure includes internal and external communications components: an induction modem for communicating with the ocean instruments; and an Ethernet hub, dial-up router and Iridium modem for data and station-health uploads (Figure 3, Table S1b). Also within the enclosure is a compact computer operating Windows 7 for communicating with the DTS internal operating code. Much of the AMIGOS-3 data are transmitted in near-real-time as Iridium files or messages delivered to a research institution data server via email (with further processing and staging steps taking place there). Larger data files are uploaded via the dial-out gateway and file transfer protocol (FTP). As Iridium uploads are a significant part of the power budget, a queue of uploads is maintained and sent out in batches as power and connection quality permit.
The AMIGOS-3 stations use a NAL Research Corporation A3LA-R Iridium modem for data uplink via single-burst data (SBD) packets or file transfers using a point-to-point protocol (PPP) gateway connection and FTP. These modems and the present Iridium satellite network provide a nominal data rate of 9600 baud in dial-out mode. Single bursts of up to 2000 bytes can be transmitted quickly and reliably using the SBD protocol, although larger data files are more efficiently transferred using a PPP dial-out connection. To handle connection dropouts, large files are segmented into 10-kB chunks and added to a managed queue to be uploaded using FTP during scheduled dial-out times, typically several times per day. With signal strength variability and transmission protocol overhead, the effective data transfer rate averages empirically to ∼2000 baud. These dial-out sessions are also utilized by the units to receive and execute command scripts and software updates which are staged to the FTP server by the operator. The AMIGOS-3 station ‘picks up’ new instructions during dial-out sessions. This approach was taken because of the difficulty in connecting with the system during dial-in, and the power consumption needed to have the AMIGOS-3 system in an Iridium-on mode for extended periods.
2.6. Power
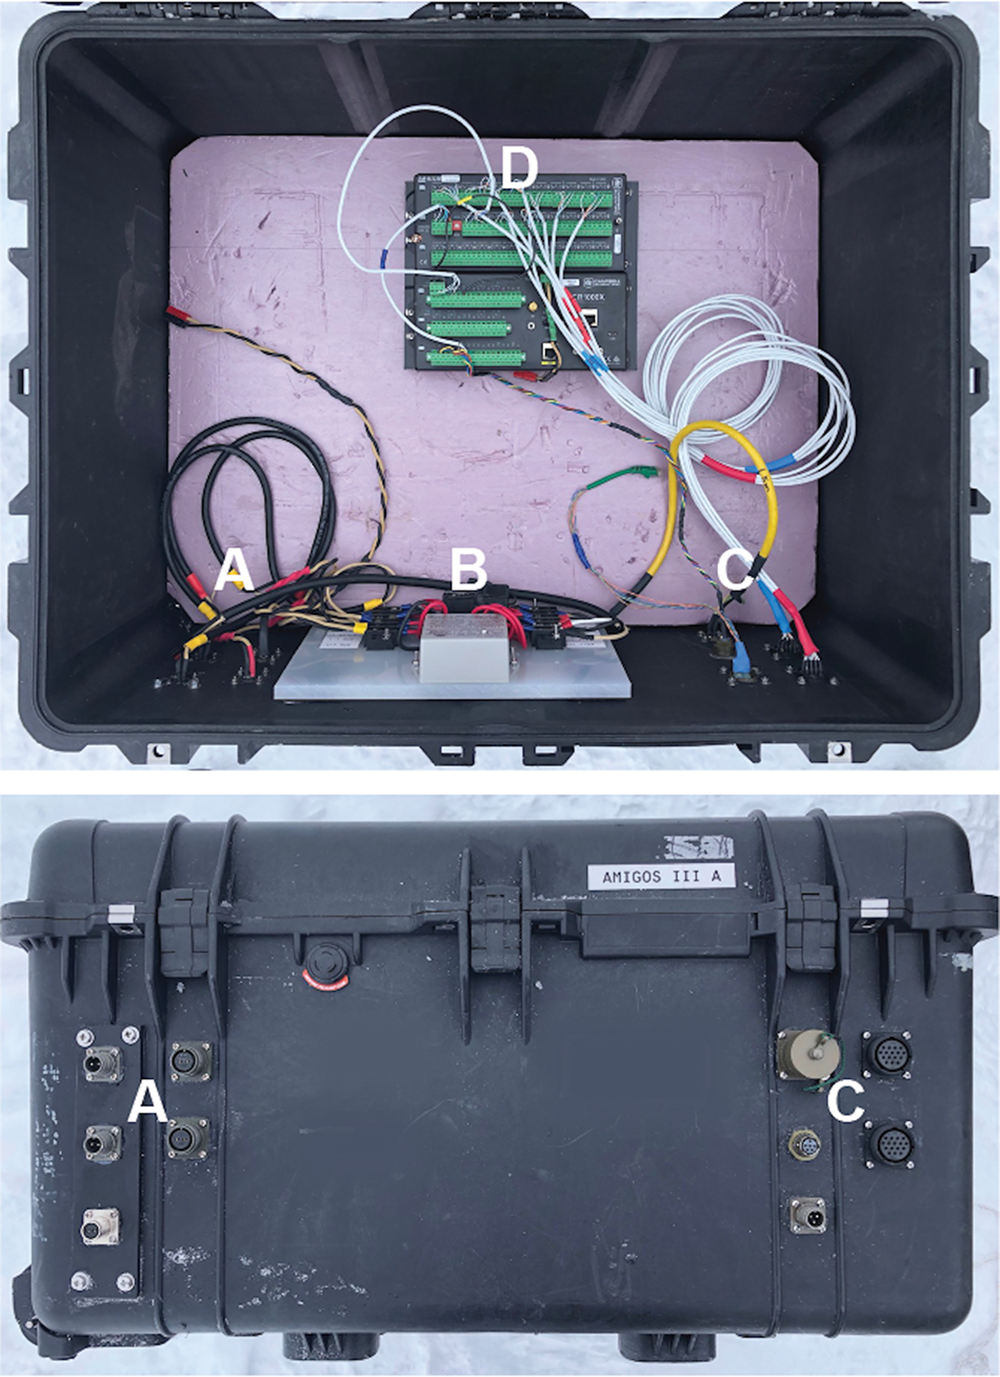
The battery box (Figure 4; Table 1b) contains six 100 A-h batteries, a solar power controller and the CR-1000X data logger, which supports the temperature-sensor array and sonic-ranging sensor.
Interior of the battery box enclosure (top) and battery box connectors (bottom) for the station in Figure 3. Six 100 A-h batteries fit in the box with 6.5 cm clearance along the connector panel wall. Top and bottom panel labels: A, solar panel input (left side, top two ports), spare power output (lower left side port), main power and DTS power output (right side, two ports); B, solar power controller for battery recharging and system fuses; C, sensor and data input ports (Ethernet port for CR-1000x, top left, snow height sensor input, middle left’ power output to DTS, lower left; top right, borehole thermistor cable input; lower right, tower air-snow thermistor cable input); D, CR-1000X data logger for thermistors and snow height measurements. Battery box enclosure is 80 × 65 × 45 cm.
Temperature (°C) and pressure (mbar) data for the two AMIGOS-3 sites

Note: Data are averaged from hourly reports. Data values in italics indicate the month had too few reports to be included in yearly mean assessment. Data in blue at AMIGOS-3c were used for the 19 month annual assessment.
* Asterisks next to total hourly reports indicates a partial month.
† Range of depth in firn as snow accumulated.
‡ Initial height above snow.
§ Partial August data, monthly average used.
2.7. Failure modes
AMIGOS installations have suffered from a variety of failure modes over the ∼15 years of installation and data collection activities. Other than burial or direct weather-related damage (e.g. tearing off of a solar panel in high wind), most common have been issues with the Iridium communications (using NAL Research Corporation A3LA-XA units) which in earlier installations had issues with low-temperature operation, as determined from long-term outdoor testing in Boulder Colorado. In more recent systems, newer Iridium transceiver units (NAL A3LA-R) and a greater reliance on single-burst-data (SBD) transmissions have largely eliminated this problem. Static electricity build-up and discharge in dry cold high-wind conditions likely caused the failure of a prototype installation of the AMIGOS-3 system on the Nansen Ice Shelf, ending its operation as autumn katabatic winds increased. This is a known and difficult problem in cold polar environments, since effective grounding is difficult.
Environmental events that led to system failure or long-term down time include heavy rime icing and damage from meltwater. Rime icing is a known problem in areas with super-cooled ice fog, such as at or near the summit of a ridge or dome; this can encase the antennas and weather sensors in thick frost, rendering them inoperable. One early AMIGOS station placed on the remnant Larsen B Ice Shelf at Scar Inlet experienced some firn meltwater flooding in 2010, which slowly filled the battery box (despite water resistant seals) and then discharged the batteries when the water level reached the terminals. (The gradual filling was documented by rapidly changing indicated temperatures in the thermistor string as the data logger, housed in the same enclosure, slowly had its contacts flooded, changing the net thermistor circuit resistance). The acoustic snow-height sensors failed on the two TEIS AMIGOS-3 stations after 10–12 months, likely due to fine snow particles dampening the return signal sensitivity.
3. AMIGOS-3 sensor suite
By combining several sensors at one observation site, the AMIGOS stations can provide insight into the relationship between environmental factors, or contribute to evaluating processes and linkages for various forcings or drivers. The AMIGOS-3 sensor group installed on TEIS in 2020 (Figure 1; Table S1) included a camera; weather and snowfall sensors; an albedometer; near-surface snow temperature sensors; a precision GPS; a DTS fiber-optic system for snow, firn, ice and ocean temperature; and ocean instruments (CTDs and current meters).
3.1. Optical camera
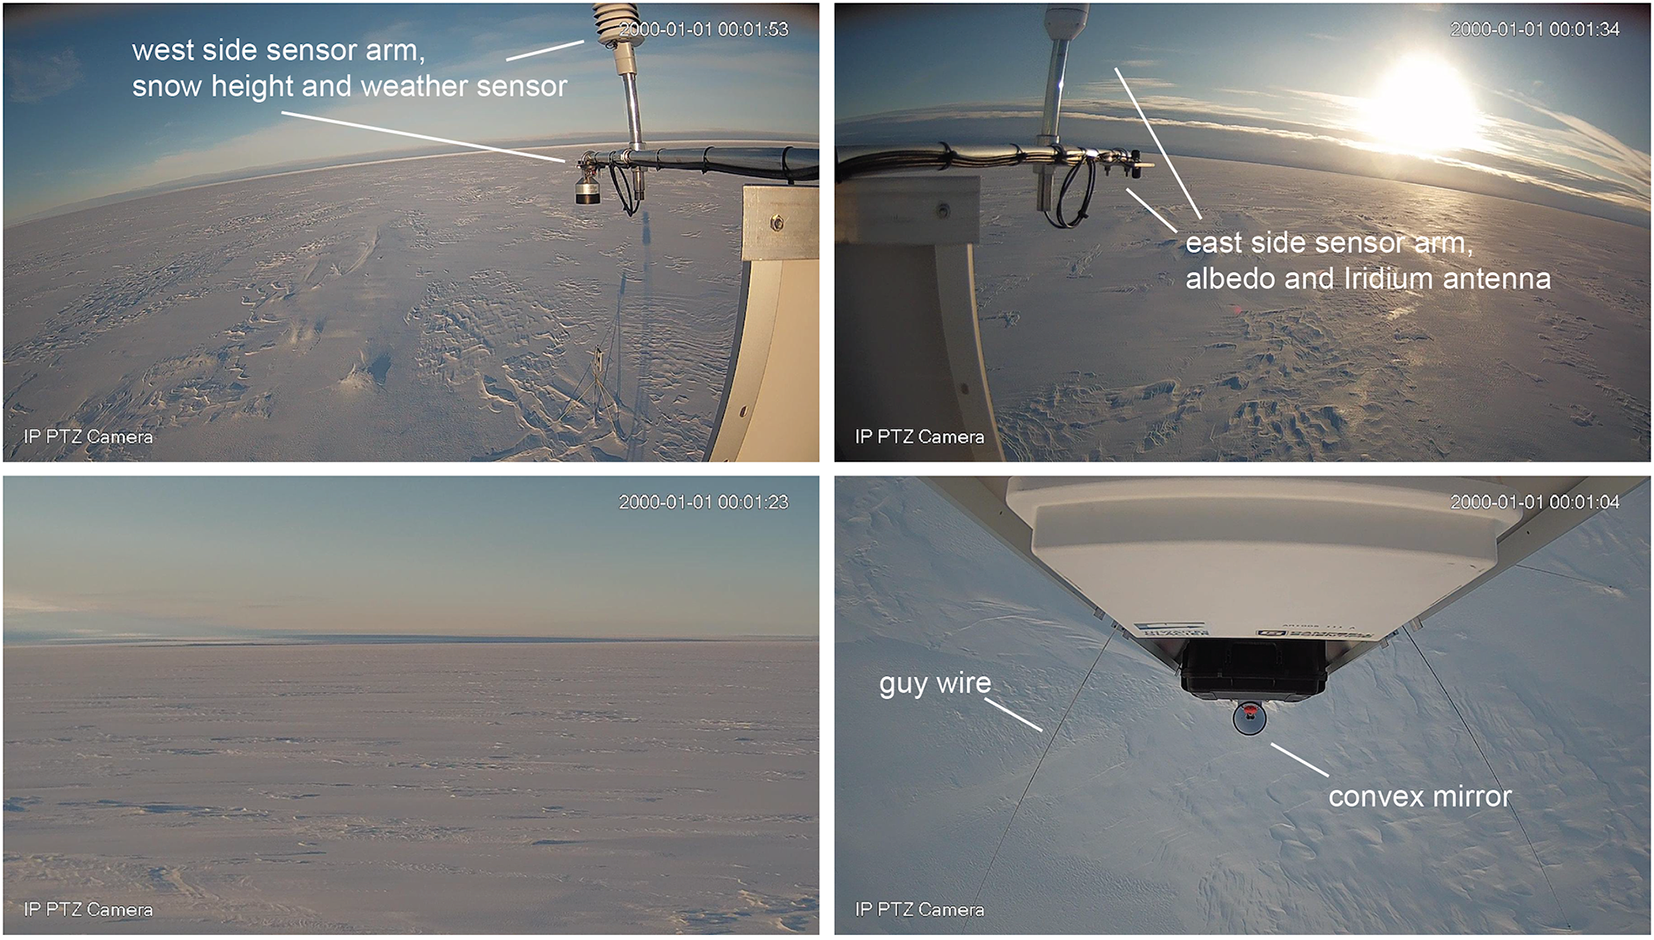
The camera selected for the AMIGOS-3 at TEIS is a compact point-tilt-zoom outdoor video and still 1080p IP camera that operates on 12 V power (conditioned in the main enclosure to 12 ± 0.2 V), rated to −25°C, with low-light mode and 2× optical zoom. The Ethernet-linked camera can record changes in the surroundings (e.g. crevassing, melt pond formation, sastrugi formation and movement) and can take images of snow accumulation stakes or nearby flag arrays, creating a record of snow accumulation and surface roughness (Figure 5). The camera program collects images looking along the sensor arm (in the case of TEIS, oriented east-west) and toward an unobstructed view away from the solar panels (at TEIS, south), as well as down along the tower structure. A convex mirror mounted below the main enclosures enables another view of the tower components and a sky view when the camera is in zoom mode. These are uploaded at reduced resolution daily. Images are typically collected four times per day, excluding polar night, and stored on board at full resolution.
Images acquired and uplinked from the AMIGOS-3 installation at the Cavity site on 15 and 16 February 2020, 1 month after installation. Upper images are looking westward (left) and eastward (right) at ∼12:12 UTC on 15 February. Weather sensor and acoustic snow-height sensor are in the westward image, along with the upper corner of a solar panel and the sensor cross-pole; Iridium antenna and albedometer are seen in the eastward image. Lower left image is looking southward, also at 12:12 UTC. Lower right image is looking downward at the snow surface on 16 February at 04:12 UTC, with convex mirror and guy-wire supports. Close-up image (not shown) of the mirror can reveal sky and tower conditions.
3.2. Weather and climate sensors
The AMIGOS station includes an all-in-one weather sensor (Vaisala WXT530). Weather station data for the TEIS installations were gathered hourly based on 10 min of observations just before the UTC hour. The Vaisala weather station records wind speed and direction (using an ultrasonic Doppler ranging method; ± 0.3 ms−1; ± 3° azimuth), air temperature (±0.3°C, −52°C to +60°C), humidity (±3%; degrading to ±5% near saturation) and barometric pressure (±1 hPa under polar conditions).
The sensor suite also includes two additional instruments related to weather conditions and snowfall: an acoustic snow-height sensor (Campbell Scientific SR50A-L) and an albedometer comprising two Apogee Instruments SP-212 hemispheric pyranometers mounted in opposing directions to gather the upward and downward hemispheric reflectance. The acoustic snow-height sensor has an accuracy (after correction for air temperature) of ∼±3 cm; this accuracy level decreases with falling or blowing snow. Snowfall events (increasing height trend on a daily basis) and ablation events (decreasing height) are evident in the data. The accuracy for the solar and reflection pyranometers is ±20 W m−2. Conditions at TEIS were not as conducive to measuring snow albedo variations as on the Larsen B Ice Shelf glaciers and remnant Scar Inlet ice shelf (Scambos and others, Reference Scambos2013), because frost and snowfall on the TEIS sensors degrade the albedo data time-series. (Snow accumulation is very low on the eastern Antarctic Peninsula, unlike the Amundsen Sea coast; Van Wessem and others, Reference Van Wessem2016).
Moreover, melt events and snow grain-size evolution are not as frequent or apparent at TEIS as in the Larsen Ice Shelf area. Overall, snow albedo under ideal conditions (high sun, >200 Wm−2; low humidity, <85%) averaged 0.89 with 90% of the variation ranging between 0.80 and 0.98 at the Cavity site in the first year of operation.
A temperature-sensor string, containing eight 1000 Ω platinum resistance thermometers, is included for determining the firn-temperature gradient, and, when installed along the tower above the surface, is a backup means of measuring snow accumulation and air temperature. Calibration for the temperature sensors before the field deployments, using a chilled circulating alcohol bath and millikelvin calibrated thermometer, established their individual coefficients for converting resistance to temperature with an accuracy of ±0.02°C. The temperature-sensor string can also serve as a calibration reference for the DTS thermal profile. The sensors are designed to be installed at −40, −20, −10, −6 m, and +2.5, +4.5, +6.5 and +8.5 m relative to the initial snow surface. The string is attached to a Campbell Scientific CR-1000X data logger located in the battery box and includes a reference resistor and an internal temperature sensor.
3.3. GPS receiver
The dual-frequency GPS sensor is the TopCon B110 with the TopCon PG-S1 compact antenna (without a ground plane, to reduce wind drag). The B110 is mounted on a carrier board intended for software development to facilitate simpler coding for GPS operations. The system has proven capable of providing positions precise to within ±3 cm with 20–40 min acquisition periods (15 or 30 s epoch acquisitions) and provides precise elevation data as well. GPS data results are discussed in Section 4.4.
3.4. Borehole cable sensors
The borehole cable sensor suite comprises four different sensor types: the lower four sensors of the temperature-sensor string, described above; a fiber-optic DTS thermal profiling system measuring both the internal ice and the ocean conditions; and paired sensors for ocean observations, consisting of a SeaBird MicroCAT SBE 37-IMP CTD and the Nortek Aquadopp single-point Doppler-based ocean current meters (see Table S1). The ocean moorings of the AMIGOS-3 stations are arranged as pairs of instruments, with a CTD set 2 m above the current meter instrument.
The AMIGOS-3 DTS system is a Silixa XT-DTS, selected for its low power consumption, fast start-up and 12 V d.c. operation. (The earlier AMIGOS-3 prototype used a Sensornet DTS.) As noted above, a Windows processor in the main control enclosure is needed to boot up the DTS system and run data collection scripts for the units. The DTS laser interrogator is attached to a fiber-optic cable that is connected to a steel cable with small pull-ties set approximately every 2 m. The spatial resolution of temperature measurements along the fiber cable is 0.25 m, but this was generally resampled to 1 m as a way to compress the data, although the 0.25 m rate was uploaded in the 200 m section spanning the ice–ocean interface. The steel cable serves as both a strength member for the ocean instrument string and as a communication conduit for the inductive modem data communications system.
Power requirements for the DTS units were large, up to 20 W for several minutes during start-up. The data collection schedule (and therefore the power consumption) is managed using Iridium downlinked commands. The nominal profile acquisition plan is 6 d−1, allowing the recovery of any tidally paced variations when abundant solar power is available, but can be reduced as needed in late winter.
The DTS data require independent measurements or estimates of temperature at several points along the cable for calibration. For the AMIGOS-3 systems, the DTS was calibrated using a simple two-point (slope and offset) calibration to match each of the two SeaBird MicroCAT temperatures collocated on the mooring cables. The MicroCAT measurements were available on a 10 min cadence, and were interpolated to match the time of each DTS measurement. A standard three-point calibration (Hausner and others, Reference Hausner, Suárez, Glander, Van de Giesen, Selker and Tyler2011) was not used as the thermistors buried with the coiled fiber near the surface exhibited considerable variability, resulting in unstable calibrations. Temperature resolution was ∼0.03–0.04°C at the lowest reaches of the moorings based upon spatial variance estimates over depths of expected uniform temperature.
In the two deployments of the AMIGOS-3 stations on TEIS, the DTS fiber-optic cable was a multistrand thermal-sensitive steel-jacketed cable between 1200 and 1600 m long, manufactured by Brugg Cables. The cable consisted of a fiber-in-metal-tube (FIMT) system with stainless steel strength elements wrapped over the FIMT and overlain by a polyurethane jacket. Three of the fibers were multimode fibers: two configured as duplexed with a sealed turnaround at the bottom of the cable, and the third as a simplex fiber. One of the four fibers in the cable was an acoustic-sensitive (single-mode) fiber for use with a Distributed Acoustic Sensor interrogator as part of follow-up field work (not a part of the AMIGOS-3 automated system).
4. Climate, ice and ocean conditions from the AMIGOS-3 sites at TEIS
We discuss a few selected scientific results from AMIGOS-3 data to demonstrate the application of multi-sensor in situ observational data. This study also presents final, quality-controlled monthly weather records and accumulation rates for the TEIS region, derived from the AMIGOS-3 observations. A summary of the data sets available from the sensor suite from January 2020 to early 2022 is illustrated in Figure S4.
4.1. Weather data summary
The two AMIGOS-3 stations reported hourly weather, including temperature, wind speed, wind direction, humidity and pressure. Temperature and pressure data are summarized in Table 1 (full data are available at the United States Antarctic Program Data Center (USAP-DC, https://doi.org/10.15784/601549). Figure 6 illustrates the temperature and pressure data for 22 months at the Channel AMIGOS-3 site, and wind data for both stations. Reporting success through Iridium single-burst-data files is ∼85% (7479 reports out of 8760 h in a year). Data gaps in temperature and pressure data were mainly associated with low station power and failed Iridium SBD uplinks. Wind data were affected by rime and heavy snow on the sensor, particularly in three multi-day periods, May 2020, July–August 2020 and July 2021. Wind speeds >80 m s−1 were deleted as invalid, as extreme and abrupt (i.e. suspect) wind speed changes sometimes preceded long periods of rime obstruction of the sensor (∼9% of the reported data; sensor limit is 99.9 m s−1). Camera images of the Vaisala sensor in May and July 2020 showed semi-persistent rime accreted on the lower upwind side of the Vaisala but not at the level of obstructing ventilation. A gap in wind direction measurements between bearing 355 and 0 is inherent to the Vaisala sensor.
(a) Air pressure (red) and air temperature (blue) hourly record for Channel AMIGOS-3c site (75°03.12ʹ S, 105°26.65ʹ W) for 16 January 2020–to 22 October 2021, with extremes in conditions labelled. (b) and (c) Wind rose diagrams for Cavity AMIGOS-3a site (75°02.57ʹ S, 105° 35.03ʹ W; 16 January 2020–07 October 2021) and Channel AMIGOS-3c.
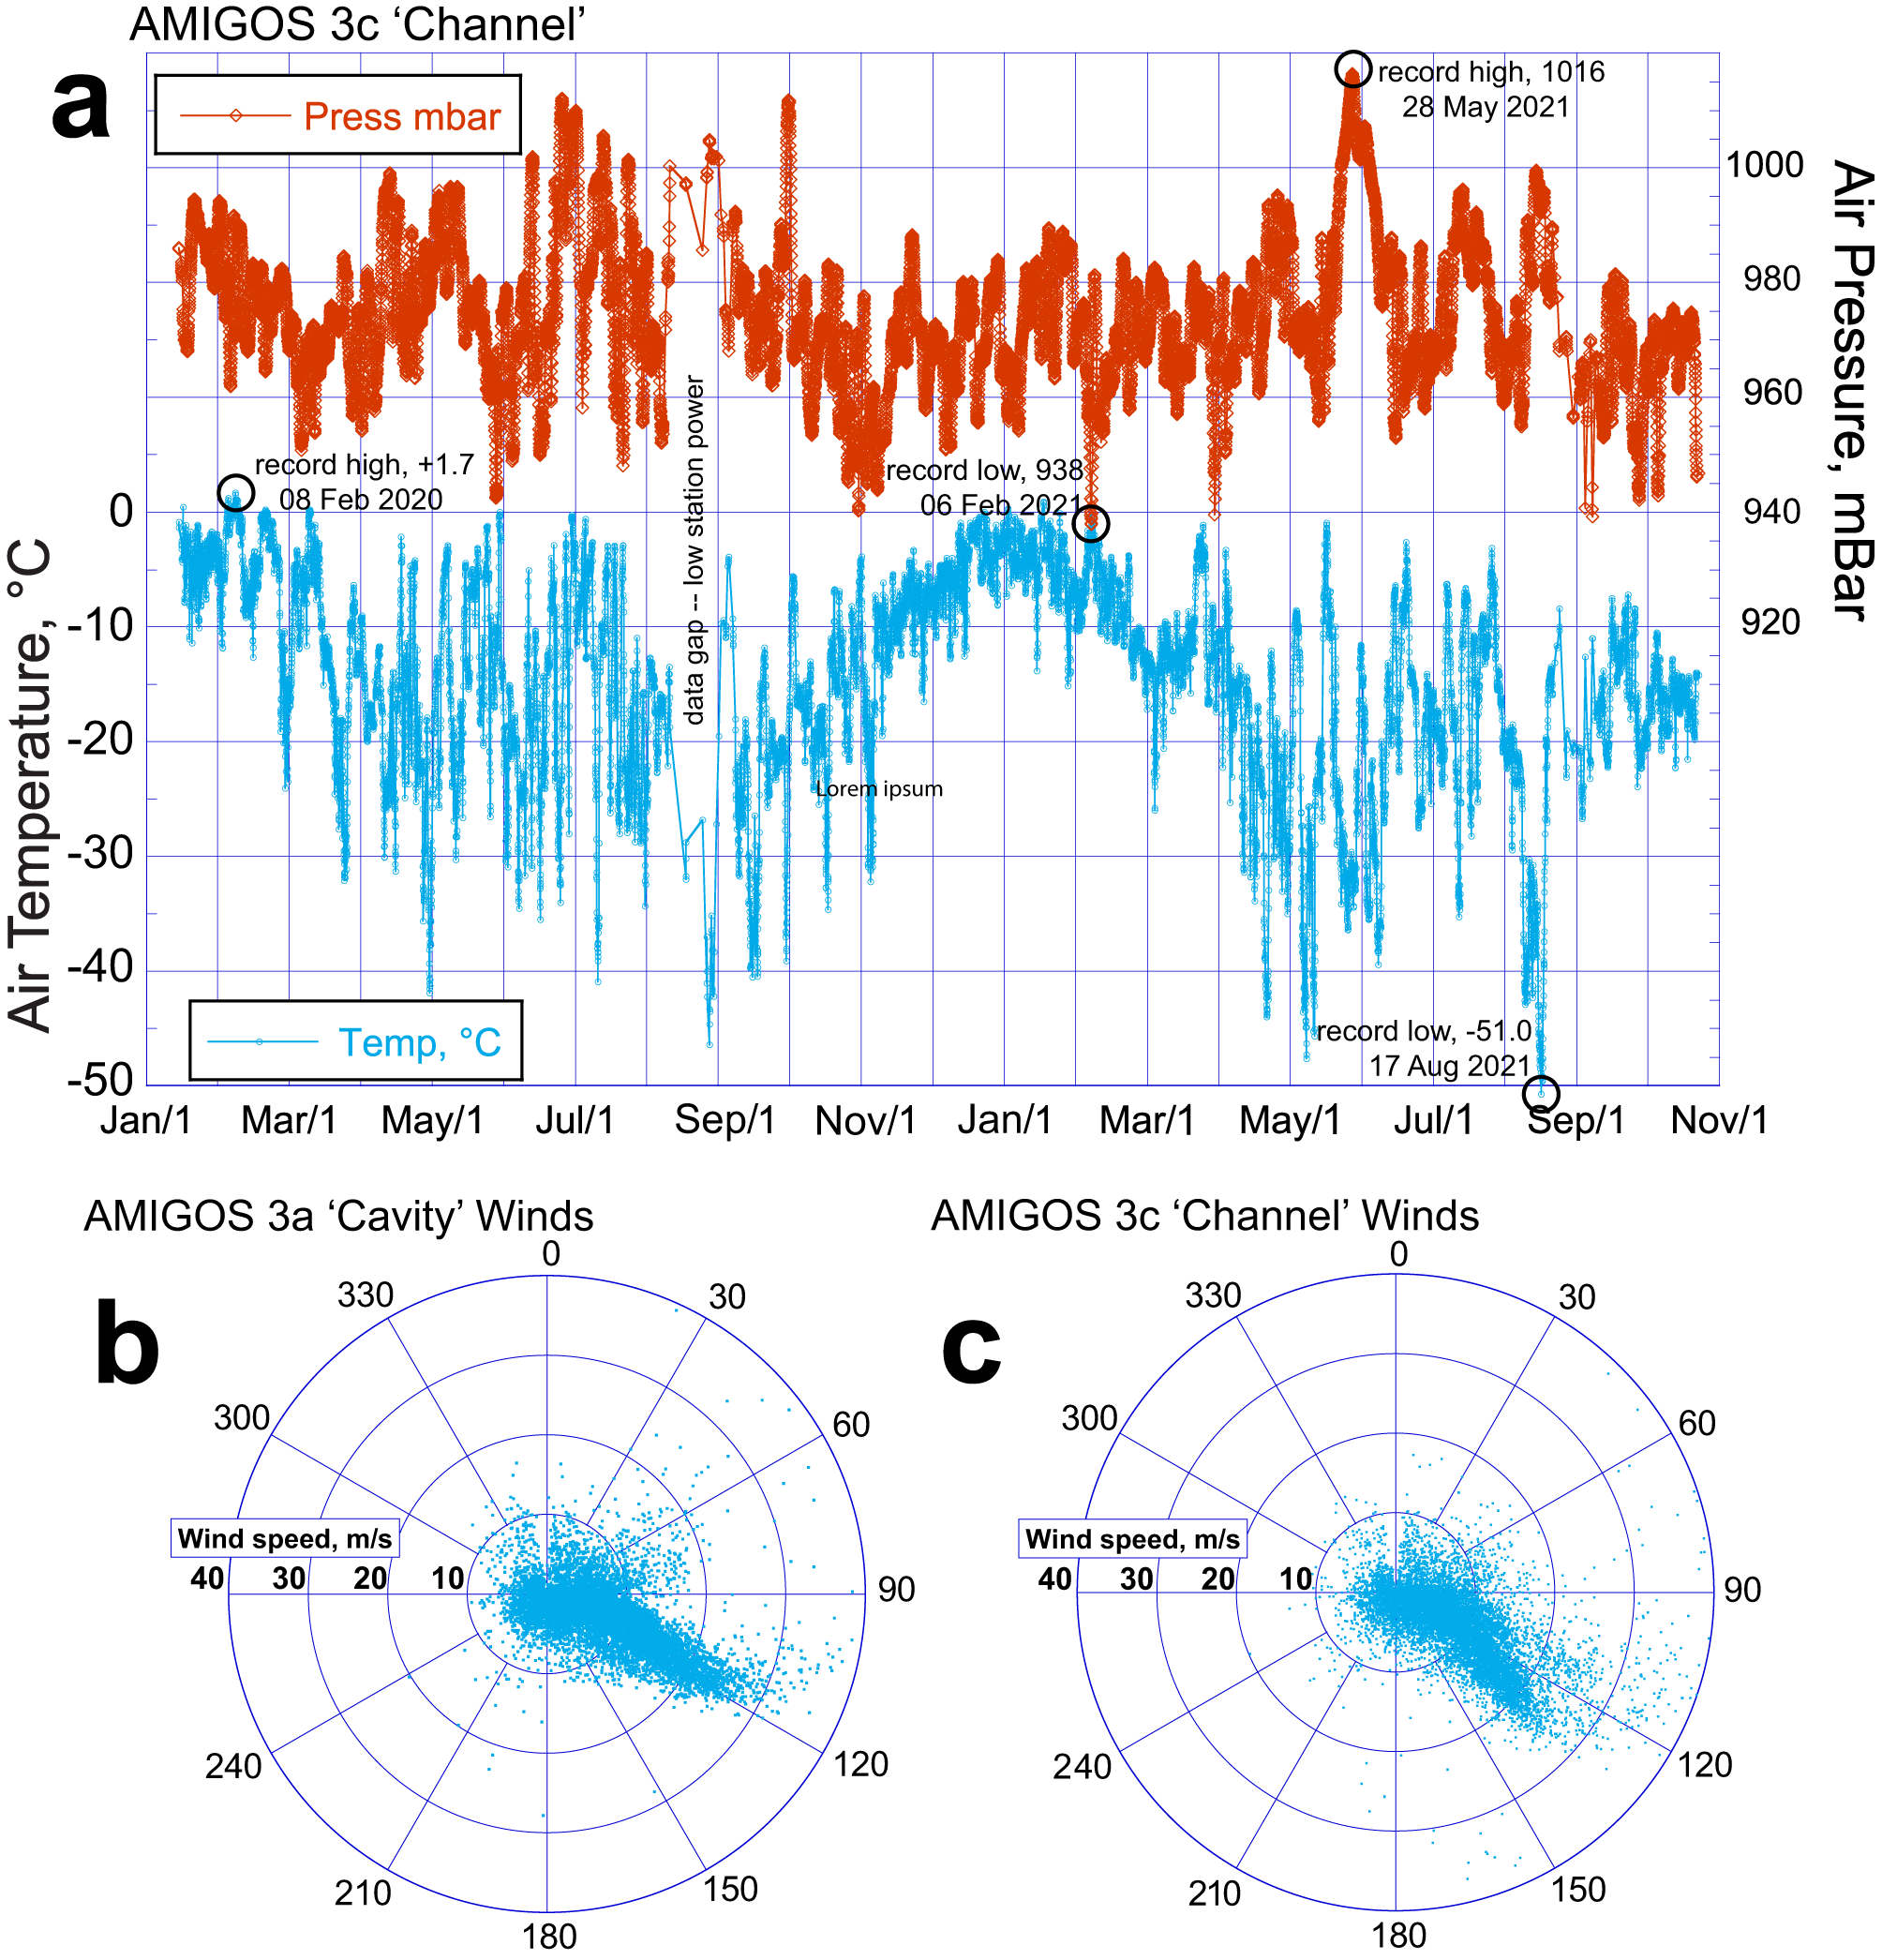
Air temperatures at the sites ranged from +1.7°C (08 February 2020) to −51.0°C (17 August 2021). The mean annual air temperature from the Vaisala sensor at the AMIGOS-3c Channel site is −14.64 ± 0.05°C (February 2020–October 2021). The AMIGOS-3a Cavity station does not have an annual mean temperature reported because neither of the August months had sufficient data. In total, 12 184 measurements were made, averaged by month, with monthly measurement counts ranging between 729 and 463; individual air temperature measurements have a precision of ± 0.3°C). This is a compiled annual cycle using 19-months of monthly averages, combining pairs of calendar months where 2 months of good data are available. To be included in this average, a data month had to have >20 days with measurements, and >450 hourly measurements. We assessed the potential for solar heating of the unaspirated Vaisala temperatures and found that the effect on the mean temperature, even in December and January, is negligible due to the infrequency of low wind speeds (Figure S5 and text). Vaisala sensor heights above the snow ranged from 6.5 to 4.5 m (see Section 4.2).
Separate from the Vaisala measurements, the thermistor-derived annual average air temperature (unshielded but wrapped in reflective foil) ranged from −13.78 to −13.98°C at three heights above the snow; these measurements were likely affected by solar heating and rime icing. Average subsurface snow temperature at AMIGOS-3c (at depths of 3.3–5.0 m) is −14.26 ± 0.11°C.
The annual average air pressure was 973.7 mbar (using the 19 month averaging scheme), with individual measurements ranging from 937.6 mbar (at the Cavity site) to 1016.4 mbar (at the Channel site). The individual measurement accuracy of the Vaisala sensor air pressure is ± 0.5 mbar. Pressure data were very similar between the two stations, with monthly means within 1 mbar and monthly high and low pressures within 1.5 mbar for months with >350 hourly measurements (except July 2021).
Mean wind speed as reported by the stations is 9.6 m s−1 at Cavity (9943 valid measurements) and 9.9 m s−1 at Channel (11 531 valid measurements); however, there are two significant gaps in the wind data in late May and much of August 2020 due to snow or rime covering the sensor (this was confirmed by the camera data). Wind speeds are lowest in December and January, with few strong events (>25 m s−1). Wind direction at the two stations was relatively constant from the southeast, at 112° at the Cavity (52% of observations were between 100° and 125°) and 125° at the Channel (52% between 110° and 135°), with wind speeds <30 m s−1 for more than 98% of observations. However, a few extreme wind events were observed, and deemed valid because of commensurate air pressure changes and multiple similar wind speed measurements over several hours, with peak speeds >60 m s−1 at both stations during the winter or early spring periods. The strong directionality of the winds at both stations is consistent with polar easterly and katabatic orientations (e.g. Caton Harrison and others, Reference Caton Harrison2022; Figure 6).
4.2. Snow height and annual accumulation
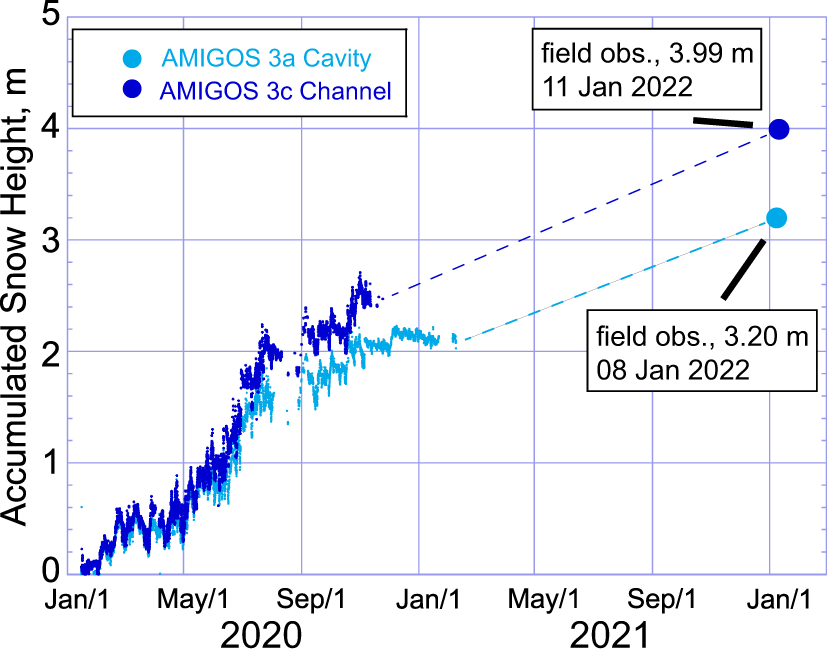
Snow-height data provide a check on model estimates of net accumulation, and information on the seasonality of snowfall (Figure 7). The acoustic snow-height sensors failed on both stations after 10–12 months. The data were corrected for air temperature as measured in the same hour by the weather instrument. (Air temperature changes the speed of sound in the sonic height measurements.) A data quality index is reported for each acoustic height measurement. A field measurement of snow height to the sensors was acquired during a brief revisit to the AMIGOS sites in early 2022, extending the total accumulation record to 2 years. Accumulation at the AMIGOS-3a Cavity site was overall ∼20% lower than at the AMIGOS-3c Channel site, possibly because of the setting of the Channel site a few meters lower than the surrounding ice-shelf surface. Although the extent of hourly data acquisition is short (see Figures 7 and S1), it seems that accumulation is highest in late autumn and winter, and lower in the spring and summer months (consistent with the climatology reported in Maclennan and Lenaerts, Reference Maclennan and Lenaerts2021). The stations recorded accumulation and other weather data during a series of atmospheric-river events in early February 2020, accounting for ∼19–25 cm of snow accumulation (Maclennan and others, Reference Maclennan2023). Assuming an average snow density of 450 kg m−3, the net annual accumulation is ∼0.72–0.90 m w.e. (AMIGOS-3a and -3c, respectively).
Snow height for the two AMIGOS stations for 2020 and 2021.
4.3. Snowfall variations with wind direction
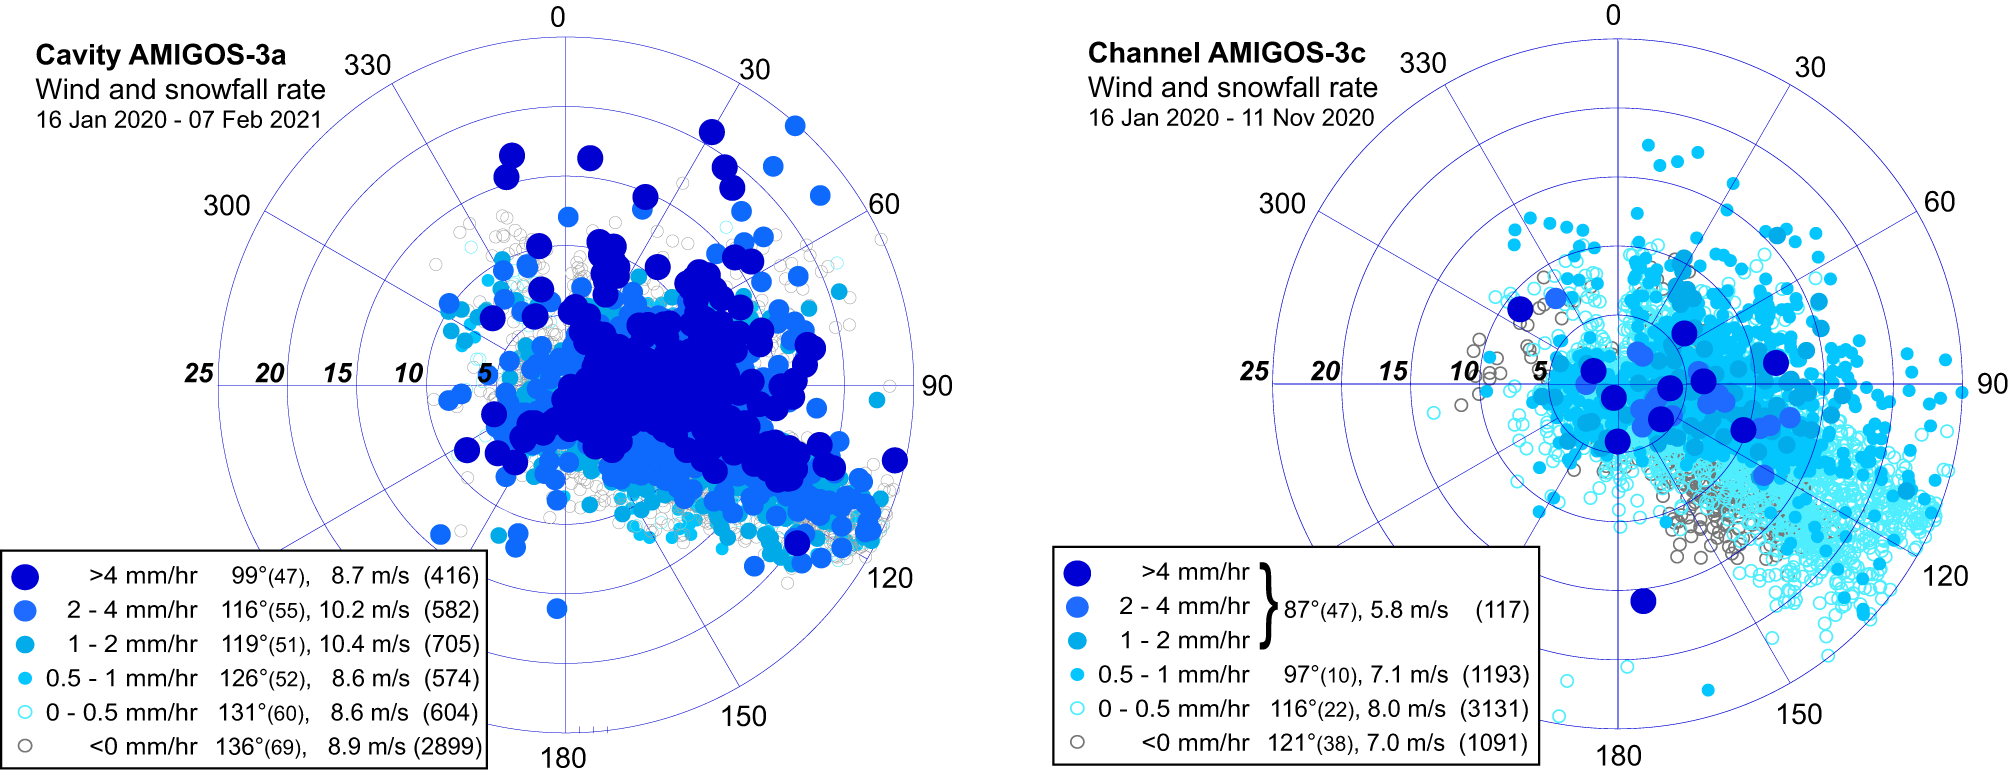
Snowfall rates varied systematically with wind direction (Figure 8). Combining wind speed and direction with smoothed (12-hour running mean) averages of the acoustically determined snow height, a pattern of high snowfall rates with northeasterly winds and low snowfall or ablation conditions with southeasterly winds is seen. Valid observations were available ∼65% of the time. High snowfall rates occur more frequently at the Cavity site than at the Channel site, yet total accumulation at Channel is ∼20% higher due to far more periods of low snow accumulation (56% of observations), suggesting accumulation under blowing snow conditions rather than precipitation. At the Cavity site, deflation and compaction occurred more frequently (50% of observations).
Wind rose with snowfall rate (color and symbol size) for AMIGOS-3a Cavity and -3c Channel. Hourly wind speed (10 min means at top of each hour) for the date ranges shown, with smoothed (12 h running mean) snowfall rate indicated by symbol color and size. Number of observations (Cavity, 5780, Channel 5532) is fewer than the number of hours due to gaps in data transmission or frost on one or both sensors used for each graph. Mean wind vectors for snowfall rate bins are shown in the inset tables, with standard deviation of direction in degrees, mean wind speeds and total number of observations.
4.4. GPS data summary
The GPS receivers on the AMIGOS-3 stations were operated at varying rates, between 1 and 10 d−1 acquisitions of 30 s epoch data for 20 min (40 epochs each acquisition; see Figure S1). The AMIGOS-3a Cavity GPS operated with few gaps from 16 January 2020 to 30 September 2021. Additional data were acquired intermittently in 2022 after a partial repair of the station in January 2022. The AMIGOS-3c Channel GPS also began to transmit data on 16 January 2020, and operated without gaps until it failed on 07 August 2020.
Initial positions of the two stations were 75.0480° S, 105.5858° W for AMIGOS-3a Cavity, and 75.0569° S, 105.4457° W for AMIGOS-3c Channel, separated by 4.1 km. The Cavity GPS antenna has a mean initial elevation of 26.4 m above the WGS84 ellipsoid (55.3 m above the EGM2008 geoid), and the Channel antenna was 21.5 m above WGS84 (50.6 m above the geoid). Initial flow speeds at the two sites were similar, 1.74 ± 0.02 m d−1 (636 ± 8 m a−1) and 1.64 ± 0.03 m d−1 (600 ± 11 m a−1), respectively, averaged over a 20 day period shortly after installation (25 January–14 February 2020). Flow direction was initially 004° at the Cavity site (bearing 258° grid), 003° at Channel (257° grid), very similar to the satellite-derived flow directions in Alley and others (Reference Alley2021) for the mid-shelf area. Flow speed increased at the Cavity site to 1.94 ± 0.025 m d−1 (708 ± 9 m a−1) after 1 year, and was 2.20 ± 0.005 m d−1 (803 ± m a−1) during 01–20 September 2021. An inflection in the acceleration rate appears to begin in early June 2020; acceleration at the Cavity site was 0.36 mm d−2 between January and April 2020, but increased to 0.923 mm d−2 from September 2020 to September 2021. Satellite images suggest that the cause was related to reduced total shear resistance and an increasingly well-defined and fractured shear margin between the shelf ice and the pinning point areas to the north of the AMIGOS sites. (Wild and others (Reference Wild, Alley, Muto, Truffer, Scambos and Pettit2022) discussed the gradual development of this shear zone.) Flow direction at the Cavity site turned slightly eastward (as measured by the moving station) during 2021 and was 015° true in September 2021 (270° grid).
The GPS units appear to record flow-speed variations related to several minor changes in the structure of the TEIS and its connections to the rest of Thwaites Glacier and the pinning point ice rumple at its northern edge (see also Alley and others, Reference Alley2021; Wild and others, Reference Wild, Alley, Muto, Truffer, Scambos and Pettit2022). In the first 4 months of 2020, when both GPS systems were operating, there were two periods when minor oscillations in flow speed occurred at both stations (∼0.1 m d−1; labeled ‘A’ and ‘B’ in Figure 9). While variations in flow speed at other times generally did not correlate (and are likely due to wind effects on the towers, or noise in the data), during these two larger variations, flow speeds between the two stations had a Pearson’s correlation coefficient (r) of >0.9. Examining satellite images of the region during these periods (e.g. see https://thwaitesglacier.org/about/science) suggests they are related to intermittent connection and disconnection between the main ice shelf and rotating blocks along the disaggregating western shear margin adjacent to the central Thwaites outflow. The events were largely variations along flow, with very little change in flow direction.
Ice flow speed for AMIGOS-3a Cavity (blue) and AMIGOS-3c Channel (cyan) determined by dual-frequency GPS data. Speed determinations were smoothed using a 5 day running mean. The periods of correlated speed variations, labeled A and B, are discussed in the text.
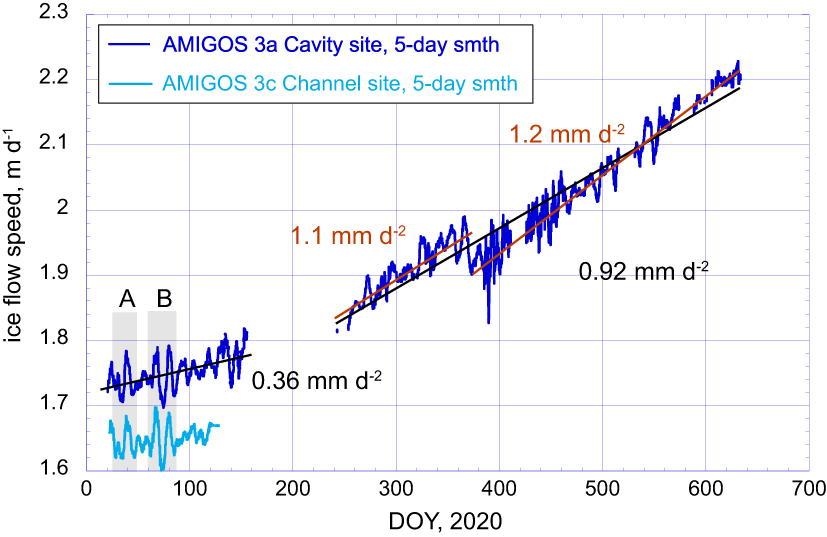
A significant change in the acceleration of the ice shelf occurred sometime during the winter of 2020, within a GPS data gap due to low battery power. Flow acceleration increased from 0.36 mm d−2 for the first 6 months of 2020 to ∼1 mm d−2 thereafter. Satellite images indicate that shearing of the northwestern part of the ice shelf past the grounded ‘pinning point’ ice associated with the ice rumple became more concentrated within a few rifts along the ice-shelf edge at this time. A break in the acceleration of the ice shelf near the AMIGOS stations occurred early in 2021, possibly associated with new cross-flow rift extension and widening downstream of the stations (Wild and others, Reference Wild2024, in press).
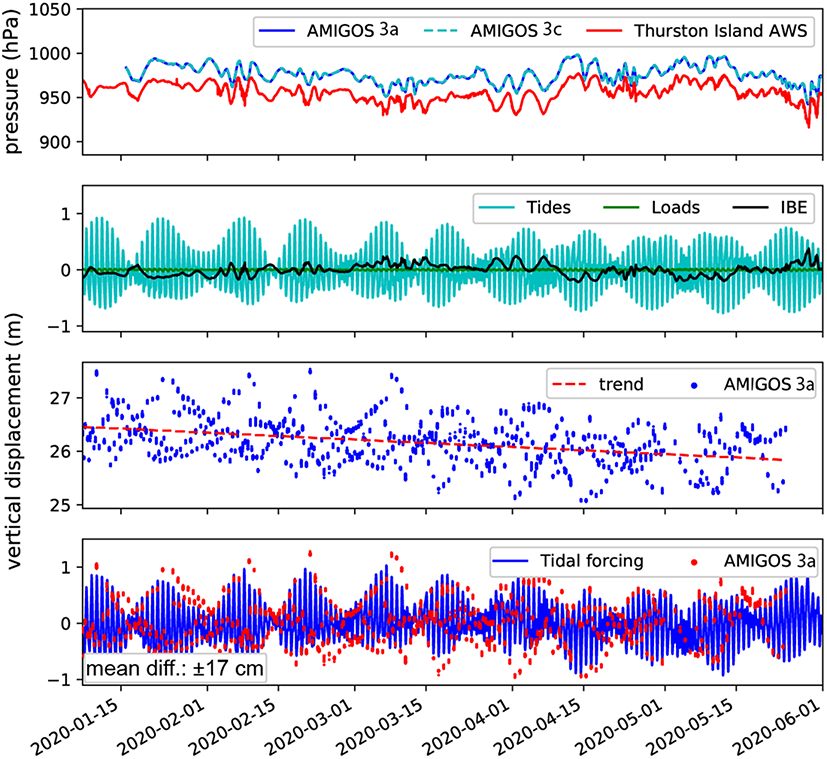
Maximum ocean tidal range, as determined by the sub-daily height variations of the Cavity and Channel GPS, is 1.6 m (Figure 10). An analysis of the correlation between the AMIGOS-3a vertical displacement and the CATS2008 model (Howard and others, Reference Howard, Erofeeva and Padman2019), with corrections for the inverse barometer effect (IBE; Padman and others, Reference Padman, King, Goring, Corr and Coleman2003) based on both AMIGOS stations’ air-pressure variations and those from the Thurston Island AWS, showed a mean difference of ±17 cm (Wild and others, Reference Wild, Alley, Muto, Truffer, Scambos and Pettit2022). Both stations showed a steady decline in elevation over time, at a rate of ∼1 m yr−1, as accumulation buried the stations and weighted the ice shelf, a trend that was removed before comparison with the tide model. Given the cool ocean temperatures at the ice base (see Section 4.6), and the similarity between accumulation-driven weighting and the elevation decline, we infer that basal melting is a small component of this elevation decline.
Air pressure, ocean and load tides, and inverse barometer effect (IBE), GPS elevation trend with time, and comparison of the corrected tide model (CATS2008 with load and IBE added) with the observed GPS vertical positions for the first five months of AMIGOS-3a Cavity GPS operation.
4.5. Ocean data summary
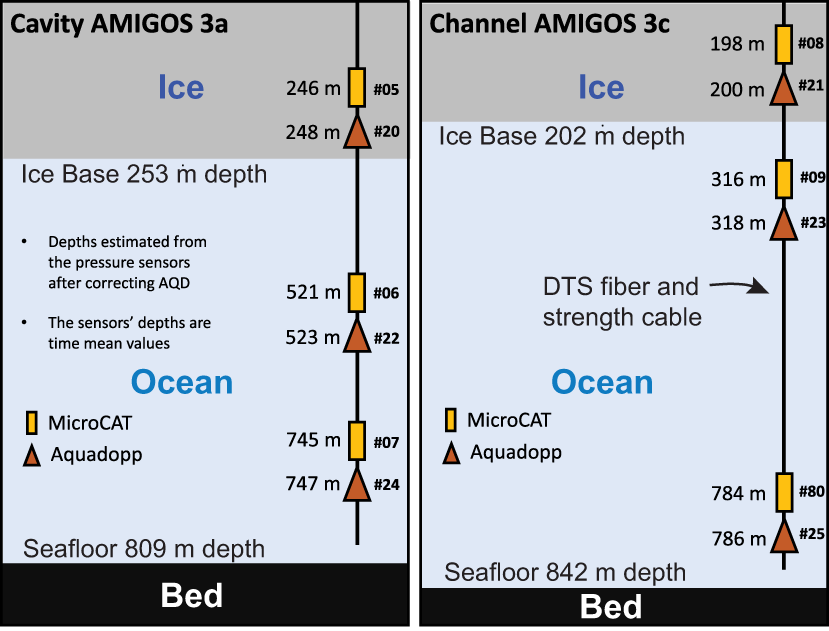
The three pairs of ocean sensors used for the TEIS AMIGOS-3 units were intended to be arranged just below the base of the ice shelf, at a mid-depth location and near the seabed. Unfortunately, differences in the spool meters for the science instrument winch and the drilling winch led to the systems being installed several meters higher than intended. With this, the upper sensor pairs were actually installed 2–7 m above the ice base and within the refreezing borehole. The final depths below sea level of the instrument pairs were determined from the pressure sensors on the CTDs and current meters (Figure 11).
Configuration of ocean string instruments in the two AMIGOS-3 moorings. Ice-base depths were estimated from Distributed Temperature Sensing (DTS) fiber-optic cable data; seafloor depth was determined by an initial CTD profile run that was lowered to the seabed. The depths of the ice base reflect conditions in the first few months after AMIGOS installation. AQD stands for Aquadopp.
The goal of the TEIS AMIGOS-3 stations was to determine the depths of the different ocean water types known to be in the Amundsen region, among them, Winter Water (WW) and modified Circumpolar Deep Water (mCDW; see Wåhlin and others, Reference Wåhlin2021). We also sought to determine meltwater content in the mCDW or mixed water types, and the flow directions at different depths, as part of assessing ice–ocean interaction in this part of Thwaites Glacier (Dotto and others, Reference Dotto2022).
Oceanographic data were acquired every 10 min from the CTDs and every hour from the current meters. The units communicated with the surface station through an inductive modem, and the data uplinked with other data parcels via Iridium. This was subject to gaps due to low station power or failure of the station inductive modem system. However, the units had onboard data storage as well, and for the CTDs a full record (January 2020–January 2023) was later recovered by direct communication over the inductive modem. For the current meters, only the preceding 48 hourly records were stored, so that record is more intermittent (although a few records were obtained from the Cavity current meters in January 2023).
An overview of the CTD data, presented as a conservative temperature-absolute salinity diagram, for both stations for the 140 days following installation is shown in Figure 12, along with data from an autonomous underwater vehicle (a Hugin AUV, Ran; Wåhlin and others, Reference Wåhlin2021) that also sampled the sub-ice-shelf cavity waters on 28 February and 5 March 2019 (a year before the AMIGOS’ installation). The characteristics of mCDW in the TEIS cavity, sampled by the deep CTDs in both AMIGOS-3, form a tight pattern centered near 1.0°C and 34.85 g kg−1. Mid-cavity water, measured at 521 m at the AMIGOS-3 Cavity, shows mixing between the mCDW and WW. The water higher in the water column (bottom left in Figure 12) is aligned parallel to the 27.4 kg m−3 isopycnal (gray thin line). The reference composition for local WW shown in Figure 12 was derived from near-surface seal-tag measurements (Dotto and others, Reference Dotto2022).
Conservative temperature–absolute salinity diagram for the combined CTD data sets from both AMIGOS-3 stations under the TEIS. The meltwater mixing line is derived from Gade (Reference Gade1979) using the mean composition of the mCDW in the upper right. Data from the Hugin AUV deployments during the February 2019 cruise of the RV N.B. Palmer are shown in gray with gray tone scaled to depth of the measurement (Wåhlin and others, Reference Wåhlin2021). The composition of Winter Water shown here is based on seal-tag observations from 2019 (Dotto and others, Reference Dotto2022).
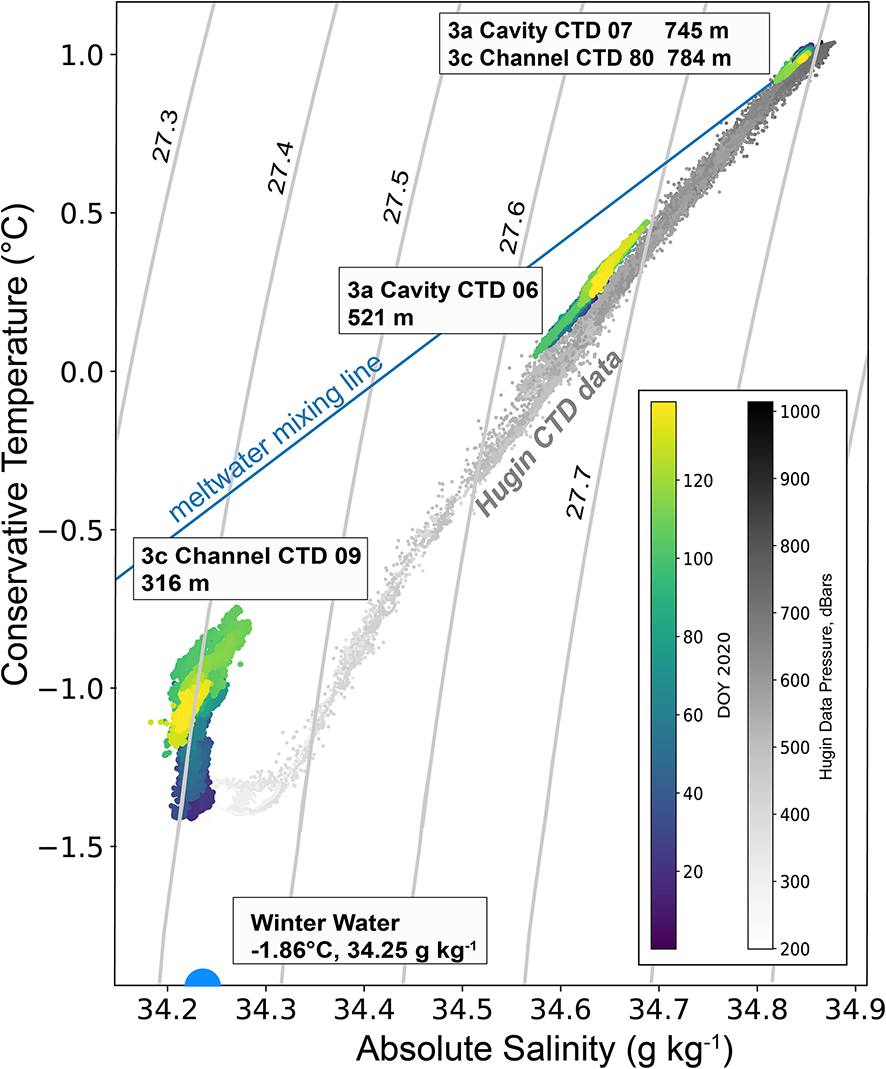
Overall, the oceanographic data set indicates a relatively low meltwater content for this first period of data gathering beneath the TEIS, implying that the sampled waters had not been near sites of melting beneath TEIS, nor had the sub-ice cavity received water that had experienced significant melting from the Pine Island Glacier cavity (e.g. see Dotto and others, Reference Dotto2022; Zheng and others, Reference Zheng, Stevens, Heywood, Webber and Queste2022). Mixing between the mCDW and WW accounts for most of the spread in the mid-depths of the cavity shown by CTD 06 in Figure 12. However, the mixing in the upper levels of the ice-shelf cavity, from CTD 09 (∼100 m beneath the ice-shelf base at Channel mooring), appears to be the result of secondary mixing of the mCDW, WW and varying amounts of fresher water derived from basal melt elsewhere in the region, as seen by its proximity to the meltwater mixing line (Gade, Reference Gade1979). The distribution of the 140 day measurements from CTD 09 along an isopycnal (i.e. constant density) line suggests that at this level, waters have low stability and density compensation between temperature and salinity, which possibly reflects convective processes.
4.6. Distributed temperature sensing
DTS laser interrogator systems (Silixa XT, Silixa LTD., Hertfordshire, UK) were integrated into both AMIGOS-3 sensor systems and connected to two ∼1600 m fiber-optic cables that were installed in the boreholes and connected to the main steel cable for the ocean moorings. Because the depth to the seabed was <850 m, excess fiber cable was coiled just above the AMIGOS-3 battery boxes and buried, initially ∼1 m below the surface. A short stretch of the cable runs ∼50 cm higher between the battery box and the adjacent borehole entry, ∼3 m at the AMIGOS-3a Cavity site, but ∼25 m for the AMIGOS-3c Channel site.
Power requirements for the DTS units were large (up to 20 W for several minutes during start-up). Data collection by the units was managed using Iridium downlinked commands based on power availability. The nominal profile acquisition plan was 6 d−1, when abundant solar power was available, but this was reduced to 1 d−1 or 1 week−1 during late autumn and winter (30 April–01 October). The units provided data for 19 months with some outages (see Figure S1). Calibration of the DTS signals made use of the two CTD sensors in the water column via a simple two-point (slope and offset) calibration method.
Thermal profiles through the ice column in the borehole adjusted significantly over the first 140 days of operation but revealed the basic conditions of the ice and ocean (Figure 13). Throughout the firn and ice section of the borehole (below the near-surface spool of cable), the borehole temperature decreased as the effects of the hot-water drilling diffused. Seasonally varying conditions in the upper firn were observed in the upper borehole but were of limited use because the upper borehole likely retained air pockets after burial by drifted snow. The minimum temperature of the ice shelf was recorded at 141 m below sea level, −19.0 ± 0.1°C at the Cavity, and at 118 m below sea level, −18.4 ± 0.1°C, at the Channel by mid-May (∼140 days since drilling). Below that depth, temperatures increased rapidly to the base of the ice shelf. In the 15 m just above the respective ice bases, the thermal gradient was very steep, 0.405 ± 0.007°C m−1 at the Cavity site, and 0.385 ± 0.008°C m−1 at the Channel site.
DTS temperature profiles for selected days in the first 140 days of 2020 following hot-water drilling of the borehole. Inset, close-up of the ice–ocean boundary.

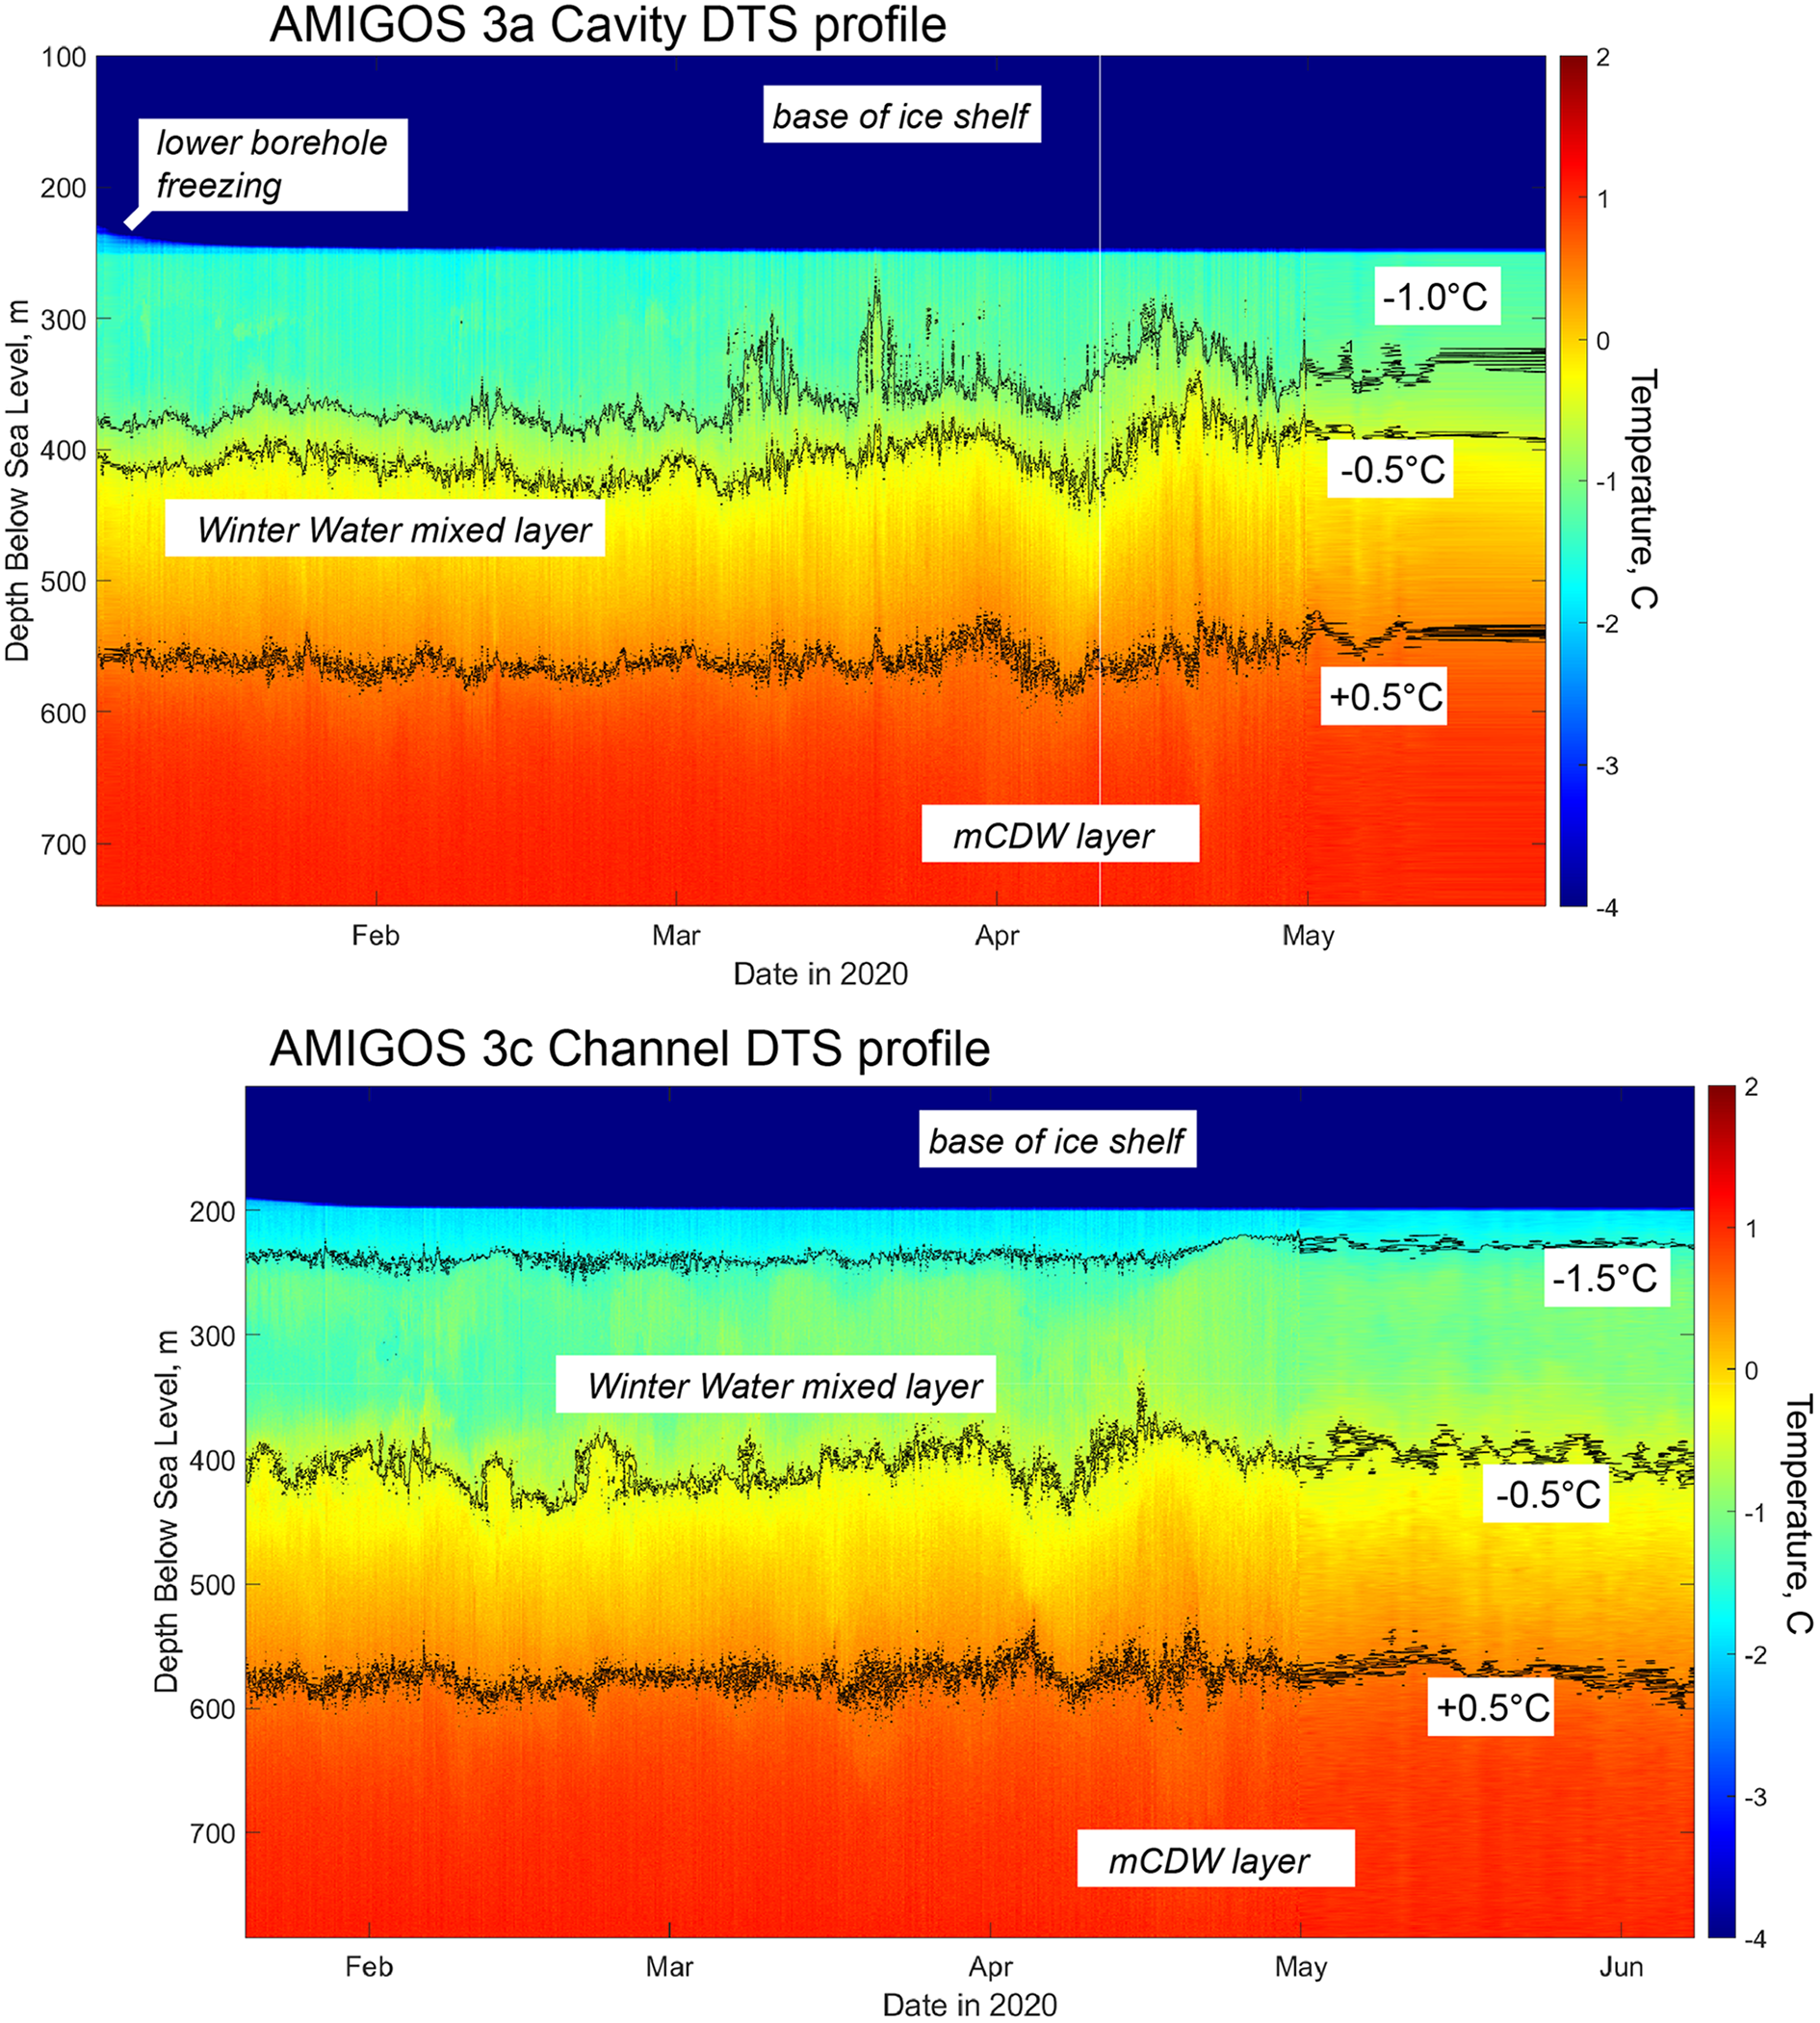
The time series of fiber-optic temperature data in the ice-shelf ocean cavity through the first 140 days (Figure 14) shows the general warming of the water column with depth, and the high melt potential of the deepest 100+ m, where temperatures of +1.1°C are present. Variations in the middle of the water column are likely related to eddies, or possibly to convection as suggested by the constant density of the mid-depth water in the CTD data (Figure 12). In the upper water column, the coolest layers thin significantly during the first few months at both sites, and the uppermost 40 m in the Channel water column is near the pressure melting point, −1.7°C. However, in both columns, there is a thin (2–3 m) layer that is at the pressure melting point adjacent to the ice base. This layer appears to insulate the ice shelf from basal melting, which is observed to be very small in the full DTS time-series (and in fact is hard to discern in the vicinity of the boreholes because of refreezing above the ice base; Dotto and others, Reference Dotto2022) and in phase-sensitive-radar time-series measurements (1–4 m a−1; Wild and others, Reference Wild2024 submitted). At the top of the profiles, the freezing of the lowest section of the borehole progresses through the first several weeks after the hot-water drilling.
Time series of DTS profile data through the ocean column and base of the ice shelf for the first few months of data acquisition. The two graphs are shifted to align the dates. Note that the uppermost ocean layer at the Channel site is cooler than Cavity, with temperatures below −1.5°C. The −1.0°C contour is not shown at the Channel for clarity (it is highly contorted).
4.7. Sub-ice-shelf ocean current data summary
The four functional single-point current meters at the two moorings measured ocean current flow for ∼14 months in total out of the 22 months the stations were active. Gaps in this record (summarized in Figure S4) are due to problems with the inductive modem receivers on the two stations, likely initiated by static build-up on the station during storms. Remarkably, the modems reacquired transmitted data after deep power cycling in late winter as battery power fell below the operating threshold for the stations, and then recovered as solar charging increased in September.
Ocean current data for the four different depths are summarized in Table 2. Ocean flow speeds were generally low and highly variable at all levels measured. Ocean flow directions were also highly variable, but water movement was generally to the southwest at all measured depths. None of the layers showed a consistent correlation with tidal cycles as measured by the GPS units on the stations. Over the entire record, average flow speeds were higher for the shallower two sensors, in the WW and at the thermocline (318 and 523 m, respectively). The variability in flow speed and direction means that the average net drift distances were small: ∼ 37 ± 75 km mn−1 for the 318 m depth in WW layer; 52 ± 106 km mn−1 at the 523 m thermocline layer; and just 16 ± 39 km mn−1 and 5 ± 44 km mn−1 in the mCDW layer at 747 and 786 m depth, respectively.
Ocean drift speeds in 2020 and early 2021 as measured by the Nortek Aquadopp sensors on the two AMIGOS-3 stations on TEISUnits of the entries are shown in the ‘All Obs’ (all observations) column
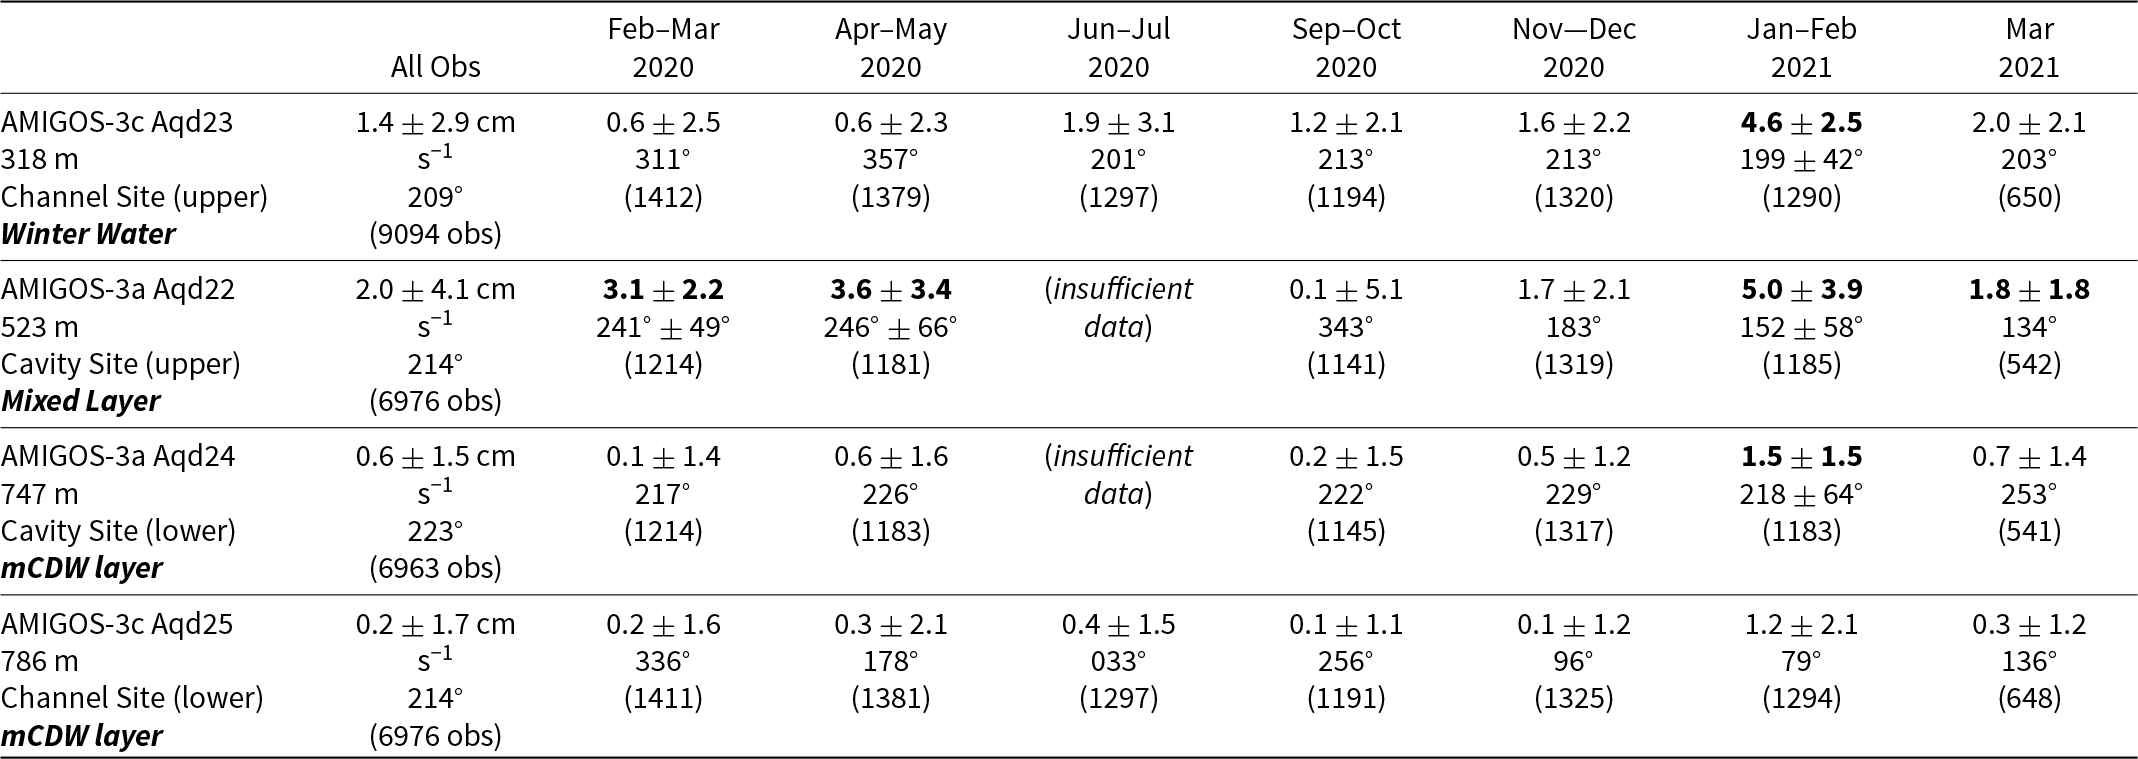
Units of the entries are shown in the ‘All Obs’ (all observations) column. Aquadopp unit numbers and depths are from Figure 11. Bold entries indicate periods when flow speed exceeded 1σ of the flow speed uncertainty. Total observations exceed the sum of the presented periods because some additional data exists for partial months (months with 400 observations)
The bimonthly averages (and a 1 month average for March 2021) of ocean currents were calculated to assess variations in flow speed at a temporal scale that would indicate significant net transport variations. Speeds in the thermocline increased in the late summer and autumn months and were high in the WW layer also in early 2021. For January–February of 2021, ocean drift speeds were the highest of all periods assessed at all layers. We note this was a period of low sea ice cover in the Amundsen Sea Embayment, possibly enhancing wind traction on the ocean surface. Dotto and others (Reference Dotto2022) observed that persistent fast ice in Pine Island Bay led to an accumulation of meltwater-enriched seawater in the upper ocean layer. The buoyancy effects of this accumulation as it moved westward into the TEIS cavity may also be a factor here.
5. Summary
Ice–ocean interaction has emerged as the primary cause of ice-sheet mass-balance changes in Antarctica, and an important component of glacier evolution in all glacier systems that reach the sea. The areas of this interaction are inherently hard to observe, and yet require long-term monitoring to understand the processes and rates, and to identify causal links with atmospheric and ocean climate. Thus, automated multi-sensor moorings, combining surface, ice and sub-ice sensors will become increasingly important, along with AUVs and instrumented animals, as oceanographic and glaciological research pushes toward a better understanding of the rapid ongoing changes beneath coastal ice. In concert with remote sensing methods, they are key to improved process modeling and ice mass-balance forecasts.
The two AMIGOS-3 stations have provided a host of climate, ice and oceanographic data that document the TEIS in situ conditions over all seasons and for multiple years. The systems illuminate a variety of hard-to-observe processes such as ocean layer properties and flow speed (Dotto and others, Reference Dotto2022); basal ice melting (Wild and others, Reference Wild2024, in press); winter climate conditions (this study); annual snowfall and high accumulation events (Maclennan and Lenaerts, Reference Maclennan and Lenaerts2021); and ice flow speed changes, tide height and barometric effects on elevation as the TEIS approaches break-up (this study and Wild and others, Reference Wild, Alley, Muto, Truffer, Scambos and Pettit2022). They extend field observational data to year-round, thereby tracking events or activities that occur only at times when logistical access is very difficult. They can also act as in situ weather and surface roughness monitors for aircraft or ground logistical planning.
Future advancements for the AMIGOS multi-sensor systems could include direct integration with Advanced phase-sensitive Radio Echo Sounder (ApRES) installations, which are able to measure basal melt rates and internal strain within the ice column (Lok and others, Reference Lok, Brennan, Ash and Nicholls2015; Nicholls and others, Reference Nicholls, Corr, Stewart, Lok, Brennan and Vaughan2015). Integrating these with the snow height, GPS, ocean sensor and DTS instruments on the AMIGOS-3 would provide a complete local mass-balance suite of measurements. Passive seismic monitoring or acoustic monitoring of the sub-ice water cavity would support studies of basal melting, rifting and calving (e.g. Bartholomaus and others, Reference Bartholomaus, Larsen, West, O’Neel, Pettit and Truffer2015; Pettit and others, Reference Pettit, Lee, Brann, Nystuen, Wilson and O’Neel2015). Adding an array of GPS receivers that communicate back to a central AMIGOS using a radio system, or directly back to an internet node, would support ice deformation studies of the region surrounding the station.
The addition of the DTS systems in the AMIGOS-3 has led to a significant improvement in the ability to track temperature and thickness variations of sub-ice ocean cavity water types, as well as the basal freeze-on or melting rates at the ice–ocean interface. This addition, with its attendant need for power management due to the high power requirements, was made possible by the two-way communication afforded by the Iridium data link. However, integrating the DTS, and the potential additions of ApRES and acoustic or video monitors, points to the need for much greater data rates for uplinking. Incorporating either Iridium NEXT or Starlink into a future AMIGOS system would greatly enhance this control and station monitoring capability, and would support much greater data transfer rates.
A persistent issue with all automated data station installations on the ice sheets or ice shelves (at least those in accumulating regions) is burial by snow. Revisiting remote automated stations is logistically difficult, and the increasing number of these stations makes timely revisits hard to achieve. An engineering design that incorporates automated periodic raising of the station should be a goal for future polar or glacier surface instrument stations.
Supplementary material
The supplementary material for this article can be found at https://doi.org/10.1017/jog.2024.96.
Data availability statement
The AMIGOS-3 data are available from the United States Antarctic Program Data Center (USAP-DC), at https://www.usap-dc.org/view/project/p0010162. Hugin data are available from the Swedish National Data service: https://snd.gu.se/en/catalogue/dataset/2020-193-1/1. A summary of the various sensor acquisitions is given in Figure S4.
Acknowledgements
The authors would like to thank the many field support and logistics people at Antarctic Support Contractors, and our colleagues in the International Thwaites Glacier Collaboration (ITGC) Thwaites-Amundsen Regional Survey and Network (TARSAN) project in December–January 2019–2020, 2021–2022, and 2022–2023. We also thank the KOPRI logistics and field team (D. Pomraning, J-S Kim) for the Nansen Ice Shelf AMIGOS-3 prototype installation in January-February of 2017. Additional support was provided by the Centers for Transformative Environmental Monitoring Programs under NSF EAR-1832109.
Author contributions
TAS and RR conceived of the AMIGOS design and sensor array; TW assembled and tested the AMIGOS-3 units; BW wrote the final operating code; SA, SE, RF, CM, JS, ET, and RW provided the initial sensor integration with the operating system; MT, EP, KA, and AM assisted in the field installation and data set descriptions; TD and AW contributed to the oceanographic discussion; TAS led the writing; and all co-authors provided comments and edits.
Funding statement
This work is part of the Thwaites-Amundsen Regional Survey and Network (TARSAN) project within the NSF-OPP—NERC International Thwaites Glacier Collaboration program (www.thwaitesglacier.org). Funding for aspects of the AMIGOS-2 and -3 development came from an NSF EAGER Grant OPP-1441432, and from the TARSAN award, OPP-1738992. The student sensor integration team was funded under the University of Colorado Boulder Space Grant program. ITGC contribution number 093.
Competing interests
The authors declare no competing interests.
Appendix: Hardware and Software Acronyms
- ADC
analog to digital converter
- ARM
advanced RISC machines
- CAN
controller area network
- CPU
central processing unit
- EMAC
Embedded Microprocessor Manufacturing, a company
- FTP
file transfer protocol
- GPIO
general-purpose input/output
- I2C
inter-integrated circuit
- I/O
input/output
- LIN
local interconnected network
- OS
operating system
- PCB
printed circuit board
- PRT
platinum resistance thermometer
- RAM
random access memory
- RISC
reduced instruction set computer
- RS-232
recommended standard 232 port
- SBD
single-burst data
- SD/MMC
secure digital/multi-media card
- SFTP
secure file transfer protocol
- SLC
single-level cell
- SODIMM
small outline dual in-line memory module
- SSH
secure shell
- SPI
serial peripheral interface
- USB
universal serial bus


 Open access

