




Introduction
The gut microbiota of the cat, a vital metabolic and immune organ whose core characteristics are consistent with those of most mammals, consists of a phylogenetically diverse and complex consortium that includes bacteria, archaea, fungi, protozoa, and viruses (Liu et al. Reference Liu, Cai and You2025; Suchodolski Reference Suchodolski2022). Among these, bacteria are the largest component of gut microbiota in terms of biomass (Barry et al. Reference Barry, Middelbos and Boler2012). The normal gut microbiota plays an important role in host energy homeostasis, metabolism, maintenance of the intestinal mucosal barrier, immunologic activity, and neurobehavioral development (Barko et al. Reference Barko, McMichael and Swanson2018). Intestinal dysbiosis refers to any changes in the gut microbiota, including the microbial composition of the community, reduction in species diversity, and the relative proportion of specific microbes, which adversely affect the health of the host organism (Ma et al. Reference Ma, Lyu and Song2023; Weiss and Hennet Reference Weiss and Hennet2017). A common shift involves a decline in obligate anaerobes alongside a proliferation of facultative anaerobes, such as Escherichia coli, Salmonella, Shigella, and Klebsiella species (Gomez et al. Reference Gomez, Li and Goetz2022), whereas the specific manifestation of this dysbiosis is highly individualized and pathology-dependent (Walker and Lawley Reference Walker and Lawley2013).
Domestic cats (Felis catus) have undergone significant changes in morphology, genetic characteristics, and behavior during long-term evolution, adapting to domesticated environments and becoming important companion animals for humans (Lesch et al. Reference Lesch, Kitchener and Hantke2022; Mikkola et al. Reference Mikkola, Salonen and Hakanen2021). The expanding population of companion cats has consequently led to a growing focus on feline health and welfare. Gastrointestinal disorders, such as diarrhea and constipation, are among the most common reasons for veterinary visits, posing significant challenges to pet well-being and incurring substantial economic costs. By 2020, the number of cats in European households is projected to reach 1.1 billion, with 95.6 million in the USA and 48.6 million in China, and the cat population has been steadily increasing in recent years (Guo et al. Reference Guo, Zhang and Zhang2022). However, our previous investigations in veterinary hospitals and visits to cat owners have shown that the rate of diarrhea in nulla luctus felis (NLF) is significantly lower than that of breed cats, and that there is a link between gut microbiota and diarrhea and constipation (Iancu et al. Reference Iancu, Profir and Rosu2023). While the link between gut microbiota and feline digestive health is established, the underlying mechanisms contributing to the apparent resilience in certain cat populations (e.g., NLF) remain poorly understood. Furthermore, although host genetics is recognized as a key factor shaping the gut microbiome, comparative analyses of the microbial communities across distinct cat breeds are still limited. More importantly, there is a conspicuous gap in functionally screening autochthonous microorganisms from healthy cats for their potential probiotic properties against pet-associated pathogens.
It is well known that gut microbiota is affected by a variety of influences, such as host genetics, age, environment, diet and lifestyle, and drug use (Adak and Khan Reference Adak and Khan2019; Fishbein et al. Reference Fishbein, Mahmud and Dantas2023). In addition, antibiotic resistance is one of the most significant global challenges, leading to at least one million and twenty thousand deaths annually (Salam et al. Reference Salam, Al-Amin and Salam2023). The escalating global crisis of antimicrobial resistance (AMR) underscores the urgent need for effective alternatives to antibiotics in veterinary practice (Nazir et al. Reference Nazir, Nazir and Zuhair2025). Domestic cats may pose an opportunistic risk to human health as potential hosts of zoonotic pathogens and antibiotic-resistant bacterial strains, highlighting the importance of developing microbiome-based interventions (Xie et al. Reference Xie, Zhang and Tang2025). Therefore, identifying native probiotic strains that can restore gut homeostasis and directly inhibit pathogens presents a promising strategy. Some of these bacteria, such as Lactobacillus spp. and Bifidobacterium spp., also have a great potential for application (Dempsey and Corr Reference Dempsey and Corr2022).
Thus, this study aimed to analyze the diversity and abundance of the gut microbiota of NLF and British shorthair (BS) using 16S rRNA gene sequencing, compare their microbial communities at different classification levels, and screen for potential probiotic candidates capable of inhibiting common pet-associated pathogens. This work has enhanced our scientific understanding of the specific microbial community and has laid a solid foundation for the development of new probiotic preparations as alternatives to antibiotics and for promoting the health of pet organisms.
Materials and methods
Experimental design
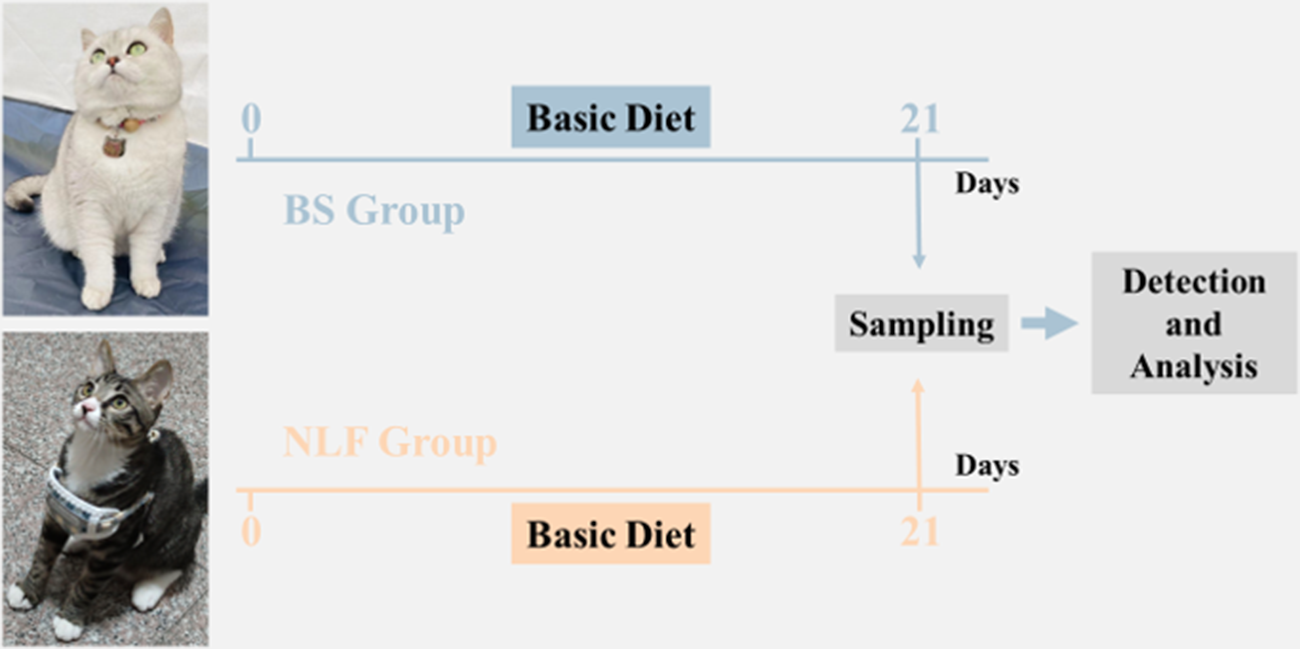
A total of 12 healthy 1–2 years old cats of similar weight were recruited and divided into two groups according to the experimental design and breed: the BS group and the NLF group. All cats were observed 1 week before the experiment to detect and prevent any phenomenon that did not conform to the conduct of the experiment. Two groups of cats were fed the same AAFCO (2017)-compliant diet (composition detailed in Table S1), provided by Hangzhou Wangmiao Biological Technology Co., LTD, ad libitum for 3 weeks. Standardized husbandry protocols included twice-daily waste removal, weekly litter replacement, and daily cleaning and disinfection of enclosures (Fig. 1).
Schematic diagram of experimental design.

Fecal sample collection
At the end of the experiment, fresh fecal samples from each cat after defecation were collected from the litter box as soon as possible into two 50 mL sterile fecal collection tubes (one containing 25% glycerol and one without). The centrifuge tubes containing no glycerin were frozen with liquid nitrogen after collection and then transferred to −80°C for further analysis. A centrifuge tube containing glycerin was placed on ice after the feces were collected for subsequent experiments.
Blood sample collection
After fasting overnight, blood samples were collected from each cat through a forelimb vein and then centrifuged at room temperature at 3500 rpm for 10 min. Following centrifugation, the supernatant was aliquoted into microcentrifuge tubes and stored at −80°C pending subsequent analysis.
Biochemical index detection
T4 and FT4 were detected by an automatic chemical immunoanalyzer, other biochemical indexes were detected by an automatic biochemical detector, and the detection reagent was used with related instruments supporting reagents (IDEXX Laboratories, Westbrook, ME, USA).
Microbiological analysis
Microbiological analysis followed a previously described protocol with modifications (Wang et al. Reference Wang, Zou and Xu2022). Briefly, microbial genomic DNA was extracted from feline fecal samples under sterile conditions using the TIANamp Stool DNA Kit (Tiangen, Beijing, China), adhering to the manufacturer’s guidelines. The concentration of the extracted DNA was quantified with a Qubit 4.0 Fluorometer and the Qubit dsDNA HS Assay Kit. The V3–V4 region of the 16S rRNA gene was amplified with the 341F/805R primer pair and sequenced on an Illumina MiSeq platform (Illumina Inc., San Diego, CA, USA). Using USEARCH (v10.0), sequences were clustered into operational taxonomic units (OTUs) at a 97% similarity threshold, and low-abundance OTUs (<0.005%) were filtered out. To assess microbial diversity, alpha indices (Feature, ACE, Chao1, Simpson, Shannon, PD_whole_tree) were calculated. Beta diversity was evaluated through principal coordinate analysis (PCoA) and non-metric multidimensional scaling (NMDS) based on the Binary_jaccard metric. Differential abundance across taxonomic levels was identified using Linear Discriminant Analysis Effect Size (LEfSe) and confirmed by one-way ANOVA. Finally, phylogenetic investigation of communities by reconstruction of unobserved states (PICRUSt2) was employed to predict functional potential by aligning 16S rRNA data against the KEGG database.
Bacterial strains
Experimental strains in this study were isolated from fecal samples of NLF by plating serial dilutions onto de Man–Rogosa–Sharpe (MRS) agar (Hopebio, Qingdao, China) and incubating anaerobically at 37°C for 24–48 hours. Individual colonies with different morphologies were purified through successive streaking on fresh MRS agar. Presumptive lactic acid bacteria isolates were selected, cultivated in MRS broth to the stationary phase, and then mixed with a cryoprotectant solution of MRS medium containing 25% glycerol for long-term storage at −80°C. Pet-associated E. coli, Salmonella Dublin and Salmonella typhimurium isolated from cats were presented by Prof. Yue Min and Dr Teng Lin of Zhejiang University.
Antimicrobial activity
The bacterial culture of the isolated strain was harvested during the logarithmic growth phase, centrifuged at 5000 rpm for 5 minutes, and the supernatant was collected. This supernatant was subsequently filtered through a sterile 0.22 μm membrane to obtain a cell-free fermentation broth. Overnight cultures of E. coli, S. Dublin, and S. typhimurium were prepared aerobically at 37°C in Luria–Bertani (LB) broth (Hopebio, Qingdao, China). Each culture was then mixed at 0.2% (v/v) with molten LB agar cooled to approximately 50°C. After solidification of the agar, Oxford cups were placed on the plates. Then, 100 μL of the following were added to individual cups: sterile MRS medium (negative control), 100 μg/mL gentamicin (positive control), and the cell-free fermentation supernatant. The plates were incubated at 37°C in a biochemical incubator, after which the antibacterial activity was assessed and documented photographically.
16S rDNA identification
Following overnight culture in MRS broth, bacterial isolates were pelleted by centrifugation. The supernatant was discarded, and the pellet was washed three times with sterile PBS. The final pellet was subsequently used for sequencing. The obtained sequences were compared to those of standard strains available in the GenBank database, and a phylogenetic tree was constructed using MEGA software (version 11.0).
Statistical analysis
All statistical analyses were performed using SPSS software (SPSS Inc., Chicago, IL, USA). Differences between groups were evaluated using Student’s t-test, and results are presented as means ± standard deviation (SD). P < 0.05 was considered statistically significant. All figures were generated using GraphPad Prism version 8.0 (GraphPad Software, Inc., San Diego, CA, USA).
Results
Liver function-related indexes
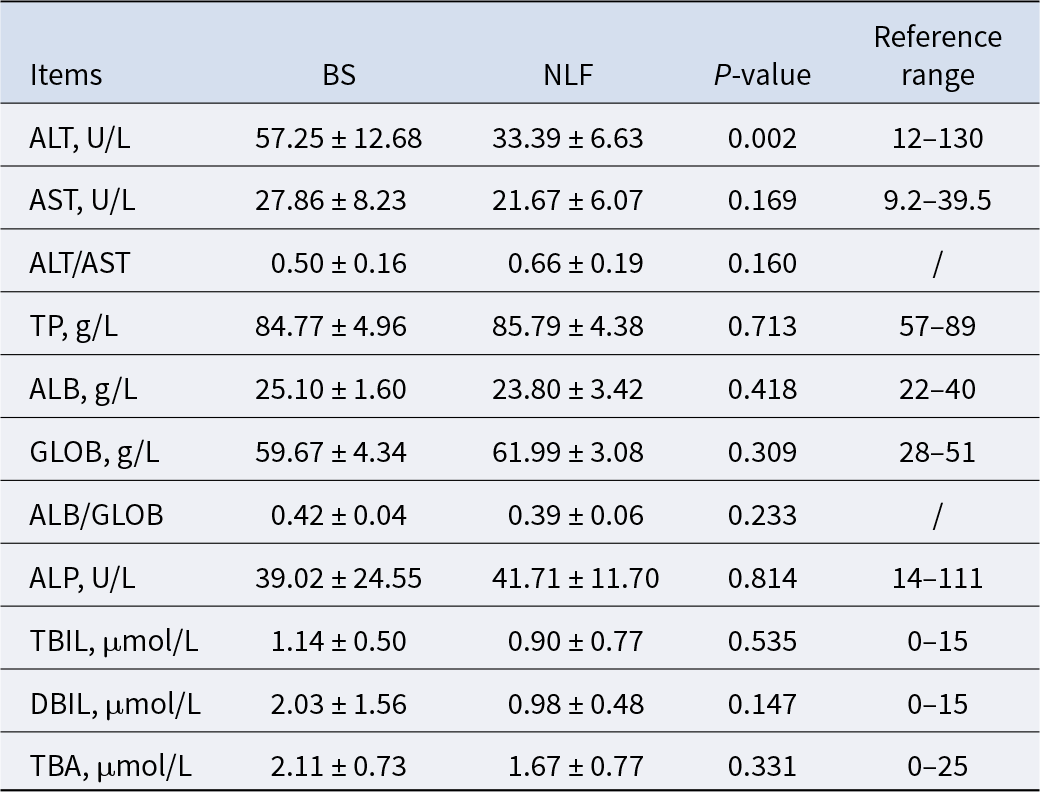
The results of liver function-related indexes of cats in the two groups are shown in Table 1. There were significant differences in ALT between the two groups (P < 0.01), 57.25 ± 12.68 and 33.39 ± 6.63, respectively, but values in both groups were within the reference range. In addition, there were no significant differences in other indexes between the BS group and the NLF group (P > 0.05).
Results of liver function-related indexes of BS and NLF

Note: BS, British shorthair; NLF, nulla luctus felis; ALT, alanine aminotransferase; AST, aspartate aminotransferase; TP, total protein; ALB, albumin; GLOB, globulin; ALP, alkaline phosphatase; TBIL, total bilirubin; DBIL, direct bilirubin; TBA, total bile acid. P < 0.05 was considered to indicate a statistically significant difference.
Blood glucose- and blood lipid-related indexes
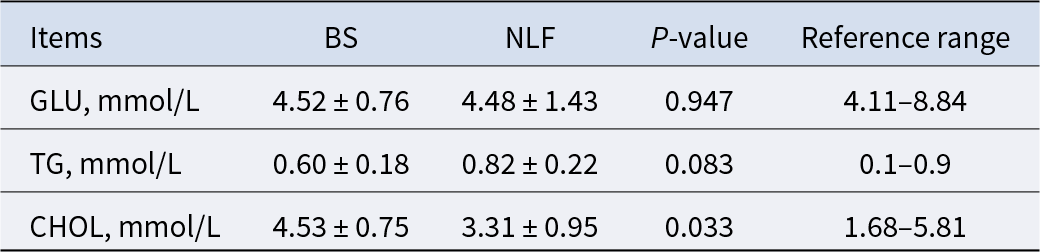
As shown in Table 2, GLU and TG showed no significant differences between the BS group and the NLF group (P > 0.05), while CHOL in the BS group is higher than that in the NLF group (P < 0.05), but they were all within the reference range.
Results of blood glucose- and blood lipid-related indexes of BS and NLF

Note: BS, British shorthair; NLF, nulla luctus felis; GLU, glucose; GSP, glucosylated serum protein; TG, triacylglycerol; CHOL, cholesterol. P < 0.05 was considered to indicate a statistically significant difference.
Angiocarpy function-related indexes
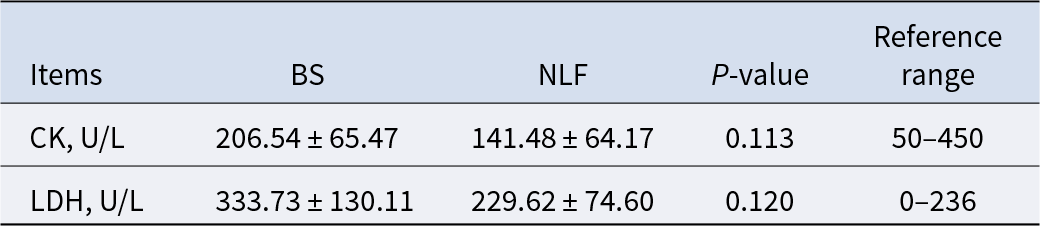
CK and LDH can be used to assess tissue damage to the heart, skeletal muscle, liver, or brain tissue in cats. In this experiment, it was found that the CK and LDH values of the two groups were within the reference range and there was no significant difference between them (Table 3, P > 0.05).
Results of angiocarpy function-related indexes of BS and NLF

Note: BS, British shorthair; NLF, nulla luctus felis; CK, creatine kinase; LDH, lactic dehydrogenase. P < 0.05 was considered to indicate a statistically significant difference.
Renal function-related indexes
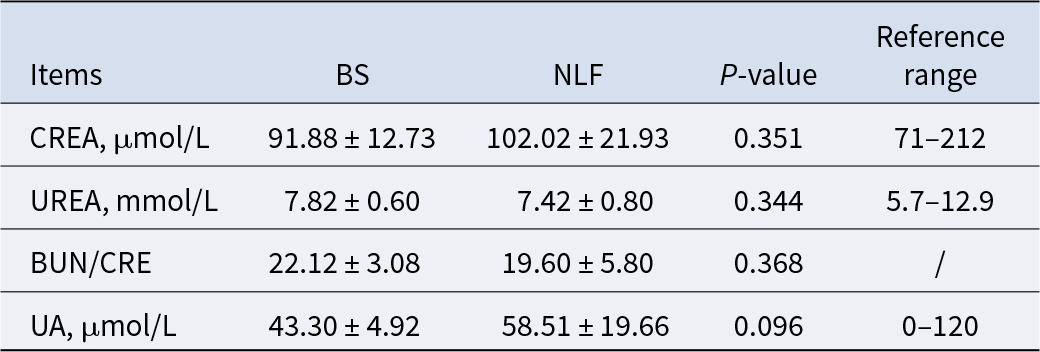
Creatinine is a metabolite of muscle, urea is produced by the liver, and uric acid is a product of purine metabolism, which is excreted by the kidneys. Cortisol is the most abundant steroid in circulation and the main glucocorticoid secreted by the adrenal cortex. The above indexes can be used to assess kidney health, and our results found no significant differences in kidney-related indexes between the two groups (Table 4, P > 0.05).
Results of renal function-related indexes of BS and NLF

Note: BS, British shorthair; NLF, nulla luctus felis; CREA, creatinine; UREA, urea; BUN, blood urea nitrogen; UA, uric acid. P < 0.05 was considered to indicate a statistically significant difference.
Microelement- and electrolyte-related indexes
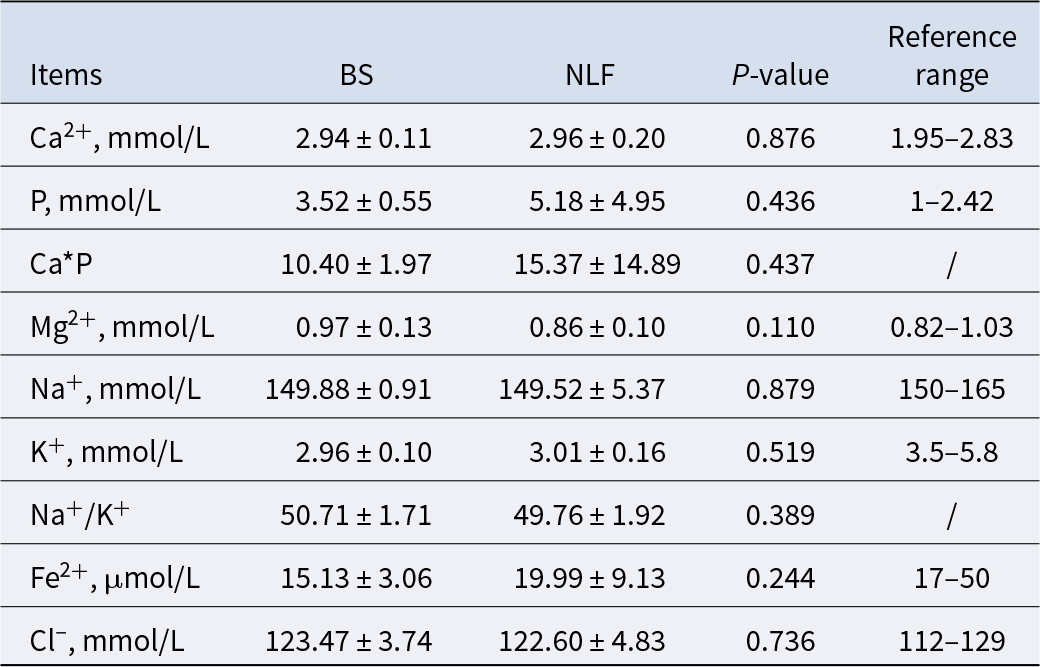
Electrolyte tests are usually used to assess the presence of water and electrolyte balance disorders and trace element content that exceeds or is insufficient, which will have a certain impact on body metabolism. As shown in Table 5, we found no significant difference in all relevant indexes between the two groups (P > 0.05).
Results of microelement- and electrolyte-related indexes of BS and NLF

Note: BS, British shorthair; NLF, nulla luctus felis; Ca*P, calcium–phosphorus product. P < 0.05 was considered to indicate a statistically significant difference.
Thyroid function-related indexes
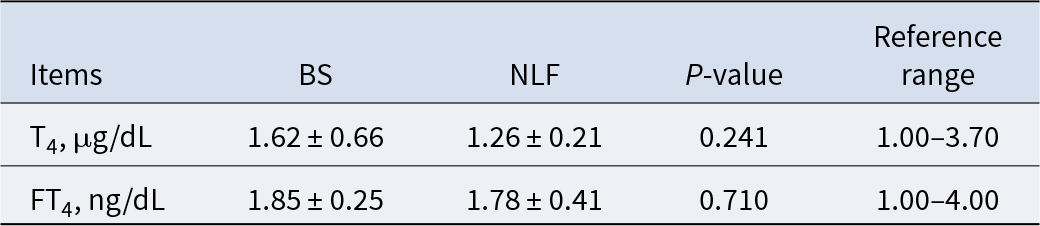
T4 is the main product of thyroid secretion and an integral part of the integrity of the hypothalamic-anterior pituitary–thyroid regulatory system, while FT4 is the physiologically active form of T4, which can reflect the real situation of thyroid metabolism. Our results show that there was no significant difference for T4 and FT4 (Table 6, P > 0.05).
Results of thyroid function-related indexes of BS and NLF

Note: BS, British shorthair; NLF, nulla luctus felis; T4, thyroxine; FT4, free thyroxine. P < 0.05 was considered to indicate a statistically significant difference.
Microbial diversity analysis
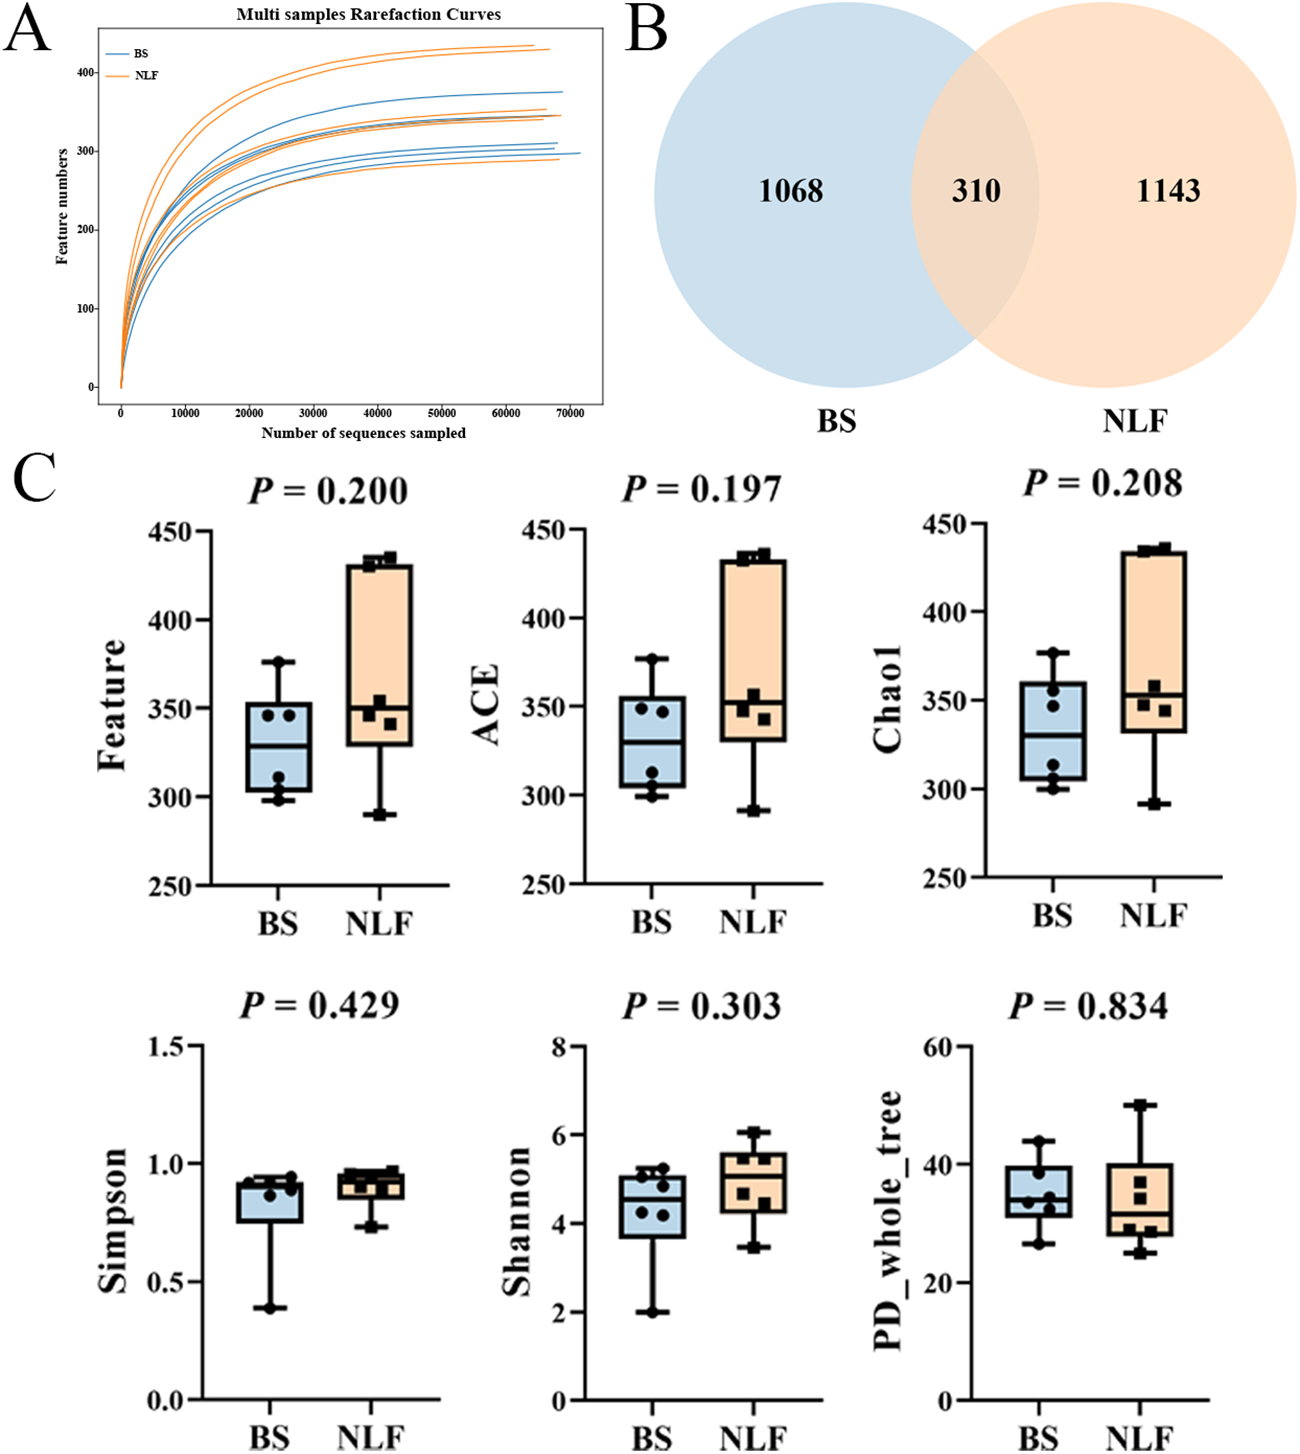
As shown in Fig. 2A, the sparse curve indicated by feature numbers indicates that the current sequence coverage is sufficient for microbial community analysis. The Venn diagram showed that the two groups had 310 common OTUs, in addition to 1068 unique OTUs in the BS group and 1143 unique OTUs in the NLF group (Fig. 2B). There was no significant difference in alpha diversity (Feature, ACE, Chao1, Simpson, Shannon and PD_whole_tree, Fig. 2C, P > 0.05).
Diversity of fecal bacteria between BS and NLF groups. (A) Multi-sample rarefaction curves. (B) The Venn diagram displayed the shared and unique OTUs between the two groups. (C) Alpha diversity (Feature, ACE, Chao1, Simpson, Shannon and PD_whole_tree).

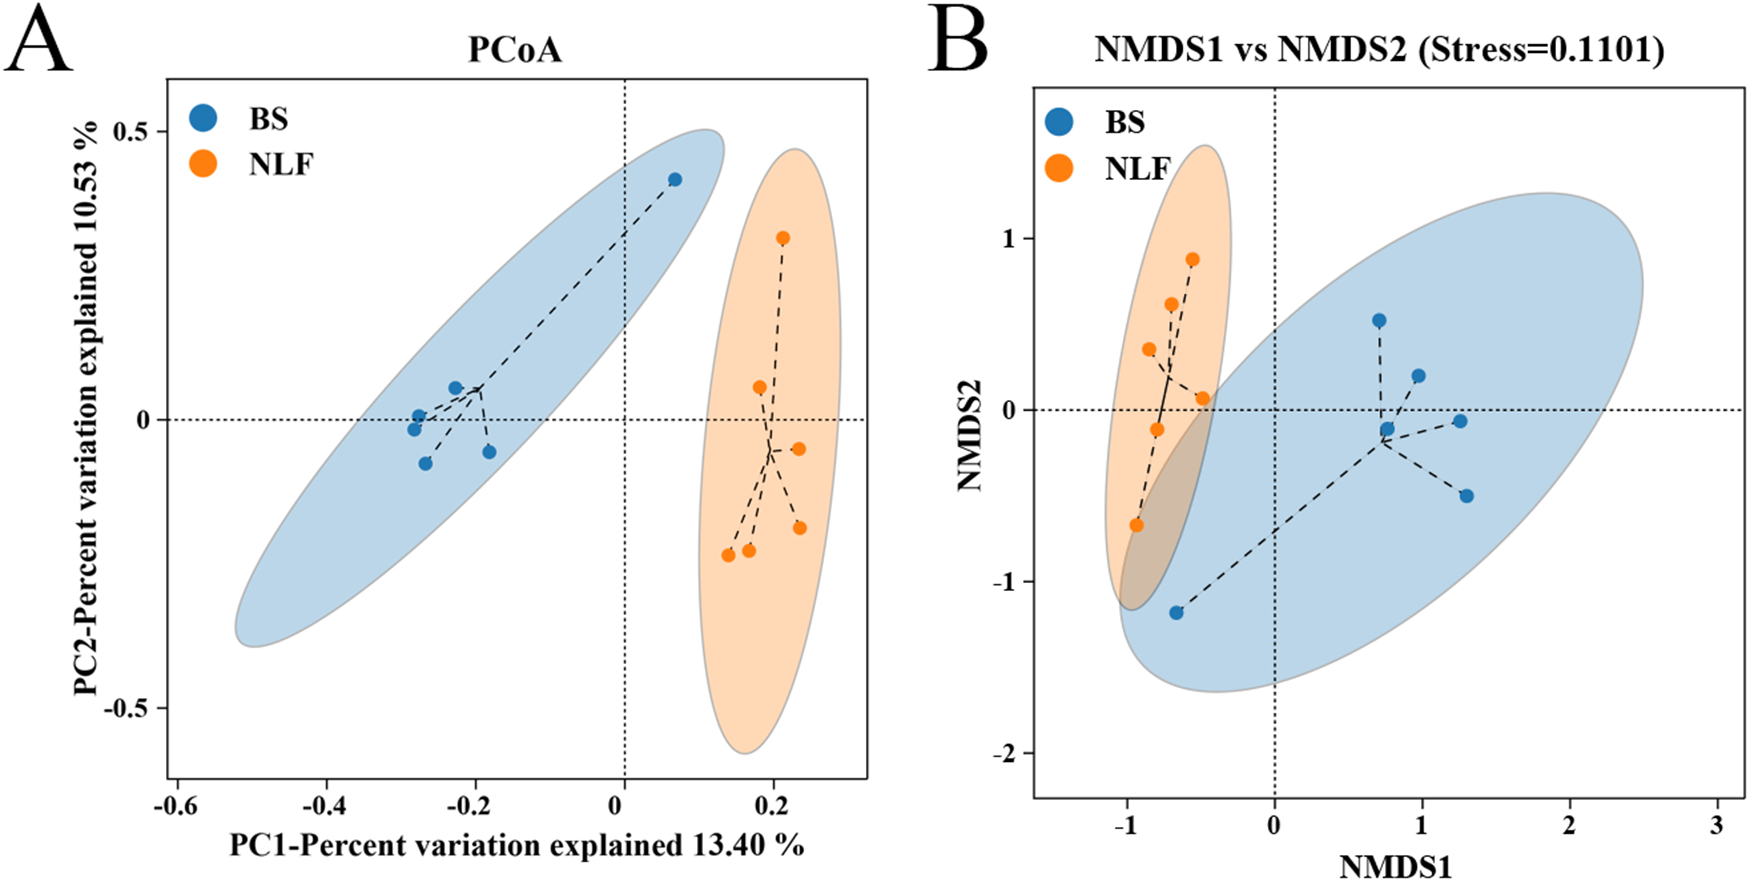
The results of PCoA and NMDS showed significant differences between the two groups, and the microbial communities of the two groups were divided into different clusters (Fig. 3, P < 0.05).
Diversity and overall composition of fecal bacteria between BS and NLF groups. (A) PCoA based on binary_jaccard distances. (B) NMDS based on binary_jaccard distances.

Comparison of cat intestinal microbial communities
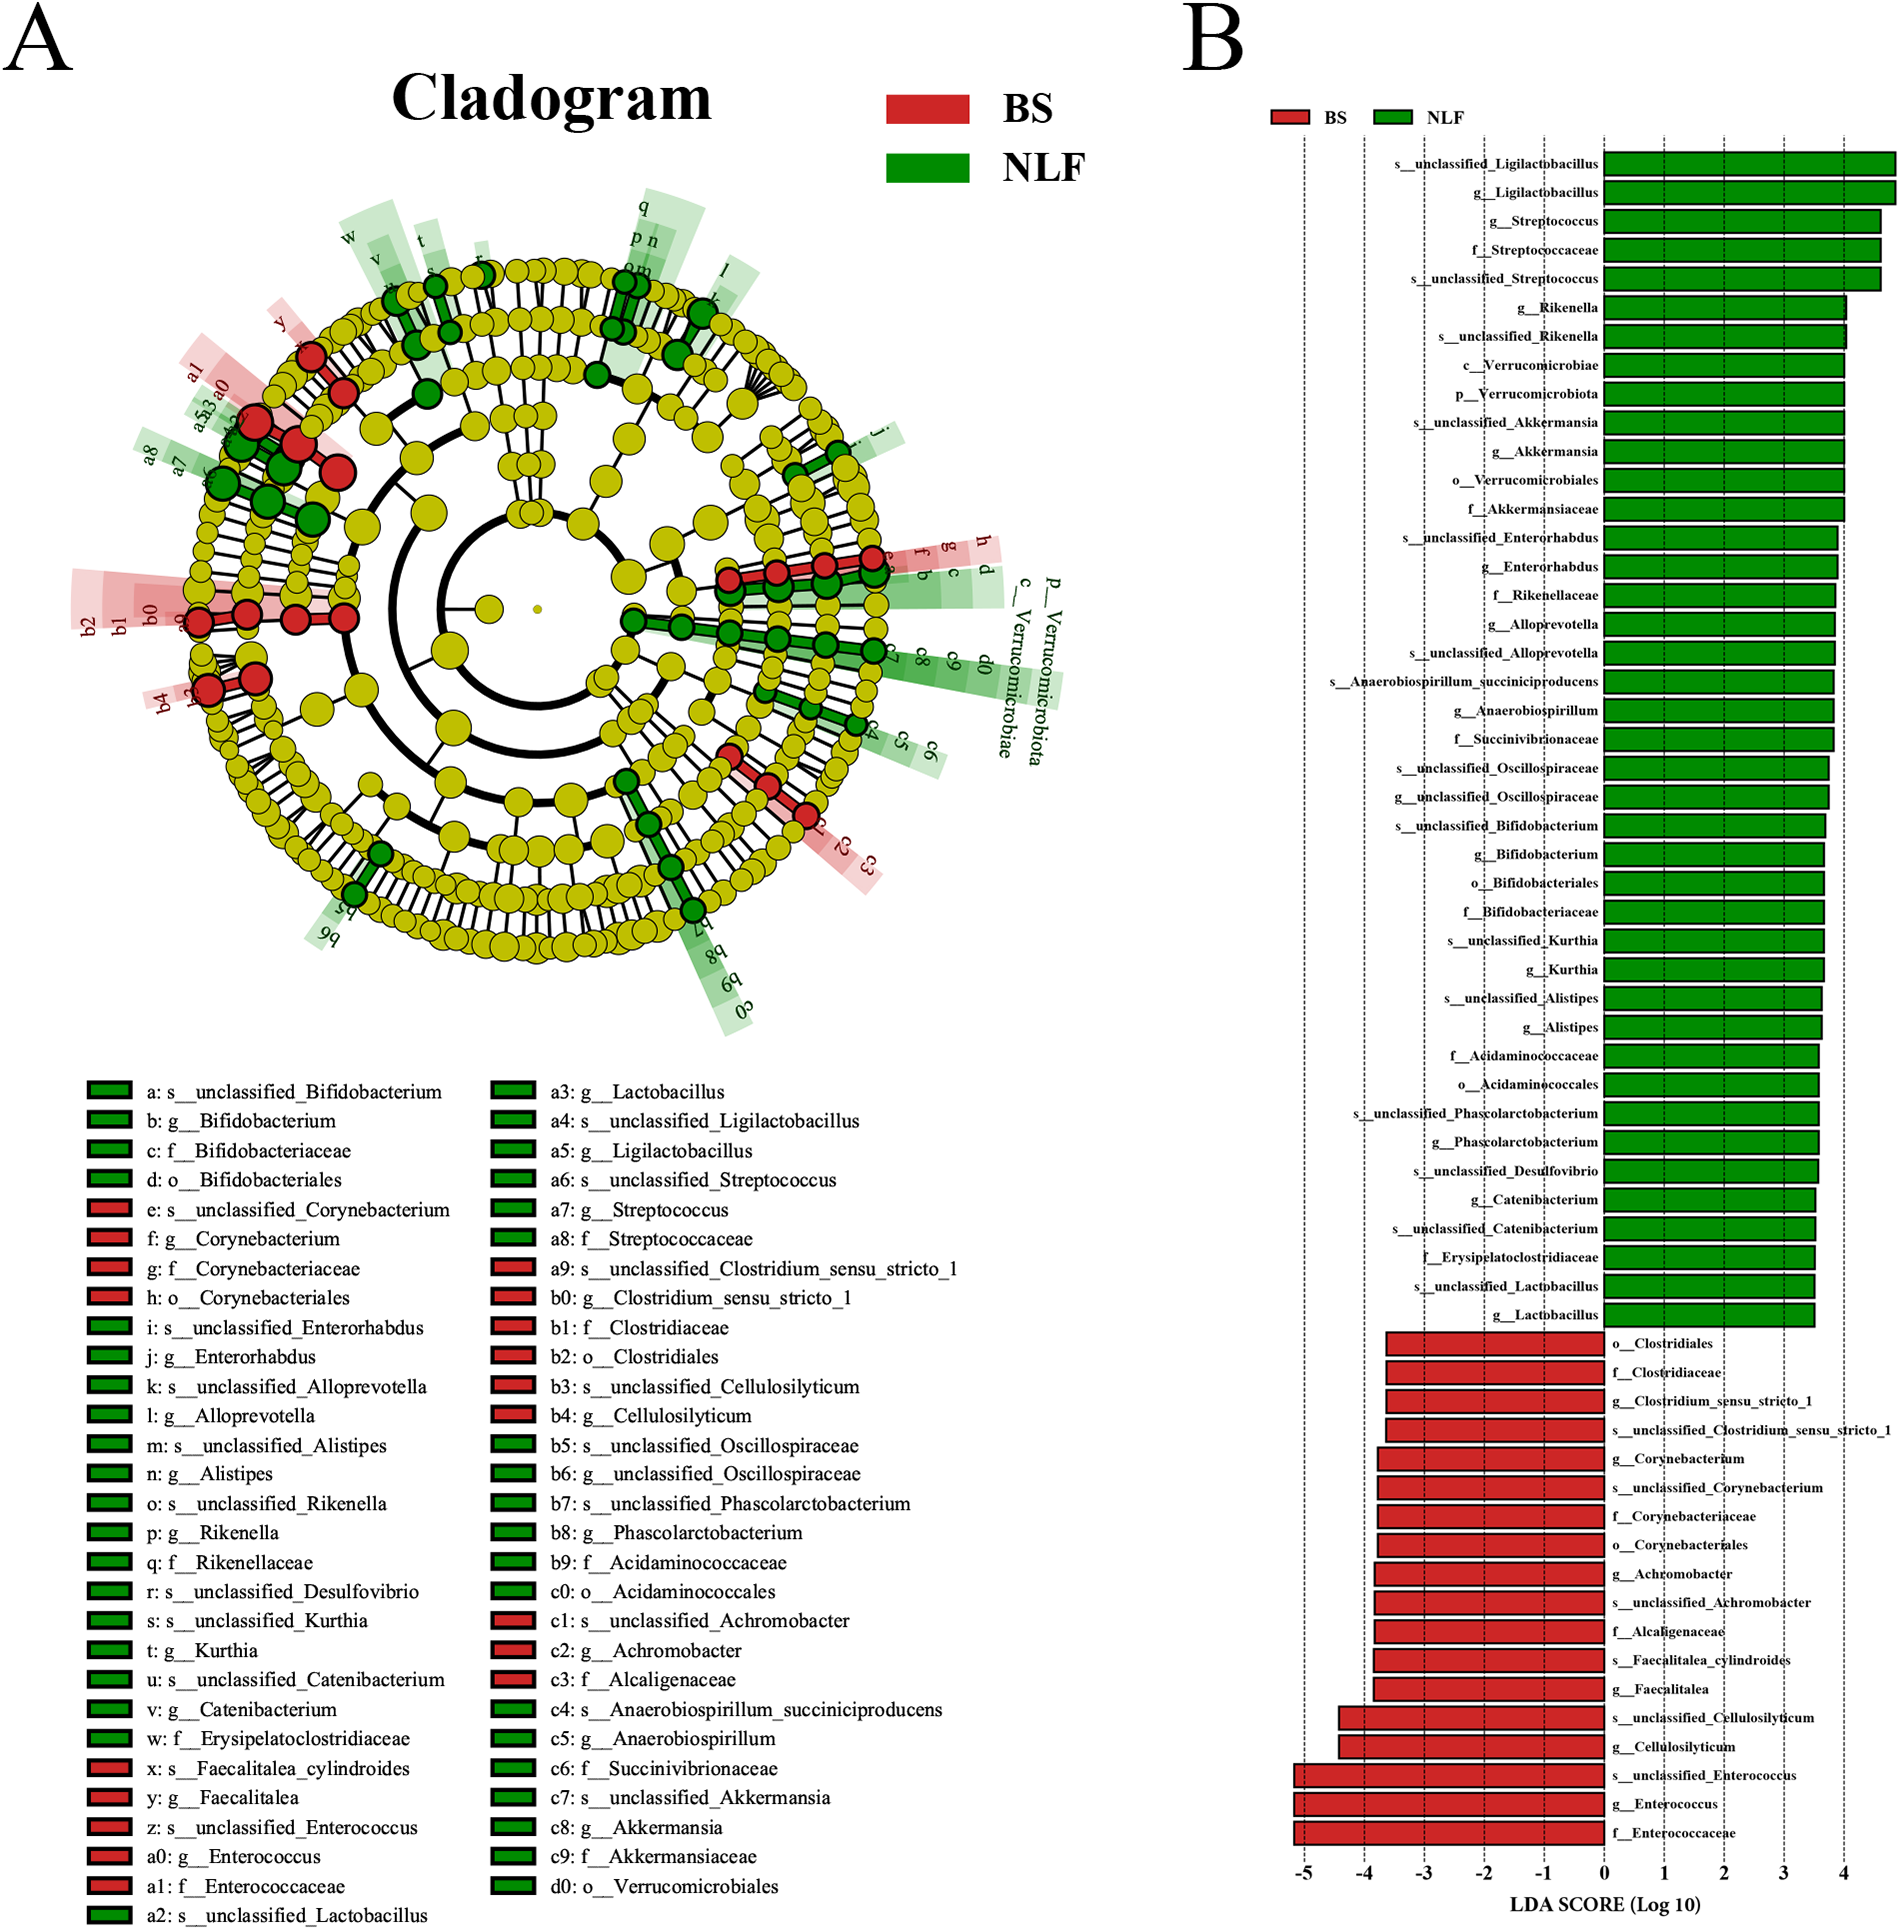
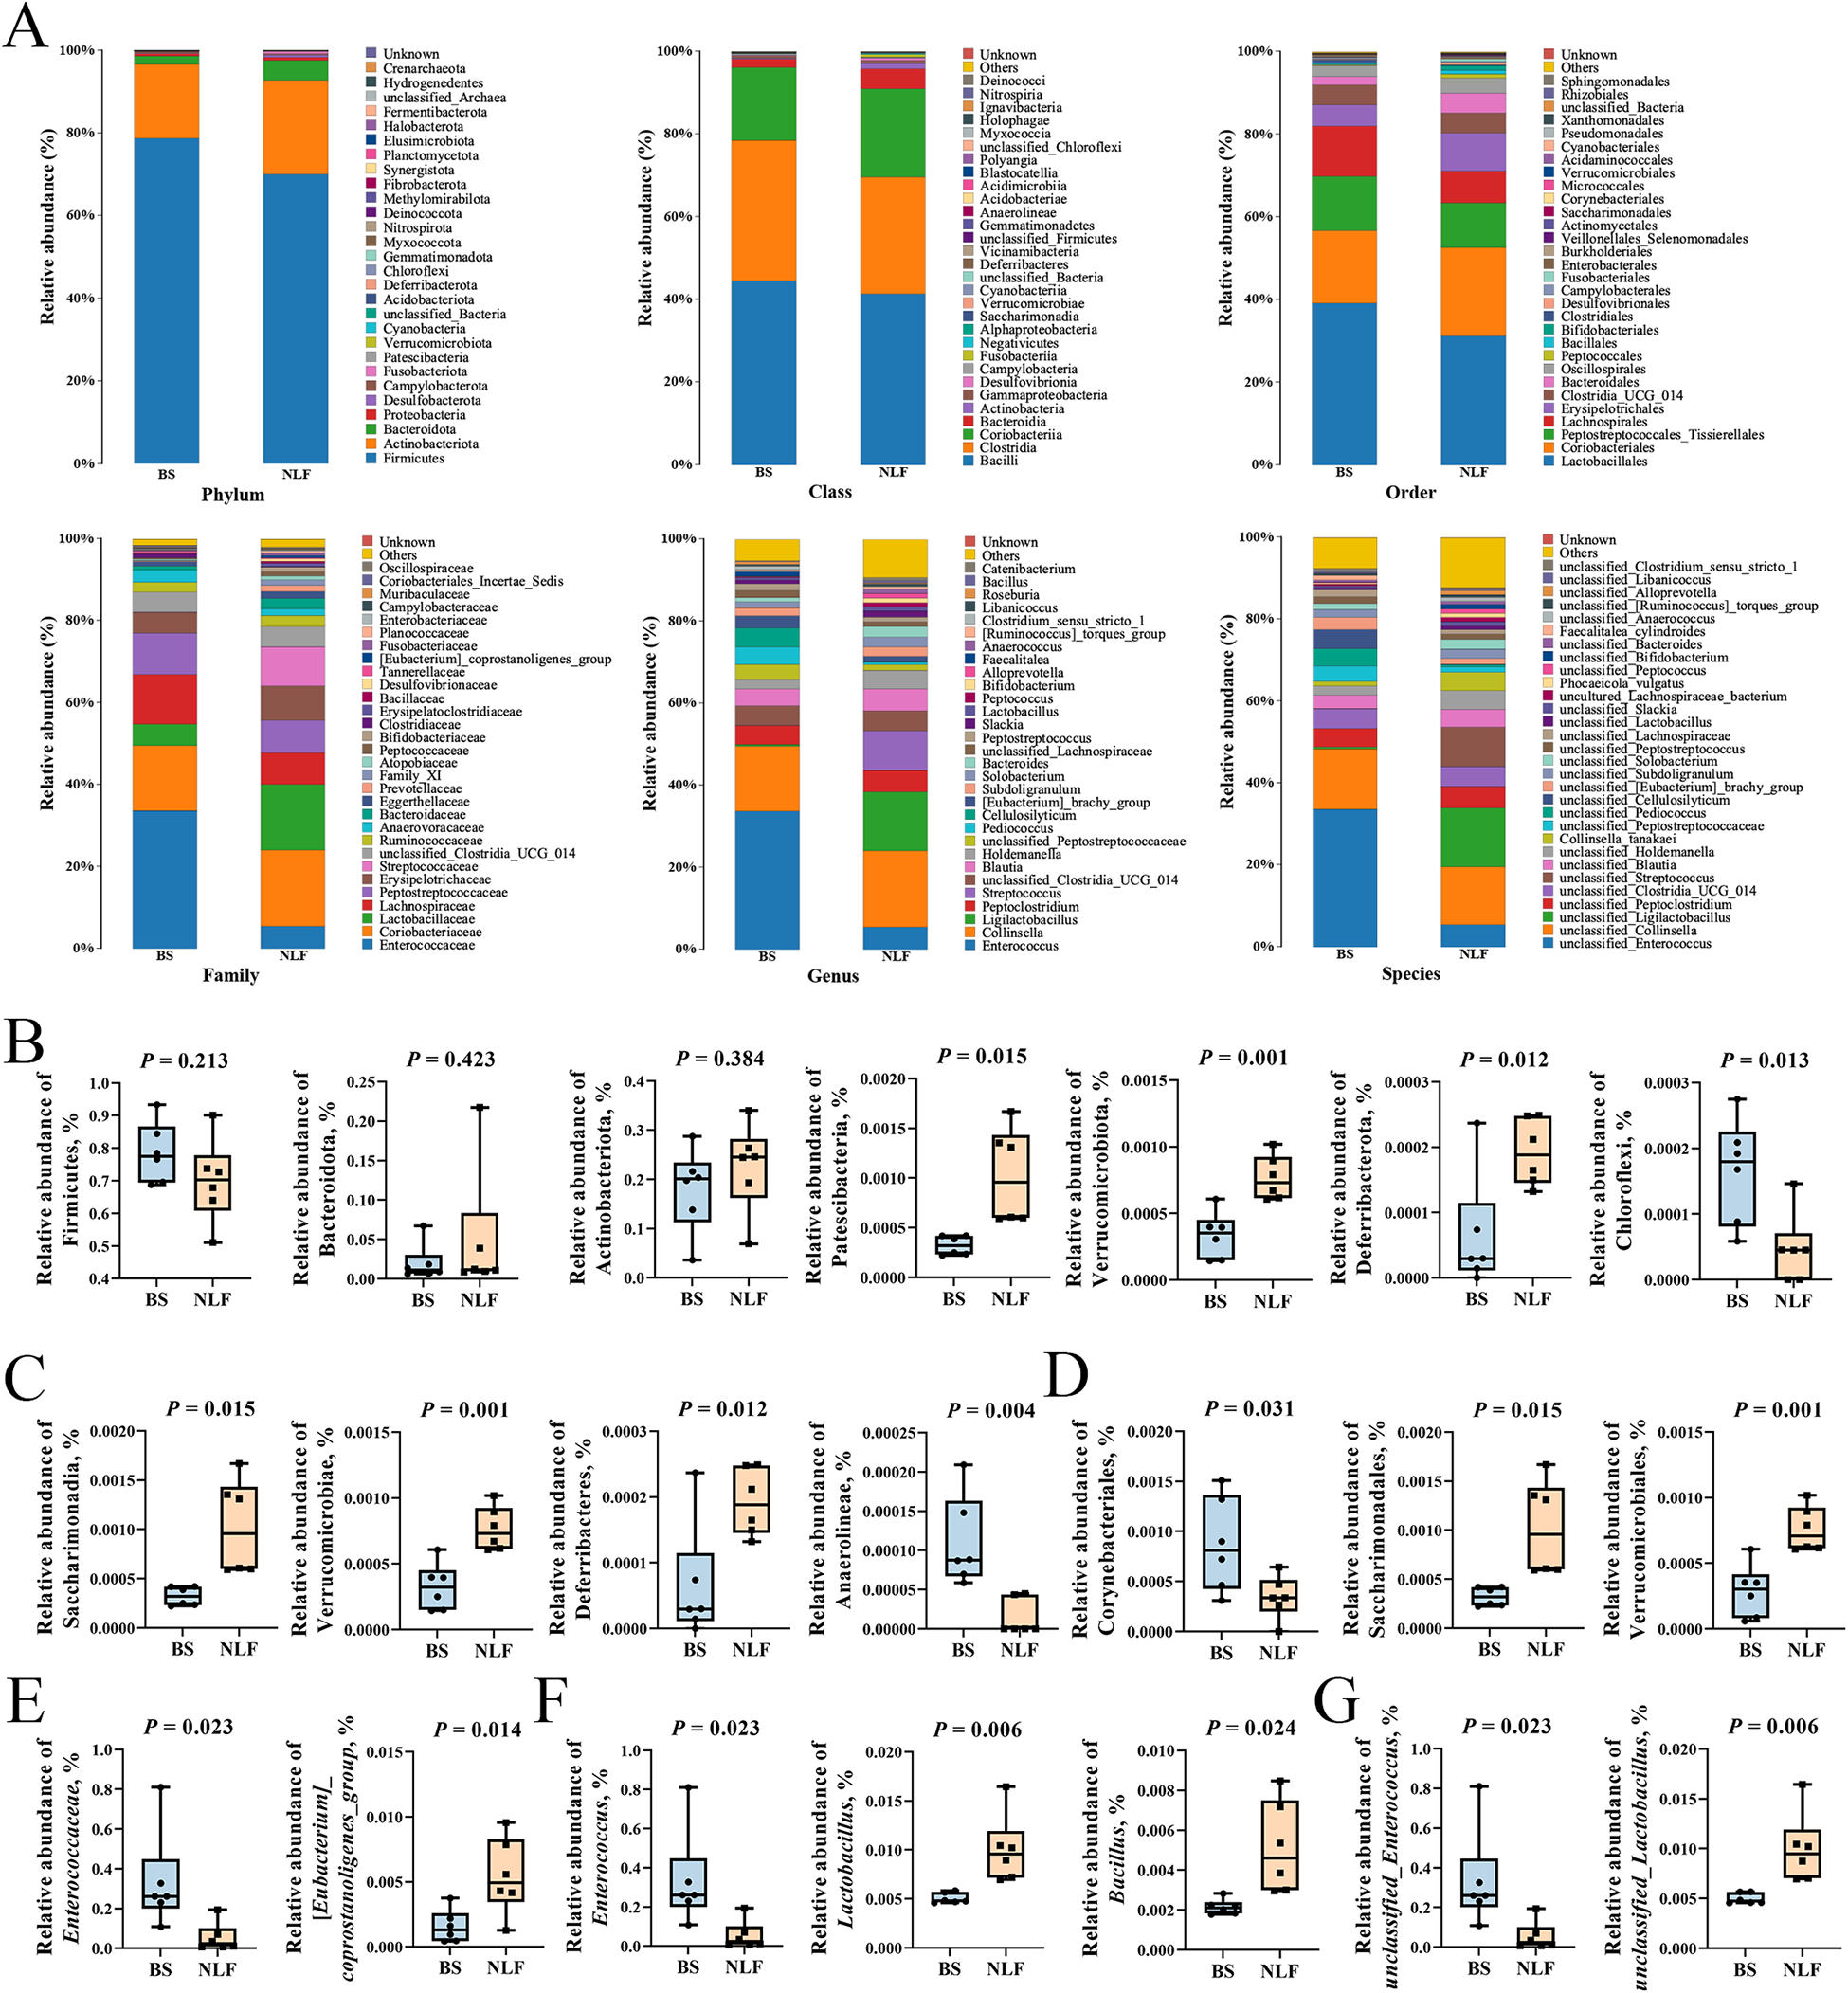
LEfSe was performed to identify specific bacterial taxa between the BS and NLF groups. The branching plot shows the greatest differences in cat gut microbiota at different taxonomic levels between the two groups (Fig. 4A). Bacterial taxa with an linear discriminant analysis (LDA) score greater than 3.5 are selected as biomarker taxa, and we found that 59 taxa were biomarkers in the two groups (Fig. 4B). The histogram of LEfSe analysis results exhibited that the NLF group was enriched in Ligilactobacillus, Streptococcus, Rikenella, Akkermansia, Enterorhabdus, Alloprevotella, Anaerobiospirillum, unclassified_Oscillospiraceae, Bifidobacterium, Kurthia, Alistipes, Phascolarctobacterium, Catenibacterium, Lactobacillus, etc. While the BS group was enriched in Clostridium_sensu_stricto_1, Corynebacterium, Achromobacter, Faecalitalea, Cellulosilyticum, Enterococcus, etc. As shown in Fig. 5, we analyzed changes in the composition of fecal bacteria at different taxonomic levels (phylum, class, order, family, genus, and species), and the composition of the microbiota differed significantly between BS and NLF groups. At the phylum level, the top three phyla in relative abundance (Firmicutes, Actinobacteriota, and Bacteroidota) had no significant difference between the two groups (P > 0.05), but the abundance of Patescibacteria, Verrucomicrobiota, and Deferribacterota in the NLF group was significantly higher than that in the BS group, while Chloroflexi was significantly lower than that in the BS group (P < 0.05). Compared with the BS group, at the class, order and family level, c_Saccharimonadia, c_Verrucomicrobiae, c_Deferribacteres, o_Saccharimonadales, o_Verrucomicrobiales, and f_[Eubacterium]_coprostanoligenes_group in the NLF group were significantly increased in the NLF group, whereas c_Anaerolineae, o_Corynebacteriales, and f_Enterococcaceae significantly decreased in the NLF group (P < 0.05). At the genus and species level, significant increases in g_Lactobacillus, g_Bacillus, and s_unclassified_Lactobacillus and significant decreases in g_Enterococcus and s_unclassified_Enterococcus were observed in the NLF group (P < 0.05).
LEfSe analysis of the fecal microbial community between BS and NLF groups. (A) The cladogram of LEfSe analysis. (B) The histogram of LEfSe analysis. P_: phylum level; c_: class level; o_: order level; f_: family level; g_: genus level; and s_: species.

Composition of fecal bacteria at different taxonomic levels between BS and NLF groups. (A) Average relative abundance of bacteria species in the feces at the phylum, class, order, family, genus, and species level. (B–G) Relative abundance of bacterial communities in the feces contents at the phylum (B), class (C), order (D), family (E), genus (F), and species (G) level.

PICRUSt2 functional prediction
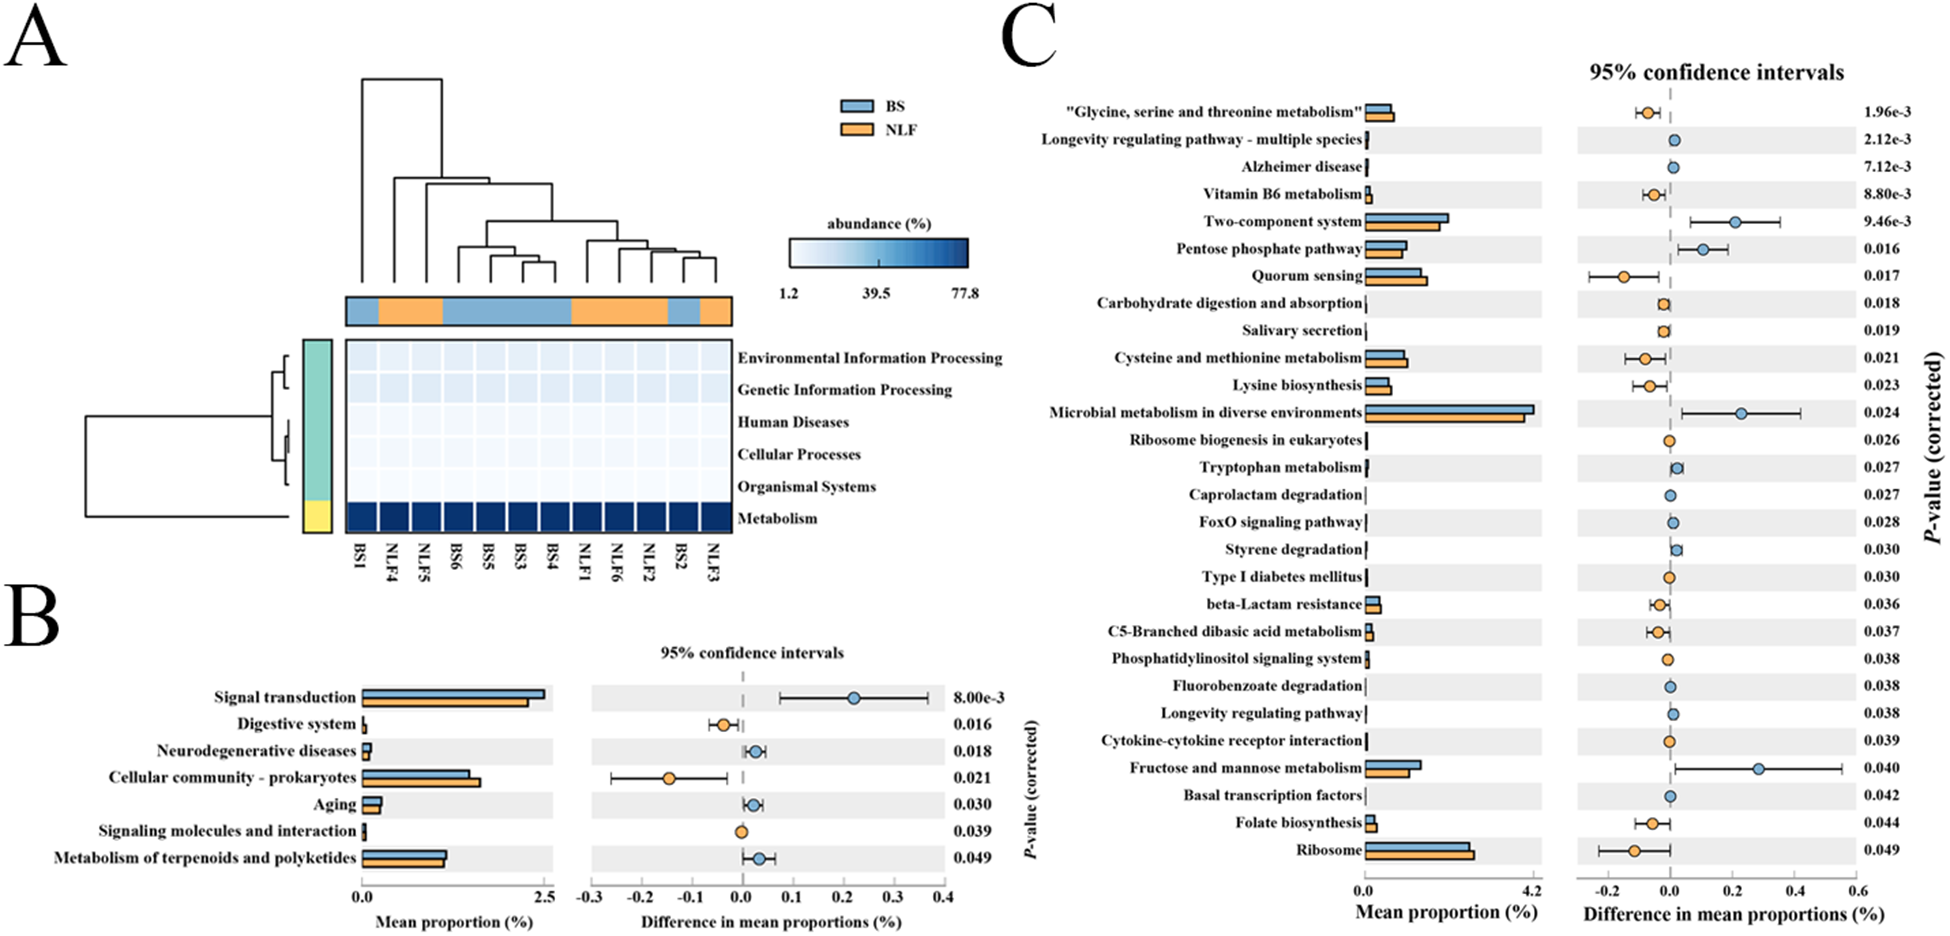
PICRUSt2 was further used to obtain the predicted metabolic functions of fecal microbiota. Our results showed that the ratio of metabolism of the BS group and NLF group was 77.11% and 76.55%, respectively, and the rest included cellular processes, environmental information processing, genetic information processing, human diseases, and organismal systems at level 1 (Fig. 6A). Analysis of predicted microbial pathway functions at level 2 using STAMP further confirmed distinct metabolic profiles between the two groups, with seven pathways demonstrating significant alterations (Fig. 6B, P < 0.05). At level 3, the NLF group significantly increased 15 metabolism pathways (“Glycine, serine and threonine metabolism,” Vitamin B6 metabolism, Quorum sensing, Carbohydrate digestion and absorption, Salivary secretion, Cysteine and methionine metabolism, Lysine biosynthesis, Ribosome biogenesis in eukaryotes, Type I diabetes mellitus, beta-Lactam resistance, C5-Branched dibasic acid metabolism, Phosphatidylinositol signaling system, Cytokine–cytokine receptor interaction, Folate biosynthesis, and Ribosome), whereas it decreased 13 metabolism pathways such as Longevity regulating pathway – multiple species, Alzheimer disease, Two-component system, Pentose phosphate pathway, Microbial metabolism in diverse environments, Tryptophan metabolism, Caprolactam degradation, FoxO signaling pathway, Styrene degradation, Fluorobenzoate degradation, Longevity regulating pathway, Fructose and mannose metabolism, and Basal transcription factors (Fig. 6C, P < 0.05).
Comparison of predicted metabolic pathway abundances at different levels between the BS and NLF groups by STAMP. (A) At the level 1, (B) at the level 2, and (C) at the level 3. The confidence interval was set at 95%.

Antimicrobial activity of isolated strains
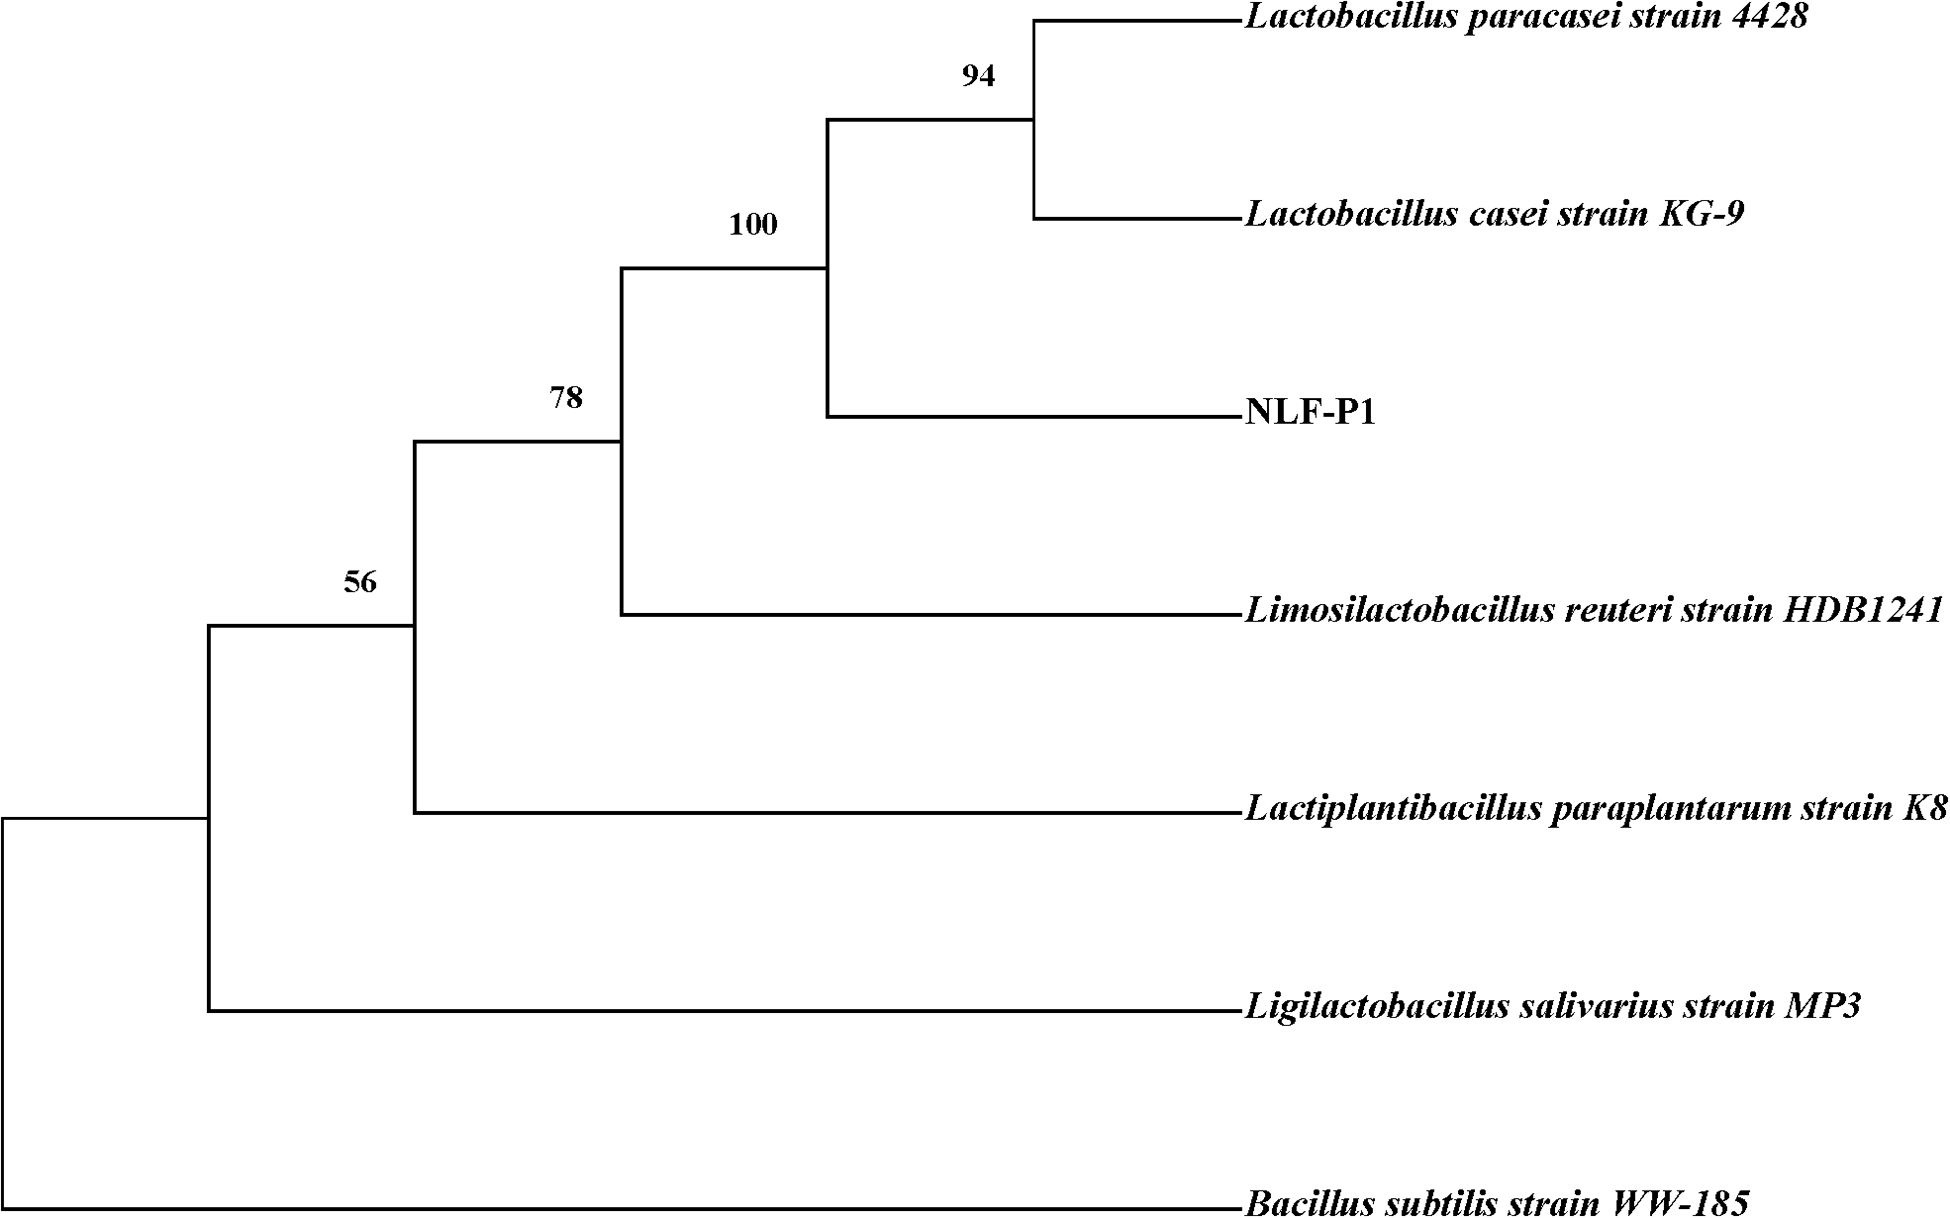
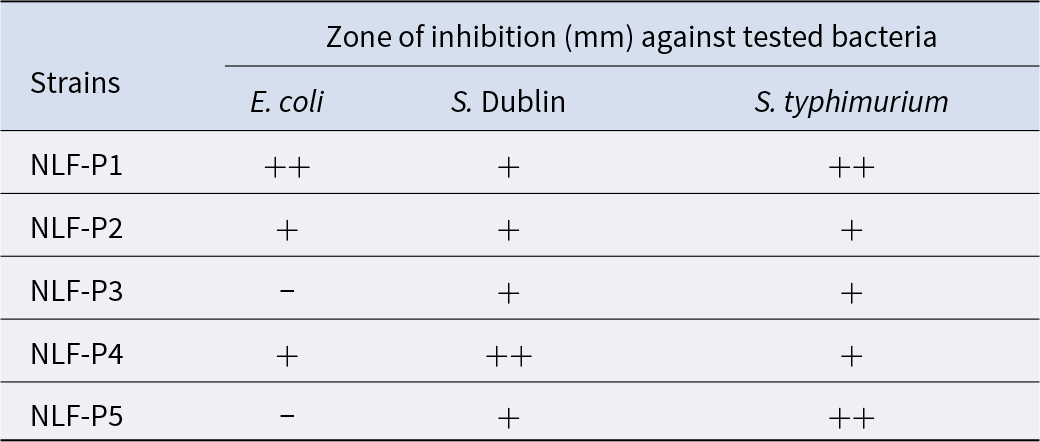
As the microbiome results showed that there was a significant difference in the abundance of Lactobacillus between the NLF group and the BS group, we isolated five strains (NLF-P1, NLF-P2, NLF-P3, NLF-P4, and NLF-P5) with different colony morphology on the MRS agar plate from the stool of NLF, and conducted antibacterial experiments against the drug-resistant cat-derived pathogens. As shown in Table 7, we found that the five isolated strains had antibacterial effects on both S. Dublin and S. typhimurium, among which NLF-P4 had the best antibacterial effect on S. Dublin, and NLF-P1 as well as NLF-P5 had the best antibacterial effect on S. typhimurium. For E. coli, NLF-P1, NLF-P2, and NLF-P4 had antibacterial effects, with NLF-P1 being the best. Interestingly, NLF-P3 and NLF-P5 had no obvious antibacterial effects on E. coli. A comprehensive comparison showed that NLF-P1 had the best antibacterial effect on the three strains of pet-associated pathogens, and the evolutionary tree construction showed that it might be Lactobacillus paracasei or Lactobacillus casei (Fig. 7).
Identification and classification of NLF-P1.

Inhibitory zones of strains isolated from the feces of NLF against pathogens

Note: −, no antibacterial activity; +, low inhibitory activity, 0 mm < inhibition zone diameter ≤ 10 mm; ++, moderate antibacterial activity, 10 mm < inhibition zone diameter ≤ 15 mm; +++, highly antibacterial activity, inhibition zone diameter > 15 mm.
Discussion
Our previous research has shown that cats are prone to diarrhea in everyday life (Wang et al. Reference Wang, Mei and Wang2023), but recently we have found an interesting phenomenon through the survey of veterinary clinics and interviews with cat owners, that NLF has less diarrhea in everyday life than BS, and have a strong resistance to environmental stress, which we speculate that gut microbiota may play a key role. Therefore, cats of similar age were fed the same diet and stayed in the same environment for 3 weeks to eliminate the effects of age, diet, and environment on gut microbiota in this study. Despite all values being within the normal clinical reference range, significant differences in ALT and CHOL were observed between the BS and NLF groups. This discrepancy suggests underlying physiological variations between these populations. The elevated ALT level, a marker of hepatic activity, in the BS group might be linked to breed-specific metabolic traits or dietary compositions common in commercially raised pedigreed cats (Mirmiran et al. Reference Mirmiran, Gaeini and Bahadoran2019). Similarly, the higher CHOL level could reflect genetic predispositions in certain breeds affecting lipid metabolism or differences in dietary fat intake and energy expenditure (Poklukar et al. Reference Poklukar, Candek-Potokar and Batorek Lukac2020). Importantly, the fact that these values remain within normal limits indicates that these differences are likely subclinical variations rather than indications of pathological states. Future studies investigating the diet and genetic makeup of these cat groups would be valuable to confirm these hypotheses. Additionally, this indicates that all the cats were in a healthy state, and the composition of gut microbiota could accurately reflect the normal state at this time.
Alpha diversity is a standard ecological metric for evaluating species richness and evenness within communities. A flattened rarefaction curve suggests that sequencing depth was adequate to capture the majority of microbial diversity, thereby reliably representing sample richness (Yu et al. Reference Yu, Liang and Xiao2022). In this study, however, no significant differences in gut microbial alpha diversity were detected between the BS and NLF groups. On the other hand, beta diversity analysis, which assesses dissimilarities in community composition and structure across samples (Liu et al. Reference Liu, Zou and Ruan2020), revealed significant separation between groups through both PCoA and NMDS, suggesting distinct microbial community profiles in the BS and NLF groups. Community structure analysis further elucidates compositional differences among samples, incorporating both cross-sample comparisons and taxon-specific abundance assessments within individual samples (Krober et al. Reference Krober, Bekel and Diaz2009; Patel et al. Reference Patel, Kunjadia and Koringa2019). Previous research reports that the dominant bacterial phyla in the cat gastrointestinal tract are Firmicutes, Bacteroidetes, Actinobacteria, and Proteobacteria (Ritchie et al. Reference Ritchie, Steiner and Suchodolski2008), and the percentages of these bacterial groups often differ among species and individuals (Barko et al. Reference Barko, McMichael and Swanson2018; Minamoto et al. Reference Minamoto, Hooda and Swanson2012; Suchodolski Reference Suchodolski2011; Tizard and Jones Reference Tizard and Jones2018). We found a high abundance of Verrucomicrobiota in the feces of the NLF, and Akkermansia muciniphila, one of the known strains of Verrucomicrobiota, can regulate metabolism and immune function, degrade mucin and exert competitive inhibition on other pathogenic bacteria (Belzer and de Vos Reference Belzer and de Vos2012; Derrien et al. Reference Derrien, Van Baarlen and Hooiveld2011; Everard et al. Reference Everard, Belzer and Geurts2013). The notably higher abundance of Verrucomicrobiota in the NLF group suggests that these cats may possess a gut microbial ecosystem that is more conducive to maintaining mucosal health. This could potentially contribute to a more robust gut barrier, which is a key line of defense against pathogens and inflammation (Pickard et al. Reference Pickard, Zeng and Caruso2017). Furthermore, the metabolic regulatory functions of A. muciniphila offer a plausible microbial-level explanation for the different metabolic profiles (e.g., the significant differences in ALT and CHOL levels) observed between the NLF and BS groups, despite all values being within normal range. We hypothesize that the gut microbiome, characterized by a higher abundance of beneficial bacteria like A. muciniphila, might be one of the factors underlying the potentially stronger immune competence and metabolic resilience often anecdotally associated with non-pedigreed animals (Ghotaslou et al. Reference Ghotaslou, Nabizadeh and Memar2023). At the genus level, we found that the abundance of Bacillus and Lactobacillus in the NLF was higher than that in the BS group. Bacillus has enhanced tolerance and survival in harsh environments, and can regulate the immune system and improve intestinal homeostasis (Arreguin-Nava et al. Reference Arreguin-Nava, Graham and Adhikari2019; Du et al. Reference Du, Xu and Mei2018b, Reference Du, Xu and Mei2018b; Lu et al. Reference Lu, Na and Li2024). Lactic acid bacteria participate in the synthesis of some essential vitamins and organic acids, and significantly contribute to nutrient absorption and related intestinal functions (Huang et al. Reference Huang, Wu and Zhou2022; Wang et al. Reference Wang, Ahmadi and Nagpal2020). In addition, the increased relative abundance of Bacillus and Lactobacillus may compete with harmful bacteria (Kuebutornye et al. Reference Kuebutornye, Abarike and Lu2020; Piewngam et al. Reference Piewngam, Zheng and Nguyen2018). When bacterial taxa with an LDA score greater than 3.5 are selected as biomarker taxa, we found that the NLF group was associated with enrichment of Lactobacillus (Chuandong et al. Reference Chuandong, Hu and Li2024), Akkermansia (Cani et al. Reference Cani, Depommier and Derrien2022), and Bifidobacterium (Gavzy et al. Reference Gavzy, Kensiski and Lee2023), which are known to have beneficial effects. These results suggest that the feces of the NLF may be a huge potential reservoir of probiotics. In addition, PICRUSt2 functional prediction results showed that the NLF group had significantly enriched pathways related to the digestive system, indicating a potentially enhanced capacity for nutrient metabolism and energy harvest from the diet (Duca et al. Reference Duca, Waise and Peppler2021). More remarkably, the predicted reduction in pathways associated with neurodegenerative diseases, while requiring further validation, hints at a potential link between the NLF gut microbiome and neurological health via the gut-brain axis. Certain microbial metabolites can influence neuroinflammation and central nervous system function (Xie et al. Reference Xie, Zhang and Tang2025). Thus, although these are predictive findings, they suggest that the distinct gut microbiome of NLF cats may contribute to host health not only through local gastrointestinal effects but also potentially through systemic impacts, warranting further investigation.
AMR poses a global public health challenge, and companion animals can act as a reservoir for potential zoonotic pathogens and antibiotic-resistant bacterial strains (Srisanga et al. Reference Srisanga, Angkititrakul and Sringam2017). Pet-associated E. coli and Salmonella are currently the focus of research as factors associated with diarrhea in pets and harm human and pet health (Teng et al. Reference Teng, Feng and Liao2023, Reference Teng, Liao and Zhou2022). Probiotics are not only a safe alternative to antibiotics to reduce the risk of antibiotic abuse, but also an effective treatment strategy for various diseases (Al-Khalaifah Reference Al-Khalaifah2018; Ji et al. Reference Ji, Jin and Liu2023; Ma et al. Reference Ma, Tao and Song2024). In this study, we isolated five strains of lactic acid bacteria from the NLF feces. Among them, NLF-P1 demonstrated superior broad-spectrum activity against major pet-associated pathogens (E. coli, S. Dublin, and S. typhimurium). In contrast, NLF-P4 and NLF-P5 exhibited distinct, serovar-specific efficacy against S. Dublin and S. typhimurium, respectively. This functional divergence is likely attributable to the strains producing different spectra of antimicrobial compounds, such as organic acids, bacteriocins, and other antimicrobial peptides, which is a known characteristic of lactic acid bacteria (Cortes-Zavaleta et al. Reference Cortes-Zavaleta, Lopez-Malo and Hernandez-Mendoza2014; Wang et al. Reference Wang, Li and Wang2024). Beyond their direct antibacterial effects, the probiotic potential of these strains warrants further investigation into key attributes, including acid and bile tolerance, mucosal adhesion, and in vivo safety. Moreover, exploring potential synergistic interactions between these lactic acid bacteria and other beneficial genera such as Akkermansia could pave the way for advanced consortium-based probiotic strategies. These NLF-derived strains, particularly the promising NLF-P1, thus represent prime candidates for developing targeted probiotic interventions to reduce antibiotic reliance in veterinary medicine and mitigate AMR risks.
This study provides a novel comparative analysis of the gut microbiome between BS and NLF, leading to the successful isolation of lactic acid bacteria with anti-pathogen activity from the latter. The functional characterization of these strains highlights the potential of the NLF microbiome as a resource for probiotic discovery. It should be acknowledged, however, that the findings are constrained by a modest sample size from a single geographic location. Furthermore, the in vitro antibacterial activity demonstrated here necessitates future validation through in vivo studies to confirm the probiotic efficacy and health benefits of these isolates.
Conclusion
In conclusion, this comparative analysis reveals that NLF harbors a gut microbial community enriched with beneficial genera such as Lactobacillus, Akkermansia, and Bifidobacterium compared to BS. Furthermore, we isolated a Lactobacillus strain (NLF-P1) from the NLF feces, which exhibited potent antibacterial activity against key pet-associated pathogens (E. coli, S. Dublin, and S. typhimurium). These findings position NLF-P1 as a promising probiotic candidate for developing targeted alternatives to antibiotics in veterinary medicine.
Supplementary Material
The supplementary material for this article can be found at https://doi.org/10.1017/anr.2025.10021.
Acknowledgements
This study was financially supported by the China Postdoctoral Science Foundation under Grant Number 2025M780248 and National Natural Science Foundation of China (No. 32072766).
Author Contributions
FW, Validation, Formal analysis, Investigation, Writing – Original draft; LCW, Methodology, Writing – Review & editing; AXH, Investigation, Validation; XYM, Methodology, Resources; QX, Investigation; PWZ, Formal analysis; QW, Formal analysis, Visualization; XL, Writing – Review & editing; QJ, Writing – Review & editing; YPX, Supervision, Resources; WFL, Conceptualization, Supervision, Project administration, Funding acquisition. The authors read and approved the final manuscript.
Conflicts of Interest
The authors declare no conflict of interest.


 Open access

