


1. Introduction
The processes of progressive thrust propagation into the foreland basin and associated depocentre migration have been well known for decades (e.g. Lyon-Caen & Molnar Reference Lyon-Caen and Molnar1985; Homewood et al. Reference Homewood, Allen, Williams, Allen and Homewood1986; Ricci Lucchi, Reference Ricci Lucchi, Allen and Homewood1986; DeCelles & Giles, Reference DeCelles and Giles1996; Lacombe et al. Reference Lacombe, Lavé, Roure and Vergés2007). Similarly, the distinction between toe-troughs (or foredeeps sensu stricto, where a basin accumulates sediments ahead of an active thrust system) and thrust-sheet-top basins (or piggyback basins, resting on top of moving thrust sheets), dates back to the same period (Ori & Friend, Reference Ori and Friend1984). However, the simple notion of forelandward depocentre migration and of foredeep vs piggyback sedimentation is challenged in situations of changing thrusting style, from detachment- to crustal ramp-dominated (Giamboni et al. Reference Giamboni, Ustaszewski, Schmid, Schumacher and Wetzel2004; Butler & Mazzoli, Reference Butler, Mazzoli, Mazzoli and Butler2006; Von Hagke et al. Reference Von Hagke, Cederbom, Oncken, Stckli, Rahn and Schlunegger2012), as well as in multi-stage thrust belts such as the Zagros (e.g. Alavi, Reference Alavi1994), the Pyrenees (e.g. Muñoz, Reference Muñoz and McClay1992), the Alps (e.g. Mosar, Reference Mosar1999; Handy et al. Reference Handy, Schmid, Bousquet, Kissling and Bernoulli2010) or the Oman Mountains (Boote et al. Reference Boote, Mou, Waite, Robertson, Searle and Ries1990; Tarapoanca et al. Reference Tarapoanca, Andriessen, Broto, Chérel, Ellouz-Zimmermann, Faure, Jardin, Naville and Roure2010). In these latter cases, shortening renewal causes uplift of a partly eroded thrust belt and further forelandward migration of flexural subsidence. Neither the shortening direction nor thrust location and propagation sequence for the two stages necessarily overlap. As a consequence, the evolution of the two foreland basins can evolve significantly differently in terms of both style and position, as observed for example in the Zagros (e.g. Saura et al. Reference Saura, Garcia-Castellanos, Casciello, Parravano, Urruela and Vergés2015). Understanding the evolution of a multi-stage thrust belt thus requires evaluating the tectonostratigraphic evolution of the different tectonic pulses that controlled its development. In turn, this requires detailed structural studies to be carried out on the different portions of the syn-orogenic sedimentary pile.
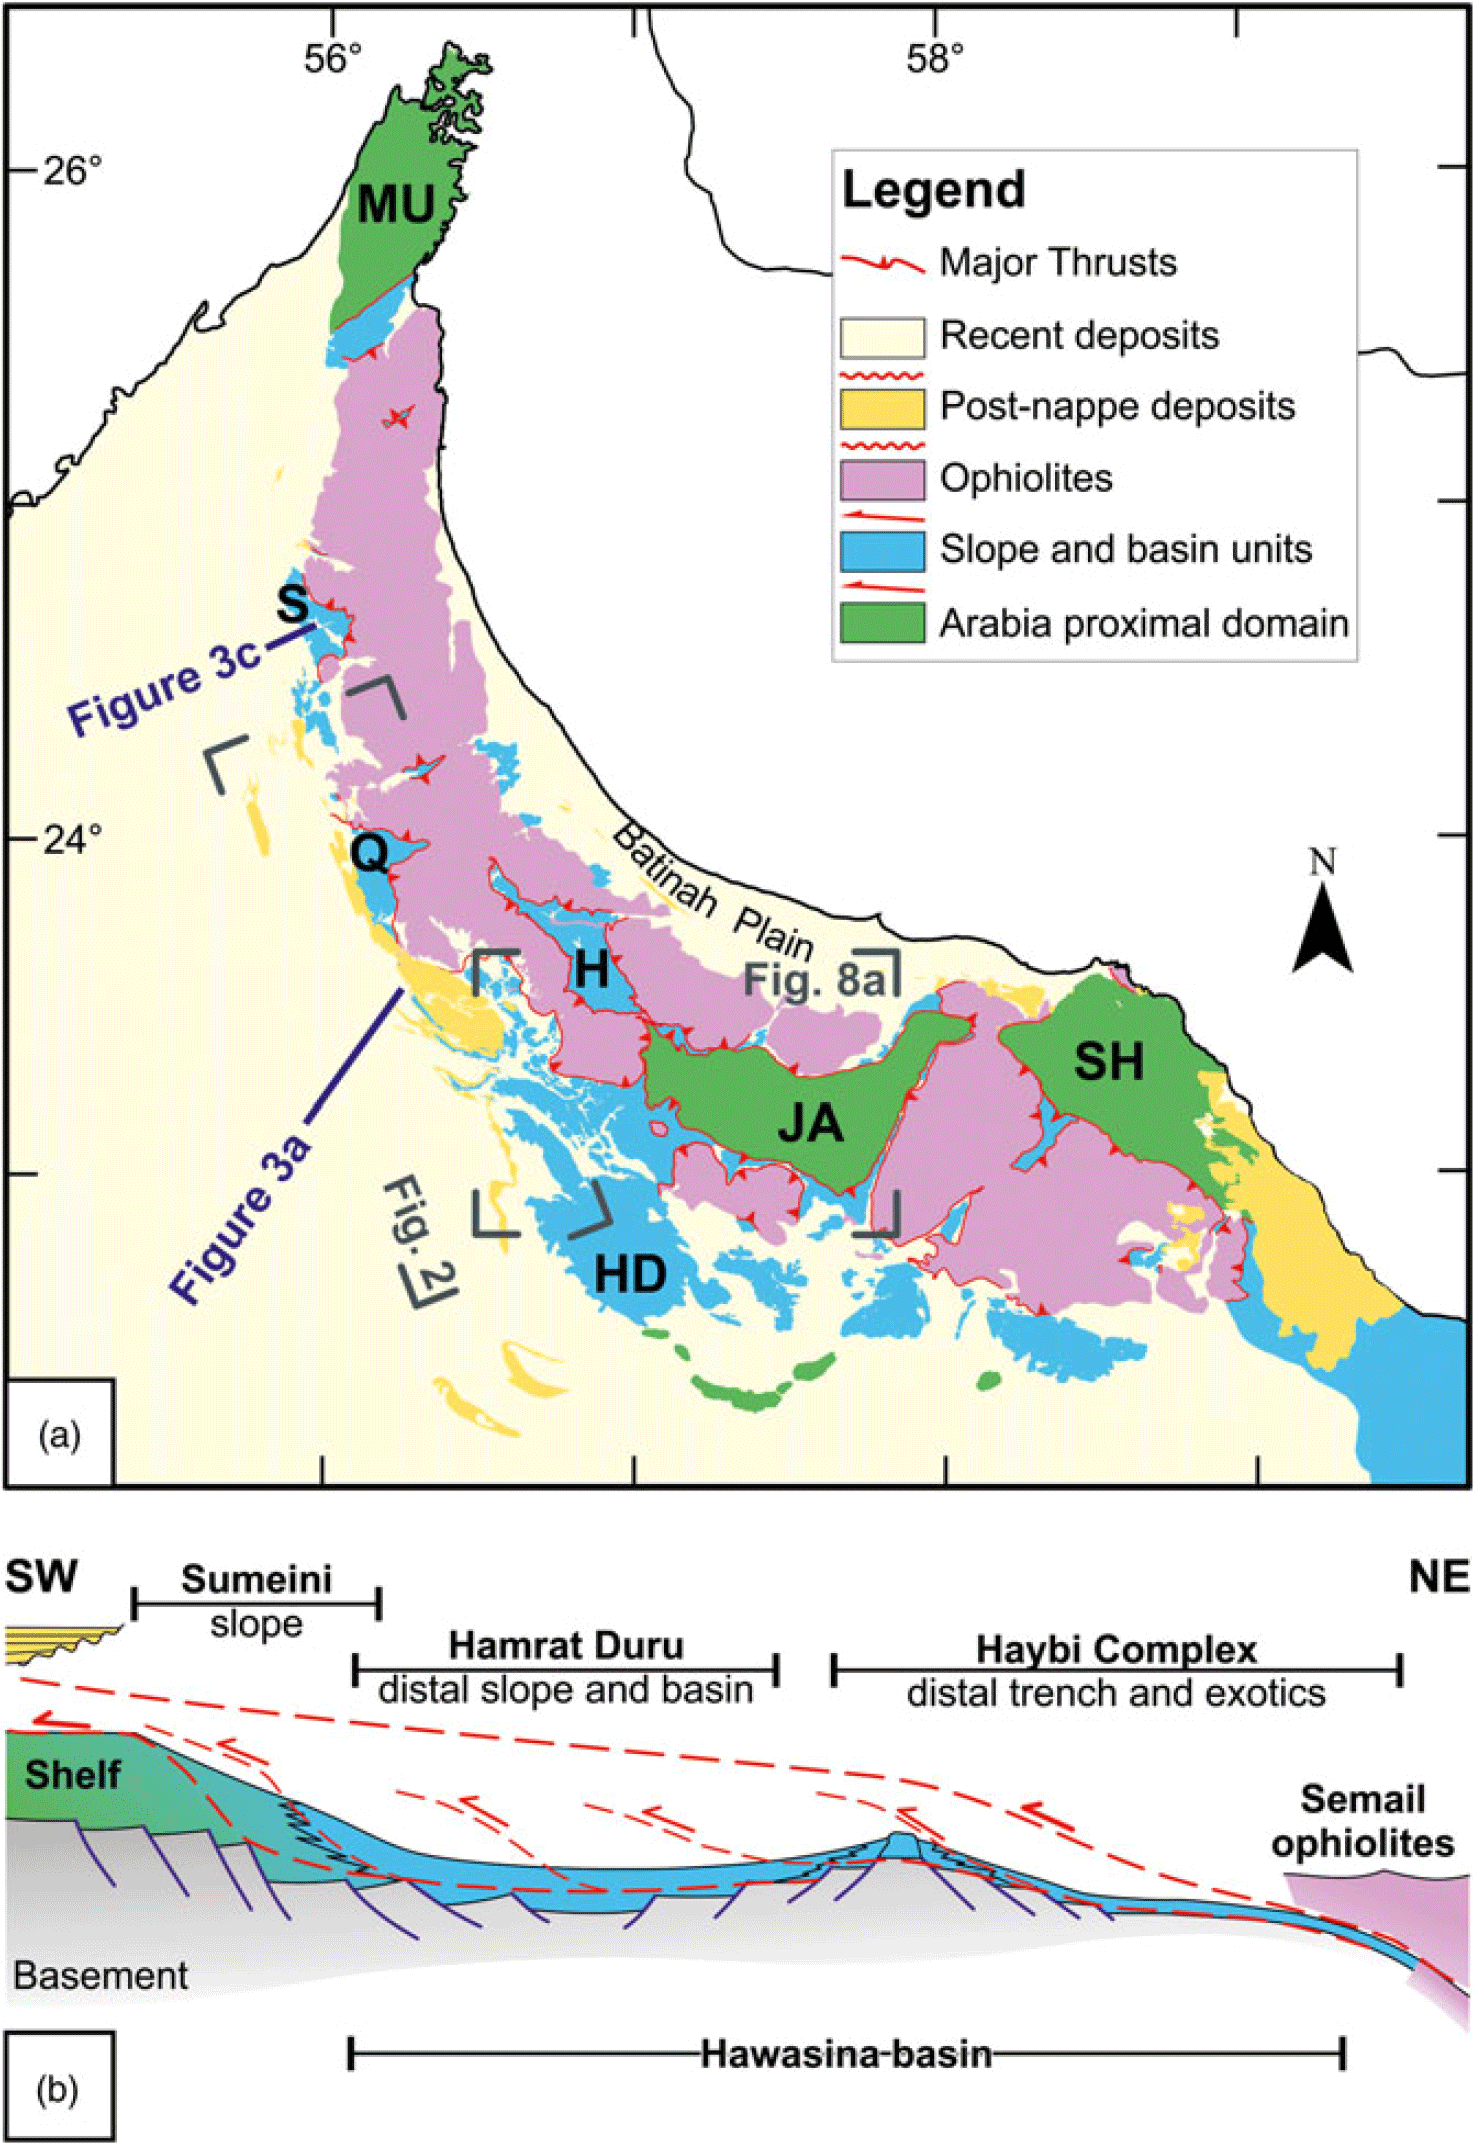
The Al-Hajar mountain belt (Fig. 1a) is an outstanding example of polyphase mountain building, recording two main shortening stages. The first is very well constrained by the remarkable obduction of one of the most studied ophiolite complexes in the world, the Semail ophiolite (Searle, Reference Searle, Rollinson, Searle, Abbasi, Al-Lazki and Al Kindi2014 and references therein). This ophiolite complex overthrusted southwestward the deformed Arabian passive margin during the Late Cretaceous, including the imbricated pelagic sediments of the Hawasina Basin (Fig. 1b; Glennie et al. Reference Glennie, Boeuf, Clarke, Moody-Stuart, Pilaar and Reinhardt1973; Béchennec et al. Reference Béchennec, Le Métour, Rabu, Villey and Beurrier1988). This shortening event was associated with uplift and erosion of the forebulge and deposition of syn-tectonic sediments of the Aruma Group (Nolan et al. Reference Nolan, Skelton, Clissold, Smewing, Robertson, Searle and Ries1990; Béchennec et al. Reference Béchennec, Roger, Le Metour and Wyns1992) ahead of the advancing wedge. In the foredeep, these syn-tectonic sediments are overlain by post-kinematic latest Cretaceous to Eocene carbonates, commonly referred to as the post-nappe package. This package thins toward the interior of the belt, where it unconformably overlies the different Cretaceous nappes. The second shortening event led to the re-deformation of the Cretaceous tectonic pile, along with the post-nappe package. This event is definitely more intricate and less constrained. Its stratigraphic record is scarce and consists of late Eocene–Miocene syn-kinematic layers, whose youngest groups are only locally outcropping and mostly observed in seismic sections.
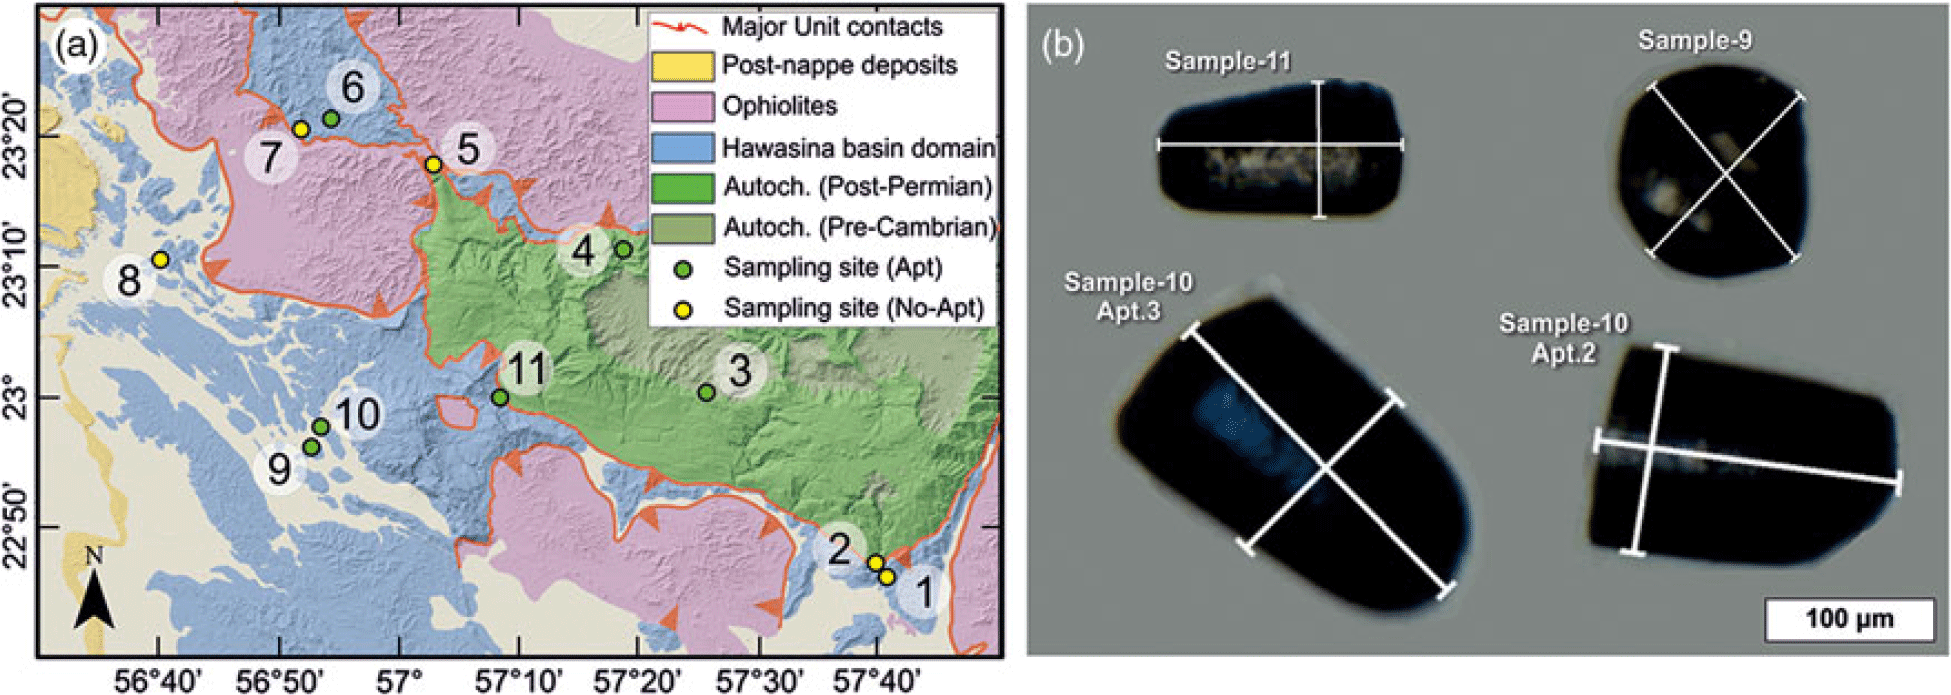
(a) Simplified geological map of the Al-Hajar Oman Mountain Belt. Locations of Figures 2, 3 and 8a are indicated. (b) Diagram showing the early-orogenic framework of the different Mesozoic domains. MU (Musandam), JA (Jabal Akhdar) and SH (Saih Hatat) are the three main tectonic windows exposing the Arabian Platform domain. S (Sumeini) and Q (Qumayrah) are half-windows, and H (Hawasina) is a tectonic window (slope and basin units are exposed). HD is the Hamrat Duru range.
In this work we couple structural investigations at the mountain front with a thermochronological study in the interior of the belt, in order to obtain a comprehensive picture integrating timing of exhumation of the substratum and post-nappe stratigraphy. Defining of long-term evolution of fold-and-thrust belts and associated foreland basins is in fact fundamental for the correct assessment of their potential for hydrocarbon exploration (e.g. Roure et al. Reference Roure, Andriessen, Callot, Faure, Ferket, Gonzales, Guilhaumou, Lacombe, Malandain, Sassi, Schneider, Swennen, Vilasi, Goffey, Craig, Needham and Scott2010). The very low closure temperature (55 °C < T c < 80 °C; Farley, Reference Farley2000) of the apatite (U–Th)/He (AHe) system makes this thermochronological method the most appropriate to unravel exhumation events throughout the upper 1–2 km of the crust, and therefore to correlate thermochronology with topography erosion and unroofing of the mountain belt and sedimentation in the foreland basin. Additionally, the interpretation of seismic reflection profiles at the belt–foredeep transition allows constraining style and timing of the major mountain-building stages during the second shortening pulse. These data are integrated with the outcomes of a field-based structural study and remote sensing analysis carried out on the post-nappe package exposed at the mountain front. This multidisciplinary approach is expected to reveal two sub-processes connected to mountain building. Thermochronology is in fact deciphering the uplift in the culmination areas, while structural data and seismic sections show what was occurring, coevally with uplift, in the frontal areas. Our results indicate a coherent late Eocene – Miocene stage of mountain building, whose understanding provides additional constraints on the structural evolution of the Oman Mountains and also has implications for the petroleum system.
2. Geological setting of the Al-Hajar Mountains
The Al-Hajar Mountains are a mountain range located along the eastern edge of the Arabian Platform, in NE Oman (Fig. 1a). This dominantly NW–SE-striking mountain range extends for more than 400 km, with an arched shape and a SW-oriented convexity. Two main shortening periods are generally considered to account for its uplift and present-day geometry. A first and best-constrained shortening event started during the Late Cretaceous, when the opening of the South Atlantic Ocean induced rotation of the Arabian–African plate and the onset of convergence in the South Tethyan Ocean. This convergence was probably initiated by an intra-oceanic NE-directed subduction (Robertson & Searle, Reference Robertson, Searle, Robertson, Searle and Ries1990; Searle et al. Reference Searle, Cherry, Ali and Cooper2014; van Hinsbergen et al. Reference Van Hinsbergen, Peters, Maffione, Spakman, Guilmette, Thieulot, Plümper, Gürer, Brouwer, Aldanmaz and Kaymakci2015; Jolivet et al. Reference Jolivet, Faccenna, Agard, Frizon de Lamotte, Menant, Sternai, Guillocheau and Polat2016), followed by continental subduction of the thinned leading edge of the Arabian continental margin, as documented by intense deformation and blueschist to eclogite facies metamorphism in the Saih Hatat tectonic window (Goffé et al. Reference Goffé, Michard, Kienast and Le Mer1988; Chemenda et al. Reference Chemenda, Mattauer and Bokun1996; Warren et al. Reference Warren, Parrish, Searle and Waters2003; Breton et al. Reference Breton, Béchennec, Le Métour, Moen-Maurel and Razin2004; Guilmette et al. Reference Guilmette, Smit, Hinsbergen, Van Gürer, Corfu, Charette, Maffione, Rabeau and Savard2018). These subduction processes led to the progressive SW-directed emplacement of allochthonous units (Sumeini slope deposits, Hawasina basin deposits and Haybi sedimentary and tectonic mélange complexes; Fig. 1) and of the Semail Ophiolite onto the Permo-Mesozoic continental passive margin of the Arabian Platform (Fig. 1b) (Glennie et al. Reference Glennie, Boeuf, Clarke, Moody-Stuart, Pilaar and Reinhardt1973; Béchennec et al. Reference Béchennec, Le Métour, Rabu, Villey and Beurrier1988; Cooper, Reference Cooper1988; Breton et al. Reference Breton, Béchennec, Le Métour, Moen-Maurel and Razin2004; Searle & Ali, Reference Searle and Ali2009).
During obduction of the Semail Ophiolite and advance of the allochthonous wedge, the foreland underwent SW-migrating flexural bending with uplift and erosion of the passive-margin megasequence, creating a forebulge unconformity (Boote et al. Reference Boote, Mou, Waite, Robertson, Searle and Ries1990; Robertson et al. Reference Robertson, Searle and Ries1990; Cooper et al. Reference Cooper, Ali, Searle, Rollinson, Searle, Abbasi, Al-Lazki and Al Kindi2014). Subsequently, syn-orogenic sedimentation began in the areas of peripheral bulge and backbulge (Glennie et al. Reference Glennie, Boeuf, Clarke, Moody-Stuart, Pilaar and Reinhardt1973; Robertson, Reference Robertson1987), followed by shallow-water sedimentation passing northeastward to a foredeep environment where deep-water clastic sediments accumulated (Robertson, Reference Robertson1988; Cooper et al. Reference Cooper, Ali, Searle, Rollinson, Searle, Abbasi, Al-Lazki and Al Kindi2014).
This first shortening episode and the related obduction were almost completed by early Maastrichtian time, when stable shelf conditions developed, as testified by the deposition of the Simsima Formation on top of the Qahlah fluvial conglomerates (Noweir & Alsharhan, Reference Noweir and Alsharhan2000; Abbasi et al. Reference Abbasi, Salad Hersi, Al-Harthy, Rollinson, Searle, Abbasi, Al-Lazki and Al Kindi2014). These latter conditions were most likely interrupted by a global eustatic sea-level fall at the end of the Maastrichtian (Searle, Reference Searle2007), as recorded by the unconformity on top of the Simsima Formation, before shallow-water limestone deposition was resumed during the late Palaeocene (Coleman, Reference Coleman1981; Nolan et al. Reference Nolan, Skelton, Clissold, Smewing, Robertson, Searle and Ries1990) and the Hadhramaut Group deposited throughout the Eocene (Fig. 2). After the obduction phase, a NE–SW-oriented extensional regime developed (Mann et al. Reference Mann, Hanna, Nolan, Mann, Hanna, Robertson, Searle and Ries1990; Fournier et al. Reference Fournier, Lepvrier, Razin and Jolivet2006; Storti et al. Reference Storti, Balsamo, Clemenzi, Mozafari, Al-Kindy, Solum, Swennen, Taberner and Tueckmantel2015; Grobe et al. Reference Grobe, Virgo, Von Hagke, Urai and Littke2018; Mattern & Scharf, Reference Mattern and Scharf2018) and exhumation of the high-pressure, low-temperature autochthon of Saih Hatat (Fig. 1) was achieved by a ductile extensional detachment (Goffé et al. Reference Goffé, Michard, Kienast and Le Mer1988; Michard et al. Reference Michard, Goffé, Saddiqi, Oberhänsli and Wendt1994; Searle et al. Reference Searle, Waters, Martin and Rex1994, Reference Searle, Warren, Waters and Parrish2004; Chemenda et al. Reference Chemenda, Mattauer and Bokun1996; Gregory et al. Reference Gregory, Gray and Miller1998; Searle & Cox, Reference Searle and Cox2002; Fournier et al. Reference Fournier, Lepvrier, Razin and Jolivet2006). Extensional NW–SE-striking fault systems developed in central Oman (Mann et al. Reference Mann, Hanna, Nolan, Mann, Hanna, Robertson, Searle and Ries1990; Fournier et al. Reference Fournier, Lepvrier, Razin and Jolivet2006; Al-Wardi & Butler, Reference Al-Wardi, Butler, Ries, Butler and Graham2007; Holland et al. Reference Holland, Urai, Muchez and Willemse2009; Virgo, Reference Virgo2015; Scharf et al. Reference Scharf, Mattern and Al-Sadi2016; Hansman et al. Reference Hansman, Albert, Gerdes and Ring2018; Mattern & Scharf, Reference Mattern and Scharf2018), and along the eastern edge of the Al-Hajar Mountains (e.g. in the Batinah Coastal Plain; Mann et al. Reference Mann, Hanna, Nolan, Mann, Hanna, Robertson, Searle and Ries1990). However, the frontal portion of the belt was poorly affected by this late orogenic extension event.
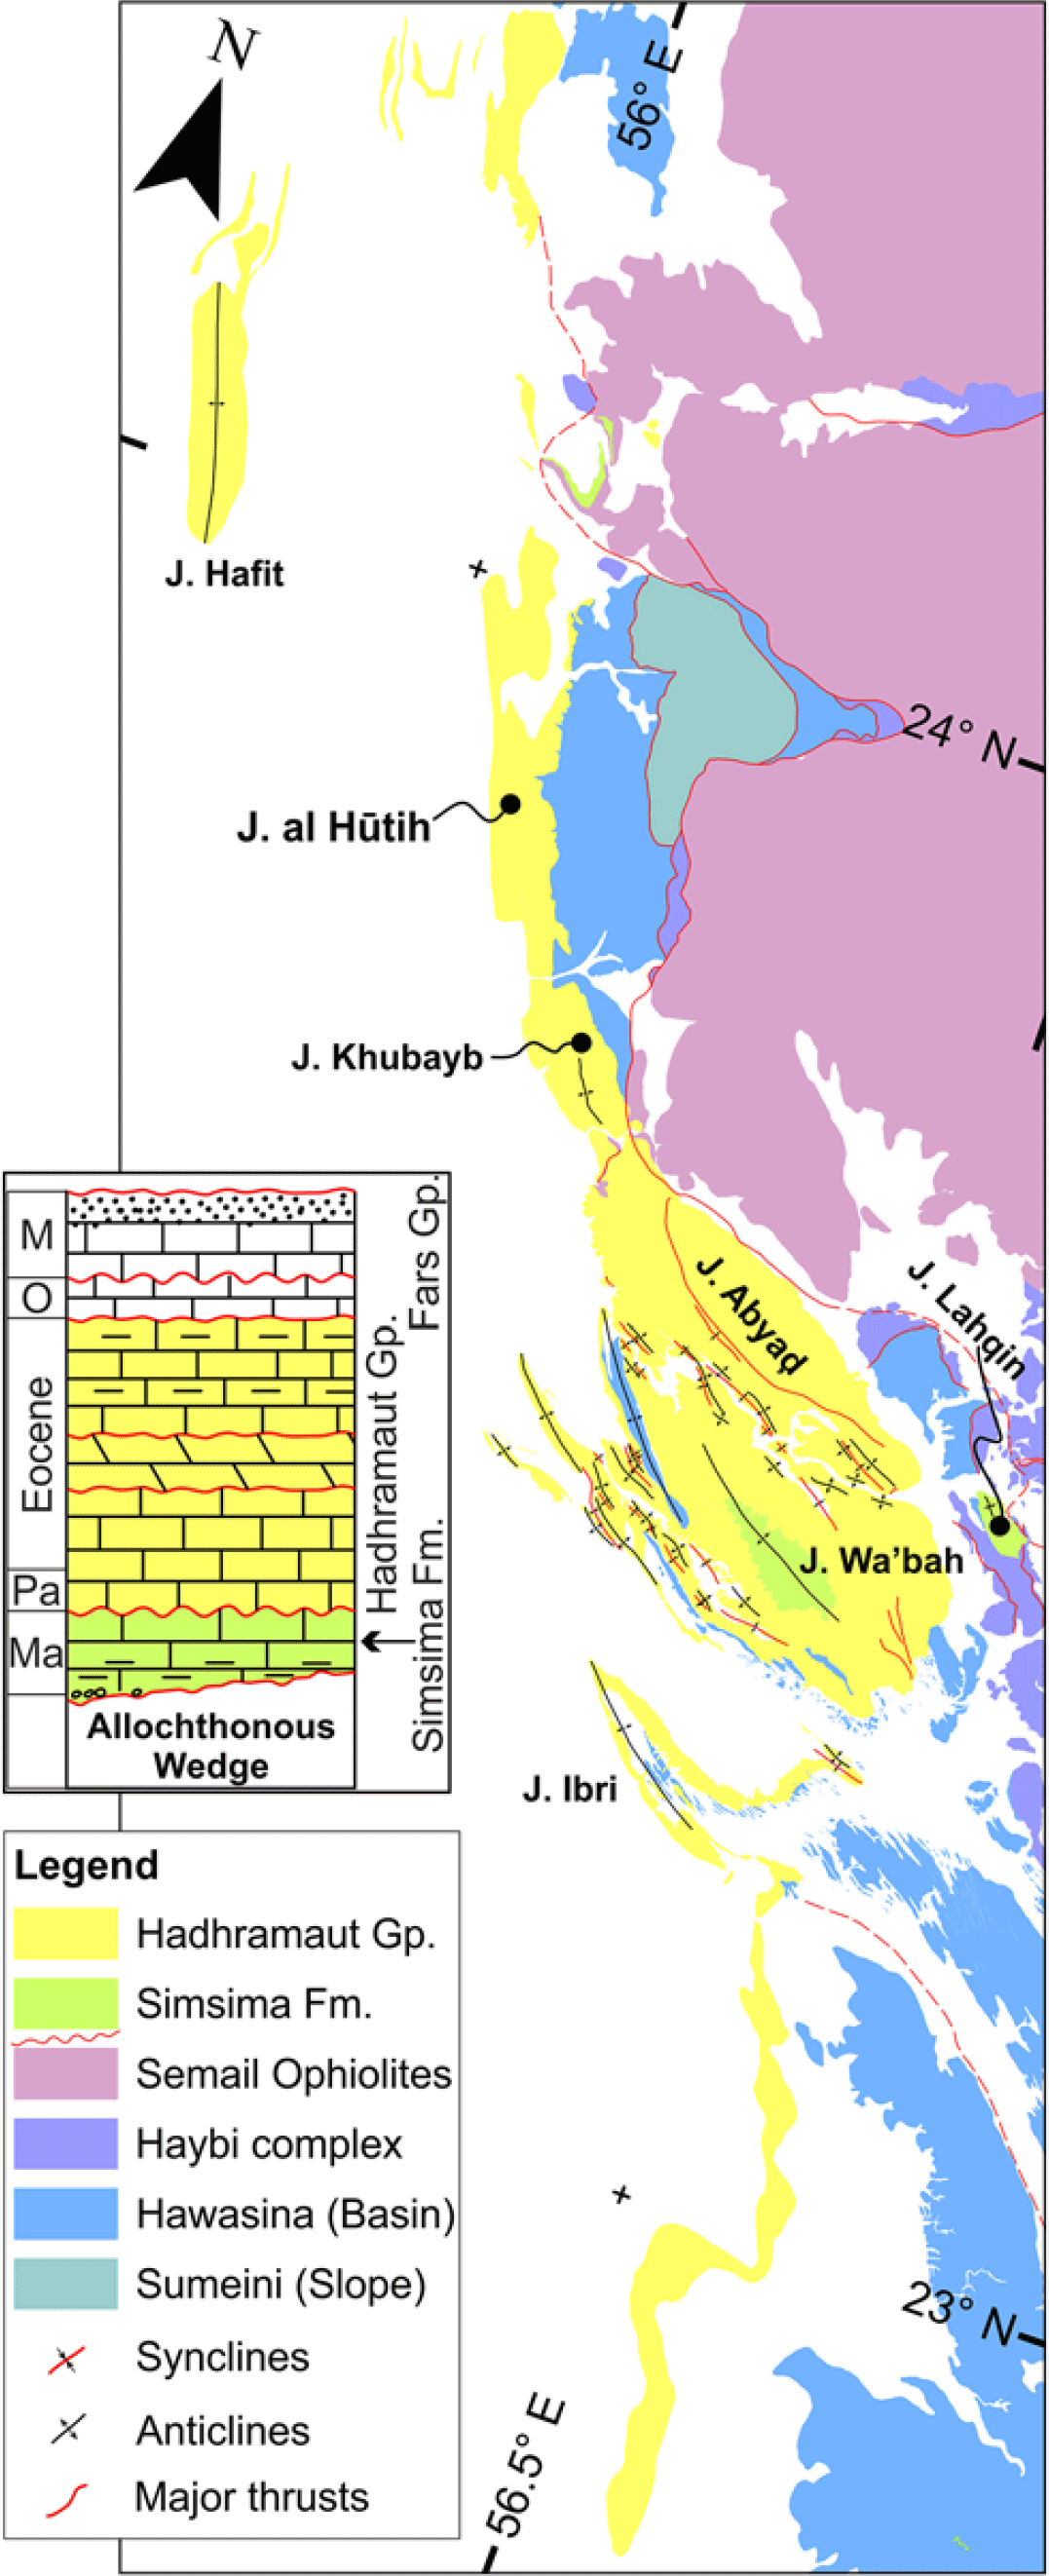
Geological map of the frontal area of the Central Al-Hajar Oman Mountains. Due to the scale of observation, folds are only indicated in the post-nappe units (Simsima and Hadhramaut Group).
A second shortening phase occurred during the Cenozoic and it is responsible for the deformation of the Late Cretaceous to Cenozoic post-nappe package and for the final uplift and doming of the culmination areas of the central Al-Hajar Mountains (Mount et al. Reference Mount, Crawford and Bergman1998; Breton et al. Reference Breton, Béchennec, Le Métour, Moen-Maurel and Razin2004; Csontos et al. Reference Csontos, Pocsai, Sasvári, Palotai, Árgyelán-Bagoly, Fodor, Magyari and Al-Wardi2010; Ali et al. Reference Ali, Cooper, Searle and Al-Lazki2014; Cooper et al. Reference Cooper, Ali, Searle, Rollinson, Searle, Abbasi, Al-Lazki and Al Kindi2014; Hansman et al. Reference Hansman, Ring, Thomson, Den Brok and Stübner2017). This uplift event was constrained by several thermochronological data (Mount et al. Reference Mount, Crawford and Bergman1998; Poupeau et al. Reference Poupeau, Saddiqi, Michard, Goffe and Oberhansli1998; Saddiqi et al. Reference Saddiqi, Michard, Goffe, Poupeau and Oberhänsli2006; Wübbeler et al. Reference Wübbeler, Von Hagke, Grobe, Nokar and Urai2015; Hansman et al. Reference Hansman, Ring, Thomson, Den Brok and Stübner2017; Grobe et al. Reference Grobe, Von Hagke, Littke, Dunkl, Wübbeler, Muchez and Urai2019) and absolute radiometric dating of veins (Grobe et al. Reference Grobe, Virgo, Von Hagke, Urai and Littke2018; Hansman et al. Reference Hansman, Albert, Gerdes and Ring2018) from the Jabal Akhdar and Saih Hatat tectonic windows and surrounding areas (Fig. 1a). Moreover, extensive fluid circulation during forebulge development, thrust emplacement and tectonic loading was described in the northern sector of the belt (Breesch, Reference Breesch2008; Breesch et al. Reference Breesch, Swennen, Vincent, Ellison and Dewever2010, Reference Breesch, Swennen, Dewever, Roure and Vincent2011; Callot et al. Reference Callot, Faure, Roure, Tarapoanca, AbuAli, Moretti and Nordgård Bolås2017). Despite this large amount of data, the timing and mode of exhumation of the main tectonic windows is still debated. Nevertheless, most recent interpretations point toward a rapid exhumation of the Jabal Akhdar Dome (Hansman et al. Reference Hansman, Ring, Thomson, Den Brok and Stübner2017; Grobe et al. Reference Grobe, Von Hagke, Littke, Dunkl, Wübbeler, Muchez and Urai2019) starting from the early Eocene.
3. Study area
Structural investigations were carried out along the mountain front in the central portion of the belt, where the post-nappe package is exposed (Fig. 2). Termochronological analysis was instead focused on samples collected in a more internal position of the belt.
The mountain front in the study area is characterized by a nearly NNW–SSE elongated ribbon of post-nappe sediments interposed between the foreland area (covered by Quaternary alluvial, slope and aeolian deposits) and the frontal portion of belt. The latter is characterized by an uppermost nappe, composed of the Semail Ophiolites, placed on top of a SW-verging thrust system deforming the Mesozoic sedimentary cover of the Arabian margin (including the Haybi Complex, the Hawasina Basin and the Sumeini Slope; Fig. 1b). The post-nappe layers unconformably cover these Mesozoic strata and, at a few places, the ophiolites. In detail, the older terms of the post-nappe succession belong to the Maastrichtian Qahlah and Simsima formations. However, though widely described along the frontal part of the belt to the north (e.g. Noweir & Alsharhan, Reference Noweir and Alsharhan2000; Searle & Ali, Reference Searle and Ali2009), in the study area the fluviatile to shallow-marine clastic sediments of the Qahlah Formation are missing (Rabu et al. Reference Rabu, Nehlig, Roger, Béchennec, Beurrier, LE Métour, Bourdillon Jeudy-De-Grissac, Tegyey, Chauvel, Cavelier, Al Azri, Juteau, Janjou, Lemière, Villey and Wyns1993) and the shallow-marine limestones of the Simsima Formation, which are widely exposed at the Jabal Wa’bah area and at Jabal Lahqin (Fig. 2), lie directly on top of the nappes. The thickness of the Simsima Formation is also very variable, passing from the thickest section at Jabal Lahqin (with more than 250 m) to absent at Jabal Ibri (Rabu et al. Reference Rabu, Nehlig, Roger, Béchennec, Beurrier, LE Métour, Bourdillon Jeudy-De-Grissac, Tegyey, Chauvel, Cavelier, Al Azri, Juteau, Janjou, Lemière, Villey and Wyns1993 and references therein). Above a regional unconformity, the overlying strata of the Palaeocene–Eocene Hadhramaut Group are widely exposed and mostly rest on top of the Mesozoic Hawasina Basin, where the Simsima Formation is either not preserved or not deposited. The overlying Oligo-Miocene strata are instead poorly outcropping in the area. These are only exposed in the northern sector of the belt, as it occurs on the flanks of the Jabal Hafit anticline (Hansman & Ring, Reference Hansman and Ring2018 and references therein), and are mostly found in exploration wells.
3.a. Seismic sections
Seismic sections crossing the mountain front allow constraints to be set on the timing of deformation (Fig. 3). In the southern section (Fig. 3a), the Pre-Cambrian to Cretaceous layers of the autochthonous domain are gently NE-dipping. They are well imaged in the SW portion of the section, where they are overlain by the post-nappe succession, whereas to the NE they are in the footwall of the allochthonous wedge. This wedge forms a triangularly shaped area (Aldega et al. Reference Aldega, Carminati, Scharf, Mattern and Al-Wardi2017) delimited upward by an erosional unconformity. The Aruma Group seals both the allochthonous wedge and the autochthonous sedimentary sequence, and the entire post-nappe is coherently folded to form a 50 km wide gentle syncline, with 2–5 km wavelength folds affecting the Hadhramaut Group in the NE portion of the section. Flattening of the seismic line at the top of the Hadhramaut Group (Fig. 3b) shows how the first foredeep was almost completely sealed by the Aruma Group. The top of the Aruma Group and the top of the Hadhramaut Group are only very slightly (<2° in our vertically exaggerated representation) oblique to each other. The Oligo-Miocene sequence is instead characterized by a marked southwestward thinning, revealing that flexural subsidence during the Oligo-Miocene interval was already going on. Such a two-stage flexuring of the foredeep is illustrated in the inset of Figure 3b, where the approximate age of reflectors is plotted vs the angle that each reflector forms with the top Miocene layer (computed on the vertically exaggerated flattened seismic line in Fig. 3b). The graph shows the occurrence of a progressive decrease of the angle between 100 and 65 Ma, followed by a period during which the angle was constant, between 65 and 45 Ma, and a second decreasing period between 45 and 10 Ma. These three stages correspond to: (i) a first period of flexural subsidence and foredeep infill; (ii) a tectonically quiescent period during which no differential subsidence occurred; (iii) a renewed flexural subsidence, corresponding to a second foredeep stage, which started at c. 45 Ma, i.e. during the late Eocene.
(a) Line drawing of a seismic image in time domain (see Fig. 1 for location) showing the allochthonous wedge (made by slope to Hawasina’s basin deposits and ophiolites) thrusted onto the autochthonous Arabian platform. The post-nappe Palaeocene Eocene Hadhramaut Group succession blanketed the wedge and the Autochthonous prior to further uplift that resulted in the folding of the post-nappe units. (b) Line-drawing interpretation flattened at the level of around-top Hadhramaut Group, and inset showing inclination variation through time of several reflectors as resulting at the scale of Figure Fig. 3b. (c) Line drawing of a seismic image located in front of Jabal Sumeini half-window (see Fig. Fig. 1 for location) showing an imbricated stack wedge reactivated during Oligo-Miocene time, and (d) line-drawing interpretation of the southwestern part flattened at the level of around-top Hadhramaut Group.
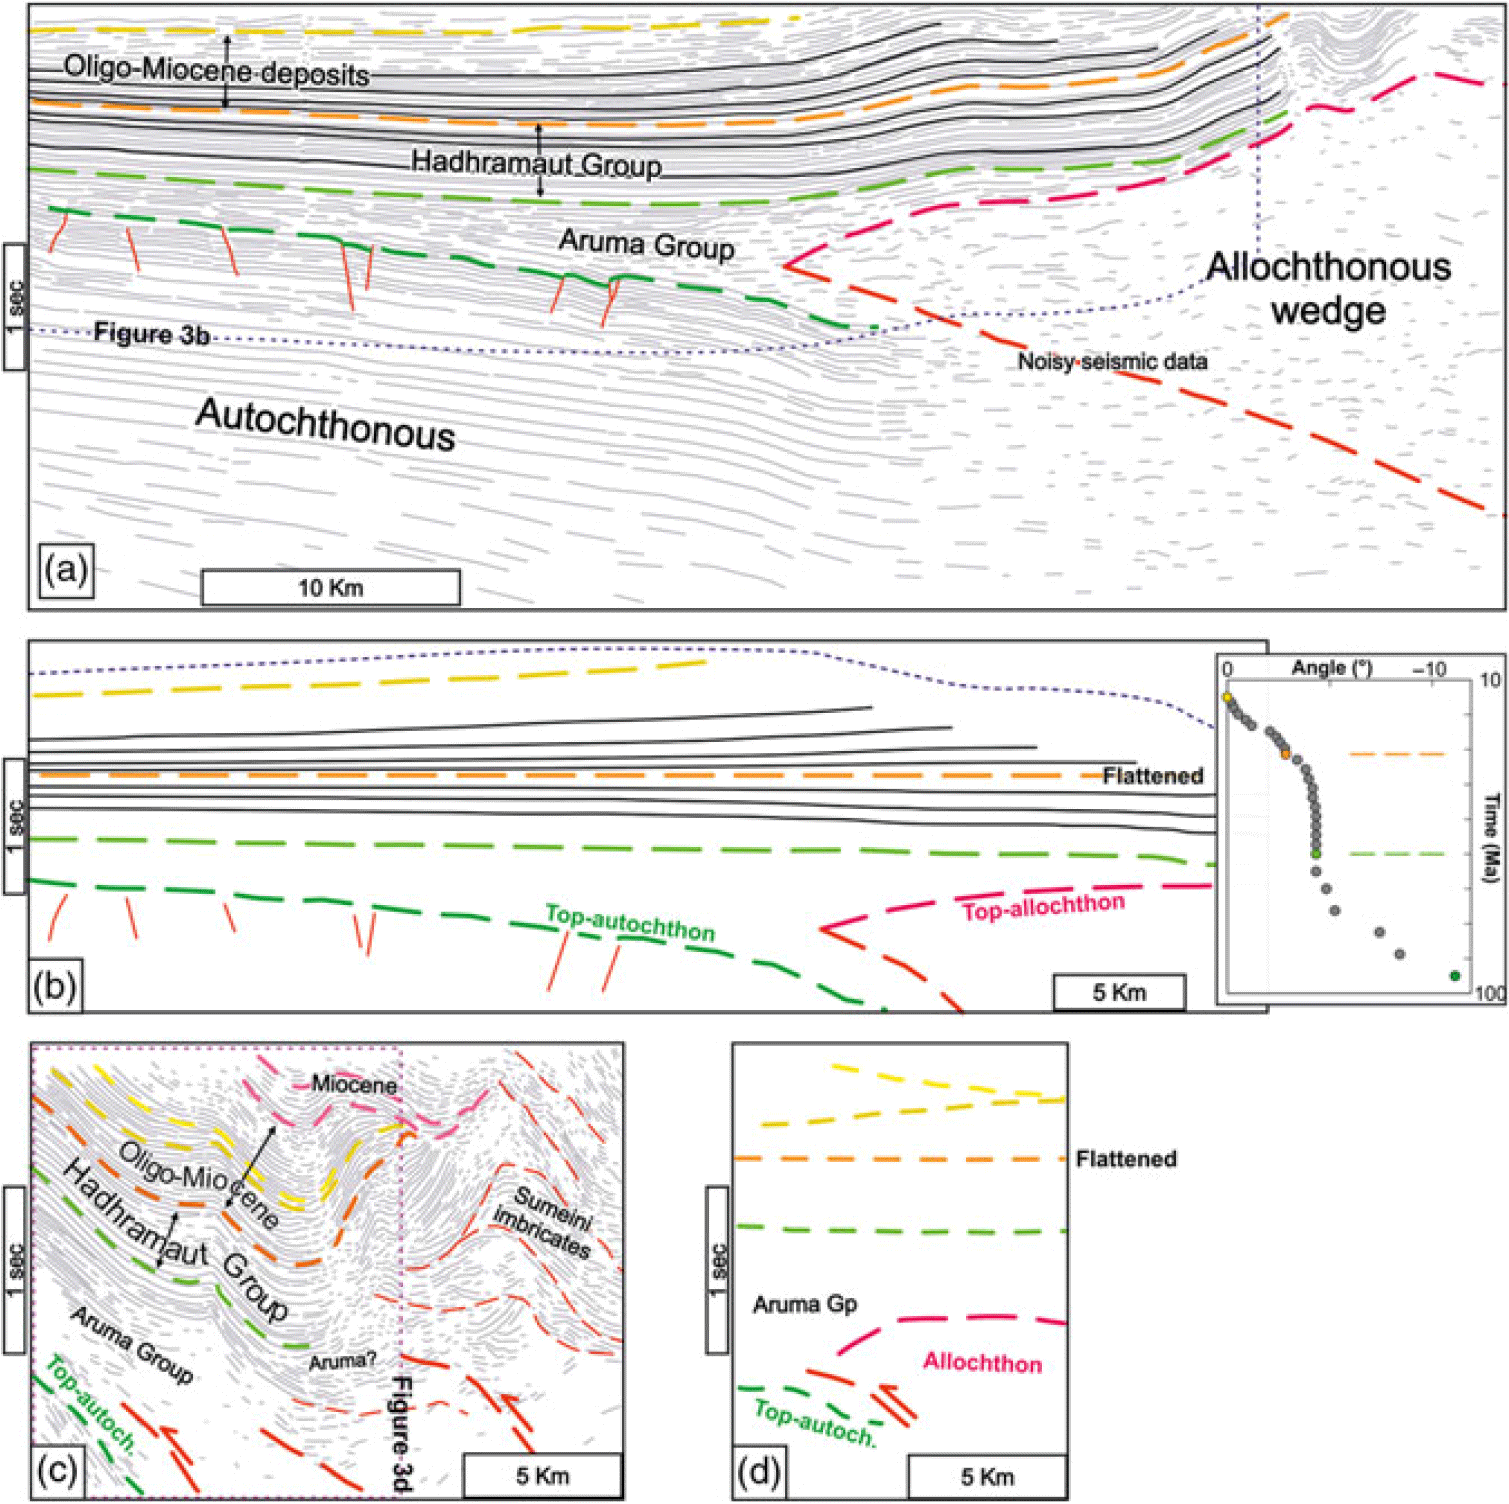
The seismic section to the north (Fig. 3c) displays a slightly more internal (and deformed) portion of the foreland. In the western portion of the line, layers of the Autochthonous units, Aruma Group, Hadhramaut Group and Oligocene units are nearly parallel and NE-dipping. In the central and NE portion of the line, by contrast, the Aruma and Hadhramaut groups unconformably overlie the allochthonous nappes, and are folded and uplifted. The lower portion of the Fars Group is coherently folded with the underlying Hadhramaut Group, and is unconformably overlain by Miocene strata. The unconformity dates the onset of folding at the Miocene. However, reactivation of the allochthonous wedge is older, as shown in the flattened seismic line-drawing (Fig. 3d). Flattening at the top of the Hadhramaut shows a geometry similar to that observed to the south, with the top and the base of the Hadhramaut Group being only slightly oblique to each other, and the Oligocene package thickening toward the NE. This indicates again that renewal of flexural subsidence started before the Oligocene. The flattened seismic line-drawing also shows that the uppermost portion of the Oligo-Miocene package is NE-thinning. Although this portion of the multilayer rests below the major Miocene unconformity seen in this section, the northeastward thinning points to a generalized Oligo-Miocene uplift of the allochthonous wedge, followed by Miocene folding and thrusting.
3.b. Structural data
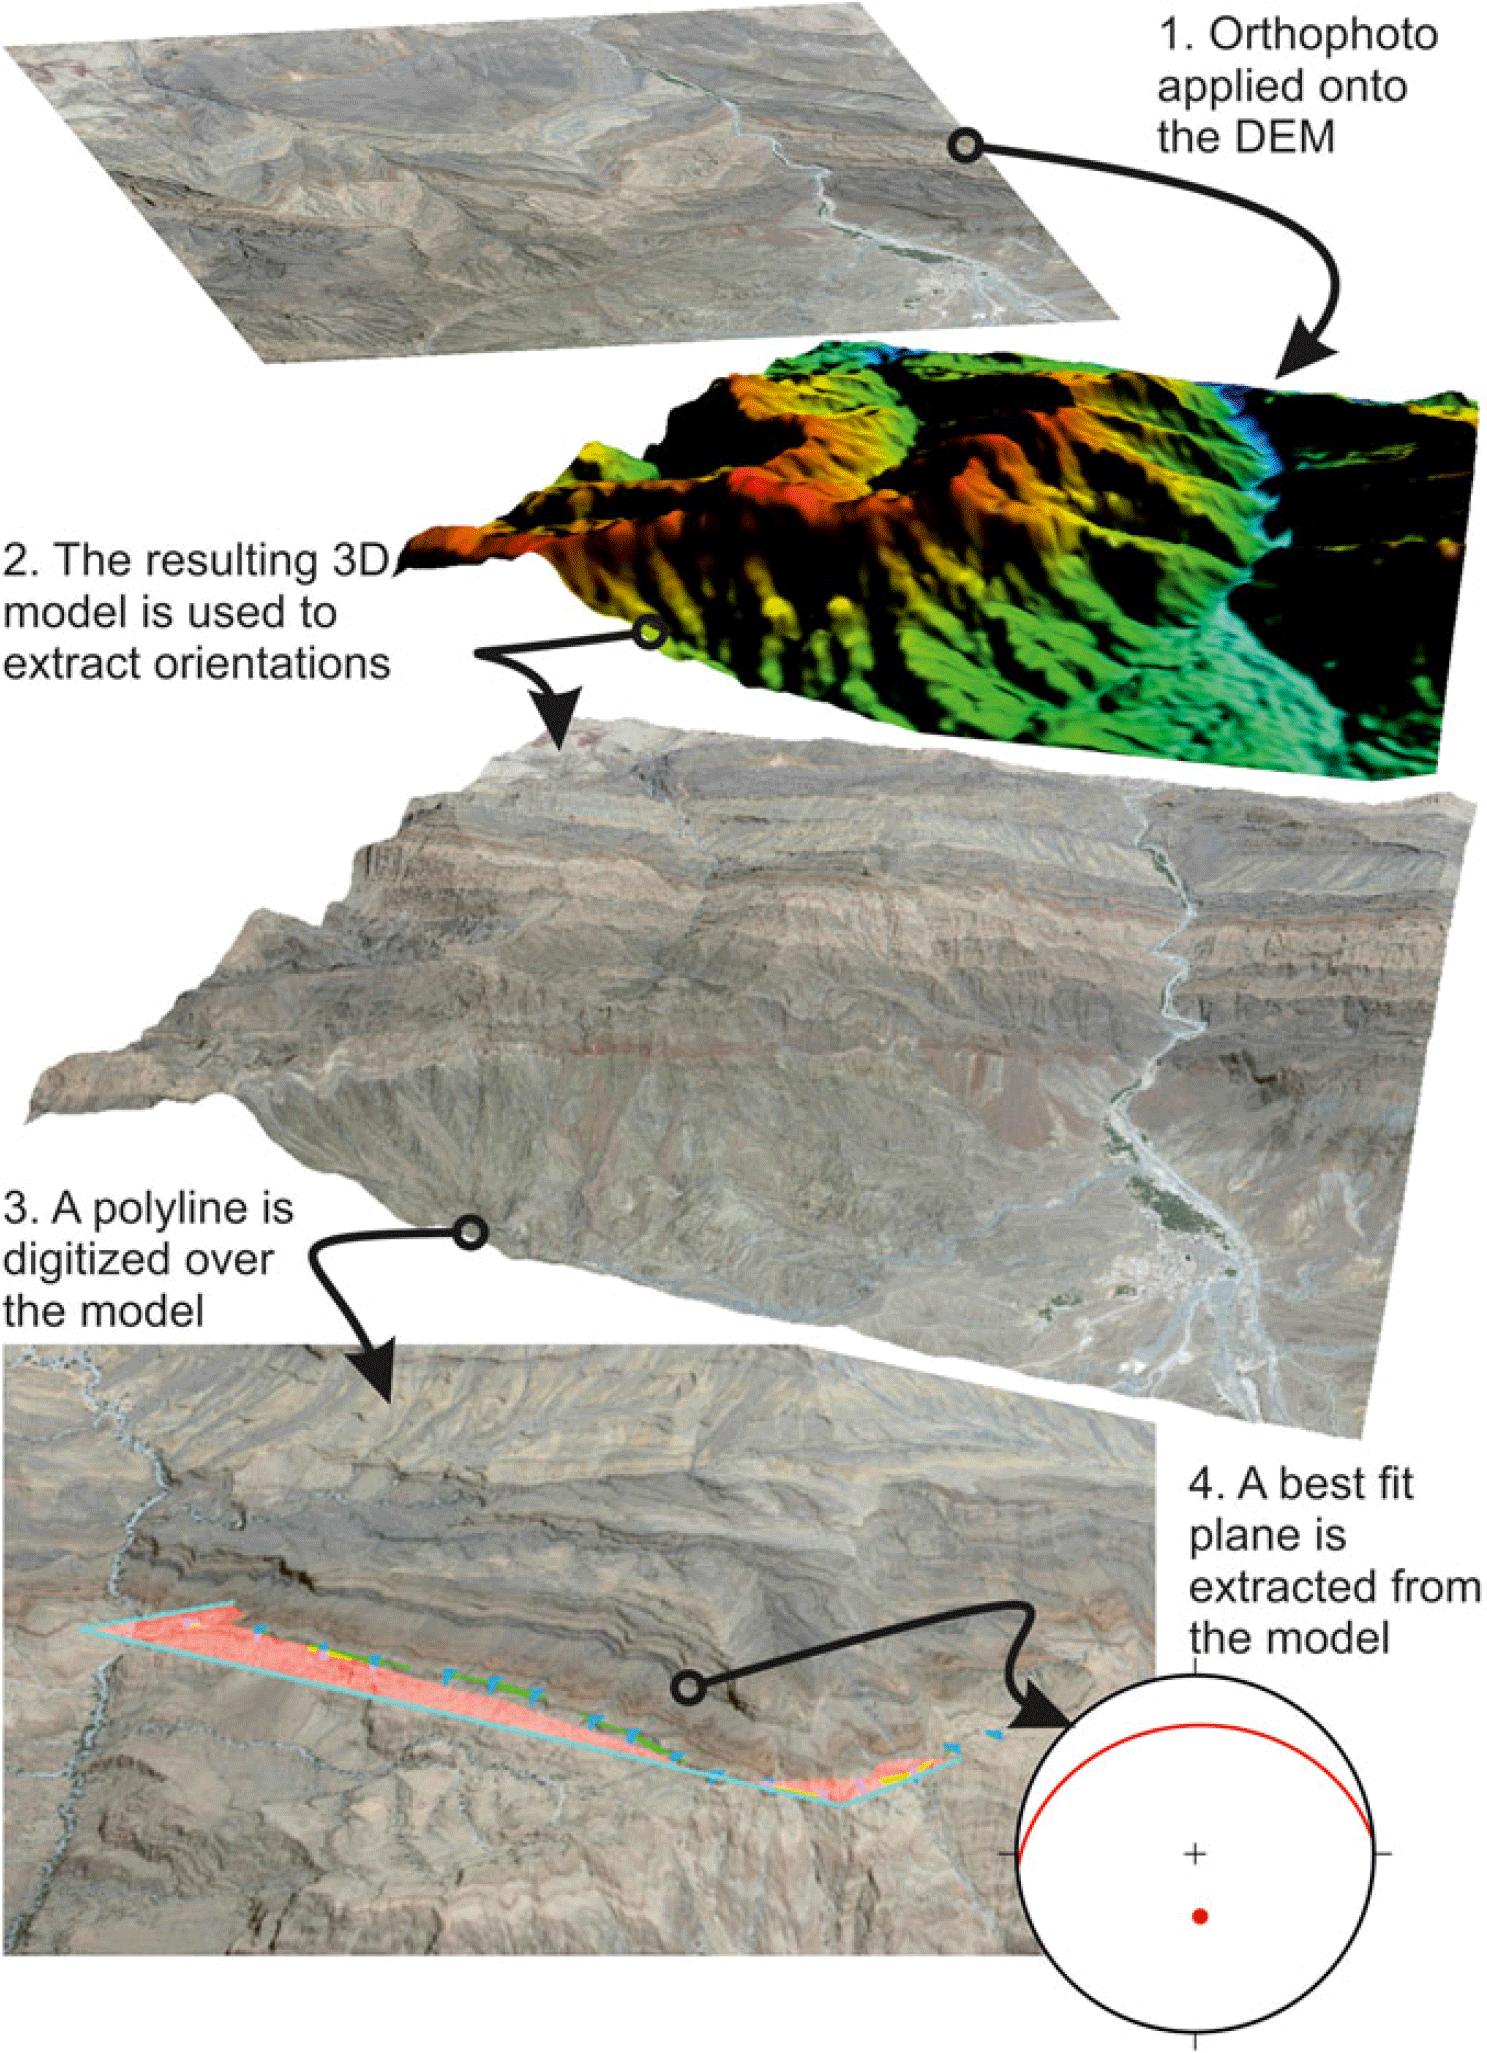
Attitudes of bedding surfaces were acquired by two different methods. A preliminary remote sensing approach (Fig. 4) was employed using the software Openplot (Tavani et al. Reference Tavani, Arbues, Snidero, Carrera and Muñoz2011). Data extraction was obtained by the best fit of polylines drawn over three-dimensional objects (e.g. Fernández et al. Reference Fernández, Jones, Armstrong, Johnson, Ravaglia and Muñoz2009). Three-dimensional objects for data extraction were derived draping 2D images (i.e. aerial imageries and geological maps) over the ASTER Global DEM v2 (30 m x–y resolution, provided by the US Geological Survey at https://gdex.cr.usgs.gov/gdex/). A selection of the resultant best-fit planes was made in real time (e.g. Corradetti et al. Reference Corradetti, Tavani, Russo, Arbués and Granado2017, Reference Corradetti, Tavani, Parente, Iannace, Vinci, Pirmez, Torrieri, Giorgioni, Pignalosa and Mazzoli2018) to discard those planes affected by rough error. For instance, typical sources of error were the low resolution of the model or the colinearity of the digitized polylines (e.g. Fernández et al. Reference Fernández, Jones, Armstrong, Johnson, Ravaglia and Muñoz2009; Jones et al. Reference Jones, Pearce, Jacquemyn and Watson2016; Seers & Hodgetts, Reference Seers and Hodgetts2016). More than 700 bedding attitudes were extracted in this way. Approximately 300 further bedding attitude data were collected in the field, together with mesoscale fault and fold data.
Workflow followed for the data extraction from 3D models. The model is created draping an orthophoto (1) over a DEM (2). From the resulting 3D model (3) a polyline is digitized in OpenPlot software and a best-fit plane corresponding to the attitude of the bedding automatically calculated and eventually accepted (4) by the user.
Faults, small-scale folds and bedding data from the post-nappe sedimentary succession were acquired in the frontal portion of the belt, in the area of Figure 2. The regional trend of map-scale folds involving the Hadhramaut Group in this area slightly changes from north to south, being c. 155° in the Jabal Hafit structure to the north, and c. 130° toward the south (Fig. 2). This gentle change mimics the arcuate shape of the Al-Hajar Mountains. Both the remotely sensed bedding attitude and the bedding collected in the field from the post-nappe show a positive overlap and display a poles distribution along a N49°-striking plane (Fig. 5a, b). Bedding attitude and fold data were also collected from the three main tectonic windows into the slope and basin deposits (H, S and Q in Fig. 1) and in the Hamrat Duru range (HD in Fig. 1) for direct comparison with Cenozoic deformation affecting the post-nappe sedimentary units. The cumulative contour plot of fold hinges collected from these structural domains shows a maximum corresponding to folds having sub-horizontal axes trending N125° (Fig. 5c). In detail, the contour plot of poles to bedding from the Hamrat Duru range to the south (Fig. 2) shows a well-clustered distribution of poles, which are aligned along a N41°-striking vertical plane (Fig. 5d). In the Hawasina window, poles to beddings are still well distributed along a NE–SW direction (Fig. 5e). To the north, in the Sumeini and Qumayrah windows, the distribution of poles to bedding is slightly rotated and distributed along an ENE–WSW direction. The spread of structural data in these latter two windows (Fig. 5f, g) is likely due to limited fold cylindricity – and related sampling bias – associated with the abundance of periclinal closures at measurement sites located along main road cuts. Overall, poles to bedding in the Cretaceous nappes follow the regional trend of the post-nappe succession, which in turn follows the arcuate shape of the belt.
(a) Poles to bedding collected in the post-nappe Upper Campanian – Maastrichtian Simsima Formation (Aruma Group) and Palaeocene–Eocene Hadhramaut Group from remote sensing in Openplot (red dots) and from direct field acquisition (blue dots). (b) Cumulative density contour of poles to bedding in the post-nappe succession. (c) Cumulative density contour of fold hinges collected from Sumeini (slope) and Hawasina (basin) units from the different windows. (d–g) Cumulative density contour of poles to bedding in the Hamrat Duru, Hawasina, Qumayrah and Sumeini windows. Here and in the following, plots are in lower hemisphere, equal-area projection. DN is the number of observations and CI is the contour interval.

Unlike the Cretaceous nappes, the post-nappe package is characterized by the remarkable absence of far-travelled thrust sheets. The most important deformation structures, both at the seismic and outcrop scales, are folds. Reverse faults occur mostly as accommodation structures associated with folds, being thus a hierarchically lower-order structure. In the post-nappe succession, folds occur at various scales and show wavelengths ranging from a few kilometres down to centimetres. The outcrop-scale folds (i.e. 10 cm < wavelength < 100 m) have NW–SE-trending axes and span from open to almost isoclinal (Fig. 6). Many folds have near-vertical axial surfaces (Fig. 6a), while others display hinterlandward dipping axial surfaces (Fig. 6b, c) consistent with the vergence of the fold-and-thrust belt. The well-bedded nature of the post-nappe carbonates promoted flexural-slip folding, sometimes of disharmonic type (Fig. 6a, b). The intersection of conjugate reverse fault sets is generally parallel to the fold axes (Fig. 6a–e), thus suggesting a coeval development during the same shortening event, although superposed N–S-oriented striae and shear fibres were locally observed postdating the SW–NE-oriented ones. Post-nappe layers also hold a set of conjugate strike-slip faults (Fig. 7). Their dihedral angle is nearly 60° and they are found both in sub-horizontal strata (Fig. 7a) and in near-vertical strata (Fig. 7b), where they are tilted together with the beds. In both cases, the acute bisector of the conjugate system strikes nearly NE–SW, in agreement with the shortening direction provided by folds and thrusts.
Examples of disharmonic detachment folding. (a) Folded strata in the Hadhramaut Group in Jabal Wa’bah showing only minor faulting (23° 30′ 21.1″ N, 56° 26′ 43.0″ E). (b) Box fold along the same axial direction of the previous fold (23° 30′ 39.8″ N, 56° 25′ 59.5″ E); stereoplot shows cumulative data for (a) and (b). (c) Larger-scale box folds within the post-nappe succession (23° 30′ 13.9″ N 56° 28′ 52.0″ E). (d) Large-scale SW vergent folds at Jabal Ibri (23° 19′ 33.4″ N 56° 31′ 27.0″ E). (e) Reverse faults within the Hadhramaut Group involving the allochthonous wedge (23° 22′ 30.47″ N, 56° 24′ 50.48″ E).

Examples of pre-folding layer-parallel shortening. (a) Bedding-perpendicular, soft-sediment, strike-slip deformation bands at Jabal Ibri (23° 15′ 37.02″ N, 56° 25′ 12.40″ E). (b) Bedding-perpendicular strike-slip faults (normal faults in present-day attitude) at about 60° to each other in subvertical Eocene strata at Jabal al Hūtih (23° 54′ 11.27″ N, 56° 3′ 23.55″ E).

3.c. Low-temperature thermochronometry
New AHe data were obtained in this study. Helium is produced by the decay of U in a time-dependent function (Hourigan et al. Reference Hourigan, Reiners and Brandon2005). The closure temperature for He in apatite is between 80 °C and 55 °C (Farley, Reference Farley2000). Considering a standard geothermal gradient of 25–30 °C km−1, and an average surface temperature of c. 30 °C (at present-day latitude), AHe cooling ages record the time when a rock sample passed through the depth between c. 1 and 2 km.
Eleven rock samples were collected (Fig. 8a) in siliciclastic rocks from different structural domains of the mountain belt for AHe analysis. In detail, seven samples were collected from the upper Matbat Formation (Jurassic) of the Hamrat Duru Group of the Hawasina Basin, two from the syn-tectonic Muti Formation of the Aruma Group, one from the quartzitic member of the autochthonous Jurassic Sahtan Group and one from a quartzitic level in Precambrian autochthonous. Samples were prepared at Géosciences Environnement Toulouse (GET), and He was analysed at Géosciences Montpellier. Extracted apatite grains presented mostly rounded shapes related to abrasion (Fig. 8b). Several samples did not furnish apatite crystals, or have crystals of quality (due to inclusions) suitable for AHe analysis (Table 1). These samples were anyway included in Table 1, in order to provide information on the likelihood of finding well-preserved apatites from different lithostratigraphic units.
(a) Locality sampled for (U–Th)/He dating of apatite crystals. Samples that yielded apatite crystals are marked in green, those that did not furnish any are shown in yellow. Sample numbers are circled (see Table 1 for cooling ages). (b) Examples of apatite crystals extracted from the collected samples. Crystals present rounded shapes due to transport and abrasion.
Apatite (U–Th)/He data (refer to text for explanation). Collected samples not yielding apatite crystals are included in order to provide a likelihood of finding apatite grains based on sampled lithostratigraphic units. The grain size is given by d1 and d2 that are the long and short axis of the apatite grains, respectively

AHe ages were obtained on carefully selected apatite grains with a minimum width of 60 μm, which have been measured along the two axes on two faces (each sample aliquot for He, U and Th determinations typically comprises apatite grains ~80–310 μm long and ~60–130 μm wide). The grains were placed on a platinum tube and heat at 1050 °C for 5 min with a diode laser. Evolved helium was spiked with 3He and purified, and the 4He/3He ratio determined by quadrupole mass spectrometry after quantitative He degassing of apatite. Grains were retrieved from the vacuum system, dissolved in HNO3 for apatite, spiked with 230Th, 235U, and analysed for U and Th by inductively coupled plasma mass spectrometry. Helium ages were corrected for alpha ejection effects FT (Farley et al. Reference Farley, Wolf and Silver1996) based on grain dimensions determined using the Monte Carlo simulation technique of Ketcham et al. (Reference Ketcham, Gautheron and Tassan-Got2011) and equivalent-sphere radius with the procedure of Gautheron & Tassan-Got (Reference Gautheron and Tassan-Got2010). Each age typically comprises one to four replicates, and many have only one grain. The estimated analytical uncertainty for He ages based on age standards is c. 7 % for Durango apatite (2σ).
The Matbat Formation was the most sampled lithology (samples 1, 6–11 in Fig. 8a and Table 1). Four out of seven samples yielded at least one apatite crystal of adequate quality for the analysis. One of these samples (sample no. 10 in the Hamrat Duru range) was particularly suitable for the analysis, with four apatite crystals providing a mean radiometric age of 20.1 ± 2.5 Ma. Sample no. 6 (in the Hawasina window) yielded two crystals with a mean cooling age of 15.3 ± 1.4 Ma. Two samples (nos. 9 and 11) yielded one crystal each, with ages of 42 ± 3 and 38.2 ± 2.7 Ma respectively.
Two crystals were found from sample no. 3, collected from sandstone strata within the Pre-Permian stratigraphic sequence (Fig. 8a). According to the BRGM (Bureau de recherches geologiques et minières, France) geological maps (Béchennec et al. Reference Béchennec, Roger, Le Metour and Wyns1992), this locality is mapped as Mu’aydin Formation, where sandstones are expected at the contact with the underlying Hajir Formation. These crystals gave dissimilar radiometric ages of 42.3 ± 3.0 Ma and 17.3 ± 1.2 Ma that could be explained by a partial reset of the system or by issues related to: (i) undetected inclusions, (ii) specific composition of apatite such as Cl content of high eU concentration (Gautheron et al. Reference Gautheron, Barbarand, Ketcham, Tassan-Got, Van Der Beek, Pagel, Pinna-Jamme, Couffignal and Fialin2013; Murray et al. Reference Murray, Orme and Reiners2014; Recanati et al. Reference Recanati, Gautheron, Barbarand, Missenard, Pinna-Jamme, Tassan-Got, Carter, Douville, Bordier, Pagel and Gallagher2017) and/or (iii) broken grains (difficult to notice since grains are rounded; Brown et al. Reference Brown, Beucher, Roper, Persano, Stuart and Fitzgerald2013). Both ages are anyway in the range of previous observations made in other localities for the Jabal Akhdar culmination, where single-grain ages have shown values ranging between 39 ± 2 Ma and 10 ± 1 Ma (e.g. Hansman et al. Reference Hansman, Ring, Thomson, Den Brok and Stübner2017; Grobe et al. Reference Grobe, Von Hagke, Littke, Dunkl, Wübbeler, Muchez and Urai2019).
Only one crystal, with a cooling age of 24.3 ± 1.7 Ma, was found in sandstones of the Sahtan Group, of Jurassic age in Wadi Sahtan. No apatite crystals were found within the syn-tectonic Muti Formation in the two sampled localities (Fig. 8a).
4. Discussion
The internal geometry of the allochthonous wedge is mainly characterized by the contraposition of highly deformed thrust-bounded units of the Haybi complex units and the regularly spaced thrust imbricates and short-wavelength thrust-related folds of the Hamrat Duru range (Searle & Cooper, Reference Searle and Cooper1986; Cooper, Reference Cooper1989; Robertson & Searle, Reference Robertson, Searle, Robertson, Searle and Ries1990). In contrast, the post-nappe succession is mainly affected by long-wavelength folds, and short-wavelength folds occur only locally. Small-displacement (i.e. <10 m) thrusts occur predominantly as accommodation structures related to folding (e.g. in fold cores), or as pre-buckle thrusts (Ramsay & Huber, Reference Ramsay and Huber1987). Major-displacement (i.e. >100 m) thrusts can instead be observed in areas near the frontal region of Jabal Wa’bah, where the underlying units of the wedge are also involved in late-stage deformation and are locally thrusted on top of the post-nappe sedimentary succession (Fig. 6e). The unconformity between the post-nappe succession and the underlying allochthonous wedge is mainly exposed along the frontal area of Jabal Wa’bah, at the northeastern edge of Jabal Abyad, along the axial zone of the Jabal Ibri anticline, at the edges of the Jabal Lahgin syncline, and in the northeastern edges of Habal al Hūtih and Jabal Khubayb (Fig. 2). The strata below the unconformity are always altered and eroded (Searle & Ali, Reference Searle and Ali2009). In most places, strata below the unconformity are steeply dipping or/and intensely folded, whereas the overlying strata are parallel to the unconformity. No evidence of relevant shear was recorded within the unconformity in any of the localities investigated. The unconformity thus appears as a mostly welded contact. The short-wavelength folds observed in the post-nappe sequence (Fig. 6) are mainly detached within the well-layered levels of the post-nappe package, as shown by the box fold of Figure 6b. The long-wavelength folds which affect the post-nappe sequence and its basal unconformity, instead, require the involvement of the allochthonous units.
Seismic sections illustrated in Figure 3 indicate the occurrence of two overlapping foredeeps in the area: a Late Cretaceous one and an Eocene–Miocene one. The first foredeep developed ahead of the Upper Cretaceous belt, and its syn-orogenic infill is the lower portion of the Aruma Group (Fig. 9a), i.e. the late Coniacian–Santonian Muti Formation and the Campanian Fiqa Formation (Robertson, Reference Robertson1988; Boote et al. Reference Boote, Mou, Waite, Robertson, Searle and Ries1990; Warburton et al. Reference Warburton, Burnhill, Graham, Isaac, Robertson, Searle and Ries1990). Starting from the Maastrichtian, a period of tectonic quiescence was established. The belt was progressively eroded and the foredeep was contextually filled by the upper portion of the Aruma Group and subsequently by the upper-Palaeocene – Eocene Hadhramaut Group, these groups being separated by a regional unconformity. In more detail, the foredeep was almost completely filled at the end of the Maastrichtian, and the overlying Hadhramaut Group deposited in a basin where no differential subsidence was occurring (Fig. 9b). Renewal of differential subsidence started during the late Eocene, with the deposition of the upper portion of the Hadhramaut Group (Fig. 9c), as imaged by the flattened seismic section interpretations and inset shown in Figure 3.
Cartoon showing the two-dimensional tectonic evolution of the study area. (a) Foredeep development ahead of the advancing wedge with syn-orogenic latest Cretaceous infill. (b) Stable shelf conditions developed over an erosive surface on top of the wedge since the Maastrichtian and lasted through the deposition of the upper-Palaeocene – Eocene Hadhramaut Group. During the late Eocene renewal of differential subsidence signified the onset of a new foredeep (c). (d) Between Oligocene and Miocene time the direction of the pinch-out changed as a consequence of an almost rigid tilting on top of the wedge. (e) Folding of the post-nappe layers at the mountain front is late-stage and occurred during the late Miocene.
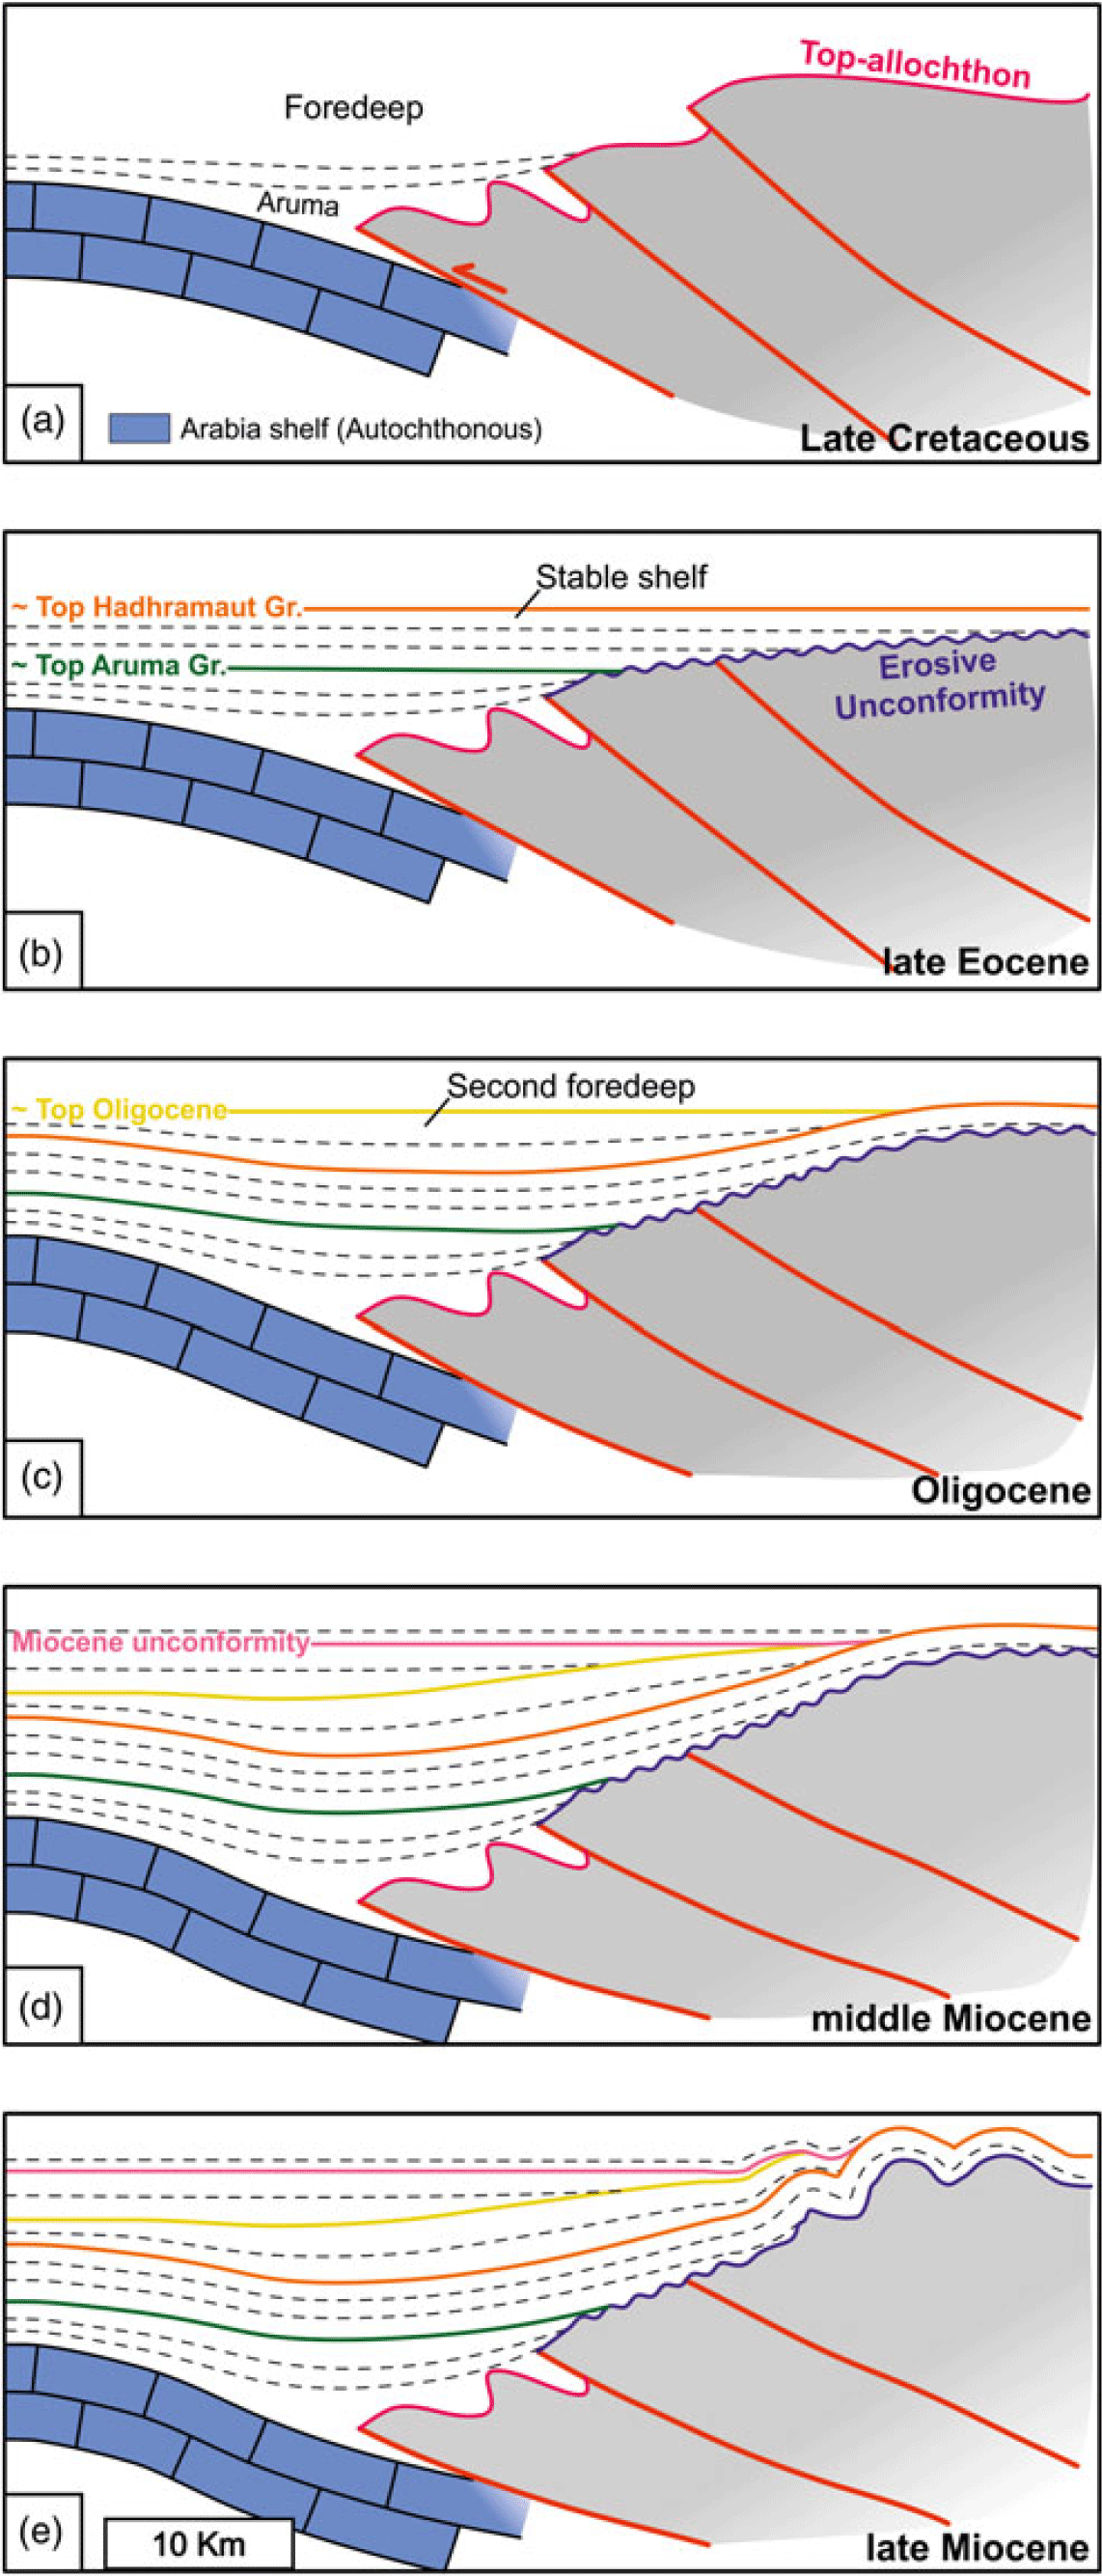
Recent thermochronology studies using multiple thermochronometric systems (e.g. Hansman et al. Reference Hansman, Ring, Thomson, Den Brok and Stübner2017 and references therein) point out how central Oman orogeny developed during the late Eocene and middle Miocene. Two main exhumation stages are recognized at 45–40 Ma (Tarapoanca et al. Reference Tarapoanca, Andriessen, Broto, Chérel, Ellouz-Zimmermann, Faure, Jardin, Naville and Roure2010; Jacobs et al. Reference Jacobs, Thomas, Ksienzyk and Dunkl2015) and at 20–15 Ma (Jacobs et al. Reference Jacobs, Thomas, Ksienzyk and Dunkl2015). An older exhumation phase involved the Jabal Akhdar culmination at 64 ± 4 Ma (Grobe et al. Reference Grobe, Virgo, Von Hagke, Urai and Littke2018) and was associated with top-to-NNE, post-obduction extensional shear zones that did not affect the frontal part of the belt. AHe cooling ages obtained in this study fall into two main clusters, at c. 42 Ma and 17 Ma. The use in this work of a single thermochronometric system, and with only one sample having more than two apatite grains, does not allow us to produce a reliable t–T history for the whole belt. This is because with only one aliquot it is not possible to know whether there was any reset of the system. Nevertheless, our new data are in agreement with previous thermochronological results (Hansman et al. Reference Hansman, Ring, Thomson, Den Brok and Stübner2017; Grobe et al. Reference Grobe, Virgo, Von Hagke, Urai and Littke2018) and provide further evidence for the two-stage exhumation of the substratum of the post-nappe succession also in our study area. The ~42 Ma exhumation ages are related here to a major shortening event affecting the whole nappe edifice. Thrust-ramp-related uplift and associated enhanced erosion led to unroofing of the mountain belt, while the increased topographic load triggered flexuring of the lower plate (Homewood et al. Reference Homewood, Allen, Williams, Allen and Homewood1986) and thus the development of a new foredeep, consistently with our observation at the mountain front. Uplift of the chain and coeval subsidence of the foredeep cannot be explained, instead, by a process of slab detachment that would rather provoke uplift of the whole system. On the other hand, there could be a contribution by lithospheric buckling. Nevertheless, this should be minimal, taking into account the abrupt structural difference at the mountain front, representing a relatively short-wavelength deformation not compatible with lithosphere buckling. After this stage, during the Miocene, the inner portion of the foredeep was uplifted. This is witnessed by the switch of the pinch-out direction between Oligocene and Miocene packages observed in the section of Figure 3c. This stage, which is not recorded in the section to the south, corresponds to a wedge-top setting sensu DeCelles & Giles (Reference DeCelles and Giles1996). The uplift was probably triggered by the reactivation of the toe portion of the allochthonous sole thrust, as suggested by the almost rigid tilting of a wide area on top of the wedge (Fig. 9d). Folding observed in the NE portion of the northern seismic sections of Figure 3c is younger than tilting of the allochthonous wedge, as indicated by the folded unconformity between Miocene and Oligocene strata observed in the northern seismic section. Accordingly, folding of the post-nappe layers observed along the mountain front is to be regarded as a late-stage event (Fig. 9e). This late event also produced further unroofing of the mountain belt, which is recorded by the younger cluster of AHe ages at ~17 Ma. This younger episode was previously related to the Zagros orogeny (Jacobs et al. Reference Jacobs, Thomas, Ksienzyk and Dunkl2015; Grobe et al. Reference Grobe, Virgo, Von Hagke, Urai and Littke2018, Reference Grobe, Von Hagke, Littke, Dunkl, Wübbeler, Muchez and Urai2019) and to a velocity variation of the Makran subduction (Hansman et al. Reference Hansman, Ring, Thomson, Den Brok and Stübner2017, Reference Hansman, Albert, Gerdes and Ring2018). The layer-parallel shortening event documented in the post-nappe strata exposed at the mountain front occurred in the period spanning between the allochthonous wedge tilting and folding of the post-nappe. This inference is coherent with similar observations made in other fold-and-thrust belts worldwide, where the layer-parallel shortening pattern develops ahead of the advancing compressive front and in the more external portion of the belt (e.g. Engelder & Geiser, Reference Engelder and Geiser1980; Mitra & Yonkee, Reference Mitra and Yonkee1985; Railsback & Andrews, Reference Railsback and Andrews1995; Evans & Elmore, Reference Evans and Elmore2006; Weil & Yonkee, Reference Weil and Yonkee2012; Tavani et al. Reference Tavani, Storti, Lacombe, Corradetti, Muñoz and Mazzoli2015, Reference Tavani, Corradetti, de Matteis, Iannace, Mazzoli, Castelluccio, Spanos and Parente2019; Beaudoin et al. Reference Beaudoin, Koehn, Lacombe, Lecouty, Billi, Aharonov and Parlangeau2016).
Conclusions
Integrated field structural analysis, remote sensing and seismic interpretation were used in this study to unravel the architecture and tectonic evolution of the foreland basin postdating the Cretaceous nappe emplacement in the Oman Mountains. Development of the late-Eocene, post-nappe foredeep occurred in relation to foreland flexuring controlled by the tectonic load that, in turn, resulted from renewed shortening within the mountain belt. Unroofing, recorded by both available thermochronological data and our new AHe cooling ages (at ~42 Ma), furnished the detrital material filling the newly developed foredeep. The inner portion of the foredeep was then uplifted during the Miocene, leading to a change of the pinch-out direction observed in seismic sections between Oligocene and Miocene foreland basin units. The Miocene sequence, deposited in a wedge-top basin setting, experienced later layer-parallel shortening and folding. This younger shortening event is also recorded by renewed unroofing of the mountain belt. This is also supported by our new thermochronometric data that shows a cluster of AHe ages at ~17 Ma.
The results of this study allowed us to correlate Tertiary shortening–exhumation events that occurred in the Oman Mountains with the development and tectonic evolution of the post-nappe foreland basin. This was here achieved integrating AHe thermochronometry, furnishing exhumation timing of the culmination areas, with seismic sections and structural data of the post-nappe to decipher the deformation of the frontal areas during the main uplift events. This may have major implications for a better understanding of this classic, extensively studied mountain belt and for further oil and gas exploration in the area.
Acknowledgements
The manuscript benefited from insightful constructive revisions by François Roure and Christoph von Hagke. The authors wish to acknowledge Matteo Basilici, Jason Williams and Charlie Kergaravat for their field assistance, Sandrine Choy for her support for sample preparation at GET, and Patrick Monié and Michael Bonno for He analyses at Géosciences Montpellier. The Geological Research Department of the Public Authority for Mining (PAM) of the Sultanate of Oman is thanked for its cooperation with the University of Camerino. Mr. Ibrahim Al Sawafi from PAM is also warmly thanked for facilitating our work during the past two years.
This work forms part of a research project funded by Total E&P through a contract with the University of Camerino.


 Open access