

1. Introduction
Consumers pay high prices for branded pharmaceuticals (IQVIA Institute for Human Data Science, 2019). However, this observation without more does not indicate whether prices are excessive. That judgment depends as well on whether buyers receive value commensurate with the prices charged for these products. Our purpose here is to shed light on this issue.
In regard to pharmaceuticals, there are conflicting opinions on the relation between price and value. Some observers claim that pharmaceutical prices are set arbitrarily and bear little relationship to value (Kantarjian & Rajkumar, Reference Kantarjian and Rajkumar2015; Campbell et al., Reference Campbell, Belozeroff, Whittington, Rubin, Raggi and Briggs2018; Conti et al., Reference Conti, Frank and Gruber2021). They claim that branded drugs provide low value to consumers because of consistently high markups and prices. In large measure, those authors emphasize the market power of pharmaceutical manufacturers and their ability to impose high prices on patients and insurers even for drugs with few additional therapeutic benefits.
However, public and private insurers, who are the primary buyers in pharmaceutical markets, are not without bargaining tools to contest a seller’s price if it is high relative to benefits. Their actions include a range of negotiating tools and reimbursement policies such as mandatory step therapy and formulary restrictions. Research shows that non-price quantity restrictions are both common and varied in US healthcare plans (Chambers et al., Reference Chambers, Anderson, Wilkinson and Rane2017, Reference Chambers, Kim, Pope, Graff, Wilkinson and Neumann2018). Both sets of firms, pharmaceutical companies and health insurers, found on opposite sides of pharmaceutical markets, have the power to affect final prices.
Whether incentivized through competition, contract, or statute, private insurers are committed to serving the health and financial needs of their customers. That motivation leads them to be willing to pay for high-priced therapeutically advanced pharmaceuticals (Lu et al., Reference Lu, Comanor, Cherkas and Phillips2020) but also to pay less for pharmaceuticals that offer little or no therapeutic advantage. A pharmaceutical’s therapeutic value will therefore be reflected in its price (Lu & Comanor, Reference Lu and Comanor1998; Ekelund & Persson, Reference Ekelund and Persson2003; Philipson & Jena, Reference Philipson and Jena2006; Howard et al., Reference Howard, Bach, Berndt and Conti2015): but to what extent, for what types of pharmaceuticals, and with what regularity? We report here that the costs of branded pharmaceuticals, on average, fall below common estimates of consumers’ willingness to pay for improved health. This result is robust to differing inclusion criteria and differing sources of funding for the underlying studies.
2. Methods
2.1. Cost-effectiveness studies of US branded drugs
To study this issue, we turn to data from the large published literature of cost-effectiveness studies of branded pharmaceuticals for use in a regression-based informal meta-analysis of the price–outcome relationships. In most such studies, pharmaceutical benefits are measured by the quality-adjusted life years (QALYs) gained by an average patient from consuming a particular pharmaceutical relative to a comparator representing the current standard of care. A conclusion about benefits relative to costs then depends on whether the estimated incremental cost per QALY is higher or lower than estimates or presumptions about the monetary value of the QALYs gained.
Our estimates are highly conservative – the cost per QALY is likely overstated – for two main reasons: (i) A new pharmaceutical’s incremental cost (accounting for possible offsets in the cost of other medical services) is commonly based on its published list prices. These prices, however, often overstate a pharmaceutical’s true transaction price; rebates and discounts currently represent about 45 % of the list price of branded pharmaceuticals (Hernandez et al., Reference Hernandez, San-Juan-Rodriguez, Good and Gellad2020; Kakani et al., Reference Kakani, Chernew and Chandra2020). (ii) The vast majority of studies assume that the launch price will be the governing price indefinitely. In reality, most drugs meet generic competition in a few years in a process dubbed “genericization.” After that, the average price will decline dramatically. In the most recent study that accounted for this process, the author reported a decrease in the relevant incremental cost of 43 % (Neumann et. al., Reference Neumann, Podolsky, Basu, Ollendorf and Cohen2022, p. 62).
Most cost-effectiveness studies report both a pharmaceutical’s incremental cost and/or spending, along with its medical benefits as compared to the next best alternative. A new pharmaceutical with the same prices and benefits as those of established ones would thereby register with zero values for both incremental costs and benefits. Patients consume pharmaceuticals, and require their insurers to pay for them, because they expect to gain therapeutic benefits as a result. A critical issue is whether they receive value that is worth the additional spending. The meaningful measure of incremental pharmaceutical cost is therefore the additional cost per unit of therapeutic benefit, measured conventionally by the number of QALYs gained.
2.2. Data
We obtained data from the Tufts Cost-Effectiveness Analysis Registry, which is a well-known and comprehensive repository of information on peer-reviewed cost-effectiveness studies. These studies are subject to formal screening for data quality and methodological correctness by trained reviewers. For inclusion in the registry, articles must appear in English. This registry is the best available data source on the costs and therapeutic benefits of branded pharmaceuticals.
Each study in the registry compares a new treatment option with another treatment or alternatively with no treatment. These studies contain various types of interventions including pharmaceuticals but also vaccines, medical devices, diagnostic agents, and others. In addition to reported costs and QALYs, the registry contains information on the molecule, disease classifications, and research funding source. Moreover, the cost data present in the registry include not only the full costs of the drug itself but also related changes in other medical and non-medical expenses indicating negative or positive cost offsets.
Depending on the circumstances, studies of pharmaceuticals’ incremental costs and QALYs can fall into four quadrants: Quadrant 1 includes drugs with positive QALYs gained and also positive costs. Quadrant 2 includes drugs with fewer QALYs gained and positive additional costs, such that the drug in question is “dominated” by the comparator. Quadrant 3 includes drugs with negative additional QALYs and negative additional costs, while Quadrant 4 includes drugs with positive QALYs and negative costs such that the drug in question dominates the alternative. While we consider drugs from all four quadrants, our regression analysis is limited to those in Quadrant 1 with both non-negative incremental costs and QALYs.
Some of the studies in the Tufts data present the drug’s ratio of incremental cost to additional QALY, termed its incremental cost-effectiveness ratio (ICER) value. This numeric is fundamentally different from the regression estimates determined here. Our regression equations permit one to estimate the incremental dollar costs per additional QALY gained for a particular sample of pharmaceuticals. Instead, the Tufts reported numeric is the simple ratio of cost per QALY for a particular observation. In effect, the Tufts reported ICER value is equivalent to running a separate regression for each observation that forces the regression line through the origin and has no degrees of freedom, and then determining the slope of that line. Such computations reflect the average costs per QALY received for particular drugs rather than composite values of marginal costs per additional QALY gained for the relevant sample.
2.3. Sample selection
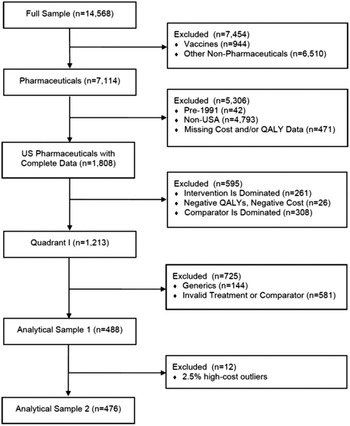
Although the Tufts Registry included 14,568 studies through 2015, we limited our attention to those that met pre-determined criteria. This process is represented in Figure 1. Since our attention is directed as U.S. pharmaceuticals, eliminated from consideration were non-pharmaceutical interventions (6510), non-U.S. studies (4793), pre-1991 studies (42), vaccines (944), and studies missing Cost and/or QALY Data (471). In effect, therefore, the Registry observations available for our purposes are limited to 1808 studies.
As noted above, we excluded vaccines from the study. Not only does public and private insurance coverage for vaccines differ from that accorded other drugs since they are dispensed to healthy rather than afflicted consumers, but also they are typically marketed as generic products. Furthermore, excluding vaccines from cost-effectiveness analyses is consistent with other studies for similar reasons (Howard et al., Reference Howard, Bach, Berndt and Conti2015; Stern et al., Reference Stern, Chen, Ouellet, Trusheim, El-Kilani, Jessup and Berndt2021).
Also excluded are 144 studies dealing with generic pharmaceuticals. As is well-known, branded and generic pharmaceutical prices sharply diverge, as the average price of a branded pharmaceutical per prescription is more than twenty times that on average of a generic prescription (IQVIA, 2019). Although a small number of generic drugs are highly priced, those cases commonly result from specific market factors which may differ from those found with their branded counterparts. As a result, we would not expect generic prices to reflect therapeutic benefits in the same manner and to the same extent that do branded drugs.
Similarly, we exclude 581 studies with invalid treatment or comparators. An “invalid treatment” involves a drug used in combination with other drugs or non-drug interventions. In those cases, it is unclear how to attribute the incremental costs and QALYs to the new drug or to other components of the treatment bundle. On the other hand, an “invalid comparator” is one that is not the standard of care. In that case, the observed QALYs gained cannot be interpreted as the economically relevant incremental benefit of the drug.
There is also the question, mentioned earlier, of dominated or dominating comparisons. Although studies with such results cannot be used to estimate a cost per QALY, they still provide useful information. First, consider the 308 observations where the drug at issue is dominant, which represents 17 % of the U.S. sample with complete data. In those cases, it leads to improved therapeutic results at negative incremental costs (Quadrant 2). In effect, the benefits provided here are “better than free.”
On the other side, however, are the 261 potential data points where the drug at issue is dominated by the comparator (Quadrant 4). Except for patients who cannot tolerate the standard of care represented by the comparator, these pharmaceuticals are effectively worthless and should be noted as such. These studies represent 261 observations out of 1808 studies of the U.S. sample with complete data, or 14 %. While these cases necessarily reflect higher prices than warranted by their therapeutic benefits, their absence from the regression analysis leads to a downwards bias in the estimated coefficients. In contrast, however, omitting the 308 cases provides the opposite bias. Although these two sets of omissions may be largely offsetting, their presence suggests greater variability than represented by the R 2 coefficients derived from our regression equations.
We use this sample of 488 data points after exclusion. We also create a second slightly smaller analytical sample of 476 observations, discussed below. These analytical samples are comparable to those analyzed in earlier studies using Tufts data (Chambers et al., Reference Chambers, Thorat, Pyo, Chenoweth and Neumann2014; Glick et al., Reference Glick Henry, McElligott, Pauly, Willke, Bergquist, Doshi, Fleisher, Kinosian, Perfetto, Polsky and Schwartz2015).
However, the data exclusions raise the issue of selection bias, and whether the results obtained can be extended to the broader universe of branded pharmaceuticals. That issue is an important one and is addressed following presentation of the findings derived from the analytical samples.
2.4. Regression results from two analytical samples
The first analytical sample of 488 observations includes a small number of outliers with very high incremental costs. Since the presence of a few outlier observations can alter the statistical analysis, and our objective is to discern general tendencies, we defined a second analytical sample by excluding the top 2.5 % (12 observations) based on the observation’s incremental costs, see Table 1. As shown there, the average cost for the 12 extreme high-cost outliers is more than 15 times the average cost in the remainder of the sample.
Sample construction.

Incremental cost of pharmaceutical interventions by sample.

Note: Incremental cost is presented using 2015 dollars, adjusted for inflation using the medical care CPI.
Abbreviation: CPI, consumer price index.
Because high branded pharmaceutical prices have attracted considerable attention, we reviewed the underlying studies for these 12 outliers (Zanocco et al., Reference Zanocco, Angelos and Sturgeon2006; Svatek et al., Reference Svatek, Lee, Roehrborn, Lippman and Lotan2008; Paltiel et al., Reference Paltiel, Freedberg, Scott, Schackman, Losina, Wang, Seage, Sloan, Sax and Walensky2009; Noyes et al., Reference Noyes, Bajorska, Chappel, Schwid, Mehta, Weinstock, Holloway and Dick2011; Erickson et al., Reference Erickson, Chertow and Goldhaber-Fiebert2013; Stein et al., Reference Stein, Newman-Casey, Mrinalini, Lee and Hutton2014; Rochau et al., Reference Rochau, Kluibenschaedl, Stenehjem, Kuan-Ling, Radich, Oderda, Brixner and Siebert2015; Durkee et al., Reference Durkee, Qian, Pollom, King, Dudley, Shaffer, Chang, Gibbs and Horst2016; Lauenroth et al., Reference Lauenroth, Kessleheim, Sarpatwari and Stern2020). Their incremental costs ranged from $190,714 to $970,041, with mean incremental costs of just under $300,000. That value contrasts with a comparable figure of less than $20,000 for the remaining 476 observations. We have not found any explanations for the extraordinarily high costs for these dozen pharmaceuticals. Excluding this small number of high-cost outliers from the estimating equations is appropriate statistically because, as a standard econometrics text explains, “not all Y (incremental cost) values corresponding to the various X (incremental QALYs) will be equally reliable” in determining overall estimates (Gujarati, Reference Gujarati2003).
From both samples, we estimated expected costs per QALY using simple regression analysis, as reported in Table 2. Throughout, we report White robust standard errors. Sample I includes all 488 observations, including the high-cost outliers, while Sample II is limited to 476 observations. This table reports estimates of the incremental costs per QALY reported for the two samples, $33,613 and $28,561 per QALY gained, respectively. Note the regression coefficient point estimates are not greatly affected by excluding the outliers. The confidence intervals around these estimates are narrow, especially in Sample II, where the 95 % confidence interval is $18,853–$38,270. From this sample, one would conclude with a high degree of confidence that the average cost per QALY for branded pharmaceuticals is less than $40,000 per QALY.
Simple regression estimates (standard errors) of incremental cost per additional QALY.

Note: This table presents coefficient estimates and robust standard errors in parentheses. Column I presents results from the first analytical sample of 488 drugs while column II presents results from the second analytical sample of 476 drugs (see Figure 1 for more details on the sample selection process).
Abbreviation: QALY, quality-adjusted life years.
*** p < 0.001.
Equally relevant are the associated R 2 values. When the high-cost outliers are included, this value is only 0.065, due apparently to the statistical noise generated by the observations with extreme values. However, when these 12 observations are removed from the estimating sample, the R 2 increases to nearly 0.20. In this sample, the therapeutic gains associated with the new drug account for approximately 20 % of the variation in the incremental costs. Although there is considerable variation remaining in the distribution of incremental spending across pharmaceuticals, their therapeutic effectiveness alone explains a notable share of the variation in incremental costs.
Recall that we have already excluded many observations where the pharmaceuticals were less expensive and more effective than the standard of care. Had we been able to include these dominating cases, the estimated average incremental cost of a QALY would be even lower than indicated by the estimated regression coefficient. Further, recall that all the cost-per-QALY coefficients are overstated because they are based on list rather than actual net prices and because they ignore genericization.
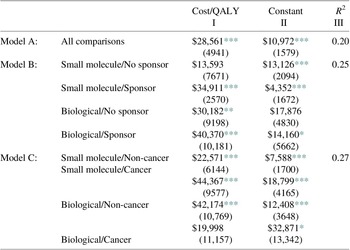
Adding additional controls to the equation provides a useful check on the earlier estimates and is reported in Table 3. We provide multiple regression results, which allow for a different intercepts and slope coefficients for each category.Footnote 1 Our first control is whether a pharmaceutical is a large molecule – biological as distinguished from a more conventional, chemical-based small molecule. Biologics are more difficult to produce, and critically, more difficult to replicate following patent expiration, so existing and future competitive conditions can be quite different. One might therefore expect higher incremental costs per QALY for these drugs. About 25 % of the pharmaceuticals in our sample are biologicals.
Multiple regression estimates (standard errors) of incremental cost per additional QALY by category, Sample II, N = 476.

Note: This table presents coefficient estimates and robust standard errors in parentheses. Column I presents estimates of incremental cost per QALY, while column II reports the estimated regression constant. Column III presents overall model R 2.
* p < 0.05.
** p < 0.01.
*** p < 0.001.
A second control is whether the study received industry funding, which could indicate a selection bias if pharmaceutical firms were more likely to fund and report studies of pharmaceuticals they had priced to be more cost effective. In Model B in Table 3, we report estimates of the incremental cost per QALY for each of the four cells concerning the biological-small molecule and sponsor-independent categories. The cells are (i) small molecules with no industry sponsor, (ii) small molecules with an industry sponsor, (iii) biologicals with no industry sponsor, and (iv) biologicals with an industry sponsor. Adding these controls increases the explanatory power of the analysis from 0.20 to 0.25, a difference which is statistically significant (p = 0.03). As expected, the cost per QALY is higher for biologics, both when the study was industry sponsored and when not. Contrary to expectations, industry sponsorship was associated with higher cost per QALY, both for small molecules and biologics.
Another control is whether the pharmaceutical contains a cancer indication, since cancer pharmaceuticals are generally considered to be more expensive relative to their benefits than pharmaceuticals used for other indications (Howard et al., Reference Howard, Bach, Berndt and Conti2015). We report estimates of the incremental costs per QALY in Panel III of Table 3. As indicated there, adding the cancer/non-cancer factor to the biological/small molecule distinction increases the explanatory power of the analysis to 0.27. This equation accounts for more than one-fourth of the overall price variation in the sample of 476 pharmaceutical comparisons.
These controls are themselves significant. Among biologicals, cancer pharmaceuticals have lower cost per QALY, while among small molecule drugs, cancer pharmaceuticals have higher costs per QALY and are nearly twice the cost per QALY as compared with non-cancer pharmaceuticals: $44,367 rather than $22,571.
2.5. Selection bias
The problem of selection bias, sometimes referred to as selectivity bias, can arise from data on observations that do not accurately reflect the underlying population about which inferences are being made. However, “researchers very often have no choice but to depend on the available data” (Gujarati, Reference Gujarati2003, p. 30). In that case, although we employ the best available data, even that source can have missing and invalid observations. Although we cannot construct new data points, we can use the omitted observations to infer the direction of any bias that might result from their absence.
Consider the 471 data points noted in Figure 1 as those with “Inconsistent/Missing Data” (i.e., missing cost and/or QALY or inconsistent data on cost and/or QALY). A form of selection bias, resulting from industry funding, could occur if industry-funded studies report incomplete data for cases that are not favorable in that they have high cost per QALY or even are dominated by established drugs. If drug companies hold back reporting data from studies with unfavorable results, then we should observe: (i) studies with missing data should be disproportionately funded by drug companies; and (ii) that studies with missing data should be disproportionately less productive offering less value for cost. We can test these implications with available data.
Of the inconsistent/missing data points, 108 out of 471 (22.93 %) received industry funding. For comparison, of the 1808 data points with data limited to U.S. pharmaceuticals, 601/1808, or 33.24 %, received industry funding. Industry-funded studies are thereby 10 percentage points more likely to report complete data, not less likely. Recall that in our analytical sample, industry-funded studies were associated with less favorable results, compared to other-funded studies, see Table 3. This factor also suggests that industry funding does not result in suppressing less favorable studies. Although we cannot use data from observations that are missing separate data on cost or QALY in our regression equations, we can learn that there were not enough high-cost, low-QALY data points whose selection might lead to biased findings.
Turning next to the issue of dominance, if missing-data drugs were systematically inferior, one would expect them to dominate the comparator drug less frequently and be dominated by the comparator drug more frequently. However, we find the opposite. Drugs with missing data are slightly less likely to dominate their comparators but much less likely to be dominated by their comparators. Quantitatively, in the missing-data sample, 71/471 (15.07 %) drugs dominate their comparator as compared to the 307/1808 (16.98 %) in the complete-data sample. In terms of the domination criterion, the missing-data sample includes only 38/471 (8.07 %) drugs which are dominated by the comparator compared to 262/1808 (14.49 %) drugs in the complete-data sample. In terms of dominance, therefore, the missing-data drugs look slightly superior. These results suggest that excluding inconsistent/missing data does not impart a negative selection bias to the findings presented earlier.
Turning now to the Tufts numeric ICER values which were mentioned earlier. Although inferior to the sample-wide findings reported in the previous section, they do have the two advantages of (i) being product-specific and (ii) being generally available where separate Cost and QALY information is not. To determine whether the findings presented earlier may have been influenced by missing data, we consider their associated ICER values after deducting observations with the negative values resulting from either reduced incremental Costs or QALYs (Quadrants 2 and 4). The resulting number of observations is 362 (471–38–71) (including data points in either Quadrants 1 or 3). In effect, we can then determine average ICER values for data points omitted from the earlier analysis.
These comparative data include numeric ICER values for almost all cases: 358/362 (98.62 %). For these 358 observations, the median numeric ICER value is $40,182 per QALY. The most comparable subsample are the 1239 observations with U.S. Pharmaceutical data in Quadrants 1 and 3. In that subsample, the median numeric ICER is $54,516/QALY.Footnote 2 If less productive observations with high incremental costs and low incremental QALYs were systematically suppressed in the Tufts data, we would expect the numeric ICER to be higher in the sample with missing data. However, we find the opposite. This comparison indicates that high incremental costs relative to incremental QALYs have not been systematically omitted. Again, these results suggest that the sample exclusions described above are unlikely to have biased our estimates of incremental cost per incremental QALY downward.
Finally, there are the omitted 581 observations with invalid treatments or comparators. An “invalid treatment” involves a drug used in combination with other drugs or non-drug interventions. In those cases, it is unclear how to attribute the incremental costs and QALYs to the new drug or to other components of the treatment bundle. In contrast, an “invalid comparator” is one that is not the standard of care. In that case, the observed QALYs gained cannot be interpreted as the economically relevant incremental benefit of the drug. While meaningful ICER values are not available in these cases, there are no factors suggesting that including these data points would lead to widely different findings.
3. Discussion
Our principal finding is that incremental QALYs are a statistically and economically significant factor in explaining incremental pharmaceutical costs. These results are contrary to the common suggestion that branded pharmaceutical prices are randomly set and bear little relationship to their therapeutic gains. While there remains a substantial amount of unexplained variation, these data indicate there remains a significant relationship between benefits and costs.
The results offered here provide large-sample estimates based on the largest available set of curated data of the average cost of new pharmaceuticals in terms of QALYs gained rather than in the cost per treatment or per dosage. Since pharmaceuticals are consumed for their expected therapeutic gains, these incremental measures of cost per unit of health benefit are more economically relevant than are the prices charged per individual dose.
The estimates reported above rest on regression coefficients and thereby provide average or typical values. To be sure, some pharmaceuticals in the included studies are highly priced per QALY. Nothing presented here disputes their presence. However, as with all averages, there are also pharmaceuticals with prices per QALY less than our estimated values. What accounts for this remaining variation remains an important puzzle: however, the presence of drug company market power over new branded pharmaceuticals cannot explain why so many are priced moderately or even below the prices charged for current drugs relative to their incremental health benefits – while others are overpriced and sometimes inferior in effectiveness as well.
Are these estimates of average incremental prices “high” or “low” relative to the incremental benefits they systematically provide? The answer to that question depends on the value attributed by consumers and/or society for additional QALYs. As late as 2014, Neumann et al. (Reference Neumann, Cohen and Weinstein2014) observe that some commentators were still using the yardstick of $50,000 per QALY as a threshold of good value. And NICE in the UK recommends a threshold of £20,000–£30,000, which is about $26,000–$39,000. Such values are problematic as there is neither strong conceptual support nor a clear policy history. The $50,000 figure is often dated to the 1970s and relates to Medicare’s justification for treatment of end-stage renal disease (Neumann et al., Reference Neumann, Cohen and Weinstein2014). Even if that value was well founded originally, it is now much too low after more than 40 years of price inflation and economic growth. Simply adjusting for overall inflation gives a current estimate of over $300,000. Adjusting for growth in nominal income gives an even higher figure.
Furthermore, empirical studies in the economics literature, primarily relying on revealed preference analysis, indicate much higher values. See Viscusi’s review of the current economic literature on this subject. He reports larger dollar values for life years (Viscusi, Reference Viscusi2018, p. 105) that rest on consumer valuations in labor and product markets. See also the 2016 Report by the US Department of Health and Human Services. Of the six figures suggested there as standards for use in regulatory decision-making, the lowest one mentioned is $230,000 per QALY in 2014 dollars (U.S. Department of Health and Human Services (HHS), 2016). The estimated average costs per QALY presented above should be viewed in that context.
These findings should also be considered for their implications of the shares of consumer value gains captured by innovative firms. These empirical results are broadly consistent with prior studies showing that innovators generally capture only a small proportion of the consumer surplus arising from those products (Nordhaus, Reference Nordhaus2004; Philipson & Jena, Reference Philipson and Jena2006; Jones & Summers, Reference Jones and Summers2020). Low appropriability of social gains is a phenomenon commonly observed, and appears to occur in regard also in the cost of branded pharmaceuticals.
4. Conclusions
Compared to commonly proposed threshold monetary values of additional health benefits, our findings indicate that U.S. branded pharmaceutical treatments are priced on average below the value of the health benefits obtained. Consumers pay less in additional health insurance premiums and out-of-pocket payments for branded drugs than their estimated value of improved health status. In economic terms, that result indicates a willingness to pay for additional QALYs that exceeds the average or typical cost of the QALYs gained.
A frequent response to findings such as those reported here is that many consumers could not afford to pay for a pharmaceutical promising to provide an additional QALY, let alone pay any higher amount.Footnote 3 Budget constraints intervene and many low-income patients would go without pharmaceuticals that provide important health benefits. That critique, however, ignores the inherent distinction between identifiable and statistical lives. As others have emphasized, the latter concerns the willingness to pay for an increased probability of achieving an additional QALY, not the certainty of an additional year of life (Zanocco et al., Reference Zanocco, Angelos and Sturgeon2006).
That response also ignores the role of private and public insurance coverage of expensive and effective pharmaceuticals, which only a few will need. Consumers’ choices of insurance plans correspond to the choice of a small expected improvement in the probability of good health that is the foundation of the revealed preference approach to valuing QALYs. In 2018, only 5 % of all prescriptions filled in the USA were paid entirely in cash (IQVIA Institute for Human Data Science, 2019). Our collective buyers, typically public and private insurers, are willing to pay for medicines that improve the health status of their subscribers. Indeed, they would be poor agents of their customers and citizens if they were not. It is through their negotiations with the pharmaceutical companies that transaction prices are determined. The critical factors in this bargaining process are the therapeutic gains resulting from specific pharmaceuticals, and also how much institutional buyers are willing to pay for the benefits received by their subscribers. It appears from our results that buyers, especially those with public or private health insurance, get a reasonably good bargain on average. Of course, this may not be the case for those with limited insurance coverage for drug costs.
A. Appendix: Robustness
A.1 Data exclusions
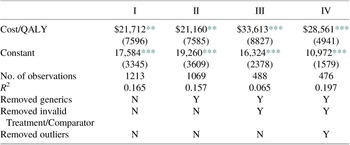
In this section, we directly address questions of robustness. That is, we estimate our simple regression equations of incremental cost on incremental QALY for more inclusive data sets, which reverse important exclusions. The more inclusive sample of 1213 includes both generic drugs and studies with invalid treatments or comparators. In Table 4, compare column 1 to columns 3 and 4. The estimates there differ from those based on our analytical samples in two ways. First, the estimated incremental cost per QALY is much lower, $21,712 versus $33,613 (Sample I) and $28,561 (Sample II). This more inclusive sample has a lower cost per QALY of 35 and 24 %. Further, the fit is better than Sample I, but slightly worse than Sample II. This result suggests that the generic drugs and studies with invalid treatments or comparators are both different and more favorable. Excluding these observations is conservative as it increases the estimates of the cost per QALY.
Robustness for pharmaceutical samples with fewer exclusions.

The next comparison excludes the generic drugs but keeps the drugs with invalid treatments of comparators. In Table 4, compare column 2 to columns 3 and 4. These results are very similar to the above. The exclusion of invalid treatments or comparators is also conservative – it increases our estimate of cost per QALY.
A.2 Are blockbusters different?
Robustness for drugs in top 20 by sales revenue.

Our analytical data set includes studies of blockbusters, which are drugs earning very high revenues. Following IQVIA, we define blockbusters as the top 20 drugs by sales revenue (IQVIA Institute for Human Data Science, 2019). To determine if the findings presented above, we carry out our regression analysis on blockbuster observations alone.
Table 5 demonstrates that our results are similar when using only observations of the blockbuster drugs. Column 1 shows estimates for the 62 studies involving the blockbusters that are in Quadrant 1. There are no generic blockbusters, so this regression is comparable to column 2 in Table 4. As indicated, the estimates are very close to those in Table 4, with the blockbusters slightly more productive. Column 2 shows estimates after excluding invalid treatments or comparators. This is comparable to column 3 in Table 4. Although with these 43 observations we lose statistical significance, the point estimates are similar to the full data set, again, with the blockbusters looking slightly better. Note that about 9 % of our analytical Sample I involve the top 20 blockbusters. And the results are very similar for the blockbusters alone.
A.3 Does excluding vaccines bias the incremental cost per incremental QALY downward?
Robustness for vaccines.

As explained above, vaccines are different in many ways than ordinary brand name drugs. We believe that they should be excluded because of the differences. But, there is a question of whether excluding them led to a lower estimated cost per QALY. This would happen if vaccines had a high incremental cost per incremental QALY. We have a large sample of vaccines that meet most of our other exclusion criteria to test this idea, 140 observations. Using these 140 observations, we estimated our standard simple regression equation, see Table 6. This regression is comparable to column 1 in Table 4. The coefficient is much lower for vaccines, $11,334, rather than $21,712. Also, the fit is better. Vaccines are different and excluding them is conservative – this exclusion increases our estimated cost per QALY.
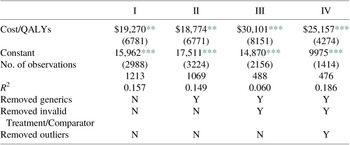
A.4 The medical CPI versus the all-items CPI
Regression results using all-items CPI-U.

We prefer the medical care consumer price index (CPI) to adjust for inflation in the medical sector. But, one could argue for using the all-item CPI instead. To check whether our results are robust to the choice, we reran the basic regression for two more inclusive samples and our analytical Sample I, see Table 7. Comparing those results to our original results, deflating by the medical CPI, we see little difference. This is not surprising, given that the correlation of the two series from 1991 through 2015 is extremely high, r = 0.997. Comparing the results for Sample I, Table 2, the coefficients are slightly lower ($30,101 vs. $33,613) using the all-item CPI, so our use of the Medical CPI is conservative – this choice increases our estimated cost per QALY.


 Open access