


1. Introduction
This study investigates the economic consequences of nematode infestations, a persistent plant pest affecting potato production in the US and worldwide. Nematodes are ubiquitous and perennial soil-dwelling pests, but their severity fluctuates from year to year due to environmental and biological factors. Chitwood (Reference Chitwood2003) estimated global annual crop losses from nematode infestation at $125 billion, with U.S. losses exceeding $10 billion across all crops. Within the U.S. potato industry, these impacts are concentrated in major potato producing regions like Idaho, Washington, and Oregon, where nematode infestations persist in the soil and threaten the productivity and profitability of both processing and seed producers (Bridge and Starr, Reference Bridge and Starr2007; Koirala et al., Reference Koirala, Watson, McIntosh and Dandurand2020; Price et al., Reference Price, Coyne, Blok and Jones2021). Because potatoes are part of a vertically linked supply chain that includes processing, storage, and distribution, pest damage disrupts not only farm production but also the broader network of firms that depend on potato supply.
The economic importance of nematode control is amplified by the structure of U.S. potato markets. The processing segment is highly concentrated, with the top four firms purchasing nearly 80 percent of all processing potatoes (Richards et al., Reference Richards, Patterson and Acharya2001). Such concentration creates potential for buyer-side market power, where dominant processors influence farm-gate prices and affect how biological shock translate into economic outcomes. When a disease induced supply shock occurs, dominant buyers may suppress farm-gate prices or delay procurement adjustments, making it harder for producers to recover losses. This interaction between biological risk and buyer power means that the economic burden of pests is not only determined by yield loss but also by the market’s ability or inability to transmit fair prices to producers (Richards et al., Reference Richards, Patterson and Acharya2001; Saitone and Sexton, Reference Saitone and Sexton2017b; Sexton, Reference Sexton2013).
Empirical evidence from other sectors supports these concerns. Richards et al. (Reference Richards, Patterson and Acharya2001) found that processors in Washington exhibit dynamic oligopsony behavior, colluding roughly 65% of the time and causing statistically significant welfare losses to potato growers. Similar concerns arose in the beef sector during COVID-19, where unprecedented price spreads triggered investigations into whether processing concentration amplified market disruptions, although Azzam and Dhoubhadel (Reference Azzam and Dhoubhadel2022) and Lusk et al. (Reference Lusk, Tonsor and Schulz2021) found no statistical evidence of noncompetitive conduct. In the fresh strawberry market, where monopsony power was shown to cause asymmetric price transmission and reduce grower revenues during peak harvest months, Acharya et al. (Reference Acharya, Kinnucan and Caudill2011) provide evidence that such buyer market power can lead to an average grower loss of 6% during periods of supply abundance. Likewise, in the pear industry, seasonal supply shocks intensified the price distortion effects of processor concentration (Winfree et al., Reference Winfree, Mccluskey, Mittelhammer and Gutman2004). Taken together, these examples imply that supply shocks such as those caused by disease outbreaks could be amplified by buyer-side market power, further distorting prices and distributional outcomes.
These impacts are altered by different market conditions and degrees of market power. As Saitone and Sexton (Reference Saitone and Sexton2017b) and Sexton (Reference Sexton2013) point out, it is rare to find markets where there are many small buyers and sellers, where products are truly uniform, and where everyone has full access to information. Instead, what we see are highly coordinated supply chains, powerful buyers, and increasing emphasis on product traits that are difficult to verify, all of which can limit farmers’ influence and disrupt traditional market dynamics (MacDonald, Reference MacDonald2008). These structural features mean that the effects of biological shocks such as nematodes cannot be understood solely through agronomic or biological models; they must also be examined within an industrial organization framework that accounts for imperfect competition and price transmission.
Although potato growers generally anticipate some level of nematode damage each season, they face uncertainty regarding its exact impact in any given year. As a result, nematode damage has both anticipated and unanticipated components, each with distinct implications for production decisions, profitability, and market outcomes. Anticipated losses represent the expected, average level of damage that producers incorporate into planting and management decisions. Unanticipated losses, by contrast, arise from stochastic or unexpected outbreaks that occur after production decisions are fixed. These two forms of biological uncertainty differ not only in timing but also in their economic implications. Anticipated losses shape long-term investment, input use, and acreage decisions, whereas unanticipated shocks create short-run disruptions, price volatility, and welfare losses that producers cannot easily offset.
Distinguishing between these two components is crucial for understanding how biological persistence interacts with market structure to determine welfare outcomes. When pest pressure is expected, producers can adapt through crop-rotation, resistant varieties, or input adjustments (Dandurand et al., Reference Dandurand, Zasada, Wang, Mimee, De Jong, Novy, Whitworth and Kuhl2019; USDA APHIS, 2022; Yorgey et al., Reference Yorgey, Kantor, Kruger, Painter, Davis and Bernacchi2017). When infestations occur unexpectedly, however, farmers face limited flexibility in the short-run, and market power among processors may further distort price adjustments (Richards et al., Reference Richards, Patterson and Acharya2001; Saitone and Sexton, Reference Saitone and Sexton2017a). These dynamics suggest that pest control policies and management innovations can have asymmetric effects on producers and consumers, depending on whether biological shocks are anticipated or unanticipated.
This study addresses two interrelated questions:
-
1. How do producers adjust planting and production decisions in response to anticipated nematode-induced yield losses?
-
2. How do unanticipated outbreaks affect price, profits, and consumer welfare production capacity cannot adjust?
To answer these questions, we use a Cournot model that distinguishes between expected and unexpected shocks from plant diseases, incorporating firm cost structures and market competition. The theoretical framework adapts Winfree et al. (Reference Winfree, Gallardo, Atallah and Nefouti2025), who modeled disease impacts in the pear industry, to capture how yield risk and market concentration jointly determine price and welfare. We empirically estimate a system of supply and demand equations using Three-Stage Least Square (3SLS), employing monthly shipping point price and quantity data for nine major potato producing states from 2013–2023. This approach corrects for the simultaneity between price and quantity and enables simulation of counterfactual scenarios in which the severity of nematode infestation varies. The resulting simulations quantify how biological risk reduction translates into changes in equilibrium price, output, producer profit, and consumer surplus under three behavioral regimes (i) fixed price markets, (ii) non-strategic Cournot competition, and (iii) strategic Cournot behavior with producer response.
This paper makes three main contributions:
First, it introduces the conceptual distinction between anticipated and unanticipated biological shocks into an imperfectly competitive agricultural market model, demonstrating how these two sources of uncertainty generate distinct price and welfare dynamics.
Second, it provides an empirical link between theoretical parameters and observed market data, integrating Cournot competition with simultaneous equation estimation that captures endogenous price-quantity interactions in the U.S. potato market.
Third, it quantifies the distributional consequences of nematode control across producers and consumers, showing that while pest reduction raises total efficiency and consumer welfare, producer may experience profit declines in inelastic, concentrated markets which is consistent with theories of oligopsony behavior (Sexton, Reference Sexton2013; Tirole, Reference Tirole1988).
Understanding these mechanisms helps design policies that make pest control both efficient and fair. The framework shows when biological risk reduction needs complementary measures like resistant varieties, cooperative marketing, or transparent pricing so that gains are shared across producers and consumers.
The rest of the paper is organized as follows. Section 2 reviews the biology and management challenges of nematodes in potato production. Section 3 introduces our theoretical model distinguishing between anticipated and unanticipated disease impacts. Section 4 describes the dataset and estimation strategy. Section 5 presents empirical results and simulation findings. Finally, Section 6 discusses policy implications and directions for future research.
2. Nematode background
2.1. Biology and economic significance
Plant-parasitic nematodes are microscopic soil-dwelling pests that invade potato roots, impair nutrient and water uptake, and reduce tuber formation (Bridge and Starr, Reference Bridge and Starr2007; Price et al., Reference Price, Coyne, Blok and Jones2021). The most harmful species to potatoes include the cyst nematodes Globodera pallida and Globodera rostochinensis and the root-knot nematode Meloidogyne chitwoodi. Juveniles penetrate root tips early in the growing season, forming feeding sites that restrict vascular flow and stunt growth. Nematodes spread through infested soil, irrigation water, farm machinery, and seed tubers (USDA APHIS, 2022). Because cysts and eggs remain viable for decades, infestations persist despite fallowing or treatment, creating long-term biological constraints on production. In fact, potato cyst nematodes can survive for decades or more without a host crop, posing a persistent threat that influences both land values and long-term crop planning (Orlando and Boa, Reference Orlando and Boa2023).
2.2. Management challenges
Effective control of nematodes requires a combination of preventive, cultural, and chemical strategies, however each approach faces limitations. Preventive measures include planting resistant cultivar, which restrict nematode reproduction within plant roots (Dandurand et al., Reference Dandurand, Zasada, Wang, Mimee, De Jong, Novy, Whitworth and Kuhl2019; USDA APHIS, 2022). Crop rotation with non-host or poor-host crops, such as small grains or biofumigant cover crops, can reduce nematode populations. For example, incorporating mustard-arugula rotations lowered field infestations in Pacific Northwest trials (Yorgey et al., Reference Yorgey, Kantor, Kruger, Painter, Davis and Bernacchi2017). Chemical fumigants like 1,3-dichloropropane and biological alternatives such as mustard biofumigants are also used, but their costs are high, and effectiveness depends on soil and climate conditions (Clay et al., Reference Clay, Perkins, Motallebi, Plastina and Farmaha2020). Evidence from potato integrated pest management (IPM) programs indicates that dissemination and adoption choices materially affect grower outcomes (Mauceri et al., Reference Mauceri, Alwang, Norton and Barrera2007).
In regulated areas such as Idaho infested with Globodera pallida growers must follow strict quarantine protocols involving crop-rotation schedules and multi-year field monitoring (Koirala et al., Reference Koirala, Watson, McIntosh and Dandurand2020). These requirements raise production costs and reduce land flexibility, amplifying regional economic impacts. Resistant cultivars such as Innovator exist but often perform poorly in certain soils or under drought stress (Potatoes News, 2021), illustrating the agronomic-economic trade-offs farmers face.
2.3. Economic implications
From an economic perspective, nematode infestations alter both expected yields and cost structures. Farmers incur fixed planting expenses regardless of infestation level, while only the marketable portion of the crop bears additional harvest and post-harvest costs. Consequently, pest pressure raises average costs and increases variability. Yield loss relationships are typically non-linear meaning that small increase in nematode density can cause disproportionate yield declines once biological thresholds are exceeded (Devi et al., Reference Devi, Behera, Madhu, Koushal and Priya2024).
Because infestations persist and control measures are costly, growers face a dynamic problem balancing short-term profit against long-term soil health. Under climate variability and evolving resistance, these trade-offs intensify. Limited regional adaptation of integrated management and scarce economic risk assessments further constrain efficient resource allocation. Overall, nematode persistence creates not only agronomic loss but also market and policy challenges, underscoring the need to analyze pest impacts through both biological and economic view.
3. Theoretical framework: market responses to pest induced yield risk
This section presents a Cournot model framework adapted to agricultural production under biological stress. A Cournot model is appropriate because the U.S. potato processing sector exhibits imperfect competition, with a small number of dominant buyers influencing farm-gate prices (Richards et al., Reference Richards, Patterson and Acharya2001; Sexton, Reference Sexton2013). We model how identical potato farmers make planting decisions in anticipation of nematode-related yield losses. The framework focuses on expected outcomes, connecting them to market prices, costs, and welfare impacts.
3.1. Model setup
The model developed here is based on Winfree et al. (Reference Winfree, Gallardo, Atallah and Nefouti2025) where they investigate the economic effects of fire blight in pear production. We use their theoretical framework and adapt the empirical model to investigate nematode infestations in potato production. A full mathematical description of the theoretical model is presented in Appendix A1.
We consider a market with N symmetric potato producers where each farmer selects a potential planting level that would result in potential yield xi, in the absence of nematodes. However, nematode infestations reduce the expected yield by a factor $\overline{\rm\theta }$
, where
$\overline{\rm\theta }$
, where $ 0\lt \overline{\rm\theta}\lt 1$
represents the expected fraction of crop lost due to pests. Hence, the expected amount of marketable potatoes from each farmer (
$ 0\lt \overline{\rm\theta}\lt 1$
represents the expected fraction of crop lost due to pests. Hence, the expected amount of marketable potatoes from each farmer ( $\overline{x_{i}}$
) is
$\overline{x_{i}}$
) is $(1-\overline{\theta })x_{i}$
, and aggregate supply
$(1-\overline{\theta })x_{i}$
, and aggregate supply $(\overline{X)}$
is the sum of
$(\overline{X)}$
is the sum of $\overline{x_{i}}$
across producers. In simple terms, farmers choose how much to plant based on what they expect. But some crops might be lost due to nematodes, and their actual harvest is lower than what they planted. The more they expect to lose, the more they might plant, but this comes at a cost. The model captures how farmers try to balance this tradeoff. Prices (
$\overline{x_{i}}$
across producers. In simple terms, farmers choose how much to plant based on what they expect. But some crops might be lost due to nematodes, and their actual harvest is lower than what they planted. The more they expect to lose, the more they might plant, but this comes at a cost. The model captures how farmers try to balance this tradeoff. Prices ( $\overline{p}$
) are set based on this expected quantity. We assume a constant-elasticity inverse demand function:
$\overline{p}$
) are set based on this expected quantity. We assume a constant-elasticity inverse demand function:
 $$\overline{p}=a\overline{X}^{b},$$
where a > 0 is a demand shifter and b < 0 corresponds to the inverse of the price elasticity of demand.
What distinguishes this setup from standard models is that producers must choose planting levels before knowing the exact extent of infestation. While some nematode damage is anticipated and thus incorporated into planting decisions, actual damage may deviate from expectations due to stochastic factors like weather or soil variability. This creates two distinct scenarios: (1) anticipated yield loss, where farmers adjust planting in response to expected damage; and (2) unanticipated yield shocks, which occur after planting and cannot be accommodated ex ante.
3.2. Costs and nematode impacts
We assume that production involves two types of costs: a fixed cost per unit planted (cp) and an additional cost for harvesting marketable potatoes (ch). This structure reflects the fact that growers incur expenses on all planted acreage regardless of whether the crop is ultimately harvested. However, only the non-damaged portion incurs the additional harvest and post-harvest costs necessary to bring it to market (ch + cp).
This cost asymmetry is economically important. Pest pressure not only lowers yield but also shifts average costs upward, since fewer harvested units must cover the full cost burden of production. Farmers therefore face a tradeoff between planting more to hedge against losses and incurring higher average costs if the pest burden exceeds expectations. This mirrors real farm decisions. All planted acres cost money even if some are lost due to pests. But farmers only pay harvesting and packing costs for the healthy part of the crop. So, if damage is high, their average cost per marketable unit rises quickly.
3.3. Producer behavior under expected losses
Assuming that all producers share the same expectation of yield loss $\overline{\theta }$
, each chooses xi to maximize expected profit. Profit is defined as revenue from marketable output minus the total costs of planting and harvesting and is expressed as:
$\overline{\theta }$
, each chooses xi to maximize expected profit. Profit is defined as revenue from marketable output minus the total costs of planting and harvesting and is expressed as:
 $$\Pi _{i}=(1-\overline{\theta })x_{i}a\overline{X}^{b}-(1-\overline{\theta })c_{h}x_{i}-c_{p}x_{i}.$$
Under symmetry, each firm’s decision problem is identical, and aggregate outcomes can be solved in equilibrium. The model yields expressions for optimal planting, expected output, market price, and profit as functions of biological damage $\overline{\theta }$
, cost parameters, demand elasticity, and the number of competing firms. This shows that when farmers expect damage, they may plant more to offset expected losses, but only if the extra costs are worth it. In highly competitive markets with low margins, even small changes in pest pressure can influence planting decisions. These relationships between biological loss
$\overline{\theta }$
, cost parameters, demand elasticity, and the number of competing firms. This shows that when farmers expect damage, they may plant more to offset expected losses, but only if the extra costs are worth it. In highly competitive markets with low margins, even small changes in pest pressure can influence planting decisions. These relationships between biological loss $(\overline{\theta })$
, costs (cp,ch), and market conduct (N) form the conceptual basis for the empirical supply and demand system estimated in Section 4.
$(\overline{\theta })$
, costs (cp,ch), and market conduct (N) form the conceptual basis for the empirical supply and demand system estimated in Section 4.
In this setting, changes in the anticipated level of pest damage lead producers to adjust planting levels. If demand is highly inelastic, farmers may overplant to ensure sufficient market supply. But when the marginal cost of additional planting outweighs the expected revenue gains, they may instead reduce the acreage. These strategic responses depend critically on market structure and cost conditions.
3.4. Consequences of unexpected yield shocks
Even when producers optimize against expected losses, the actual infestation rate (θ) may differ from the expected infestation rate ( $\overline{\theta }$
). When
$\overline{\theta }$
). When $\overline{\theta }$
≠ θ, aggregate supply shifts unexpectedly, creating short-term disruptions in both price and profitability.
$\overline{\theta }$
≠ θ, aggregate supply shifts unexpectedly, creating short-term disruptions in both price and profitability.
If the realized infestation is worse than expected, the quantity reaching market falls, which raises prices. However, because farmers cannot adjust output after planting, profits fall unless higher prices fully compensate for lower volumes, which is a rare outcome in markets with inelastic demand. On the consumer side, unexpected price hikes reduce surplus, particularly for essential goods like staple foods.
In contrast, if nematode damage is less than expected, producers may harvest more than anticipated, pushing prices down. Again, this is unfavorable for producers if the added revenue does not cover the cost of harvesting the surplus crop.
In the real-world, this is like a sudden increase in disease during a growing period. Once the crops are planted, farmers cannot change their decisions. Prices might go up because there is less supply, but producers can still lose money if the higher price does not make up for the smaller harvest. This kind of uncertainty creates financial risk and leads to inefficiencies, especially for perishable crops like potatoes where harvest and marketing timelines are critical.
3.5. Long-run market outcomes and welfare effects
The long-run impact of persistent nematode pressure depends not only on average yield loss but also on how markets transmit those effects. In oligopolistic settings, firms may limit output strategically to maintain higher prices. When pest pressure declines, this incentive weakens, leading to market expansion and falling prices. The result is a redistribution of welfare: consumers benefit from lower prices and greater availability, while producers may see profits decline unless they capture scale efficiencies or adopt cost-saving technologies. These long-run effects are important for understanding how the industry evolves. If nematodes pressure decreases, consumers may benefit from lower prices, but producers may not especially in concentrated markets where a few firms can control output.
We derive comparative statics showing how consumer surplus and producer profits change with variations in both expected and realized nematode severity. Importantly, while consumers unambiguously benefit from reductions in pest pressure (due to lower prices), producer responses are more complex and contingent on demand elasticity, cost structure, and market conduct. These comparative static relationships will later be simulated using parameters derived from the estimated 3SLS model, allowing empirical welfare effects to be linked directly to the theoretical predictions.
3.6. Implications and link to empirical strategy
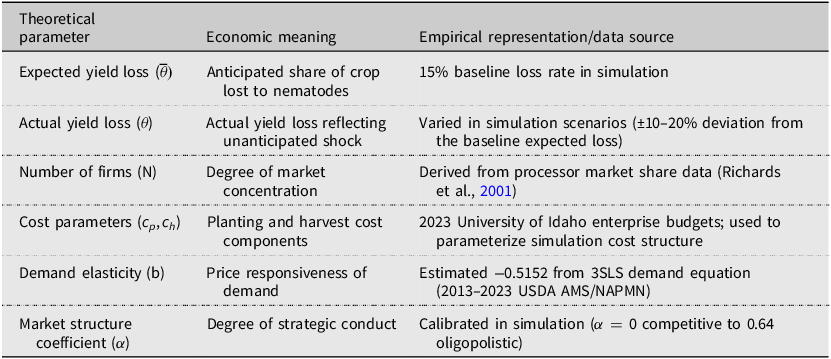
Understanding the distinction between anticipated and unanticipated yield losses is crucial because it determines how flexibly farmers can adjust their production and marketing decisions within the relevant timeframe. Anticipated losses allow for strategic planning, such as adjusting acreage or inputs. However, unanticipated shocks constrain producers’ ability to adjust input use or output level because these shocks occur after the decisions have already been made. Our empirical analysis is designed to capture these different effects in real-world market data. To make this explicit, Table 1 summarizes how the main theoretical parameters correspond to their empirical representations. This mapping clarifies how concepts such as expected loss, cost structure, and market concentration are operationalized in the estimation. While estimates vary by region, field studies in Idaho and the PNW report yield losses ranging from 10–20% under unmanaged pressure (Koirala et al., Reference Koirala, Watson, McIntosh and Dandurand2020; Price et al., Reference Price, Coyne, Blok and Jones2021). Thus, we adopt 15% as a central baseline.
Mapping between theoretical parameters and empirical variables

Table 1 Long description
A table mapping theoretical parameters to their empirical representations in an economic study. The table has three columns: Theoretical parameter, Economic meaning, and Empirical representation/data source. It contains six rows, each representing a different parameter. Row 1: Theoretical parameter, Expected yield loss; Economic meaning, Anticipated share of crop lost to nematodes; Empirical representation/data source, 15 percent baseline loss rate in simulation. Row 2: Theoretical parameter, Actual yield loss; Economic meaning, Actual yield loss reflecting unanticipated shock; Empirical representation/data source, Varied in simulation scenarios plus or minus 10 to 20 percent deviation from the baseline expected loss. Row 3: Theoretical parameter, Number of firms; Economic meaning, Degree of market concentration; Empirical representation/data source, Derived from processor market share data. Row 4: Theoretical parameter, Cost parameters; Economic meaning, Planting and harvest cost components; Empirical representation/data source, 2023 University of Idaho enterprise budgets; used to parameterize simulation cost structure. Row 5: Theoretical parameter, Demand elasticity; Economic meaning, Price responsiveness of demand; Empirical representation/data source, Estimated minus 0.5152 from 3 S L S demand equation. Row 6: Theoretical parameter, Market structure coefficient; Economic meaning, Degree of strategic conduct; Empirical representation/data source, Calibrated in simulation alpha equals 0 competitive to 0.64 oligopolistic.
This theoretical framework provides the basis for our empirical approach, which estimates a system of supply and demand equations for potatoes and simulates the welfare effects of nematode control under different assumptions about anticipation and market behavior. Our goal is not only to quantify losses but to understand their sources: biological, behavioral, and structural, and thereby inform more targeted and effective policy interventions.
4. Empirical estimation
Following the theoretical framework summarized in Table 1, this section empirically estimates the supply and demand for potatoes using monthly U.S. data from 2013 to 2023. The parameters estimated here mainly the price elasticity of demand, which is used later to simulate how anticipated and unanticipated nematode losses affect market prices, profits, and welfare.
The 3SLS approach provides a consistent way to estimate these relationships while accounting for the joint determination of price and quantity under imperfect competition.
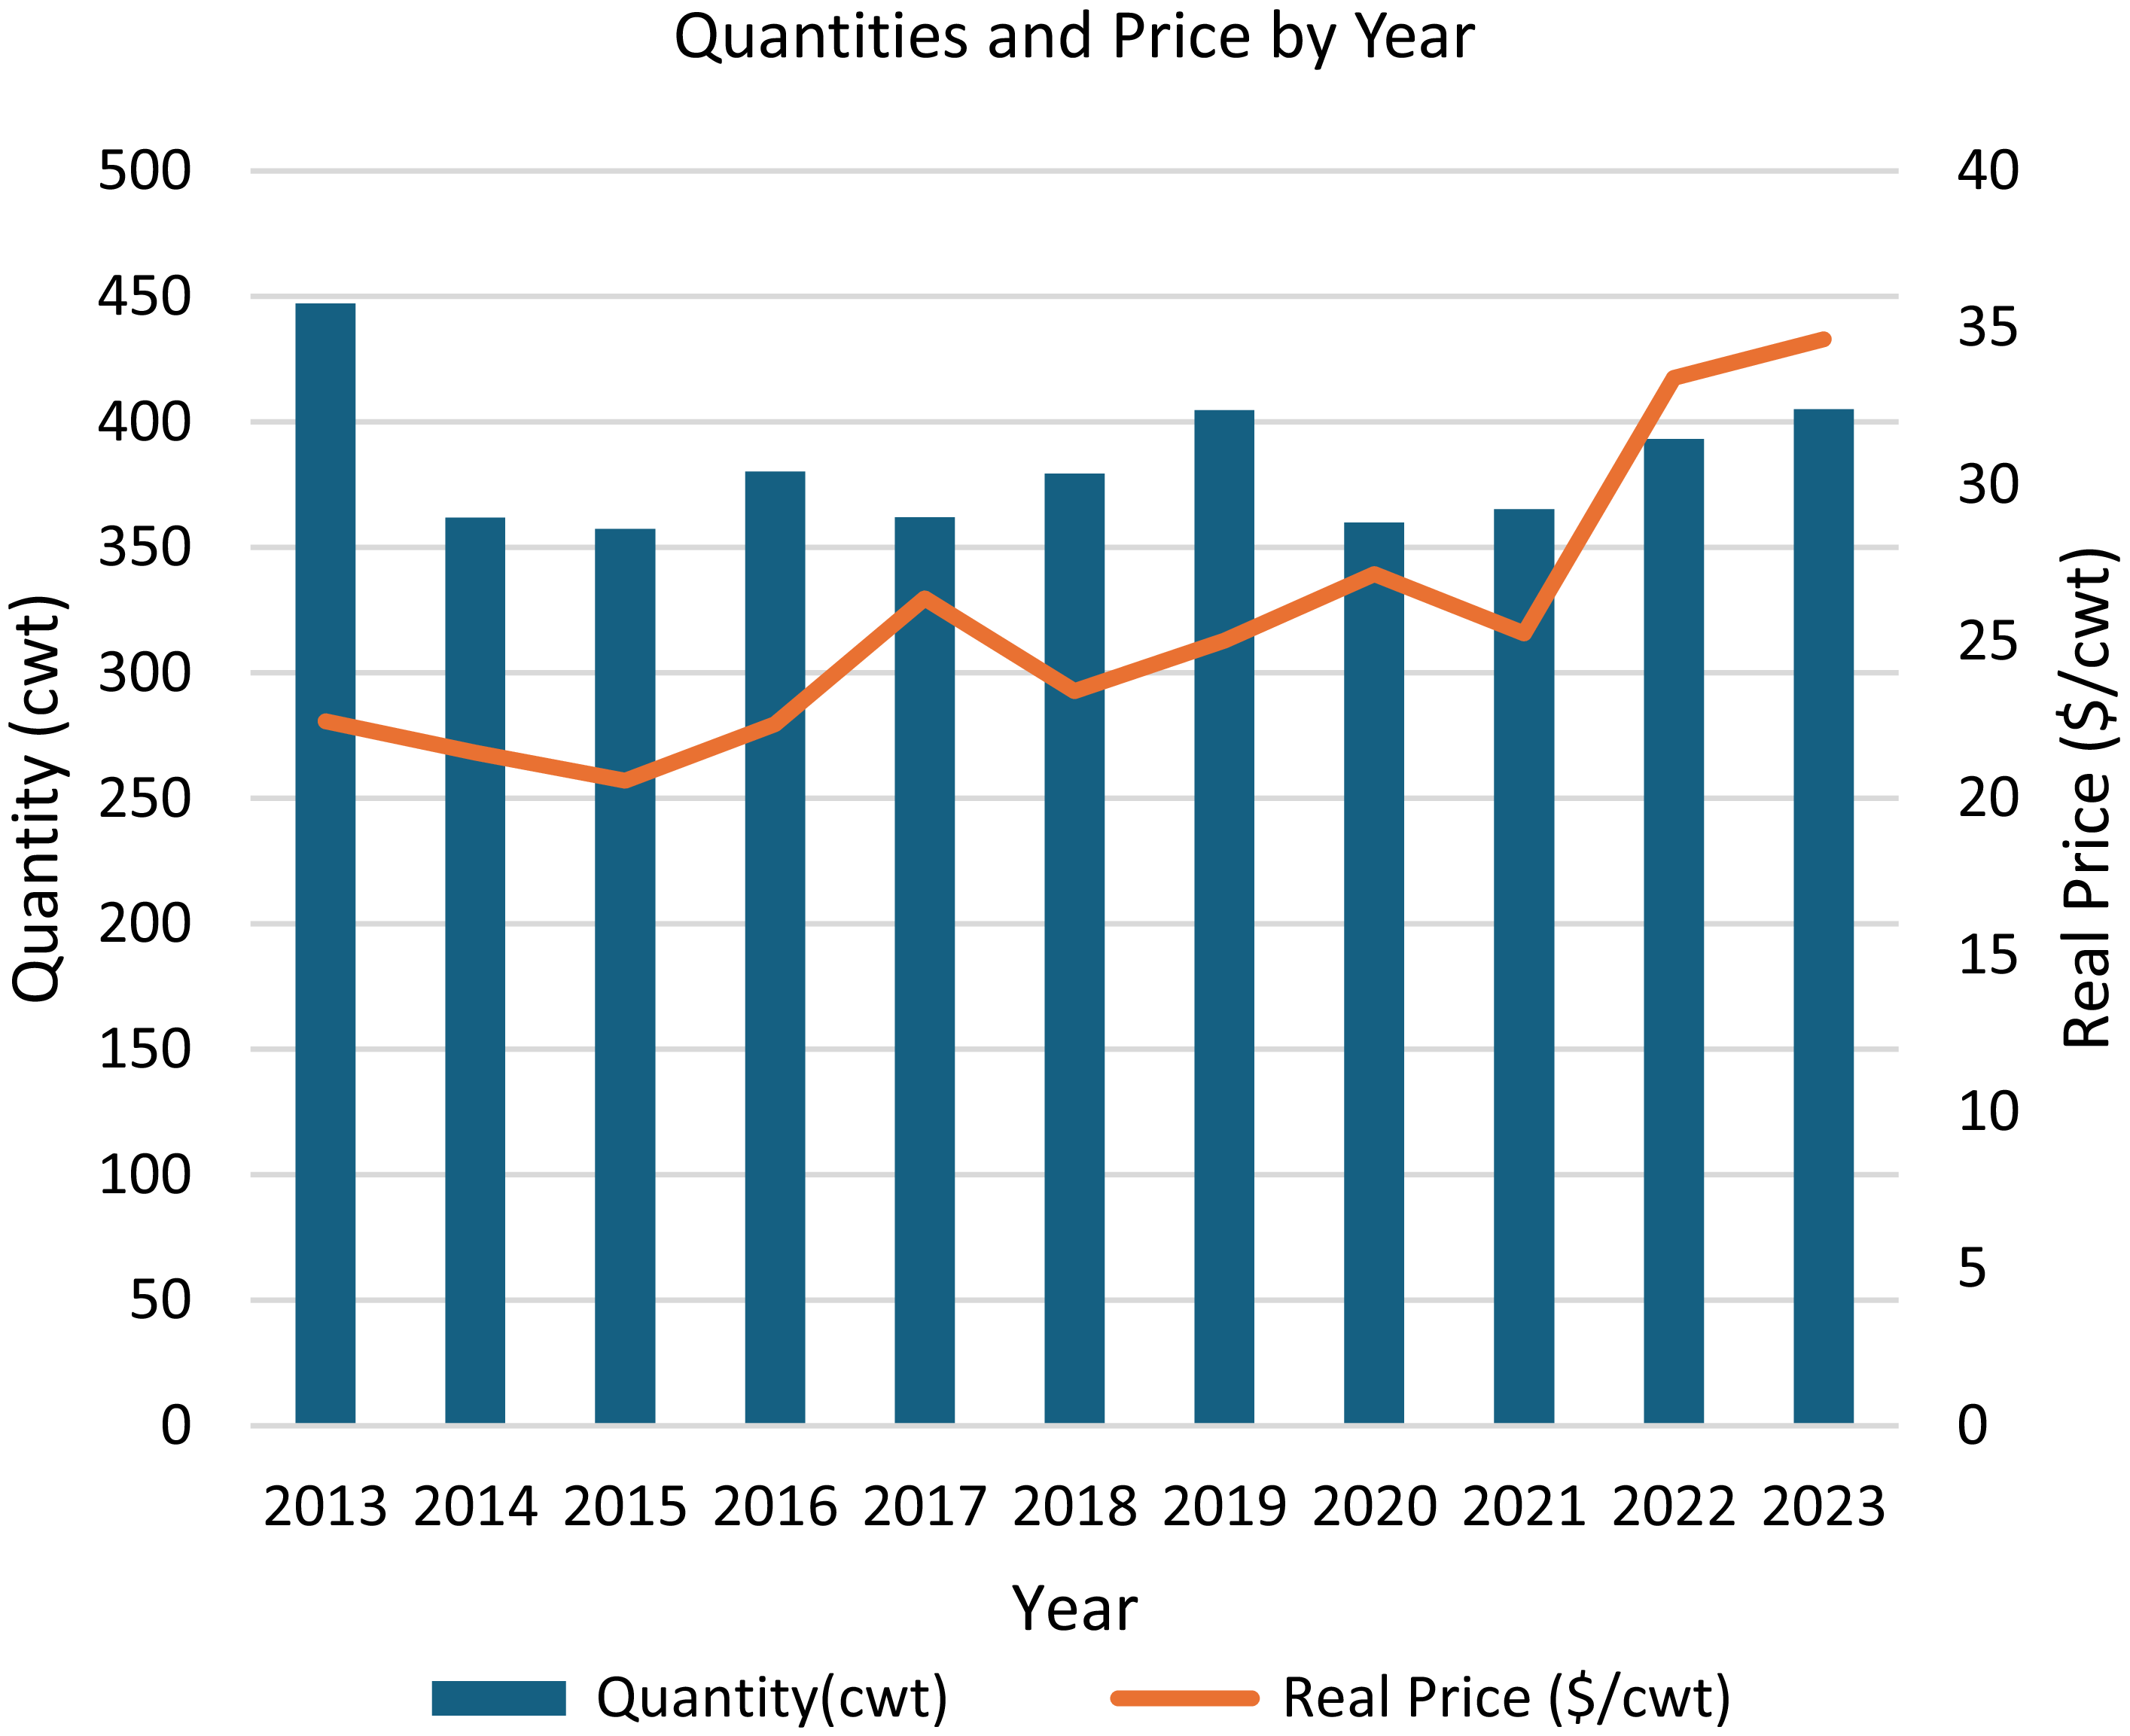
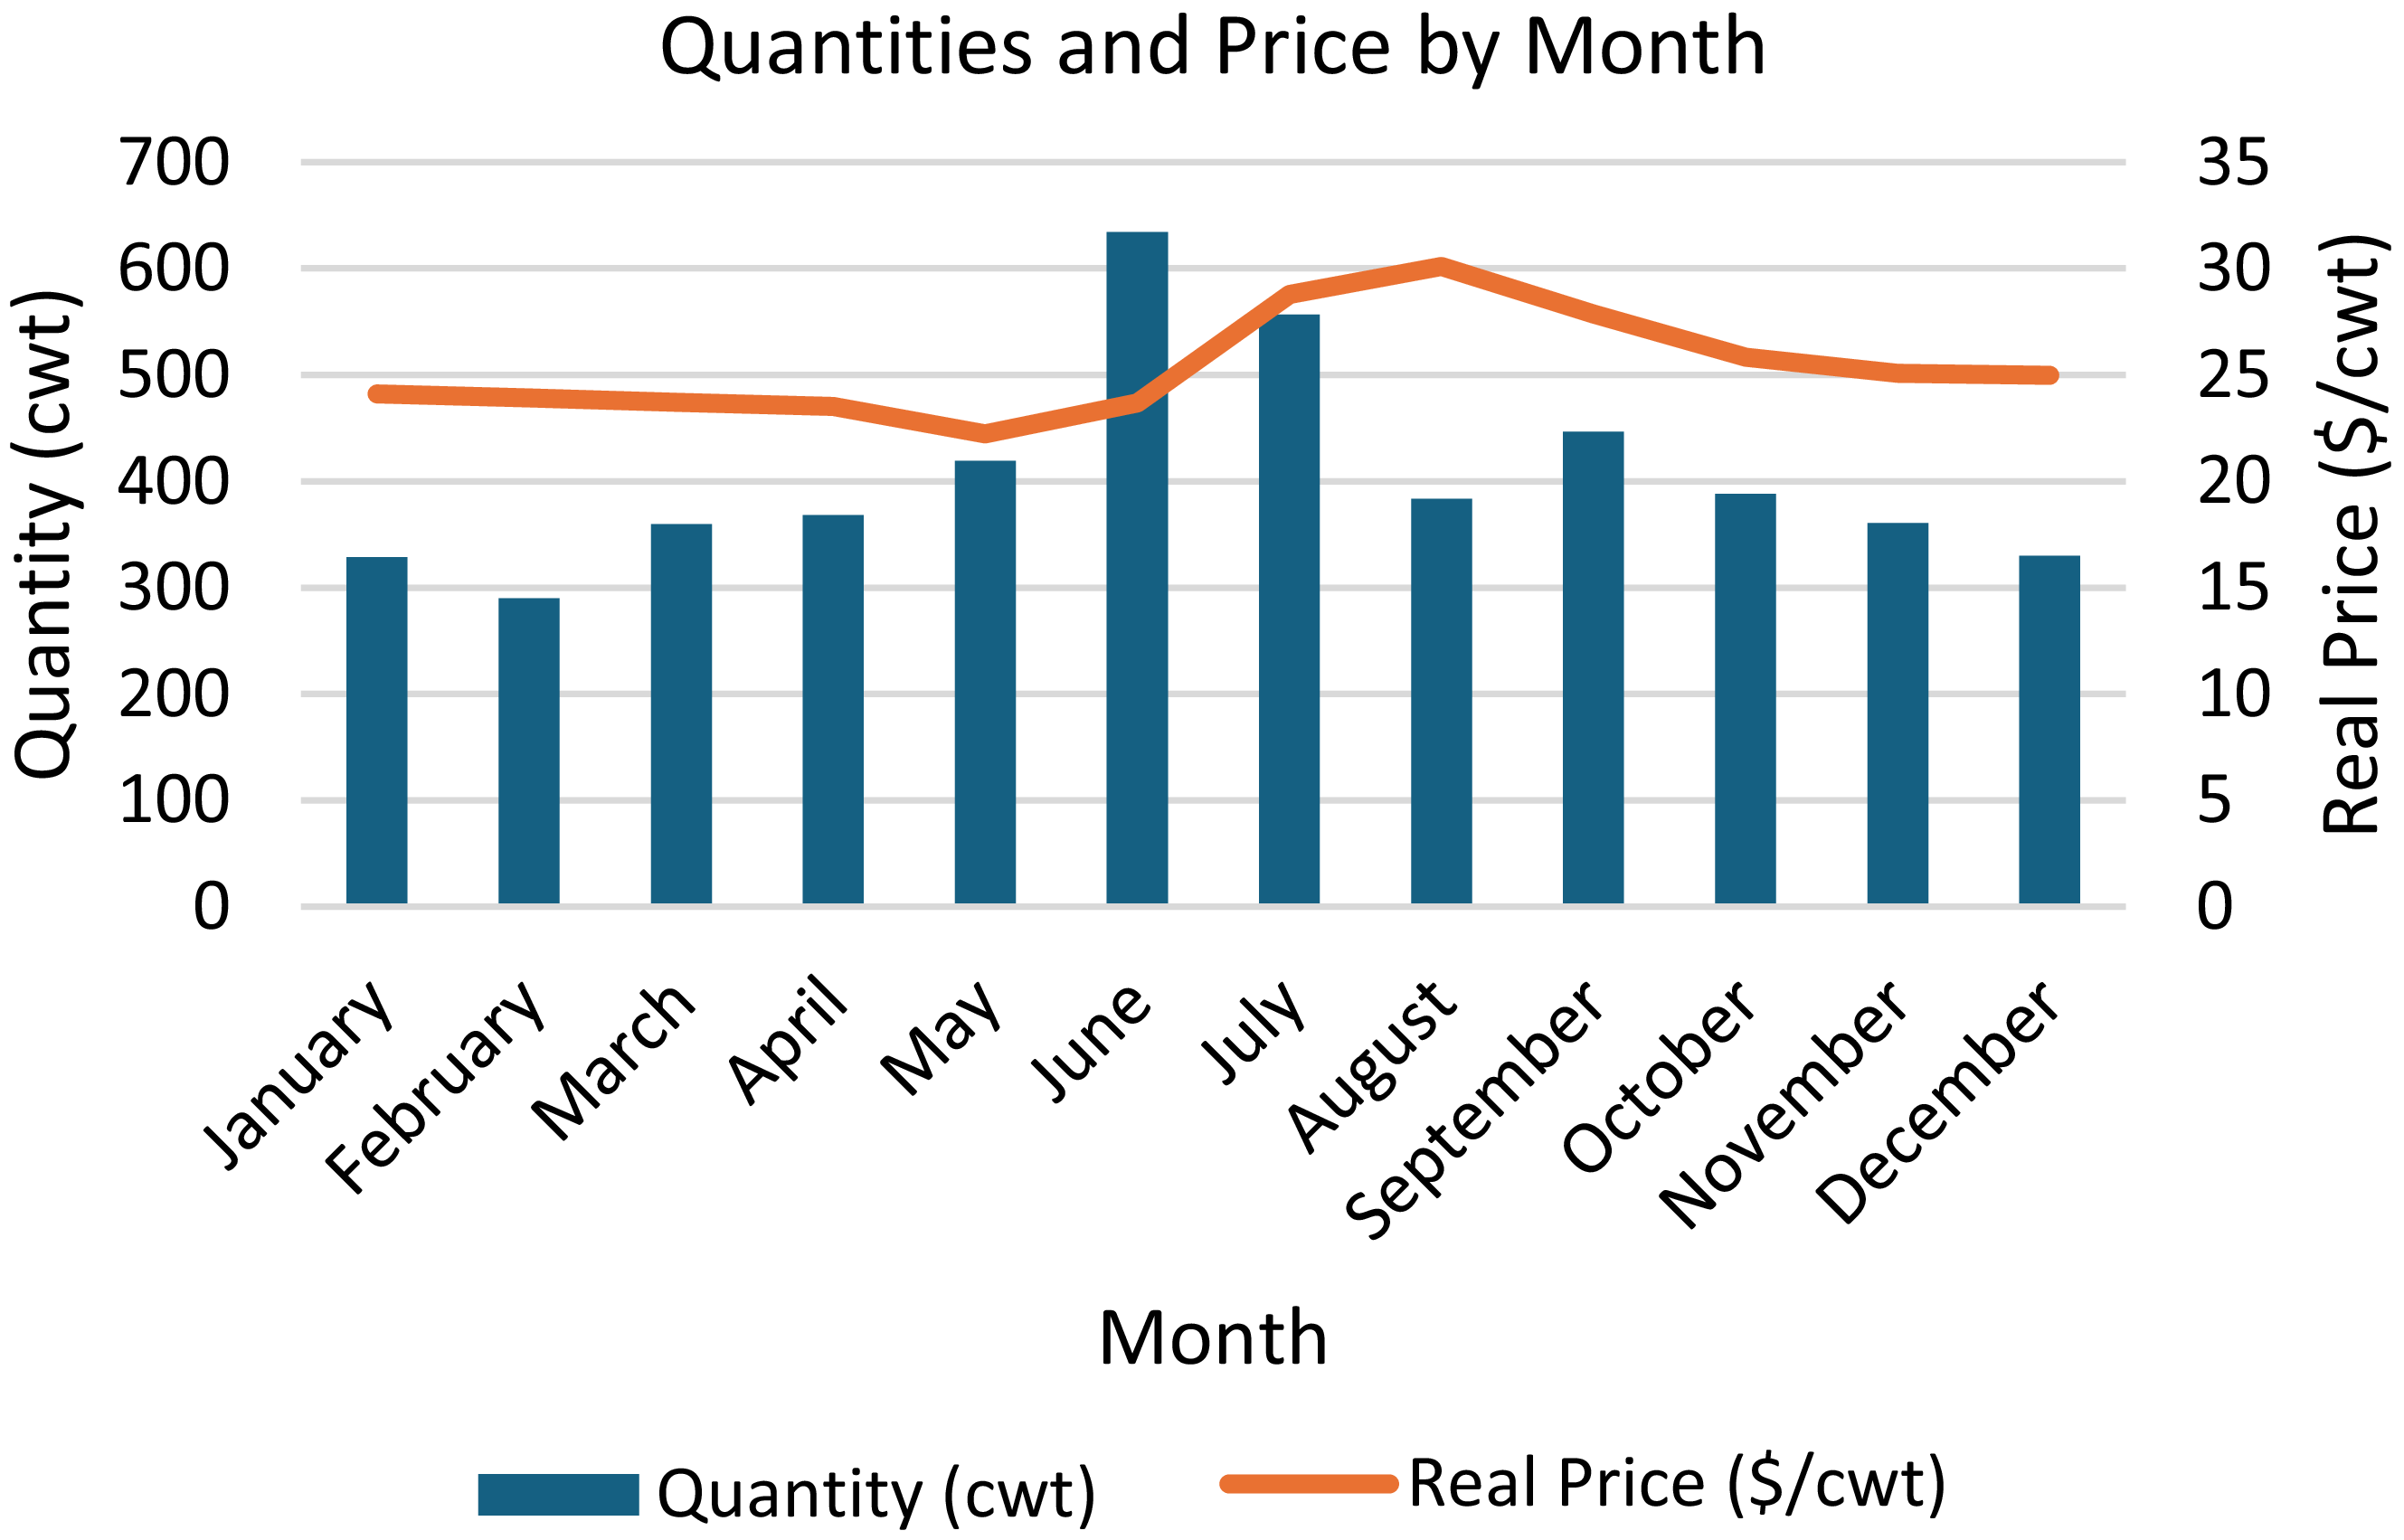
We use monthly U.S. potato shipping point prices from the USDA-AMSFootnote 1 (United States Department of Agriculture - Agricultural Marketing Services) and shipment quantities from the North American Potato Market News (NAPMN). Shipping point prices represent the price at the location where potatoes are packed and prepared for shipment which is just after harvest and grading, but before they reach wholesalers or retailers. These prices include cleaning, grading, and packing costs but exclude long distance transportation to the final market. The data was weekly data which we aggregated to a monthly state-wise data. Our study focuses on the top nine potato producing states: Idaho, Washington, Wisconsin, North Dakota, Oregon, Colorado, Maine, Minnesota, and Michigan. We include four major varieties of potato commonly traded in the U.S. namely Russet, Red, White, and Yellow potatoes. Price data were adjusted for inflation using the Consumer Price Index (CPI) for All Urban Consumers, with 2023 as the base year. Quantity data were left in nominal terms. These data are used to estimate demand and supply for potatoes and then use those estimates to calculate the economic effects of unanticipated and anticipated changes in nematode pressure affect market outcomes such as prices, profits, and consumer surplus. Figure 1 shows the yearly quantity and price of potato over the time-period. Figure 2 shows the quantities and prices of potato for each month, and there is evidence of seasonality in the potato market.
Quantities and price by year.

Quantities and price by month.

4.1. Regression model
To connect our theoretical model to real-world data, we estimate the following system of equations.
The supply equation is given by:
 $$\begin{align}\ln ({p_{it}}) = &{\beta _0} + {\beta _1}\ln ({q_{it}}) + {\beta _2}\ln (landvalue) + {\beta _3}\ln (gasoline) + {\beta _4}FFR + \sum\limits_{y = 5}^{14} {{\beta _y}} Yea{r_t} \\&+ \sum\limits_{m = 15}^{25} {{\beta _m}} Mont{h_t} + \sum\limits_{b = 26}^{28} {{\beta _b}} Variet{y_i} + {\epsilon_{it}},\end{align}$$
where pit represents the real price of potato for variety i in time t, and qit represents the quantity of shipment in cwt during that month. Land value Footnote 2 represents the value of land for that year. Gasoline Footnote 3 represents the consumer price index for all urban consumer: Gasoline (all types) in U.S. city. FFR Footnote 4 is the federal fund rate for the month and acts as a proxy for the cost of capital. Montht is the month of shipment which includes every month except January, which is the base month. Yearly fixed effects are also used along with the base year as 2019. The dummy variables for the variety of potatoes are also used. Variety includes variables for Russet, White, Yellow while Red is omitted due to dependency.
The demand equation is given by:
 $$\begin{align}\ln \left({{q_{it}}} \right) = &{\gamma _0} + {\gamma _1}\left({{p_{it}}} \right) + {\gamma _2}\ln \left({fpi} \right) + {\gamma _3}\ln \left({rice} \right) + {\gamma _4}\ln \left({ARS} \right) + {\gamma _5}popinm + {\gamma _6}\ln \left({import} \right) \\&+ {\gamma _7}unemploymentrate + \sum\limits_{y = 8}^{17} {{\gamma _y}} Yea{r_t} + \sum\limits_{b = 18}^{20} {{\gamma _b}} Variet{y_i} + \sum\limits_{s = 21}^{28} {{\gamma _s}} Stat{e_i},\end{align}$$
where fpi represents FAO food price indexFootnote 5, rice represents price of riceFootnote 6, which is the substitute for potato, ARS represents Advance Retail Sales: Retail Trade and Food ServicesFootnote 7. Popinm represents the monthly populationFootnote 8 (in million) of the U.S. in that year, import represents the monthly import valueFootnote 9 of potato in that year, unemploymentrate is the total unemployment rateFootnote 10 of the U.S population whose age is 16 year and over. State fixed effects are also used with the base state as Colorado.
Because the supply and demand equations form an over-identified system, we estimate them simultaneously using 3SLS to obtain consistent and efficient parameter estimates. The estimated price elasticity of demand from Equation (4) is used as input for the simulation analysis that quantifies how anticipated ( $\overline{\theta })$
and unanticipated (θ) nematode shocks affect market outcomes under alternative market conduct assumptions.
$\overline{\theta })$
and unanticipated (θ) nematode shocks affect market outcomes under alternative market conduct assumptions.
5. Estimation results
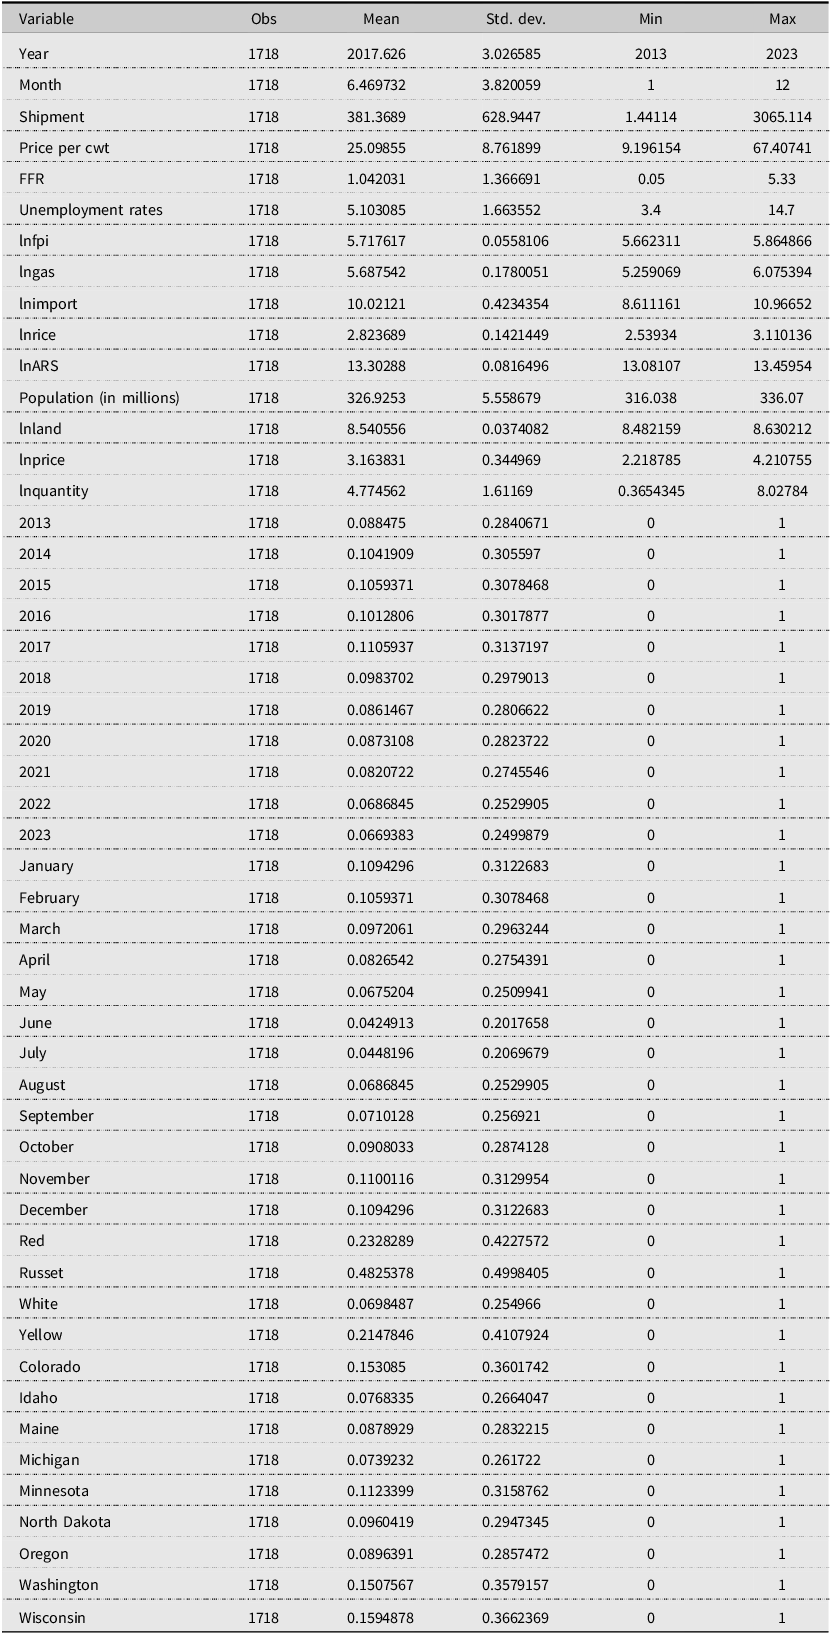
Table 2 gives the summary statistics of the data. The weighted average price per hundredweight (cwt) of potatoes, weighted by shipment quantities, is $21.48, thus the average price per pound is $0.2148. The average monthly shipments are 381.369 thousand cwt (or 38.14 million pounds). Table 2 shows that of all observations, 23.28% correspond to red potato, 48.25% to Russet, 6.98% to white, and 21.48% to yellow potato.
Summary statistics

Table 2 Long description
The table presents summary statistics of potato shipment data. It includes 1718 observations with variables such as year, month, shipment, price per cwt, and different potato types. Key variables include Year with a mean of 2017.626 and range from 2013 to 2023, Month with a mean of 6.469732 and range from 1 to 12, and Shipment with a mean of 381.369 thousand cwt and range from 0 to 3065.114 thousand cwt. Price per cwt has a mean of 25.0855 with a range from 9.196154 to 67.40741. The table also includes data on FFR, Unemployment rates, Infpi, Ingas, Inimport, Inrice, InARS, Population, Inland, Inprice, Inquantity, and monthly and yearly breakdowns. Additionally, it categorizes potatoes into types: Red, Russet, White, Yellow, and regional data for states like Colorado, Idaho, Maine, Michigan, Minnesota, North Dakota, Oregon, Washington, and Wisconsin.
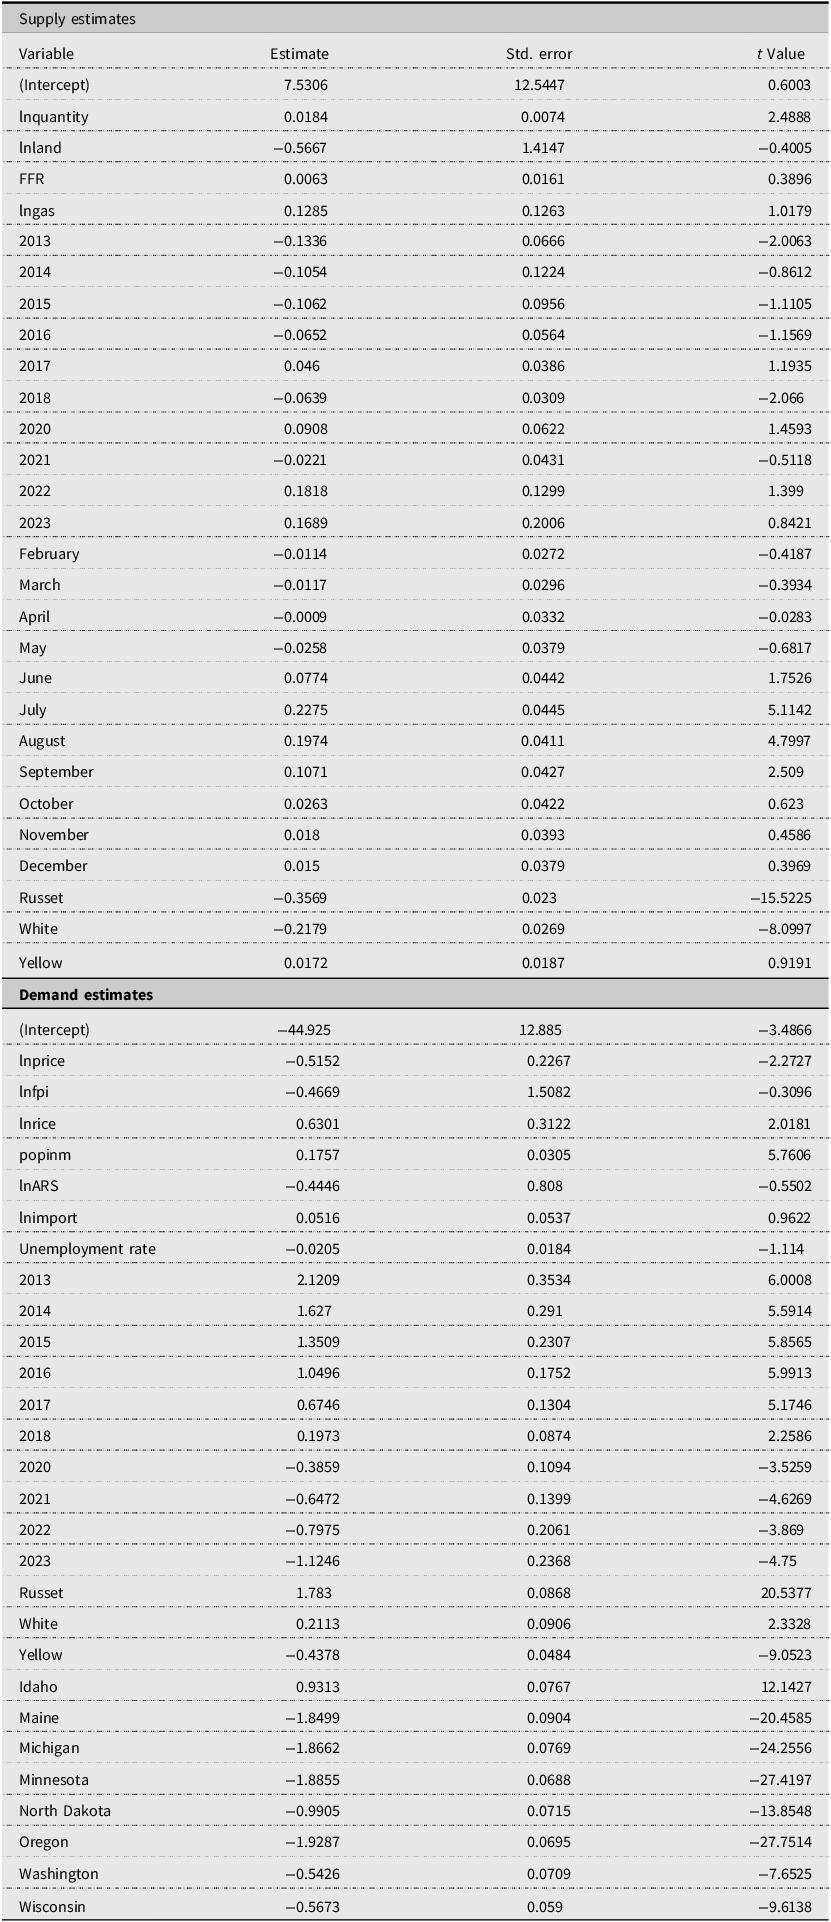
Table 3 shows the regression estimates. For the supply estimation, the estimate for quantity (0.0184) is positive and statistically significant at the 5% level, indicating an elastic upward sloping supply curve. The dummy variables for July (0.2275), August (0.1974), and September (0.1071) are all positive and statistically significant at the 5% level, suggesting seasonal peaks in potato prices during these months which might be due to seasonal harvest cycles, storage capacity constraints, or fresh market premiums (Richards et al., Reference Richards, Patterson and Acharya2001). The year dummies for 2013 and 2018 are statistically significant from the base year 2019. Among varieties, Russet and White differ significantly from Red, whereas Yellow does not. Land value and federal fund rates are not statistically significant.
Supply and demand estimation

Table 3 Long description
The table presents regression estimates for supply and demand variables. It has 68 rows and 6 columns. The columns are labeled Variable, Estimate, Std. error, and t Value. The table is divided into two sections: Supply estimates and Demand estimates. Each section lists various variables along with their corresponding estimates, standard errors, and t-values. Notable variables include Inquantity, Inland, FFR, Ingas, and various year and month dummies. The table also includes different potato varieties like Russet, White, and Yellow. The Demand estimates section includes variables such as Inprice, Inpf1, Inrc1, popinm, InARS, Inimport, and Unemployment rate, along with year dummies and regional dummies for states like Idaho, Maine, Michigan, Minnesota, North Dakota, Oregon, Washington, and Wisconsin.
R2 – Supply 0.353651.
R2 – Demand 0.831419.
Observations 1718.
On the demand side, although the coefficients for the food price index, import values, and unemployment rate had signs consistent with theory, they are statistically insignificant. The negative coefficient in retail sales was unexpected, though not statistically significant, and may reflect sectoral shifts not captured by aggregate retail indicators. The unemployment rate is directionally reasonable, mentioning higher unemployment can reduce disposable income, leading households to cut back on food spending, including potato consumption (Aguiar and Hurst, Reference Aguiar and Hurst2005). Price of rice, which is the substitute for potatoes, has positive and statistically significant coefficients. A 1% increase in rice prices raises potato demand by 0.63% consistent with prior findings that consumers shift between starchy staples when relative prices change (Blisard et al., Reference Blisard, Variyam and Cromartie2003; Gao et al., Reference Gao, Wailes and Cramer1994). Population of the U.S. is positive and statistically significant, implying that population growth leads to greater potato consumption (Blisard et al., Reference Blisard, Variyam and Cromartie2003). All the years are statistically significant from the base year 2019. All the states are also statistically significant from the base state Colorado. Also, all the varieties were statistically significant from the base variety red. The coefficient for price (−0.5152) is negative and is statistically significant representing inelastic demand, which is typical for staple commodities like potatoes (Dong et al., Reference Dong, Gould and Kaiser2004). This estimate closely aligns with prior findings, such as Richards et al. (Reference Richards, Kagan and Gao1997), who report a short-run elasticity of −0.484, validating the robustness of this parameter across models and time periods.
Given that there are 13.29 billion pounds of potatoes in the market, and the estimate on price is −0.5152, the estimated demand curve is given by, $p=32.51\ \overline{Q}^{-1.94}$
, since b = − 1.94 and
$p=32.51\ \overline{Q}^{-1.94}$
, since b = − 1.94 and $32.51={0.215 \over 13.29^{b}}$
.
$32.51={0.215 \over 13.29^{b}}$
.
Overall, our regression results show that demand for potatoes is inelastic, with a price elasticity estimate of −0.5152, consistent with prior research. Among demand shifters, rice prices and population levels were statistically significant, suggesting substitution effects and demographic influence. On the supply side, seasonality plays a strong role, with summer and early fall months linked to price increases. However, many costs related variables such as land value and federal fund rate showed weaker effects. These patterns set the foundation for our simulation of nematode impacts under different behavioral assumptions.
5.1. Effects of nematodes
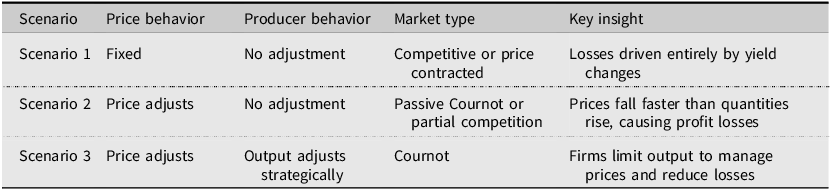
To understand how nematode infestations affect market outcomes, we simulate three scenarios that differ in price and producer response. Scenario 1 assumes a fixed price, representing a highly competitive market or contract pricing. Scenario 2 allows price to adjust along the demand curve but assumes no change in producer behavior. Scenario 3 includes both price adjustment and strategic output decisions, capturing a Cournot-like market with imperfect competition. These scenarios help isolate how market structure and producer flexibility shape the effects of biological shocks on profits and consumer welfare. Table 4 summarizes how the three scenarios differ in terms of pricing behavior, producer response, and market outcomes.
Summary of simulation scenarios showing price and producer response behavior

Table 4 Long description
A table with four rows and four columns. The columns are labeled Scenario, Price behavior, Producer behavior, Market type, and Key insight. The rows are labeled Scenario 1, Scenario 2, and Scenario 3. Row 1: Scenario 1, Fixed, No adjustment, Competitive or price contracted, Losses driven entirely by yield changes. Row 2: Scenario 2, Price adjusts, No adjustment, Passive Cournot or partial competition, Prices fall faster than quantities rise, causing profit losses. Row 3: Scenario 3, Price adjusts, Output adjusts strategically, Couromt, Firms limit output to manage prices and reduce losses.
Non-harvest production costs and harvest production costs were estimated using 2023 enterprise budgetsFootnote 11 and the cost after harvest to packing is calculated from the “An Analysis of Potato Packing Costs in Idaho.”Footnote 12 From the enterprise budget, non-harvest production costs are estimated to be 0.046 dollars per pound, and harvest costs are estimated to be 0.084 dollars per pound of the potatoes. This harvest cost includes all the harvest operations along with the cost of transportation up to shipping point, grading, sorting, packaging, etc. This is because the price data we are using reflects the shipping point price. Using these numbers and Equation (A8) from Appendix A, we can find the market structure for various levels of α. In other words, even if we do not know the exact rate of disease, this allows us to estimate the effects of the disease at various initial disease rates. Given the average price and costs, an α of 0 would give an estimate of N = 4.91 and an α of 0.64 would suggest an oligopoly market. Seasonal shifts in market structure are also a critical factor when supply sources and market concentration vary across the year. As Arnade and Pick (Reference Arnade and Pick2000) show in their analysis of the U.S. fresh fruit market, oligopoly power can vary significantly by month, with market participants exploiting off-season opportunities to extract rents, especially when domestic supply is limited.
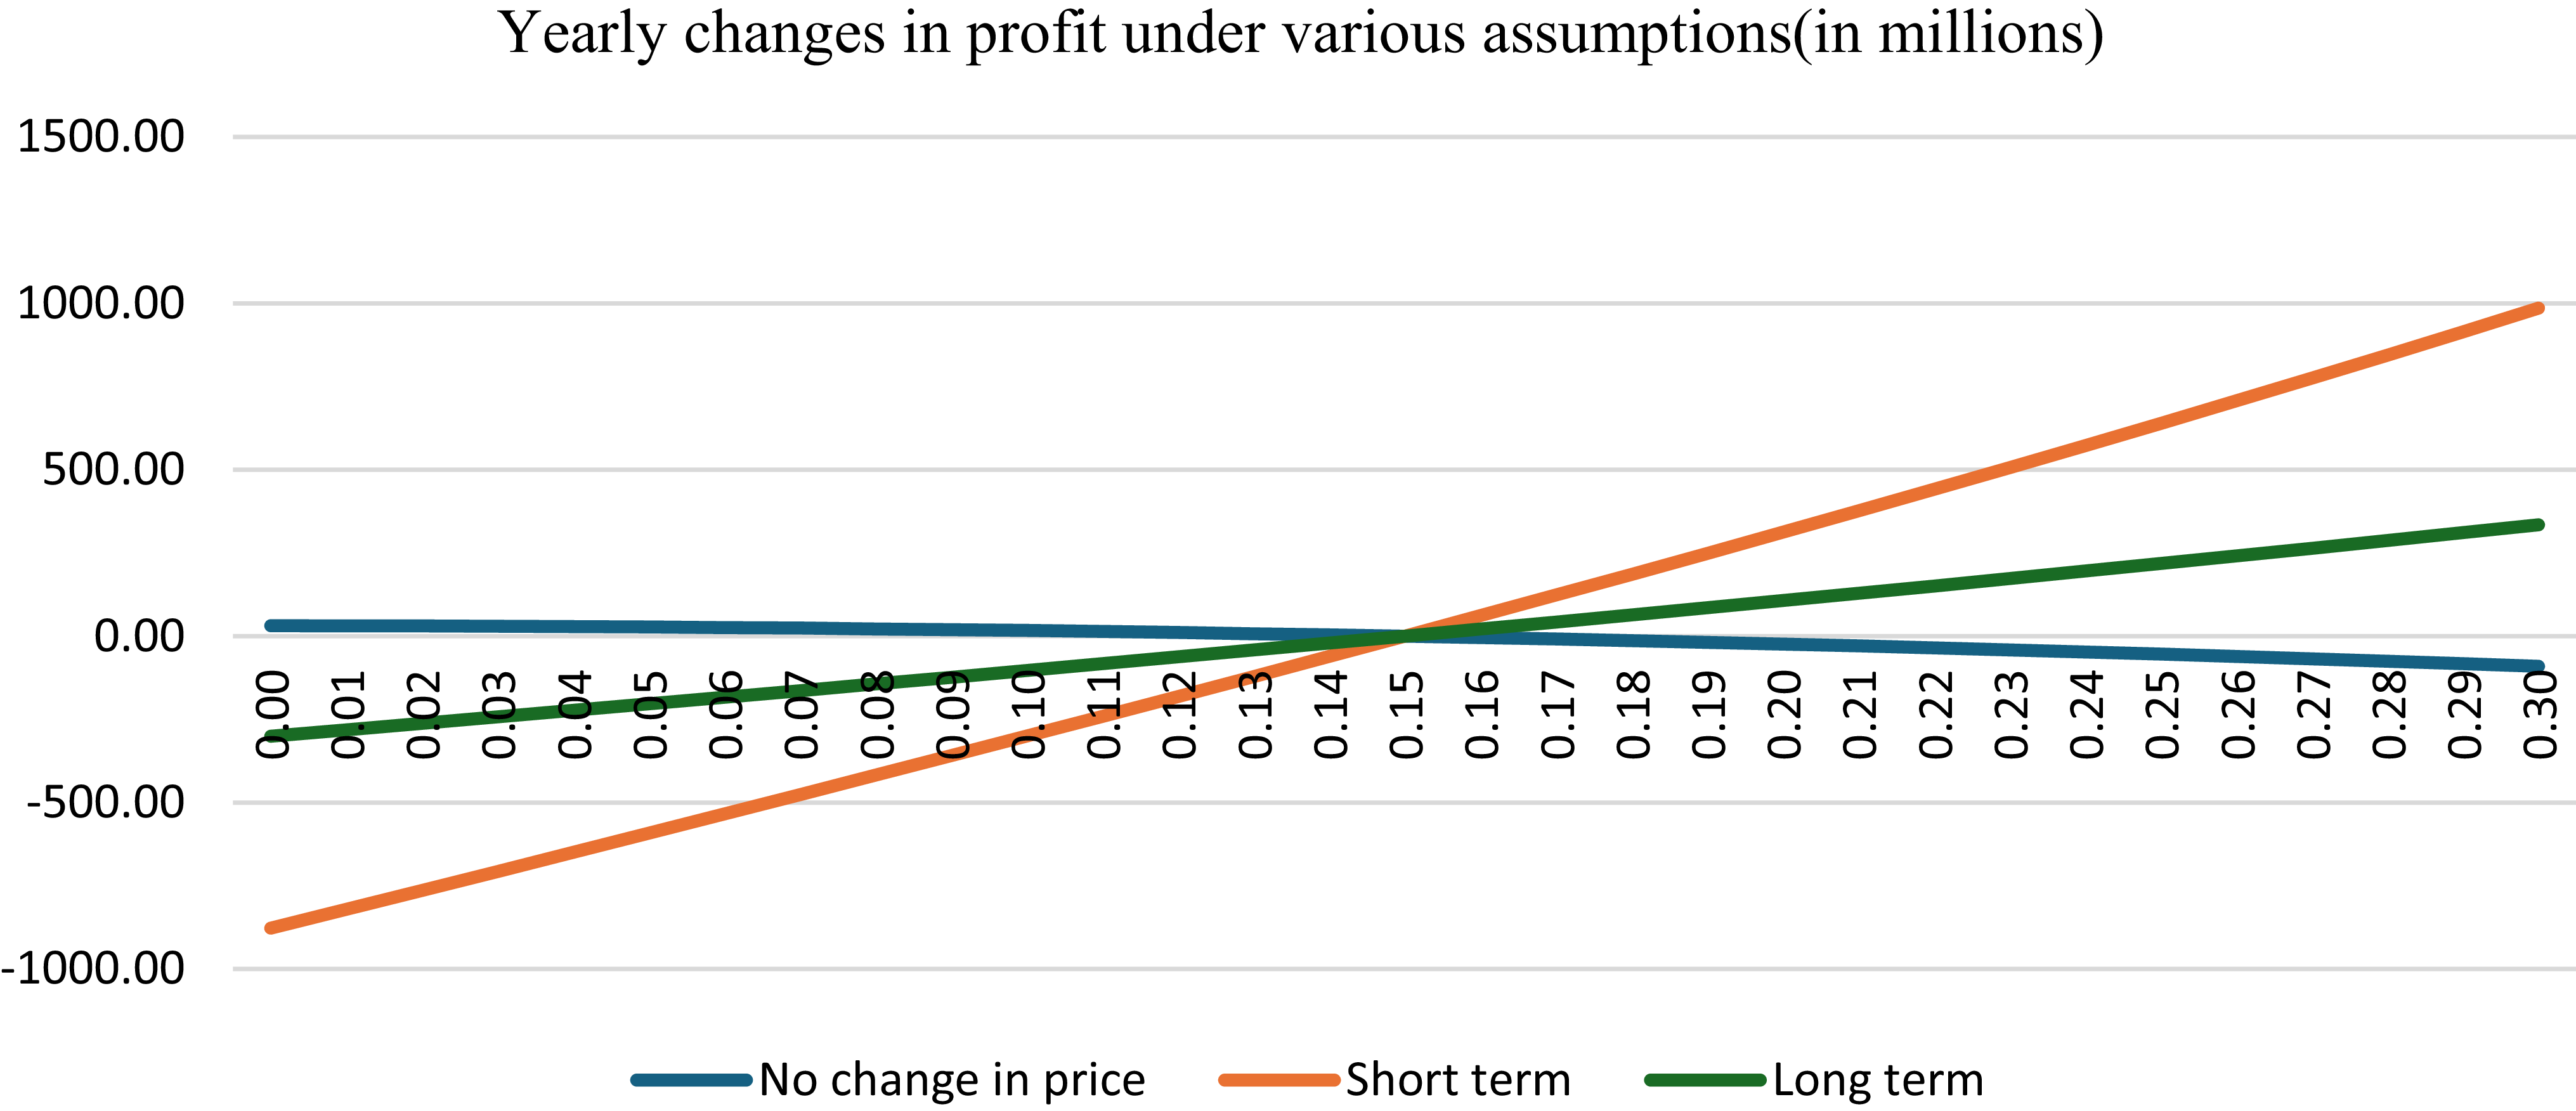
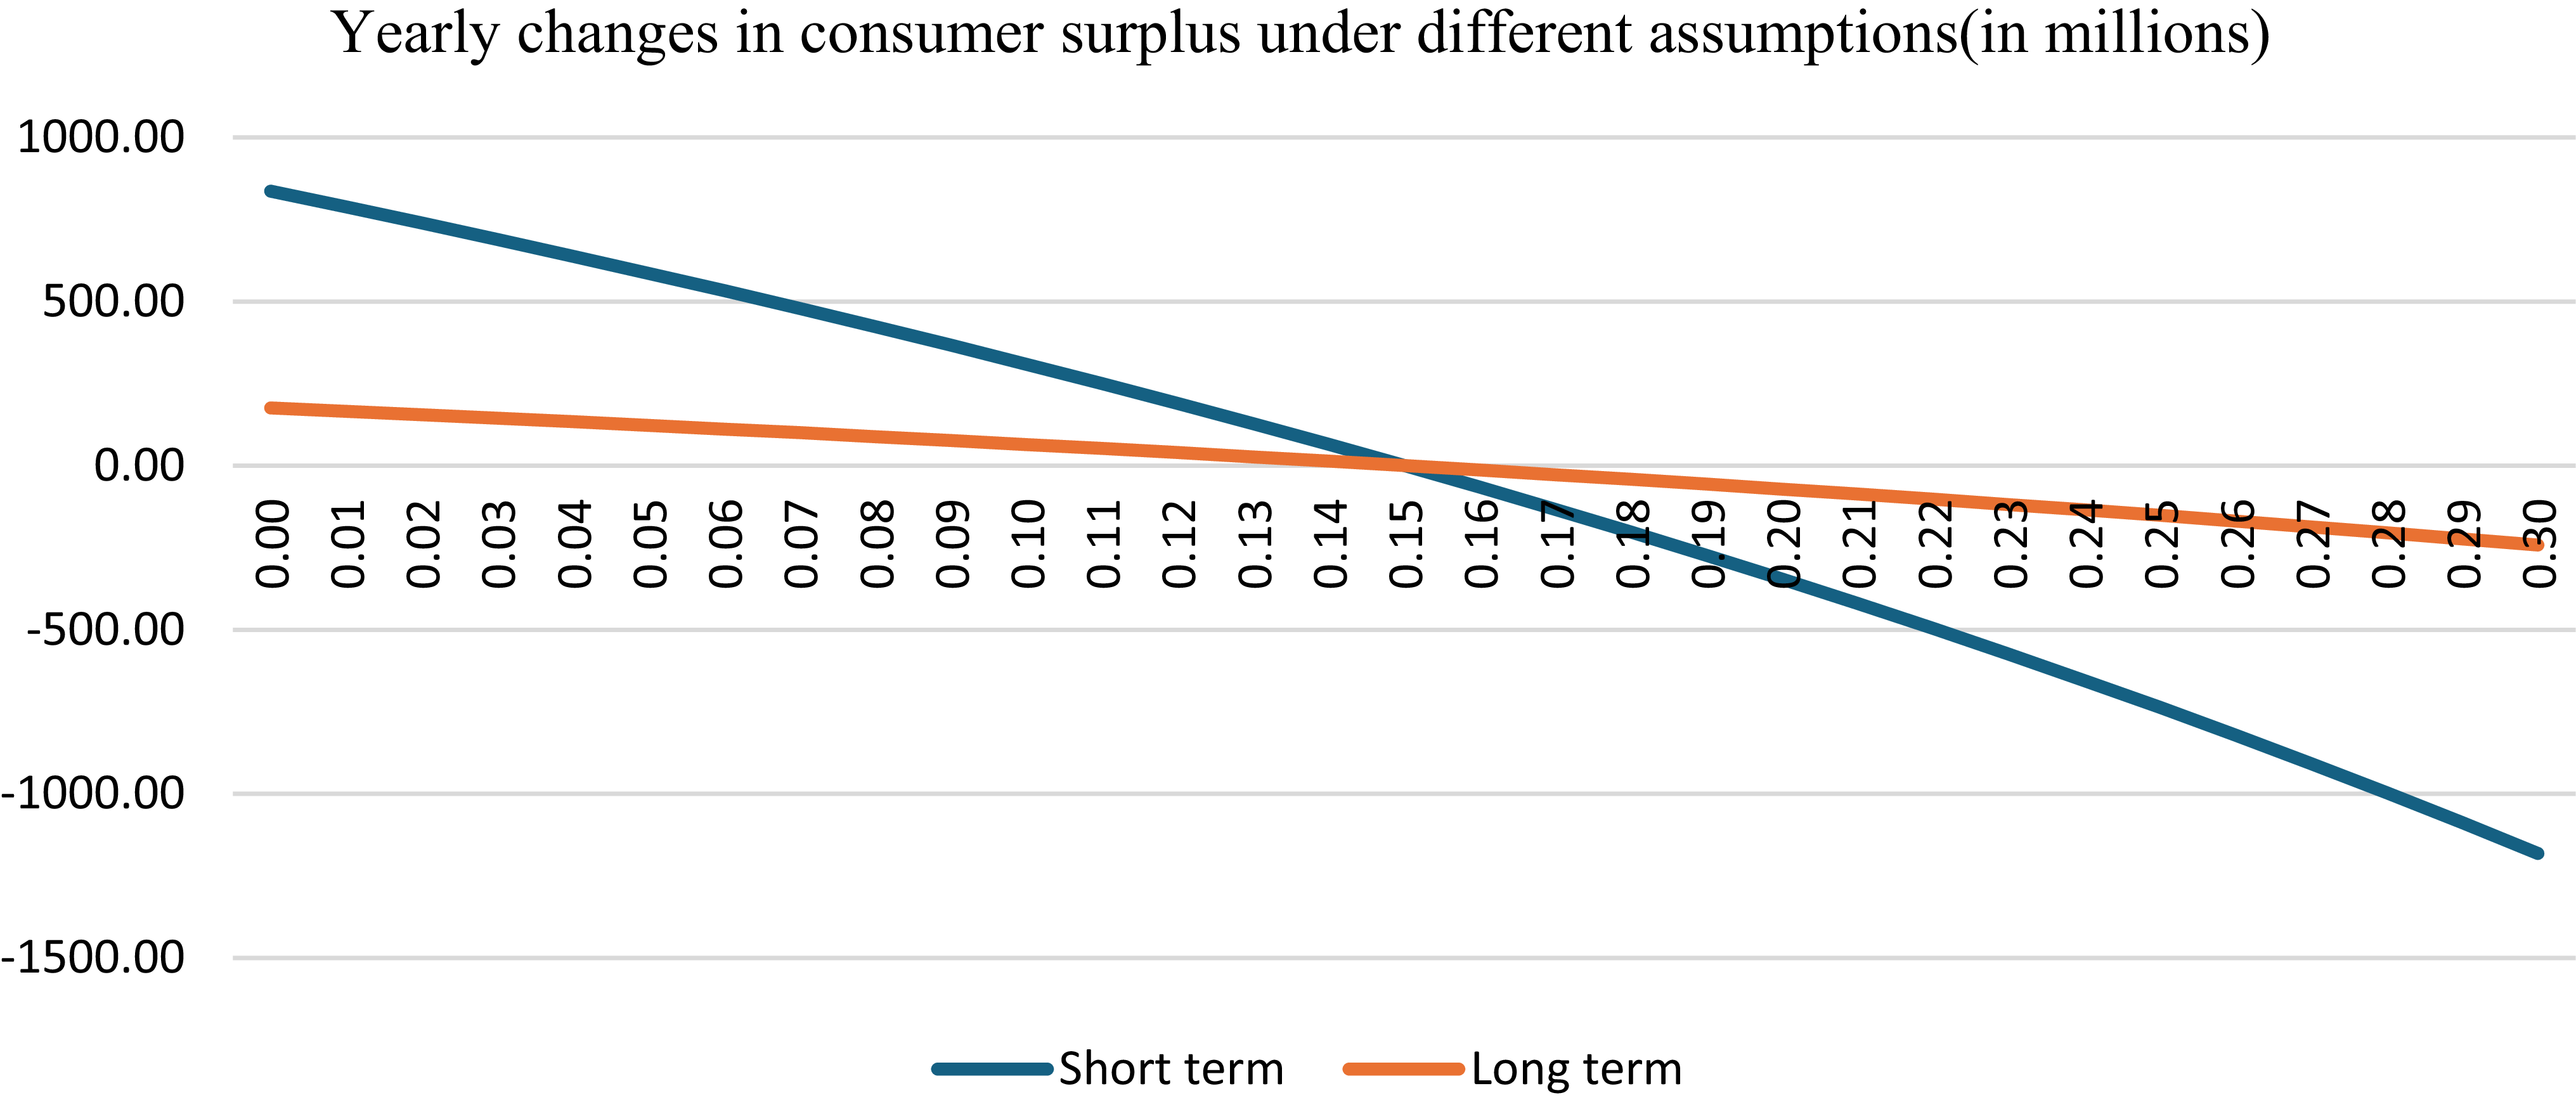
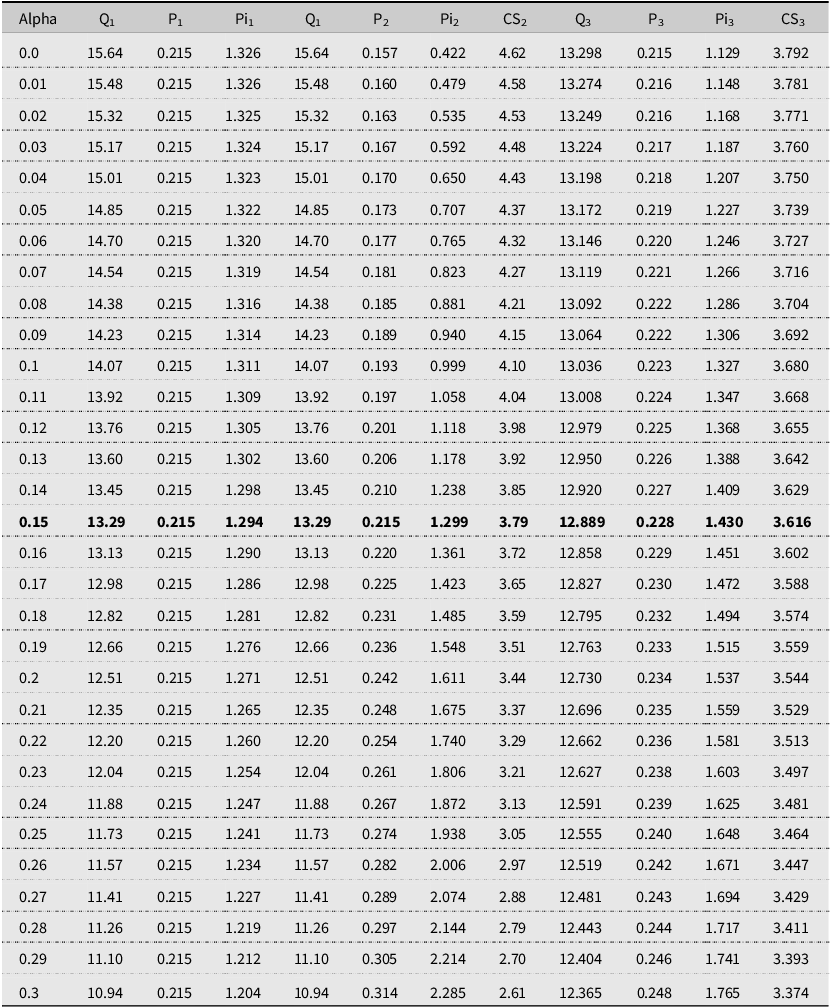
We assume that the current loss from nematodes is 15%. Table 5 reports the effects of nematode infestations on output, prices, profits, and consumer surplus. Figures 3 and 4 shows marginal effects.
Yearly changes in profit under various assumptions.

Yearly changes in consumer surplus under different assumptions.

Nematode simulation

Table 5 Long description
A table with 31 rows and 13 columns. The columns are labeled Alpha, Q 1, P 1, Pi 1, Q 1, P 2, Pi 2, CS 2, Q 3, P 3, Pi 3, and CS 3. The table presents numerical values for each column, showing the effects of nematode infestations on output, prices, profits, and consumer surplus. Each row corresponds to a different value of Alpha, ranging from 0.0 to 0.3 in increments of 0.01. The values in the columns represent different economic factors and their changes due to nematode infestations.
Scenario 1 ‐ Fixed price
Firms are price takers with constant market price of $0.215 per pound regardless of the infestation level. As α increases, output declines which results in a decrease in profit proportionally. This reflects a competitive market with no strategic behavior. These losses in profit are purely due to the nematode infestation. This outcome aligns with the textbook model of perfect competition, where many small firms sell a homogeneous product and take prices as given (Varian, Reference Varian1992). Such rigidity in price may also occur in real-world settings due to contracted pricing, particularly at the shipping point level in agricultural markets.
Scenario 2 – Price adjusts, no producer response
In the second scenario, quantity still increases at the same rate as the first scenario, however, unlike the fixed price setting, the market here is responsive to changes in supply and adjusts along a downward sloping inelastic demand curve, with an estimated price elasticity of demand −0.5152. This means that as quantity rises, prices fall, but because the demand is inelastic, the percentage drop in price is larger than the percentage increase in quantity, and the result is a net decline in total revenue. In this case, prices respond to changes in supply, but producers cannot adjust their planting decisions. This leads to steep profit losses despite output gains, because demand is inelastic.
Producer profit is highest when nematode pressure is high and output is low due to higher prices but as output rises, prices fall and profits decline. As infestation disappears, output peaks, but the price falls sharply, driving profit down by −$880 million compared to baseline 15% damage due to nematode. Meanwhile, the consumer surplus increases sharply with higher output and lower prices, peaking at around $840 million.
This scenario shows what can happen in the short-run when producers can’t easily adjust how much they grow. In agriculture, farmers often make production decisions in advance, so they can’t respond quickly when market conditions change. As a result, when supply increases, prices must adjust instead. Since demand for potatoes is inelastic, even a small increase in quantity leads to a noticeable drop in price. This shift ends up benefiting consumers but hurting producers. From an industrial organization perspective, this aligns with a non-strategic Cournot environment, where firms do not anticipate or internalize the price effects of collective output decisions. The resulting inefficiency mirrors real-world cases where perishable crop markets experience sudden price collapses following uncoordinated supply increases (Sexton, Reference Sexton2013). This underscores how biological shocks can create major inefficiencies when markets are unresponsive particularly in cases of inelastic demand and limited producer coordination.
Scenario 3 – Price and output adjust strategically
In the third scenario, firms adjust both output and price, behaving strategically in response to nematode infestation. Firms limit output during high infestation to stabilize or raise prices reducing the magnitude of their profit losses compared to scenario 2. The consumer surplus still rises with lower nematode infestation but at a slower rate, reflecting more controlled price movements. This behavior matches Cournot-Nash equilibrium outcomes where firms use quantity-setting as a strategic tool. If certain firms act as first movers: for example, by adopting pest control technologies earlier, they can influence rivals and capture a larger share of profits, like Stackelberg leadership. Such strategic supply control is well-documented in the agricultural sector and reflects the nature of imperfect competition (Rusescu, Reference Rusescu2021; Saitone and Sexton, Reference Saitone and Sexton2017b; Tirole, Reference Tirole1988).
Comparative insights
Across the three scenarios, consumer surplus consistently increases as nematode infestations decrease, but the outcomes for producers are more complex. In the short-run, when demand is relatively unresponsive to price, output expansion can depress prices enough to reduce producer profit even as consumer benefit. In the long-run, if producers can adjust strategically, they mitigate some of these losses, though consumer gains are smaller. Overall, these results underscore a clear tradeoff: reducing biological risk improves total welfare, but without coordination or policy support, growers may capture only a limited share of the benefits.
To better understand the drivers of consumer welfare gains when nematode pressure decreases, we decomposed the change in consumer surplus into two components: the gain from lower prices (holding quantity fixed) and the gain from increased quantity. Results show that approximately 92.5% of the total consumer surplus gain is attributable to lower prices, while only 7.5% comes from increased quantity. This highlights that in a market with inelastic demand, most of the consumer benefit stems from price reductions rather than expanded consumption. These findings are consistent with the theoretical prediction that inelastic demand amplifies the welfare effects of even modest price changes.
6. Conclusions
This study highlights that the economic effects of disease in agriculture vary significantly depending on whether the losses are anticipated or unanticipated. When biological threats like nematode infestations occur unexpectedly, producers are unable to adjust their production capacity in the short-run. In such cases, the impact on profits depends upon the elasticity of demand and harvest costs. On the other hand, when disease pressure becomes a permanent feature of the production environment, producers adapt their behavior over time. These long-run adjustments such as changes in planting decisions or the adoption of new technologies shift the basis of profitability from short-run price effects to strategic market behavior. This is shaped by the degree of market power and firms’ ability to coordinate supply (Sexton, Reference Sexton2013). The underlying economic logic reflects the theory of imperfect competition and strategic interaction among firms (Tirole, Reference Tirole1988).
In the context of potato production, our simulation results show that reducing nematode severity increases marketed quantity and may even lead to acreage expansion. However, this increase in supply can drive down prices, and because demand is inelastic, the price drop may outweigh the gain in quantity, ultimately reducing producer profits. While this may seem counterintuitive, it reflects a well-established result in agricultural economics: reducing production risk does not always translate into higher profits, particularly in markets lacking price coordination mechanisms.
Our simulations show that eliminating nematode-related yield losses could increase consumer surplus by up to $840 million but reduce producer profits by nearly $880 million under inelastic demand.
Short-run gains in consumer surplus are higher than long-run gains because prices tend to fall rapidly in response to a sudden supply shock, giving consumers an immediate benefit. Producers, however, often cannot respond as quickly, which limits their ability to benefit from short-term price changes. A comparable example is found in a fruit tree virus prevention program, where annual economic benefits were estimated to be 420 times greater than the cost (Cembali et al., Reference Cembali, Folwell, Wandschneider, Eastwell and Howell2003), underscoring the broader efficiency of proactive disease control efforts.
The results also demonstrate the importance of accounting for expectations. Anticipated changes in disease severity enable producers to make informed decisions and adjust inputs, while unanticipated shocks disrupt strategic planning and lead to inefficiencies. This temporal distinction is frequently overlooked in disease impact modeling, yet it plays a vital role in shaping producer decisions and long-term industry outcomes.
Our analysis suggests that growers may respond to persistent nematode infestation by adopting a range of mitigation strategies, including resistant varieties or biofumigants. However, these adaptations do not guarantee net gains for producers. If mitigation costs exceed individual benefits but fall below the total benefits to consumers and society, it signals a positive externality. In such cases, market failure justifies policy intervention (Zilberman et al., Reference Zilberman, Schmitz, Casterline, Lichtenberg and Siebert1991).
Policymakers can help producers manage the impacts of nematode infestations by supporting strategies that lower production risks and strengthen market fairness. These include cost-sharing programs for resistant seed varieties or biological treatments, improved funding for pest monitoring and diagnostics, and support for cooperative grower groups. In highly concentrated markets, transparent procurement practices can also help address imbalances in bargaining power. Together, these tools can reduce inefficiencies and ensure both farmers and consumers benefit from improved pest control.
From an industrial organization standpoint, these dynamics reflect behavior under Cournot competition with inelastic demand, where firms limit output strategically to avoid steep price declines, especially when markets are oligopolistic (Tirole, Reference Tirole1988). In agricultural markets, unanticipated biological shocks disrupt this equilibrium, complicating producers’ planning and reinforcing the need for coordinated responses (Sexton, Reference Sexton2013).
This study finds that economic outcomes of plant pathogens and control strategies depend on how producers and markets respond, whether losses are anticipated, and whether pricing and policy systems can support those responses. These findings provide a practical foundation for designing interventions that are both economically and ecologically sustainable.
Future research should incorporate firm-level heterogeneity, recognizing that not all producers respond the same way. Some may adopt mitigation strategies earlier than others, securing first-mover advantages in terms of output and market share. The modeling approach developed here can also be extended to other biological shocks such as climate variability or technology adoption, providing a general framework for evaluating agricultural resilience.
These findings have implications for both producer adaptation and public policy. In a system with concentrated processing markets, limited marketing windows, and biological risks that affect yields, it is unlikely that producers will always capture the benefits of better pest management. These empirical findings align with the theoretical prediction that biological shocks affect welfare differently depending on market structure and timing of producer decisions. As pests like nematodes become more persistent with changing climate conditions, it becomes even more important to support farmers’ ability to adapt. This means not only investing in pest control but also improving the economic structures that allow producers to adjust efficiently, such as access to risk management tools, better market coordination, and policies that ensure the gains from reduced losses are shared fairly.
Appendix A1
A1.0 Theoretical frameworks: modeling farmer behavior under pest induced yield risk
This section presents a Cournot model framework adapted to agricultural production under biological stress and is based on a model presented in Winfree et al. (Reference Winfree, Gallardo, Atallah and Nefouti2025). We model how identical potato farmers make planting decisions in anticipation of nematode-related yield losses. The framework focuses on expected outcomes, connecting them to market prices, costs, and welfare impacts.
A1.1 Model setup: farmers, yield risk, and price determination
We consider a market with N symmetric potato producers. Each farmer selects a potential planting level, that produces a certain yield that would be harvested in the disease-free environment, denoted by xi. However, due to expected nematode damage, only a fraction of this output is projected to be marketable, denoted by $\overline{x_{i}}$
. But the actual harvest,
$\overline{x_{i}}$
. But the actual harvest, $\widehat{x_{i}}$
, could be more or less depending on how severe the infestation turns out or how well control methods work.
$\widehat{x_{i}}$
, could be more or less depending on how severe the infestation turns out or how well control methods work.
Let $0\lt \overline{\rm\theta }\lt 1$
denote the expected yield loss rate due to nematodes. Then, the expected harvest is:
$0\lt \overline{\rm\theta }\lt 1$
denote the expected yield loss rate due to nematodes. Then, the expected harvest is:
 $$\overline{x_{i}}=(1-\overline{\theta })x_{i}.$$
Across all producers, the total expected marketable output ( $\overline{X}$
) is:
$\overline{X}$
) is:
 $$\overline{X}=(1-\overline{\theta })\sum _{j=1}^{N}x_{j}.$$
Prices ( $\overline{p}$
) are set based on this expected quantity. We assume a constant-elasticity inverse demand function:
$\overline{p}$
) are set based on this expected quantity. We assume a constant-elasticity inverse demand function:
 $$ \overline{p}=a\overline{X}^{b}, $$
where a > 0 is a demand shifter and b < 0 corresponds to the inverse of the price elasticity of demand.
A1.2 Cost structure: differentiating nematode damaged and undamaged output
Total costs are composed of a production cost cp per unit planted (applying to all the planted output) and harvesting cost ch per unit, incurred only on healthy, harvested output. Damaged crops are left unharvested and only incur production costs. Healthy crops bear the full cost of cp + ch. This is because nematode infestation reduces the marketable yield, not all planted crops are harvested. The damaged portion of the crop, which is either unmarketable or too costly to harvest, is effectively left in the field. Farmers still absorb the production cost cp on these damaged units, but they do not pay ch since the crops are not harvested. In contrast, the healthy portion of the crop is fully harvested and therefore incurs the total per unit cost ch + cp.
This cost structure matters for two reasons. First, it means that pest damage does not just reduce revenues it shifts the average cost of production upward because only a fraction of the planted output generates revenue while all of it incurs production costs. Second, the incentives in mitigation or adjust planting decisions depend on how large that cost wedge becomes between damaged and undamaged output.
A1.3 Firm behavior: profit maximization with expected losses
The expected profit for farmer i (Πi) is therefore given by:
 $$\Pi _{i}=(1-\overline{\theta })x_{i}a\overline{X}^{b}-(1-\overline{\theta })c_{h}x_{i}-c_{p}x_{i}.$$
Taking the derivative with respect to xi, we obtain the marginal impact of potential output:
 $${d\Pi _{i} \over dx_{i}}=a\left(1-\overline{\theta }\right)^{b+1}\left[x_{i}b \left(\sum x_{j}\right)^{b-1}+\left(\sum x_{j}\right)^{b}\right]-\left(1-\overline{\theta }\right)c_{h}-c_{p}.$$
and then setting marginal profit to zero and assuming symmetry across farmers (xi=x), the equilibrium potential output for the firm is given by:
 $$x={1 \over N}\left[{\left(1-\overline{\theta }\right)c_{h}+c_{p} \over a\left(1-\overline{\theta }\right)^{b+1}\left[\frac{b}{N}+1\right]}\right]^{{1 \over b}}.$$
Since $\overline{X}=(1-\overline{\theta })Nx$
, expected aggregate output and price respectively becomes:
$\overline{X}=(1-\overline{\theta })Nx$
, expected aggregate output and price respectively becomes:
 $$\overline{X}= \left[{\left(1-\overline{\theta }\right)c_{h}+c_{p} \over a (1-\overline{\theta })\left[{{b}\over{N}}+1\right]}\right]^{{1 \over b}},$$
 $$\overline{p}=\left({\left(1-\overline{\theta }\right)c_{h}+c_{p} \over \left(1-\overline{\theta }\right)\left({{b}\over{N}}+1\right)}\right).$$
A1.4 Consumer welfare: surplus under pest-adjusted supply
To assess consumer welfare, we calculate the consumer surplus (CS) as the area between the demand curve and market price:
 $$CS=p_{1}X_{1}+\int _{X_{1}}^{\overline{X}}aX^{b} \ dX-\overline{p}\overline{X}={b \over b+1}\left(p_{1}X_{1}-\overline{p}\overline{X}\right).$$
This measures how much consumers benefit from buying potatoes at price $\overline{p}$
rather than a reference price p 1, assuming b is not equal to −1. If b = −1, the consumer surplus becomes undefined.
$\overline{p}$
rather than a reference price p 1, assuming b is not equal to −1. If b = −1, the consumer surplus becomes undefined.
This formula highlights how consumer surplus depends on the shift in price and quantity due to pest induced supply reduction. If nematode pressure reduces output, the supply curve shifts left, raising prices and lowering available quantity. This decreases the consumer surplus, especially when demand is inelastic.
In practice, this means that even modest biological shocks can lead to noticeable welfare losses on the consumer side. The magnitude of this loss depends not just on the biological severity of the infestation but also on market parameters like demand elasticity and how sensitively prices respond to change in supply.
A1.5 Yield shocks and market outcomes
In this section, we distinguish between two types of nematode-related yield shocks: (a) Unanticipated damage that occurs after planting, and (b) anticipated damage that influences planting decisions. Both affect prices, profits, and consumer welfare differently depending on demand elasticity and market structure.
A1.5.1 Unanticipated damage (after planting)
Sometimes, actual pest damage turns out to be worse or better than farmers had predicted. Let $\widehat{\theta }$
be the actual damage rate, which might differ from the expected rate
$\widehat{\theta }$
be the actual damage rate, which might differ from the expected rate $\overline{\theta }$
. Since planting decisions are already made, farmers cannot adjust output after this point. However, the unexpected change in demand leads to a change in actual market supply (
$\overline{\theta }$
. Since planting decisions are already made, farmers cannot adjust output after this point. However, the unexpected change in demand leads to a change in actual market supply ( $\widehat{X }$
):
$\widehat{X }$
):
 $$\widehat{X}=(1-\widehat{\theta })X.$$
This unexpected drop in output affects both revenue and harvesting costs. The changes in profit due to a marginal increase in unexpected damage is:
 $${d\Pi \over d\widehat{\theta }}=X[c_{h}-\left(b+1\right)\widehat{p}\,].$$
The sign of this equation depends on the relationship between harvest cost c h and the price level adjusted by market power (b+1) $\widehat{p }$
. If harvest costs are relatively low or prices increase significantly, the profit effect may be smaller or even positive. But in most cases, especially when
$\widehat{p }$
. If harvest costs are relatively low or prices increase significantly, the profit effect may be smaller or even positive. But in most cases, especially when $\widehat{p }$
rises modestly or not at all, this term is negative reflecting a loss in profit due to reduced marketable yield and unchanged or insufficiently increased prices.
$\widehat{p }$
rises modestly or not at all, this term is negative reflecting a loss in profit due to reduced marketable yield and unchanged or insufficiently increased prices.
If demand is inelastic, the smaller supply leads to higher prices. Since consumers don’t reduce the quantity demanded, total revenue may stay stable or even rise, reducing the impact on profit. However, if demand is elastic, consumers cut back more as prices rise, leading to a sharper drop in revenue. In either case, consumers are worse off. Higher prices caused by unexpected supply shortages reduce consumer surplus:
 $$ {dCS \over d\widehat{\theta }}=bX\,\widehat{p}\lt 0. $$
This is negative because an increase in $\widehat{\theta }$
reduces supply and raises prices, directly lowering consumer surplus, regardless of demand elasticity.
$\widehat{\theta }$
reduces supply and raises prices, directly lowering consumer surplus, regardless of demand elasticity.
A1.5.2 Anticipated damage (before planting)
When farmers anticipate nematode damage at a rate $\overline{\theta }$
, they incorporate that expectation into their planting decisions. The effect of an increase in anticipated nematode damage on farmers’ potential output is given by:
$\overline{\theta }$
, they incorporate that expectation into their planting decisions. The effect of an increase in anticipated nematode damage on farmers’ potential output is given by:
 $$ {dx \over d\overline{\theta }}={x \over b}{b\left(1-\overline{\theta }\right)c_{h}+\left(b+1\right)c_{p} \over \left(1-\overline{\theta }\right)\left[\left(1-\overline{\theta }\right)c_{h}+c_{p}\right]}. $$
The direction of this effect depends on production costs, market power, and the elasticity of demand. If demand is inelastic, farmers might increase planting to make sure enough potatoes reaches the market, even after accounting for damage. But if costs rise too much compared to what they expect to earn, planting could decrease instead. This is because the numerator of the above equation reflects how much expected revenue per unit incentivizes extra planting, while the denominator captures how damage increases the cost burden. When the price effect from reduced supply outweighs cost increases, farmers respond by planting more. But if the marginal cost of additional planting dominates, the incentive to expand planting disappears, and the derivative may become negative.
Even in cases where planting increases, the actual expected supply still declines because a larger share of output is expected to be lost as demonstrated in equation A.14.
 $$ {d\overline{X} \over d\overline{\theta }}={\overline{X} \over b\left(1-\overline{\theta }\right)}*{c_{p} \over \left(1-\overline{\theta }\right)c_{h}+c_{p}}\lt 0, $$
This derivative is clearly negative as higher expected damage reduces the effective amount of product reaching the market.
This lower expected supply drives price up as shown in equation A.15:
 $$ {dp \over d\overline{\theta }}={c_{p} \over \left(1-\overline{\theta }\right)^{2}\left({{b}\over{N}}+1\right)}\gt 0, $$
This is positive, since the reduced supply in a competitive or oligopolistic market drives price increases.
The effect on profit depends on the structure of the market:
 $${d\Pi \over d\overline{\theta }}={\widehat{X}c_{p} \over 1-\overline{\theta }}\left[{N-1 \over \left(1-\overline{\theta }\right)\left(b+N\right)}-1\right].$$
The term in the bracket of equation A.16 can be positive, negative, or zero depending on the number of firms N, the market power parameter b, and the damage level $\overline{\theta }$
. In a monopoly (N = 1), the bracketed term is always negative, so profit decline with more expected damage. In perfect competition (N = ∞), firms have no pricing power, and changes in profit are minimal or passed on to consumers. But in oligopoly (N > 1), the outcome depends on how each firm adjusts output and price in response to the shock, making the effect theoretically indeterminate.
$\overline{\theta }$
. In a monopoly (N = 1), the bracketed term is always negative, so profit decline with more expected damage. In perfect competition (N = ∞), firms have no pricing power, and changes in profit are minimal or passed on to consumers. But in oligopoly (N > 1), the outcome depends on how each firm adjusts output and price in response to the shock, making the effect theoretically indeterminate.
Consumer again lose from this reduction in supply:
 $$ {dCS \over d\overline{\theta }}= -b\overline{p}{d\overline{X} \over d\overline{\theta }}, $$
demonstrating that the consumer surplus always declines when expected disease levels rise, even if producers manage to partially adapt through strategic planting decisions.
A1.6 Comparison
If changes in disease severity are unexpected, their effect on profits depends on demand elasticity and harvest costs. This is consistent with prior findings that the demand for potatoes is price inelastic across all product types, with fresh potatoes showing the least responsiveness to price changes (Guenthner et al., Reference Guenthner, Levi and Lin1991). This inelasticity implies that even substantial price drops may not lead to proportional increases in quantity demanded, amplifying the profit losses from yield shocks. For anticipated changes, production costs and market power also matter. This makes sense-how firms respond depends on how competitive the market is. A monopolist would want the disease to be gone but might not benefit from an unexpected drop if it led to overproduction. In contrast, in highly competitive markets, the anticipated changes have little effect since profits are already minimal, though unexpected shocks could still shift profits up or down (Sexton, Reference Sexton2013).
In essence, unanticipated changes reflect short-term effects, while anticipated changes represent long-term adjustments. Like the findings in the pear industry, where seasonal oligopoly power created measurable price distortions (Winfree et al., Reference Winfree, Mccluskey, Mittelhammer and Gutman2004), our model also suggests that biological shocks such as nematode outbreaks can intensify or weaken market power depending on the timing and severity of infestation. How quickly firms adapt depends on how fast they respond to persisted changes in the severity of the disease.
Appendix A2
Consumer surplus decomposition
P 0, Q 0 = price and quantity under baseline nematode level (15% damage).
P 1, Q 1 = price and quantity under reduced or 0% damage.
The change in consumer surplus is decomposed using:
 $$ \Delta CS=CS\left(P_{1},Q_{1}\right)-CS\left(P_{0},Q_{0}\right) $$
Where,
 $$ CS\left(P,Q\right)={a \over 1+b}Q^{1+b}-P.Q $$
And the share due to the price effect is:
 $$C{S_{priceonly}} = CS\left({{P_1},{Q_0}} \right)$$
With the remainder attributed to the quantity expansion effect.

 Open access