

Microbial organisms are now understood to be important residents within the human host. This finding is strengthened through a multitude of studies implicating commensal microbes in many host biological processes such as nutrient metabolism (Donohoe et al., Reference Donohoe, Garge, Zhang, Sun, O'Connell, Bunger and Bultman2011; Koeth et al., Reference Koeth, Wang, Levison, Buffa, Org, Sheehy and Hazen2013), developmental processes (Borre et al., Reference Borre, O'Keeffe, Clarke, Stanton, Dinan and Cryan2014; Diaz Heijtz et al., Reference Diaz Heijtz, Wang, Anuar, Qian, Bjorkholm, Samuelsson and Pettersson2011), and predispositions to certain disease states (Turnbaugh et al., Reference Turnbaugh, Ley, Mahowald, Magrini, Mardis and Gordon2006). One of the areas garnering particular interest is the association of the human microbiota, mainly that of the gastrointestinal tract, in the development of obesity, and obesity-associated phenotypes (Backhed et al., Reference Backhed, Ding, Wang, Hooper, Koh, Nagy and Gordon2004; Ley et al., Reference Ley, Turnbaugh, Klein and Gordon2006; Villanueva-Millan et al., Reference Villanueva-Millan, Perez-Matute and Oteo2015). Recent work has demonstrated the ability of the gut microbiota of obese animals to induce obesity in non-obese animals (Turnbaugh et al., Reference Turnbaugh, Ley, Mahowald, Magrini, Mardis and Gordon2006). It is worth noting that along with the induction of obesity, comorbidities such as changes in neuroinflammation and subsequent cognitive disruptions have also been induced through the transfer of the gut microbiota of obese mice to non-obese mice (Bruce-Keller et al., Reference Bruce-Keller, Salbaum, Luo, Blanchard, Taylor, Welsh and Berthoud2015).
These findings suggest a causal effect of gut microbiota on the development of obesity, but they do not rule out simultaneous but reverse causal effects of obesity on the gut microbiome. Obesity is associated with changes in the inflammatory profile in humans that may affect gut microbiota, as well as with eating behaviors and physical activity patterns that may also impact the microbiome (Monteiro & Azevedo, Reference Monteiro and Azevedo2010; Rodriguez-Hernandez et al., Reference Rodriguez-Hernandez, Simental-Mendia, Rodriguez-Ramirez and Reyes-Romero2013). Therefore, associations between obesity and the composition of gut microbiota may also reflect reverse causal effects. A specific composition of the gut microbiota may increase the risk for obesity, whereas obesity, either directly or through the lifestyle behaviors of which obesity is a marker or a codeterminant, may also actively change the composition of the gut microbiota (Richmond et al., Reference Richmond, Davey Smith, Ness, den Hoed, McMahon and Timpson2014).
In order to understand the complex nature of the interactions occurring between the gut microbiota and the human host, it is necessary to have proper models to do so. Studies performed in animals have provided one necessary approach to study microbiota dynamics in a genetically controlled environment. We do not yet know the extent to which results derived from mice can be extrapolated to humans. There are large differences in the anatomy of the murine and human gastrointestinal (GI) tract, and up to an 85% difference is found in the bacterial genera observed within the mouse GI tract relative to that of a human (Ley et al., Reference Ley, Backhed, Turnbaugh, Lozupone, Knight and Gordon2005; Nguyen et al., Reference Nguyen, Vieira-Silva, Liston and Raes2015). Experimental manipulation of the human gut microbiome is feasible (Smits et al., Reference Smits, Bouter, de Vos, Borody and Nieuwdorp2013), but difficult to do on the scale possible in animal models. A potential approach to examine causal effects of the gut microbiome in observational studies in humans is to exploit the fact that individual differences in the gut microbiota composition are partly caused by heritable variation (Goodrich et al., Reference Goodrich, Waters, Poole, Sutter, Koren, Blekhman and Ley2014; Lim et al., Reference Lim, You, Yoon, Kwon, Lee, Lee and Ko2016). If we assume that the heritability of obesity reflects, in part, the heritable effects on the gut microbiota, genetically informative designs can be used to test the predictions from causal hypotheses in both directions (Noon et al., Reference Noon, Walker, Webb, Shore, Holton, Edwards and Watt1997; van Dongen et al., Reference van Dongen, Willemsen, Heijmans, Neuteboom, Kluft, Jansen and Boomsma2015). Here, we make use of two genetically informative designs: (1) unrelated individuals selected to be in four corners defined by low or high genetic risk for BMI and by observed high or low BMI, and (2) genetically identical monozygotic (MZ) twins discordant for current BMI. Genetic risk was defined on the basis of a multi-SNP genetic risk profile from the recent meta-analysis of the GIANT consortium (Locke et al., Reference Locke, Kahali, Berndt, Justice, Pers, Day and Speliotes2015).
The aim of this study was to elucidate the gut microbiota constituents and subsequent community structure that differentiates heavier from leaner human individuals. This is achieved through 16s rRNA analysis to identify microbial community members within the gut microbiota. We hypothesized that high genetic risk for increased BMI will be associated with quantitative (smaller species diversity) and qualitative effects (enrichment for different species) on the gut microbiota. Using the four-corners design, we tested whether this association is compatible with a causal effect of the gut microbiota on BMI (Noon et al., Reference Noon, Walker, Webb, Shore, Holton, Edwards and Watt1997). In testing the effect of BMI (high/low) and genetic risk (high/low) on the composition of the gut microbiota, we anticipated two outcomes. If the causal chain is high genetic risk → high BMI → gut microbiota composition, we expect a main effect of BMI (high/low) only (Figure 1). This expectation is based on the assumption that the relationship between genetic risk and composition is mediated by BMI. In contrast, if gut microbiota composition is a cause of high BMI, we expect a main effect of BMI and genetic risk on gut microbiota composition (Figure 1). This expectation does not depend on the absence (or presence) of a direct relationship between genetic risk and composition. Furthermore, the availability of MZ twin data allowed us to use the co-twin control method to discriminate between a direct causal effect of BMI on gut microbiota composition and an association brought about by a ‘third factor’ such as shared environment or shared genes that influence both BMI and microbiota composition (Stubbe et al., Reference Stubbe, de Moor, Boomsma and de Geus2007). If BMI is the causal agent, a comparison of genetically identical twins selected to be discordant for BMI should show a distinct composition of the gut microbiota in the lower and higher BMI individuals.
(A). Given the causal model depicted in the top diagram, x is assumed to equal 0 and thus the two-way ANOVA employed is expected to yield a main effect of BMI, but no effect of BMI polygenic risk. This model would reflect a paradigm in which genetic risk for BMI influences BMI which subsequently influences the gut microbiota composition. (B). Under this causal model, the two-way ANOVA is expected to yield a main effect of both BMI and BMI polygenic risk score. This expectation does not depend on the absence or presence of a direct relationship between BMI genetic risk and gut microbiota composition (i.e., y may be 0 or greater than 0.)

Materials and Methods
Participants
The first group of individuals (N = 50) was selected from a large population (N = 11,495) within the Netherlands Twin Register (NTR) for which BMI and polygenic risk score scores for BMI were available (Willemsen et al., Reference Willemsen, de Geus, Bartels, van Beijsterveldt, Brooks, Estourgie-van Burk and Boomsma2010; Table 1).
Descriptive Statistics for the Study Participants

Mean values are reported for all variables. Standard deviations are reported for each mean.
This allows for the use of a four-corner design where the study participants are selected from the top and bottom 25% of the BMI distribution, and the top and bottom 20% of the distribution of BMI polygenic risk scores produced using genome-wide SNPs. The second group of individuals (n = 30) were MZ twins (15 pairs) discordant for BMI (mean BMI difference 4.2 ± 1.9 kg/m2 (range 1.0–8.2) that have been previously described in detail elsewhere (Doornweerd et al., Reference Doornweerd, RG, van der Eijk, Neter, van Dongen, van der Ploeg and de Geus2016; Table 1). All study participants were female in order to decrease the possibility of sexual dimorphic confounding factors. Participants were excluded if they were not within 18–75 years of age, had experienced recent weight change, or had been currently diagnosed with heart disease, liver or renal disease, diabetes mellitus, malignancies, uncontrolled thyroid disease, or psychiatric or neurological disorders. In addition, participants were also excluded if they were pregnant, breast feeding, currently taking psychoactive or glucose-lowering drugs, or had reported drug/alcohol abuse. Due to the fact that participants were initially selected for an MRI-associated study, participants were also excluded based on MRI contraindication. Body fat measurements for all individuals were obtained through the use of bio-electrical impedance. The study was approved by the ethics committee of the VU University Medical Centre and was performed in accordance with the Helsinki Declaration. All subjects involved provided written informed consent.
Sampling Methods
Fecal samples were collected from individuals and stored at 4°C until delivered to the laboratory within 36 hours. Anaerocult was used in order to preserve anaerobic species present within a sample. The samples were homogenized, aliquoted, and stored at -80°C until utilized for DNA extraction.
Polygenic Risk Score for BMI
Polygenic risk scores (PRS) were calculated based on 77 of the 97 SNPs previously identified as having a role in obesity (Locke et al., Reference Locke, Kahali, Berndt, Justice, Pers, Day and Speliotes2015). These 77 SNPs were the ones that reached genome-wide significance level (5 x 10⁻⁸) within individuals of European ancestry. The scores were determined by summing the risk alleles weighted by their respective effect sizes.
Sequencing Methods
DNA was extracted using the MO Bio PowerSoil Kit with the addition of the heating steps from the Power Fecal Kit (Mo Bio, Carlsbad, CA). Sequencing library preparation and indexing was adapted from Kozich et al. (Reference Kozich, Westcott, Baxter, Highlander and Schloss2013) to generate libraries for sequencing-by-synthesis on the Illumina MiSeq platform. The V4 region of the 16srRNA gene was chosen for amplification and sequencing. Sequence data was generated on the MiSeq platform, using a 2 x 251 paired-end sequencing run with 20% Phix to increase base diversity during the run. Use of a mock community aided as a positive control, and a non-template negative control was also sequenced.
Filtering of MiSeq Reads
MiSeq reads were filtered based upon the work published by Kozich et al. (Reference Kozich, Westcott, Baxter, Highlander and Schloss2013) describing a method for analysis of dual-indexed amplicon sequences resulting from the Illumina MiSeq platform. The MiSeq sequencing run resulted in demultiplexed paired-end FASTQ files for each sample, which were then analyzed using the Mothur software package version 1.36.1 (Schloss et al., Reference Schloss, Westcott, Ryabin, Hall, Hartmann, Hollister and Weber2009). The forward and reverse reads were overlapped, producing contigs for each sample. The joining of reads resulted in 6,188,475 reads. Sequences were filtered to remove sequences with ambiguous bases, as well as sequences shorter than 275 bp. The SILVA v123 database was trimmed to cover the V4 region of the 16s rRNA gene, and unique sequences were subsequently aligned to the customized SILVA v123 database (Pruesse et al., Reference Pruesse, Quast, Knittel, Fuchs, Ludwig, Peplies and Glockner2007). After alignment and filtering, the reads were preclustered to join sequences that are within two nucleotides of one another. UCHIME was used to identify and remove possible chimeric reads from the data (Edgar et al., Reference Edgar, Haas, Clemente, Quince and Knight2011). After chimera removal, the sequences were classified using the naïve Bayesian classifier trained on the Ribosomal database project (RDP) training set (Cole et al., Reference Cole, Wang, Cardenas, Fish, Chai, Farris and Tiedje2009). Non-bacterial lineages were removed; these included eukaryotes, archaea, chloroplasts, mitochondria, as well as unknown lineages. Within the samples sequenced was a mock community of 20 known bacterial sequences. This mock community was used to calculate the error rate of the sequencing run after read filtering. The reads from this mock community were compared to the known sequences, and the error rate was determined to be 0.0053%. The mock community was removed from further processing. After the quality control process, 4,838,970 sequences remained, 45,057 of which were unique sequences. Unique sequences were then clustered into operational taxonomic units (OTUs) with a 0.03 cut-off using the average-neighbor clustering algorithm. Consensus taxonomies of the OTUs were determined using classify.otu command within Mothur. The OTU clustering ultimately resulted in 4,236 unique OTUs. Of these 4,236 OTUs, 67.68% were unclassified at the genus level and 36.66% of all OTUs were unclassified at the family level. In order to achieve proper sampling depth for all samples, the reads for each sample were subsampled to the lowest read depth, which was 36,783 reads.
Statistical Analysis
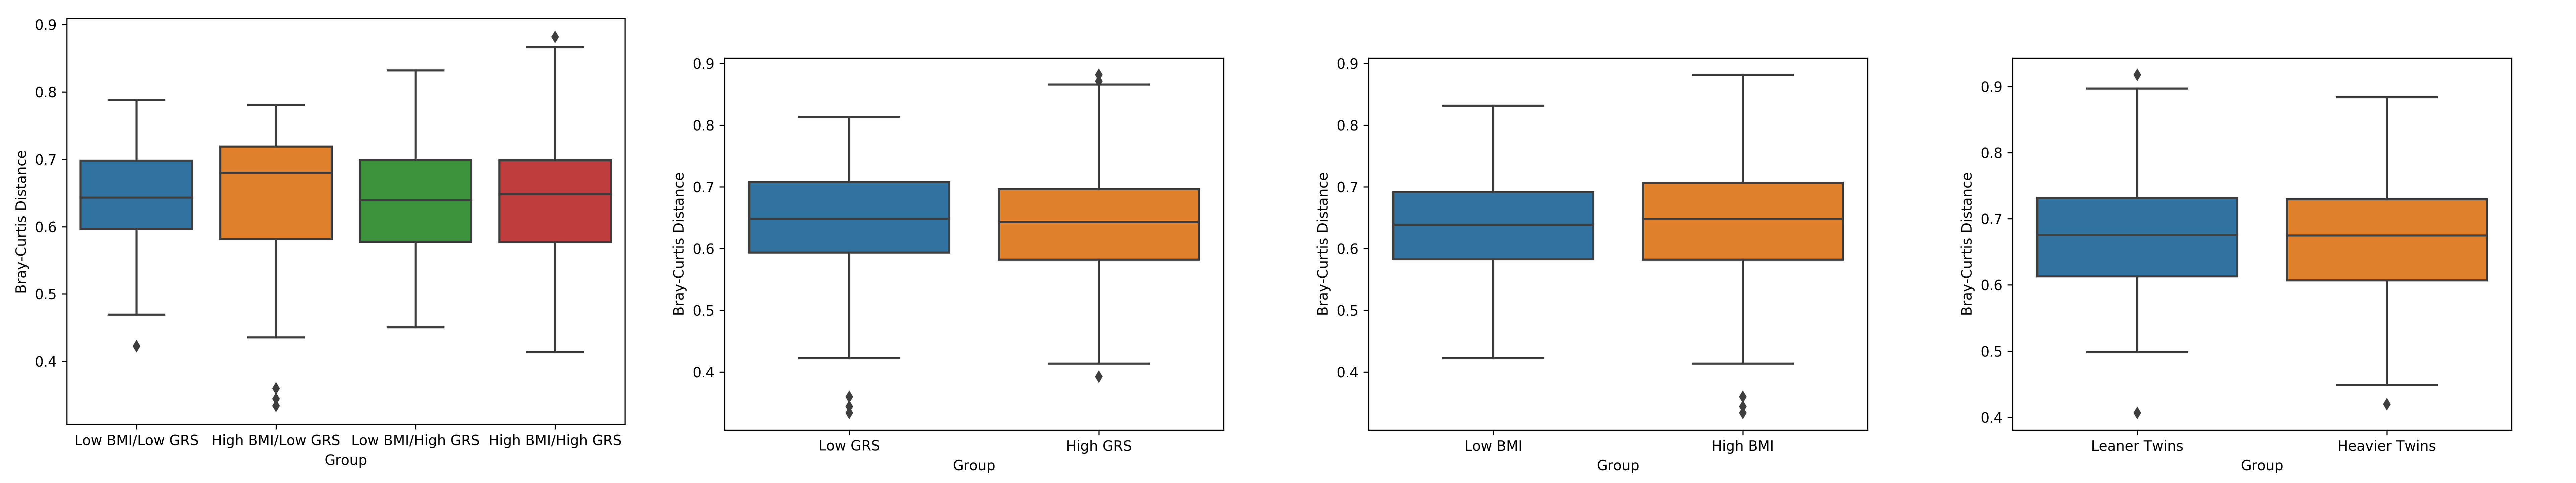
In order to investigate the alpha diversity associated with the sampled communities, inverse Simpson values were generated. Inverse Simpson values are a function of both the species richness (number of species present) and the relative abundances of species level organisms. Inverse Simpson values were generated using the Mothur software package (Schloss et al., Reference Schloss, Westcott, Ryabin, Hall, Hartmann, Hollister and Weber2009). In order to compare the inverse Simpson values for the four-corners individuals, a two-way ANOVA was employed. A paired samples t-test was utilized to determine whether there was a difference in mean inverse Simpson values between the BMI discordant MZ twins. Beta diversity calculations have been performed for the individuals within the four-corners design. We generated Bray-Curtis (BC) dissimilarity measures between all 50 individuals and then tested whether the mean BC measures were significantly different between any of the groups. First, we tested whether or not there was a significant difference in BC distances between the high/low BMI groups and the high/low genetic risk groups by utilizing a t-test with 10,000 permutations. To expand upon this, we also split the 50 four-corners individuals into their respective groups (low BMI/low PRS, low BMI/high PRS, high BMI/low PRS, high BMI/high PRS) and tested for any differences using a one-way ANOVA with 10,000 permutations. In the same manner we tested whether there was a significant difference in BC distances between the group of leaner co-twins relative to the heavier co-twins. BMI was regressed on the inverse Simpson diversity values by utilizing the GEE package within R, accounting for the relatedness of the MZ twin pairs. To more fully capture obesity, this regression was repeated for two additional traits, waist–hip ratio (WHR) and body fat percentage.
To detect OTUs differentially enriched within leaner and heavier individuals two classification strategies were used: linear discriminant analysis (LDA), effect size (LEfSe) analysis, and the random forest approach. The LEfSe analysis is aimed at determining a significantly different presence of OTUs in various subgroups (e.g., low vs. high BMI) with an alpha of 0.05 for both the Kruskal–Wallis and Wilcoxon tests within LEfSe (Segata et al., Reference Segata, Izard, Waldron, Gevers, Miropolsky, Garrett and Huttenhower2011). The traditional LEfSe analysis was modified to include 100,000 permutations, from which an empirical p value was derived. The LDA threshold was set at 2.0.
Random forest classification was performed on the four-corners individuals within the Mothur software. The OTUs sampled per split were calculated based on the log2 of the total number of features. Each classification utilized 20,000 trees. Other parameters included using tree pruning with a pruning aggressiveness of 0.9. Trees with an error rate above 0.4 were discarded. Any feature with a standard deviation less than 0.1 were also discarded. Of note, the random forest classifier allows for the identification of OTUs that do not necessarily have a linear relationship with the phenotype of interest.
Regression analysis was performed by utilizing the generalized estimating equations (GEE) to account for the MZ twin pairs present. BMI, WHR, and body fat mass (kg) were regressed on the separate OTU abundances, while accounting for family structure. Because of the presence of outliers in the OTU data, points were removed that fell outside of four standard deviations from the mean for that specific OTU. The regression on the multiple OTU abundances was corrected for multiple testing via a false discovery rate correction.
For the purposes of the LEfSe, random forest and regression analyses, OTUs were discarded if they were not present within at least 40% of all individuals (32 people). This resulted in a total of 279 OTUs remaining, including an OTU that combines all excluded OTUs.
Results
Alpha Diversity Comparisons
The two-way ANOVA, including main effects of PRS and BMI and their interaction on the mean inverse Simpson index values, showed a significant main effect of BMI, that is, a difference in alpha diversity between individuals with obesity and leaner participants (p = .00009), with a decreased alpha diversity within the gut microbiota of individuals with obesity. The main effect of genetic risk was not significant (Table 2).
Effects of Genetic Risk, BMI, and Their Interaction on the Mean Inverse Simpson Values

There was an unanticipated significant interaction between genetic risk and BMI (p = .0096). Plotting the inverse Simpson values clearly showed the high BMI/low genetic risk individuals had a decreased alpha diversity (Figure 2).
Box plot of the mean inverse Simpson values from the four-corners design.

Inverse Simpson values were also generated for the BMI discordant twin pairs. The gut microbiota of the heavier twin had a lower average inverse Simpson value relative to the mean values of the leaner twins. However, this difference failed to reach significance (p = .298; Supplementary S1).
Regressing BMI, Body Fat, and Waist-to-Hip Ratio on Inverse Simpson Values
In order to investigate the relationship between alpha diversity and a number of different obesity-associated measures including BMI, kilograms of body fat, and WHR, we regressed these outcomes on the inverse Simpson values in the subjects from both the four-corners and BMI discordant twins (n = 80). The data from the two study designs were combined in order to increase the sample sizes for the regression analyses. Significant negative relationships were observed between BMI and alpha diversity as well as body fat and alpha diversity (Table 3). WHR measures were not significantly associated with alpha diversity.
Regression of BMI, Body Fat, and Waist–Hip Ratio on the Mean Inverse Simpson Values

Regressing OTU Abundances on Polygenic Risk Scores
Using the four-corners design, each of the 279 OTUs were regressed on the genetic risk scores to identify OTUs associated with individuals with varying degrees of genetic risk for obesity. After multiple testing correction, there were no significant associations between the polygenic risk scores and any of the OTUs.
Beta Diversity Measurements
Comparison of the BC distances between the four-corners participants showed that there was no significant difference between any of the four groups. Similarly, there was no statistical difference between the BC distances of high BMI individuals versus low BMI individuals or for the high genetic risk group versus low genetic risk group. Testing for a difference between the leaner co-twin groups relative to the group of heavier co-twins also failed to reach statistical significance (Supplementary S7).
Regressing BMI, Body Fat, and Waist-to-Hip Ratio on OTU Abundances
A number of OTUs were identified as being significantly associated with the three measured obesity associated traits (Supplementary S2). There were 9 OTUs that were associated with BMI in the host individual. Regressing body fat and WHRs on the individual OTU abundances identified four and seven significant OTUs respectively. There were varying degrees of overlap between the significant OTUs identified in the three separate analysis.
LEfSe Identification of Differential OTUs
Through the use of LEfSe, OTUs differentially enriched within leaner versus heavier individuals were analyzed. First, the individuals within the four-corners design were analyzed for differentially enriched features. This yielded no OTUs significantly enriched in any of the four corners. Second, individuals within the four-corners groups were compared using high/low BMI as the class and high/low genetic risk as the subclass, resulting in seven OTUs enriched in the low BMI participants and three OTUs enriched in the high BMI participants (Figure 3). We followed this up by LEfSe analysis performed between the BMI discordant MZ twins to see which OTUs were enriched within a model that controls for the host genetic profile. This analysis showed two OTUs enriched in the heavier co-twins and 17 OTUs enriched in the leaner co-twins, five of which were also found enriched in the leaner groups of the four-corner design (Figure 3).
Left: LEfSe analysis results indicating the OTUs differentially enriched in the high and low BMI groups of the four-corners design. Right: LEfSe analysis results indicating the OTUs differentially enriched in the heavy and lean co-twins of the BMI discordant MZ twin design.

Random Forest Classification
To examine the BMI association in more detail, random forest classifications were performed, again separately in the leaner and heavier individuals within both the four-corners individuals and the BMI discordant MZ twins based on the observed OTUs. The classification process was able to accurately classify 96% of the four-corners individuals into low and high BMI as well as 93.3% of the discordant MZ twins into the correct lean and obese category. Assuming that the overall classification is decent, the random forest classifier provides information on which OTUs yielded the most predictive information. Applying the random forest classification aimed at classifying high and low genetic risk was only able to accurately classify 66% of the individuals. The 50 first OTUs used by the random forest classifier can be observed in the supplementary material (Supplementary S3).
Convergence Across Different Analytic Strategies
Table 4 summarizes how the various OTUs were similar across the various analytic approaches used, substantiating their relevance for obesity. OTUs were included only if they were either observed in a significant manner in multiple LEfSe analyses, identified in a LEfSe analysis as well as through regressing the BMI associated measures on OTU abundances, or if they were significant in multiple regression analyses.
Convergence Across Different Analytic Strategies

Discussion
Through 16s rRNA analysis, we examined the gut microbiota constituents and subsequent community structure that differentiates heavier from leaner human individuals using two genetically informative designs: (1) unrelated individuals selected to be in one of four corners defined by low or high genetic risk for BMI based on a multi-SNP genetic risk profile and by observed high or low BMI, and (2) genetically identical MZ twins discordant for current BMI. Alpha diversity was significantly different between the leaner and heavier individuals within the four-corner design, that is, there was a main effect of BMI (high/low). However, there was no main effect of PRS (high/low). As such, the results are consistent with a causal effect of BMI on alpha diversity. However, the presence of an unanticipated significant interaction complicates this interpretation of the results. It is important to note that the average difference in BMI in the BMI discordant MZ twin pairs (mean BMI difference 4.2 ± 1.9 kg/m2 (range 1.0–8.2)), was much lower than the average difference in BMI between the leaner and heavier individuals in four corners design (BMI ≤ 22 kg/m2 and ≥ 27kg/m2) and thus this could possibly explain the smaller difference in alpha diversity observed between the co-twins.
The four-corner design allowed for the exploration of differences in gut microbiota alpha diversity. If low alpha diversity was a consequence of high BMI, it would be expected that both high BMI groups would have a decreased alpha diversity (i.e., the anticipated main effect of BMI). While this main effect was observed, its interpretation is complicated by the significant interaction between PRS and BMI. Specifically, the individuals with a low genetic risk for BMI (low PRS) and high BMI showed a lower alpha diversity when compared to each of the other three groups. These findings may highlight separate subtypes of obesity, one driven by genetic factors, the other more heavily influenced by environmental factors. The latter subtype of obesity may be influenced by a separate external cause that either increases BMI through an effect of decreased gut microbiota diversity, or independently causes increases in BMI and decreases in gut microbiota diversity. The latter leaves open that it may not necessarily be the gut microbiota causing the obese state itself. The observed decrease in alpha diversity of the gut microbiota of low genetic risk/high BMI individuals is a consequence of the actual cause of obesity such as dietary intake or exercise activity.
Although previous studies have identified decreased alpha diversity associated with increased BMI as well as specific dietary patterns such as consumption of a Western diet, other studies have only identified a relatively weak association between gut microbiota alpha diversity and obese status (Beaumont et al., Reference Beaumont, Goodrich, Jackson, Yet, Davenport, Vieira-Silva and Bell2016; Sze & Schloss, Reference Sze and Schloss2016; Turnbaugh et al., Reference Turnbaugh, Hamady, Yatsunenko, Cantarel, Duncan, Ley and Gordon2009). For the obese status, it may be possible that the weak association with gut microbiota alpha diversity is due to the presence of the aforementioned subphenotypes of obesity present within the participants examined. In this case, the lack of decreased alpha diversity within the individuals at a high genetic susceptibility would hinder the ability to detect the effect in the larger population.
In order to further understand the association between gut microbiota alpha diversity and obesity, BMI, body fat mass (kg), and WHR measurements were all regressed on alpha diversity using all 80 individuals. BMI and body fat mass showed significant negative associations with alpha diversity whereas WHR did not show a significant association. These findings are supported by a recent study that observed a negative association between gut microbiota alpha diversity and a number of adiposity associated measures (Beaumont et al., Reference Beaumont, Goodrich, Jackson, Yet, Davenport, Vieira-Silva and Bell2016). Interestingly, this study also did not observe a significant association between alpha diversity and WHR. Together, these findings point towards a paradigm where gut microbiota composition is associated with general adiposity rather than fat distribution (i.e., gynoid vs. android obesity) as reflected in WHR. Gut microbiota involvement in development of adipose tissue has been previously explored in animal studies, where it was observed that the transfer of gut microbiota contents from a conventionally raised mouse to a mouse raised in a germ-free (GF) environment resulted in a 60% increase in body fat while consuming significantly less food (Backhed et al., Reference Backhed, Ding, Wang, Hooper, Koh, Nagy and Gordon2004).
In addition to comparisons between obesity-associated measures and alpha diversity, we explored whether there were OTUs significantly associated with either a leaner or heavier phenotype within the two separate study designs. Regressing three separate obesity associated measures (BMI, body fat, WHR) on the OTU relative abundances resulted in 14 OTUs significantly associated with one of these measures. There was a varying degree of overlap between the OTUs identified through the regression analyses, with only two OTUs significantly associated with all three obesity associated measurements. It may be possible that the subtle differences in the obesity-associated measures may be the cause of the slightly different results. As was previously noted, BMI and body fat may actually represent slightly different obesity-associated phenotypes regarding fat distribution in comparison to WHR (gynoid vs. android obesity), which could explain the lack of overlap between these measures. When comparing the overlap of OTUs between BMI and body fat, there is actually a fair amount of overlap given that three of the four OTUs identified in the body fat regression were also identified in the BMI regression. As BMI is a function of both weight and height of an individual and not necessarily purely body fat, it may be plausible that OTUs identified via the BMI regression may also be associated with other factors such as height or muscle mass, and not purely fat content. Taking a closer look at the taxonomic classification of the OTUs showed that 10 of the 14 significant OTUs belong to the Firmicutes phylum, all of which are related in an inverse manner to BMI. Although it may appear tempting to utilize a phylotype-based approach and test whether any of our study groups and/or BMI have an association with the Firmicutes phylum, it should be noted that the LEfSe analyses identified five OTUs enriched in heavy individuals, all of which corresponded to the Firmicutes phylum. All of the OTUs identified in lean individuals through the use of LEfSe analysis, with the exception of three OTUs, two of which were only classified to the Bacteria domain, also belonged to the Firmicutes phylum. This clearly demonstrates that various members of the Firmicutes phylum may have varying contributions to the obese phenotype, with some OTUs associated with a lean phenotype and others associated with a heavier phenotype.
Utilization of these various analytical approaches ultimately converged on nine OTUs that showed an association to BMI or other obesity-associated measures in multiple analyses. These OTUs were able to be classified down to various taxonomic ranks (e.g., order and family). OTUs belonging to the Ruminococcaceae (OTU 220) and Oxalobacteraceae (OTU 204) families were found to be enriched within leaner individuals as well as generally negatively associated with obesity measures. Members of the Ruminococcaceae family have been observed in a similar fashion in separate studies outlining the relationship between the gut microbiota and body fat composition (Beaumont et al., Reference Beaumont, Goodrich, Jackson, Yet, Davenport, Vieira-Silva and Bell2016). Although the Oxalobacteraceae family has less of a documented association with obesity, previous studies of human and animal gut microbiota contents have observed decreases of this family in response to administration of antibiotics as well as enriched within individuals with no previous contact with the Western world (Raymond et al., Reference Raymond, Ouameur, Deraspe, Iqbal, Gingras, Dridi and Corbeil2016; Torok et al., Reference Torok, Allison, Percy, Ophel-Keller and Hughes2011). Prenatal maternal and early-life antibiotic use have both been shown to impact the development of obesity (Bailey et al., Reference Bailey, Forrest, Zhang, Richards, Livshits and DeRusso2014; Mueller et al., Reference Mueller, Whyatt, Hoepner, Oberfield, Dominguez-Bello, Widen and Rundle2015). Understanding the relationship between Oxalobacteraceae microorganisms, antibiotic use, and subsequent host body composition could be of value for understanding how environmental influences may impact the susceptibility to obesity.
One of the hypotheses put forth to explain how the gut microbiota may impact the development of an obese phenotype revolves around the idea that the gut microbiota composition of heavier individuals may have an increased capacity to harvest energy from food consumed by the host (Turnbaugh et al., Reference Turnbaugh, Ley, Mahowald, Magrini, Mardis and Gordon2006). This concept is supported by studies that have observed enrichment of genomic material encoding products involved in the breakdown of dietary substrates within the gut microbiota of heavier mice and humans relative to their leaner counterparts (Turnbaugh et al., Reference Turnbaugh, Hamady, Yatsunenko, Cantarel, Duncan, Ley and Gordon2009; Turnbaugh et al., Reference Turnbaugh, Ley, Mahowald, Magrini, Mardis and Gordon2006). Our current study does not address the gut microbiota genomic functional repertoire, thus representing a limitation of this study as well as an avenue of future research. In addition to the increased energy absorption hypothesis, recent work has demonstrated that individual microorganisms can manipulate appetite within the human host. Salmonella typhimurium has been shown to inhibit sickness-induced anorexia by way of the gut-brain axis (Rao et al., Reference Rao, Schieber, O'Connor, Leblanc, Michel and Ayres2017). Although this specific example of microbial modulation of host appetite arises within a state of host distress (S. typhimurium infection), it presents the existence of a molecular mechanism resulting in microbial influence of host eating behavior. OTUs significantly associated with lean and heavy phenotypes such as those observed across the analyses within this study would be logical candidates for future exploration into such mechanisms.
Conclusions
Our study demonstrates the utility of genetically informative study designs aimed at investigating the human gut microbiome. Through the use of such designs, we successfully highlighted a distinctly lower gut microbiota diversity in individuals with high BMI that were low in the genetic susceptibility to obesity. Additionally, we identified a number of OTUs that have a significant association with obesity-associated measures as well as being enriched in groups of lean or heavy individuals independent of genetic factors. These findings provide further support for the relationship between the human gut microbiota and the obese phenotype.
Acknowledgments
Computations supporting this project were performed on the high-performance computing systems at the University of South Dakota. Research computing staff Douglas Jennewein provided valuable technical expertise to this project.
Ethics Approval and Consent to Participate
All subjects involved provided written informed consent. The study was approved by the Central Ethics Committee on Research Involving Human Subjects of the VU University Medical Center, Amsterdam, the Netherlands.
Conflict of Interest
None.
Funding
This study was supported by the Netherlands Organization of Scientific Research (91613082).
Supplementary material
To view supplementary material for this article, please visit https://doi.org/10.1017/thg.2018.26


 Open access