

Introduction
Reducing the pace of climate change is a global public good. Most countries have agreed to reduce CO2 emissions, but implementing the necessary policies has proved politically difficult. CO2‐reducing policies will create (short‐term) winners and losers, and the losers are often spatially concentrated and well‐organised, for instance when climate policies harm natural resource extraction (Hovi et al. Reference Hovi, Sprinz and Underdal2009). Moreover, it is commonly believed that it is more difficult to reduce CO2 emissions when the state of the economy is declining (Kahn & Kotchen Reference Kahn and Kotchen2011; Scruggs & Benegal Reference Scruggs and Benegal2012; Shum Reference Shum2012, but see also Bakaki & Bernauer Reference Bakaki and Bernauer2018). Mildenberger and Tingley (Reference Mildenberger and Tingley2019), studying second‐order beliefs, find that both the mass public and the political elite think that the general public are less supportive of policies to combat climate change than what is true, which makes change difficult. However, external shocks, like changes in the oil price, can disrupt equilibriums in energy markets, be important for climate policy and investments in renewable energy and create a ‘window of opportunity‘ for policy change (Unruh Reference Unruh2002; Michaelowa Reference Michaelowa2005; Aklin & Urpelainen Reference Aklin and Urpelainen2013).
In this paper, we contribute to the small literature on how parties and members of parliament (MPs) handle the hard trade‐offs they face when addressing climate change (e.g., Schulze Reference Schulze2014; Farstad Reference Farstad2018; Cooper et al. Reference Cooper, Kim and Urpelainen2018). We exploit variation across time and electoral districts in MPs’ incentives to address the climate issue created by the rapid decline in the oil price in 2014–2015. Our context is Norway, which is heavily dependent on oil production and highly sensitive to the oil price. Moreover, MPs operate in a party‐centred environment where roll call voting is determined at the party level, which makes signalling to the home constituency more difficult. Using modern quantitative text analysis methods combined with a differences‐in‐differences design, we analyse how MPs’ speech behaviour in Parliament changed in response to the price shock.
Climate politics in hard times
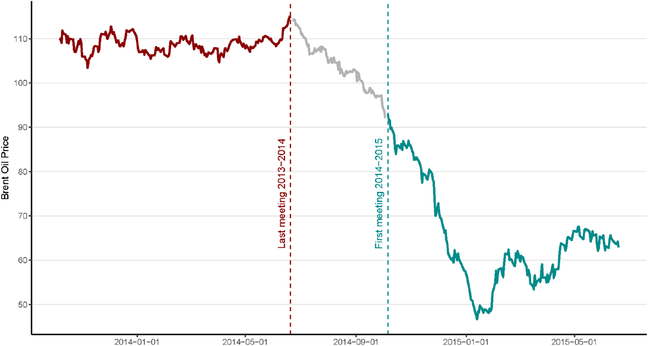
Figure 1 shows the development in the oil price in 2014–2015. In early June 2014, the Brent oil price was well above 100 dollars. During the autumn of 2014, the price fell week by week to below 50 dollars by January 1, 2015, and the price continued to fall until it reached 29 dollars in January 2016. The price decline was dramatic for the oil‐dependent Norwegian economy and fear of a major recession loomed large. The consequences were particularly harsh for the county of Rogaland, where the oil sector dominates the economy (see Supporting Information Appendix for details).
Spot crude oil price per barrel in dollars, 2013–2015, Brent oil price during the 2013–2014 and 2014–2015 parliamentary sessions. [Color figure can be viewed at wileyonlinelibrary.com]

We argue that the shock affected the trade‐offs MPs had to make between addressing climate change, creating policy incentives to move the economy from oil production to environmentally friendly industries and keeping employment levels high. The shock's influence on these trade‐offs varies across voters and electoral districts, as the expected costs of CO2‐reducing policies are asymmetric. Bechtel et al. (Reference Bechtel, Genovese and Scheve2017) show that this asymmetry is reflected in public support for climate policies, as people employed in extracting industries are less likely to support emission reduction policies. In general, while there is a positive association between global warming and public concern about climate change (Bergquist & Warshaw Reference Bergquist and Warshaw2019), public support is pro‐cyclical, as support tends to decline when unemployment increases (Kahn & Kotchen Reference Kahn and Kotchen2011; Scruggs & Benegal Reference Scruggs and Benegal2012) and increases with economic growth (Shum Reference Shum2012). When the expected burden from cuts increases, people become less willing to support them. Environmental policies will also be less salient to voters, and welfare state compensation policies become more popular when the risk of income loss increases (Margalit Reference Margalit2013; Colantone & Stanig Reference Colantone and Stanig2018).Footnote 1 The spatial concentration of expected costs from implementing environmental‐friendly policies will also be important (Stokes Reference Stokes2016; Cooper et al. Reference Cooper, Kim and Urpelainen2018). When costs are concentrated, it becomes easier to organise and express local resistance.
We know little about how parties and politicians handle asymmetric costs and economic downturns. Climate concerns, as expressed in party manifestos, do not necessarily follow the left–right dimension (Schulze Reference Schulze2014; Farstad Reference Farstad2018), and spatially concentrated costs can create electoral incentives for MPs that cut across ideological dimensions. For Rogaland MPs, ideological commitments to climate change policies become more costly in political terms when public support for them declines in their home constituency.
MPs from less affected counties, however, might perceive the oil price shock as a ‘window of opportunity’ (Michaelowa Reference Michaelowa2005). External shocks have been proposed as necessary to exit the ‘carbon lock‐in’ that many countries are in (Unruh Reference Unruh2002), and Aklin and Urpelainen (Reference Aklin and Urpelainen2013) show that investments in renewable energy depend on the international oil price. For an oil‐producing country like Norway, it becomes tempting to stimulate green industries and diversify the economy when the oil price is low, since the dependency on one industry becomes very salient to voters. If successful, such investments can create what Aklin and Urpelainen (Reference Aklin and Urpelainen2013) call positive reinforcement effects, as the green sector may be permanently strengthened.
MPs in Norway, however, face an institutional problem when they want to send signals to their home constituency. Norway is a party‐centred environment, with a decentralised candidate selection system. MPs have few tools available to send credible signals to their constituency and the local electorate because roll call voting is determined by party attachment. However, a growing literature shows that parliamentary speeches may, at least to some extent, fill this function (Proksch & Slapin Reference Proksch and Slapin2012; Lauderdale & Herzog Reference Lauderdale and Herzog2016; Ash et al. Reference Ash, Morelli and Van Weelden2017). In particular, Baumann (Reference Baumann2016) compares co‐sponsoring of private member bills (PMBs) and speeches, finding that Norwegian MPs are covering a more diverse set of topics with PMBs than in their speeches. This is particularly the case for MPs with experience from local politics, and for MPs from larger parties and larger electoral districts.
Moreover, access to the floor is not constant over time, as party elites tend to restrict parliamentary speech making to a smaller number of MPs in the run‐up to the elections (Bäck, Baumann, Debus and Müller Reference Bäck, Baumann and Debus2019). Closely related to our work, Bäck, Baumann and Debus (Reference Bäck, Baumann and Debus2019) and Bäck and Debus (Reference Bäck and Debus2018) find that MPs from constituencies hit hard by youth unemployment participate less in debates on redistributive policies than their counterparts from less affected constituencies (see also, Herzog & Benoit, Reference Herzog and Benoit2015). Note that we consider change in the content of the speeches that these MPs deliver, not the number of speeches they participate in on the topic. As such, our findings can be considered complementary as they address to what extent these MPs experiencing a substantive local economic shock change the content of their speeches on relevant topics differently to MPs from less affected areas. Such shifts may help explain shifts in allocation of speech time. MPs from severely hit districts change the content of their speeches on relevant topics to a larger extent than MPs from less affected areas. As a result, party leaders may prefer to allocate speaking time on these topics differently. Note however, that the ability of party leaders to decide who gets to speak on a topic is, in the Norwegian context, determined at least partly by committee assignment. Backbench MPs only rarely speak on topics not falling into the jurisdiction of the committee(s) they are assigned to.
Research design
We rely on a dataset of all speeches in the Norwegian parliament (Lapponi et al. Reference Lapponi, Søyland, Velldal and Oepen2017) and use structural topic models (STM) to estimate how MPs’ speech behaviour changed when the oil price dropped.Footnote 2 The oil price collapsed within an electoral period, which implies that we can study MP behaviour before and after the oil price shock for the same set of MPs. Figure 1 shows that the Storting had a recess from June 20th, 2014 to October 1st, 2014. The break between the two parliamentary sessions serves as a good timing for the treatment period: The price was stable in the 2013–2014 session (the pre‐treatment period) while during the recess the price started to drop and continued to do so during the second session (the treatment period).
We leverage the option to include covariates in the STM (Roberts et al. Reference Roberts, Stewart, Tingley, Lucas, Luis, Gadarian, Albertson and Rand2014: 1067) to embed a differences‐in‐differences (DD) model.Footnote 3 Our set up allows us to estimate the response of MPs who face different political costs of expressing climate concern, where MPs from the constituency of Rogaland are classified as the treated MPs. The institutional setting (see Supporting Information Appendix for details) implies that we study the same MPs, operating within the same institutional rules and (largely) the same committee composition, in the pre‐ and post‐period, which makes our design very clean. The oil shock was the most important event over this period with a strong geographic component, implying that the DD estimate is unlikely to be confounded by other events.
The STM is a multi‐membership model, where each document can load more or less on each topic. The models use the word frequency distribution in a given corpus to classify documents (speeches) probabilistically, and the topic model gives each document a proportion in each topic (topic load). This proportion sums to 1 (or 100 per cent) over all topics for each document (Blei & Lafferty Reference Blei, Lafferty, Srivastava and Sahami2009; Blei Reference Blei2012).
To present the results of the topic model, we simulate the expected topic proportions for each document over all topics. This is done by running a series of 500 regressions where the documents are the units, the proportion each document has in each topic is the outcome and the covariates are the metadata supplied to the STM. We then extract the mean estimate, 95 per cent, and 90 per cent confidence intervals over all simulations.
The essence of our approach is to examine how the topic loadings correlate with the county of the MP before and after the oil price shock. As discussed above, we expect that MPs from the oil‐producing county of Rogaland will be particularly affected by the oil price decline. The oil price shock gives them electoral incentives to shift attention away from environmental issues that will increase the costs of oil production and towards economic compensation policies.Footnote 4
Results
To present the results we filter out the identified topics considered most relevant for our research question (see the Supporting Information Appendix for how we filtered the topics). That is, we emphasise the topics regarding oil prices, the oil industry, (renewable) energy, the Norwegian oil fund and employment/unemployment. We identify three topics out of the 99 topics given by the spectral STM configuration for our main analysis: (1) the green shift, (2) renewable versus oil sector and (3) unemployment. We interpret these topics as representing debates on (1) investments in green industries, (2) reducing reliance on oil production and (3) concerns about the economic downturn. We provide illustrations and validation of the content of our selected topics in the Supporting Information Appendix.
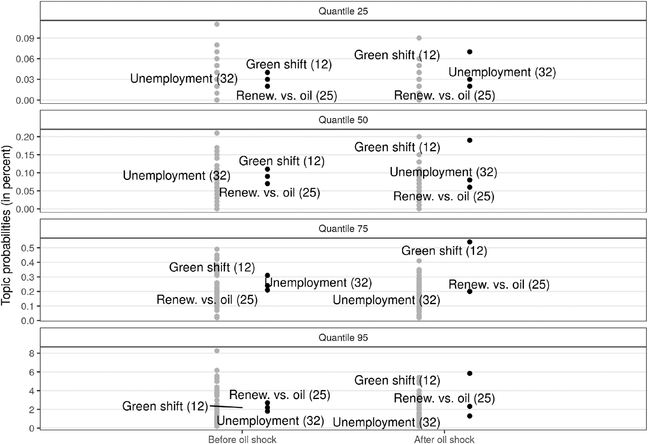
Figure 2 shows our first important result. The figure plots quantile per cent values for the three selected topics compared to the topics left out of the main analyses. The topic model gives each speech a proportion value according to how much of the speech loads on a given topic, so that the sum proportion for each speech over all topics always equals 1 (or 100 per cent). In other words, the figure shows how much our chosen topics are used by MPs in the two periods compared to all irrelevant topics.
Topic load (%) quantile values before and after oil shock. Grey dots show topics not used in the analyses; black dots show topics used in the analyses.

We see that the green shift is the most prominent of our three topics both before and after the oil‐shock. Compared to all other topics, however, the green shift topic becomes one of the most important topics after the shock. For our other topics, the changes are smaller. In line with the ‘window of opportunity’‐hypothesis, many MPs responded to the oil price drop not by avoiding environmental issues, but by exploiting the oil price shock as a way to advocate for more investments in policies that shift the Norwegian oil dependent economy towards greener industries. Since this implies investments in industries that have a high demand for engineers, a group of workers that suffer when the oil price drops, the green shift can be framed as an active response to the recession.
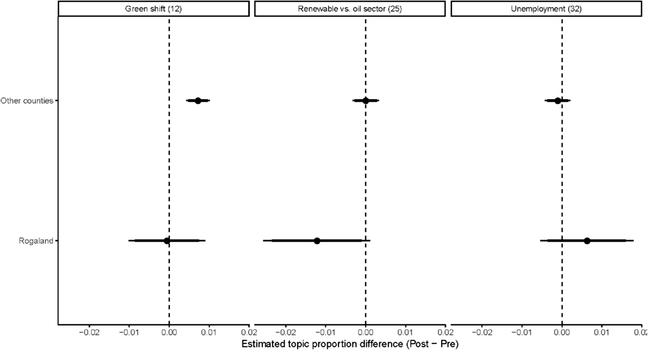
While MPs in general did not avoid environmental issues as the oil price collapsed, the MPs from Rogaland might have considered it riskier to address environmental topics. Figure 3 visualises our main results from the differences‐in‐differences analysis, while numerical estimates are presented in Table 1. We find a clear regional variance in speech patterns in the pre‐period, which indicates that although the party label determines roll call voting, MPs can send signals home through their speeches in the parliament.Footnote 5 In the pre‐period, the representatives from Rogaland were, unsurprisingly, among the most active MPs on the oil‐related topic, but did not stand out from the other MPs on the two other topics.
Expected topic proportions over selected topics for Rogaland compared to all other counties. The thick line through the dot shows 90 per cent confidence bands and the thin line 95 per cent confidence bands.

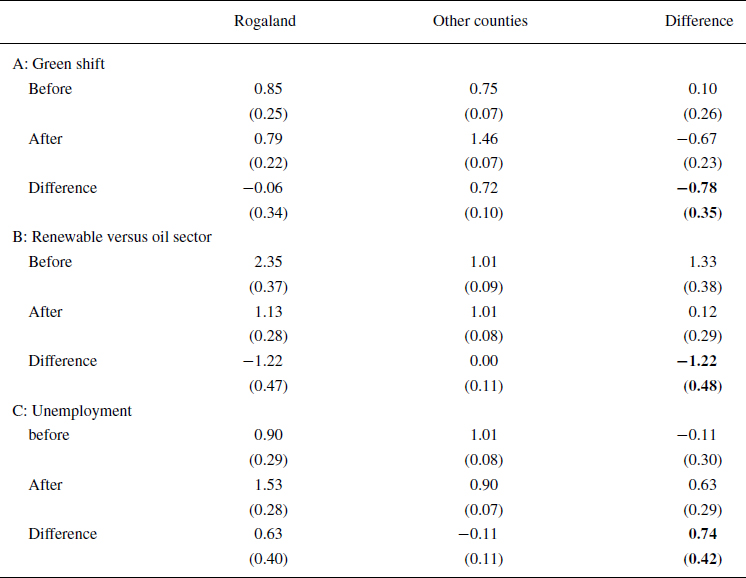
Estimated topic proportions before and after the oil price shock. Rogaland and average across other counties. DD‐estimate in bold

Note: Standard errors in parentheses.
In the post‐treatment period, we find that MPs from Rogaland did not change how much they talked about the green shift. This stability, however, is in a context where MPs from other counties increased their emphasis on this topic significantly. This difference in behaviour between Rogaland MPs and MPs from other counties produced a negative DD‐estimate. The DD‐estimates and associated uncertainties are presented in bold numbers in Table 1. The deviant behaviour of MPs from the Rogaland bench is consistent with the higher costs of participating in the green shift debate. We interpret the DD‐estimate as reflecting that MPs outside Rogaland used the oil price bust as a ‘window of opportunity’ to promote the green shift. This interpretation is strengthened by several full quotes from the speeches, which are reported in the Supporting Information Appendix.
The pattern is even stronger for the topic that specifically includes references to the oil industry. While Rogaland MPs talked much about this topic before the oil price bust, they shifted strongly away from it after the shock. Table 1, Panel C shows that they, instead, talked more about unemployment, consistent with the increasing unemployment rate in their electoral district – although this effect is only significant at the ten per cent level.
In the Supporting Information Appendix we present three additional results. First, we show that a ‘placebo’‐analysis where we do a similar type of analysis for the previous Storting (i.e., four years earlier) shows no significant differences. This result reduces the worry that we simply pick up random noise or a trend in speech patterns. Second, we present an analysis where we, in rotating fashion, treat each of the control counties as the affected counties. This analysis shows that Rogaland clearly stands out from the others. Third, we include committee fixed effects to examine whether results are similar if we account for a small number of exogenous changes in committee membership. We find that the DD‐estimate for the green shift declines somewhat, but that the main conclusions remain.
Conclusion
Reducing CO2 emissions is difficult. It is usually assumed that it is more difficult if the economy is in decline, if expected costs are spatially concentrated, and if the economy is heavily dependent on industries with high CO2 emissions. In such settings, MPs have to trade‐off a range of various concerns. The literature on how they do so is, however, scarce. While most of the literature relies on cross‐country comparisons, which typically have well‐known problems of internal validity, we leverage a rapid decline in the oil price to study how Norwegian MPs respond to the concerns produced by the looming recession.
We find that MPs from the electoral district most reliant on oil‐production indeed tried to avoid environmental topics and shifted their speech time towards employment topics. MPs from other districts, however, behave as if they used the oil price bust as a ‘window of opportunity’ to talk about more investments in greener industries. In contrast to the conventional wisdom, hard times can thus spur climate friendly policy shifts, but this will depend on the geographic concentration of affected industries. One important limitation of our paper is that we cannot determine to what extent the behavioural change reflects MP agency or coordinated party strategies that we do not observe.
Acknowledgements
Earlier versions of this paper have been presented at the Concepts and Methods Workshop at PluriCourts (University of Oslo), research seminars at the University of Oslo, the Frisch Centre for Economic Research, the 2018 EPSA conference, and the 2018 APSA conference. We thank the audiences for constructive comments. We also thank Michael Bechtel, Sina Özdemir and Jon Hovi for useful comments and suggestions on an earlier version of the paper. Grant number 236786 (Research Council of Norway) is acknowledged.
Supporting Information
Additional supporting information may be found online in the Supporting Information section at the end of the article:
Figure A‐1: The impact of the oil price shock on Rogaland
Table A‐1: Composition of the energy and environment committee
Table A‐2: Descriptive text statistics for MPs in the data over counties.
Figure A‐2: Top 10 tokens for the three analysed topics over four measures of importance.
Figure A‐3: Mean topic proportions for keyword matches and no keyword matches.
Figure A‐4: Expected topic proportions for budget topic in late fall and the rest of the year.
Figure A‐5: Expected topic proportions before and after oil price shock over selected topics and all counties.
Table A‐3: ‘Placebo’‐analysis using data from the previous Storting.
Figure A‐6: Bootstrapped median topic percentages for the three topics under investigation over parties.
Figure A‐7: Expected topic proportions before and after oil price shock over selected topics including committee
Figure A‐8: Expected topic proportions over selected topics for all counties.
Figure A‐9: Expected topic proportions over selected unrelated topics for Rogaland versus all other counties.


 Open access