

Introduction
Glaciers are important indicators of current climate and an archive for past climatic changes. Information on recent climatic change can be obtained from the world’s glaciers from both mass-balance studies and changes in glacier geometry (Reference HoughtonHoughton and others, 2001). Glaciers scattered throughout the tropics can provide information on climate changes in these climatically important regions (e.g. Reference KaserKaser, 1999, Reference Kaser2001; Reference Kaser and OsmastonKaser and Osmaston, 2002). In addition, the small size of most tropical glaciers enables them to respond quickly to climatic variations, making them advantageous as a proxy for recent climatic changes (Reference Francou, Vuille, Wagnon, Mendoza and SicartFrancou and others, 2003). Following the delineation of the tropics by Reference KaserKaser (1999, Reference Kaser2001), tropical glaciers are found in the South American Andes and on isolated mountains in East Africa and in Irian Jaya, Indonesia, which is located on the island of New Guinea.
Tropical glaciers reached their Little Ice Age maximum extents during the latter half of the 19th century and have since been in dramatic retreat. The retreat has not been monotonic but, in general, has appeared to be largely synchronous across the tropics and generally synchronous with the observed retreat of mid-latitude glaciers (Reference KaserKaser, 1999). The Intergovernmental Panel on Climate Change (IPCC) Third Assessment Report on Climate Change noted that glaciers appear to be receding at an increasing rate in all tropical areas. However, it has not been demonstrated that atmospheric warming is the most important factor controlling the observed tropical glacier retreat (Reference HoughtonHoughton and others, 2001).
While both glacier recession and its underlying climatic causes have been relatively well studied in the Andes and in East Africa, the retreat of the few remaining ice masses in Irian Jaya has received less attention in the recent past. However, during the 1970s (Reference AllisonAllison, 1975; Reference Allison, Peterson, Hope, Peterson, Radok, Allison and BalkemaAllison and Peterson, 1976; Reference Allison and KrussAllison and Kruss, 1977) the Irian Jaya glaciers were the focus of numerous glaciological studies. The mass-balance measurements made in 1972 (Reference AllisonAllison, 1975) on these glaciers were an important early source of knowledge about the vertical mass-balance gradient of glaciers of the inner tropics that remains useful today (Reference KaserKaser, 2001). The recent availability of high spatial resolution images from commercial satellites affords the opportunity to monitor the recent retreat of these small glaciers. This study quantitatively assesses the extent and recession of the remaining ice masses on Puncak Jaya, Irian Jaya, from 2000 to 2002 using IKONOS satellite images. This observed shortterm recession is compared to previously published areas of the same glaciers to assess the retreat of Irian Jaya glaciers.
Tropical Glaciers and Climate Change
From a glaciological standpoint the tropics can be subdivided into three distinct regions: the inner tropics, the outer tropics and the subtropics (Reference KaserKaser, 1999, Reference Kaser2001; Reference Kaser and OsmastonKaser and Osmaston, 2002). Of these three, only the inner tropics, in which Irian Jaya is located, experiences continuously humid conditions. In the inner tropics, relatively stable humidity and temperatures throughout the year mean that accumulation and ablation can occur simultaneously on the glacier surface over the entire year. By contrast, the glaciers of the outer tropics experience distinct wet and dry seasons. During the wet season, outer tropical glaciers experience conditions similar to those in the inner tropics, while during the dry season they experience much drier subtropical conditions. A few tropical glaciers located in southwestern Bolivia and northern Chile are considered subtropical. These glaciers are unique in the tropics in that nearly all ablation occurs through sublimation due to dry conditions (Reference KaserKaser, 2001; Reference Favier, Wagnon and RibsteinFavier and others, 2004a).
Because climatic conditions vary throughout the tropics, it is reasonable to expect that the response of glaciers to climatic variations will differ depending on their geographic location. This view is supported by a considerable body of glaciological research, much of it conducted since the early 1990s, that has examined the surface energy budgets (SEBs) and mass balances of glaciers in the inner and outer tropics. This research has led to a much better understanding of glacier-atmosphere interactions in the tropics and the response of tropical glaciers to climatic variations. The research suggests the modern retreat of tropical glaciers is far from a simple response to atmospheric warming.
Theoretical modeling of the vertical mass-balance profile of tropical glaciers has been successfully undertaken by Reference KaserKaser (2001), whose work indicates that the glaciers in the inner tropics, like those in Irian Jaya, should be expected to exhibit a higher sensitivity to variations in air temperature than glaciers in other tropical regions. Recent mass-balance and SEB measurements made on Antizana glacier 15, Ecuadorian Andes, provide valuable insight into the atmospheric controls on glacier ablation in the inner tropics. Automated measurements of radiative and turbulent fluxes made over the course of a year (14 March 2002 to 14 March 2003) provide a unique view of the interactions between climate and glaciers in the inner tropics (Reference Favier, Wagnon and RibsteinFavier and others, 2004a, Reference Favier, Wagnon, Chazarin, Maisincho and Coudrainb). Over the study period, the SEB was dominated by net radiation, with net shortwave radiation being the major energy input and with sensible turbulent flux being a secondary energy source. Latent-heat fluxes and longwave radiation represented energy losses from the glacier. While net shortwave radiation was found to be the primary energy source for glacier melt, the lack of temperature seasonality meant the elevation of the 0° isotherm continuously fluctuated through the ablation zone on the glacier. Its elevation was also found to control the phase of precipitation (rain vs snow) falling on the glacier. Both precipitation phase and amount controlled the surface albedo, and hence the degree of melt. Thus, primarily through its control on surface albedo, variations in air temperature indirectly control melting rates on this tropical glacier.
Longer-term mass-balance studies on Antizana glacier 15 conducted over the 8 year period 1995–2002 found year-to-year variations in the glacier’s mass balance to be related to El Niño–Southern Oscillation (ENSO) phase (Reference Francou, Vuille and FavierFrancou and others, 2004). Periods of negative mass balance were associated with El Niño periods, which tend to have higher air temperatures, favoring rain over snow in the ablation zone, and lower precipitation totals, which in turn decreased snow cover and lowered surface albedo. In addition, lower cloud cover simultaneously increased the incoming shortwave radiation, and lower wind speeds favored melting over sublimation. All of these factors led to increased ablation during El Niño periods. Conversely, during La Niña events, the glacier experienced colder temperatures, higher snowfall and lower winds. The higher albedo and increased sublimation leads to more negative mass balances (Reference Favier, Wagnon and RibsteinFavier and others, 2004a; Reference Francou, Vuille and FavierFrancou and others, 2004).
Similar energy-and mass-balance studies have been carried out on outer tropical glaciers in the Cordillera Real of the Bolivian Andes. These efforts began in the early 1990s and have focused primarily on Glaciares Zongo and Chacaltaya (Reference Francou, Ribstein, Saravia and TiriauFrancou and others, 1995, Reference Francou, Vuille, Wagnon, Mendoza and Sicart2003; Reference Ribstein, Tiriau, Francou and SaraviaRibstein and others, 1995; Reference Wagnon, Ribstein, Francou and PouyaudWagnon and others, 1999a, Reference Wagnon, Ribstein, Kaser and Bertonb, 2003; Reference RamírezRamírez and others, 2001). These glaciers have been in a state of retreat since the 1940s and experienced accelerated retreat during the 1990s (Reference Francou, Ramírez and MendozaFrancou and others, 2000; Reference RamírezRamírez and others, 2001). The studies provide insight into how the behavior of these outer tropical glaciers which experience distinct wet (January–April) and dry (May–August) seasons as well as a transitional period (September–December) differs from inner tropical glaciers (Reference Francou, Ramírez and MendozaFrancou and others, 2000). In the Bolivian Andes, the wet season corresponds to the austral summer so the ablation and accumulation periods coincide. Field measurements made on these and other outer tropical glaciers, as well as theoretical modeling of vertical mass-balance profiles of outer tropical glaciers (Reference KaserKaser, 2001), point to markedly different accumulation and ablation regimes and hence quite different vertical mass-balance profiles during the wet and dry seasons.
Early mass-balance measurements made on Glaciar Zongo (Reference Francou, Ribstein, Saravia and TiriauFrancou and others, 1995) highlighted the importance of the early (October–December) and late (March– May) wet seasons as critical periods for determining the annual mass balance of the glacier. ENSO events were determined to have a major influence on rapid glacier retreat. More recent, detailed SEB studies revealed that on Glaciar Zongo net radiation is the main energy source (Reference Wagnon, Ribstein, Kaser and BertonWagnon and others, 1999b; Reference Sicart, Ribstein, Chazarin and BerthierSicart and others, 2002). Its high monthly and interannual variability is a function of surface albedo changes. However, neither variations in net all-wave radiation nor in sensible-heat flux could explain the observed seasonality in proglacial discharge (Reference Wagnon, Ribstein, Francou and PouyaudWagnon and others, 1999a, Reference Wagnon, Ribstein, Kaser and Bertonb). More importantly, latent-heat flux was found to be the second most important energy flux and, because of high sublimation rates, represented the main energy sink. While sublimation represented a small percentage of the total ablation, it still controlled the mass balance as energy inputs were expended through sublimation rather than being available for melting, which limited proglacial runoff in the winter. While energy input to the glacier surface is relatively constant throughout the year, much lower specific humidity during the dry season leads to much higher sublimation rates and less melt than during the wet season (Reference Wagnon, Ribstein, Francou and PouyaudWagnon and others, 1999a, Reference Wagnon, Ribstein, Kaser and Bertonb). Studies of the winter energy balance on the high-elevation Glaciar Illimani at the southern end of the Cordillera Real found the SEB to be comparable to a summer SEB over snow on intermediate slopes in Antarctica. Typically, daily all-wave net radiation was negative. A strong negative latent-heat flux caused by strong sublimation also existed during winter (Reference Wagnon, Sicart, Berthier and ChazarinWagnon and others, 2003). The importance of sublimation makes tropical glaciers quite sensitive to changes in specific humidity and represents a peculiarity of the glaciers of the outer tropics (Reference Wagnon, Ribstein, Kaser and BertonWagnon and others, 1999b).
Like the inner tropical glaciers of Ecuador, the outer tropical Bolivian glaciers were found to experience high mass loss during El Niño years, which tend to have dry summers, while lower mass loss was found to be associated with La Niña years, which tend to have wet summers. Examining the observed retreat of the small Glaciar Chacaltaya (Reference RamírezRamírez and others, 2001) together with the detailed mass-balance studies on Zongo demonstrated the mass balance of Chacaltaya to be primarily dependent on ablation rates in the austral summer months of December– February. During these months, high humidity allows available energy to be portioned into melt rather than sublimation. Ablation is controlled by net radiation which is dependent on surface albedo. A dearth of precipitation delays snowfall on the glacier surface, keeping albedo low and enhancing melt. These dry periods are associated with decreased cloudiness which also increases net radiation. Thus, while a correlation between air temperatures and the mass balance of Glaciar Chacaltaya was found to exist on interannual timescales, it was not the main factor controlling the mass balance (Reference Francou, Vuille, Wagnon, Mendoza and SicartFrancou and others, 2003; Reference Favier, Wagnon and RibsteinFavier and others, 2004a).
While Andean glaciers in the inner and outer tropics experience both increased ablation during El Niño phases and decreased ablation during the La Niña phases of ENSO, the physical mechanisms responsible for the variation in ablation are quite different (Reference Favier, Wagnon and RibsteinFavier and others, 2004a). While correlations between glacier retreat and air temperature may exist, the actual physical mechanisms linking the atmosphere and glaciers are much more complex.
Similarly, climatic changes other than increasing air temperature appear to be responsible for the observed retreat of the tropical glaciers in East Africa. While the retreat of the glaciers of Kilimanjaro in Tanzania, East Africa, has been attributed to global warming, several converging lines of evidence and two specific studies suggest that observed retreat of these glaciers since the late 19th century is the result of a decrease in atmospheric moisture beginning around 1880 and the relatively drier climatic conditions that followed (Reference Kaser, Hardy, Mölg, Bradley and and HyeraKaser and others, 2004).
The importance of solar radiation in maintaining modern glacier recession on the summit of Kilimanjaro was demonstrated through the solar radiation model developed by Reference Mölg, Hardy and KaserMölg and others (2003b) for the vertical ice walls of Kilimanjaro’s glaciers. Even with a relatively simple annual cloud cycle, the solar radiation model successfully reproduced the temporal evolution of the summit’s ice bodies. This study qualitatively suggests that solar radiation is the major climatic factor maintaining modern glacier recession on the summit. Additionally, energy-balance studies on horizontal glacier surfaces on Kilimanjaro by Reference Mölg and HardyMölg and Hardy (2004), based on measurements from an automated weather station, suggest that the energy available for melting is dominated by variations in net solar radiation caused by precipitation-driven albedo variations. Latent-heat flux was found to be the second largest energy flux and was negative throughout the year. Sensible-heat fluxes, however, were found to be small.
These findings are consistent with work on Mount Kenya which also indicated a complex set of atmospheric forcings responsible for the observed glacier retreat of this East African glacier. Earlier work (Reference Hastenrath and KrussHastenrath and Kruss, 1992a, Reference Hastenrath and Krussb) indicated that the recession of Mount Kenya’s glaciers from 1899 to 1963, although instigated by precipitation decreases and temperature increases, was controlled by solar radiation. However, glacier recession on Mount Kenya from 1987 appears to have been largely driven by changes in atmospheric humidity which altered the longwave radiation balances and latent-heat fluxes on the glacier surface.
A radiation modeling study by Reference Mölg, Georges and KaserMölg and others (2003a) for the Rwenzori Range, also in East Africa, indicates that observed differences in glacier retreat between glaciers on different peaks within the range can be explained by variations in the mean annual solar radiation on the glacier surfaces. Specifically, a later onset of cloudiness in the mornings and shorter rainy seasons can lead to spatial differences in incoming shortwave radiation which correspond to observed differences in the amount of glacier retreat observed from 1906 to 1955 and from 1955 to 1990.
Reference Allison and KrussAllison and Kruss (1977) present the most extensive study examining the climatic causes responsible for the observed retreat of the glaciers in Irian Jaya. This work concludes that temperature increases are the most probable explanation for the observed recession of Carstensz Glacier over the last century. However, in light of the recent and growing body of work indicating that the physical mechanisms responsible for tropical glacier recession are complex and vary throughout the tropics, it would appear prudent to update and re-examine the record of glacier retreat of the Irian Jaya glaciers. In this study, high spatial resolution satellite images acquired in 2000 and 2002 by the IKONOS satellite are used in conjunction with Geographic Information System (GIS) techniques to accurately map the extent of the glaciers of Irian Jaya and to quantitatively measure their recent recession. These 2000 and 2002 glacier extents are then compared to published extents and areas of the same glaciers. This research represents the first step in comparing recent glacier retreat to the observed retreat in other time periods.
Background and Study Area
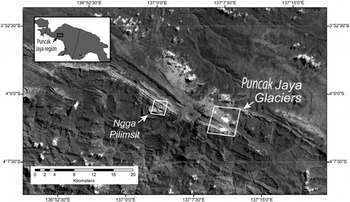
The glaciers of Puncak Jaya are located at 4º05′ S, 137º10′ E on the southern flank of a northeast–southwest-trending mountain range that forms the spine of Irian Jaya (Reference AllisonAllison, 1975), as illustrated in Figure 1. Several visits to and studies of these glaciers have been undertaken (Reference WollastonWollaston, 1914; Reference DozyDozy, 1938 as cited by Reference AllisonAllison, 1975; Reference HarrerHarrer, 1965; Reference Peterson, Hope and MittonPeterson and others, 1973; Reference Allison and KrussAllison and Kruss, 1977; Reference Allison, Peterson, Williams and FerrignoAllison and Peterson, 1989; Reference Peterson and PetersonPeterson and Peterson, 1994). Historical information on the extent of these glaciers and the locations of their termini have been derived from a variety of sources including photographs of the southern fronts of the glaciers taken in 1913, photographs of the northern side of the ridge crest in 1936 and United States Air Force (USAF) aerial photos from World War II (Reference AllisonAllison, 1975). Ice front locations from 1936, 1962 and 1972 were determined from cairns erected during the Dozy visit and later expeditions (Reference Peterson, Hope and MittonPeterson and others, 1973). An extensive research expedition from 1972 to 1973 by the Australian Universities Group provided detailed glaciological, as well as geological, biological and climatological information about the Puncak Jaya region (Reference Hope, Peterson, Radok, Allison, Rotterdam and BalkemaHope and others, 1976). During this expedition the altitude of Puncak Jaya was determined by trigonometric survey to be 4884 m (Reference Peterson, Hope and MittonPeterson and others, 1973). More recent information on glacier extents and positions has been derived from satellite images and aerial photography (Reference Allison, Peterson, Williams and FerrignoAllison and Peterson, 1989; Reference Peterson and PetersonPeterson and Peterson, 1994).
A portion of a 29 May 2003 Landsat-7 scene illustrating the glaciers on Puncak Jaya and the location of Ngga Pilimsit where a glacier was previously located. The large mine to the west of the Puncak Jaya glaciers is the Grasberg mine. An inset map shows the location of the Puncak Jaya region on the island of New Guinea.
The glaciers of Puncak Jaya
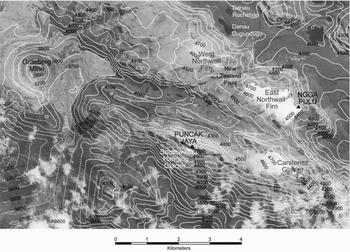
In 1972, the primary constituents of the Puncak Jaya glaciers were the Eastern and Western Northwall Firn, Carstensz and Meren Glaciers and Southwall Hanging Glacier (Reference Allison, Peterson, Hope, Peterson, Radok, Allison and BalkemaAllison and Peterson, 1976). The extent of ice on Puncak Jaya today can be seen in Figure 2 and a brief introduction to the current and former ice masses on Puncak Jaya today follows.
A detailed location map illustrating the Puncak Jaya glaciers and the location of important local peaks. The base map is an IKONOS image acquired on 11 June 2002. The 100 m contours were derived from a 3 arcsec Shuttle Radar Topography Mission (SRTM) digital elevation model (DEM) and are dashed where the DEM elevations were interpolated.
The Northwall Firn
The northernmost ice mass on Puncak Jaya, the Northwall Firn, resides atop a ridge (Fig. 3). In 1936, Reference DozyDozy (1938 as cited by Reference AllisonAllison, 1975) found the Northwall Firn to be one contiguous ice mass; it is thought to have separated into two portions along the New Zealand Pass some time between 1942 and 1962 (Reference Allison, Peterson, Hope, Peterson, Radok, Allison and BalkemaAllison and Peterson, 1976). As observed in 1982 and 1983 Landsat images and confirmed in aerial photos (Reference Allison, Peterson, Williams and FerrignoAllison and Peterson, 1989), these ice masses had then further disintegrated into four independent firn fields. As detailed below, these ice masses have continued to reduce and further fragment through to 2002.
IKONOS image subsets from 8 June 2000 and 11 June 2002 used for mapping glacier extents.

Meren Glacier
In 1936, Dozy reported that Meren Glacier was fed by two firn fields: the southeasterly portion of the Northwall Firn and a firn field east of the Meren tongue, which he named the Middle Firn (Reference AllisonAllison, 1975). In 1972, Meren Glacier was determined to extend from 4862ma.s.l. to lower limits of approximately 4256ma.s.l. As can be seen in Figure 3, Meren Glacier no longer exists and its disappearance will be documented in detail below.
The Carstensz Glacier system
Carstensz Glacier (Fig. 3), along with two smaller glaciers, Wollaston and Van de Water Glaciers which extend from its southeastern portions, lies to the south of the former Meren Glacier (Reference AllisonAllison, 1975; Reference Allison, Peterson, Hope, Peterson, Radok, Allison and BalkemaAllison and Peterson, 1976). The two smaller glaciers were first identified by Dozy and Colijn in 1936 and described as short and broken (Reference MercerMercer, 1967). In 1962, Harrer reported that Wollaston Glacier had disappeared (Reference HarrerHarrer, 1965). However, Reference Peterson and PetersonPeterson and Peterson (1994) reported that it was still distinguishable, but nearly gone in 1991.
Based on geometric dynamics modeling of Carstensz and Meren Glaciers, Reference Allison and KrussAllison and Kruss (1977) estimated that glacier recession began in the Puncak Jaya area in the mid- 1800s. The modeling also indicates that Carstensz Glacier must have receded by 80m per century since the onset of glacier recession. Since precipitation decreases were insufficient to explain the observed glacier recession, the most probable explanation for this trend was given to be a temperature increase of 0.6°C over the previous century, which corresponded to reported increases in overall tropical temperatures at the time (Reference Allison and KrussAllison and Kruss, 1977).
Nagga Pilimsit
In addition to the glaciers on Puncak Jaya, two other ice masses used to be found approximately 12 km to the west (Fig. 1). These were a small ice cap several hundred meters in diameter known as the Nagga Pilimsit ice cap and a similar-sized glacier lying on a ledge below the cap. These ice masses were known to exist at least into the early 1980s (Reference Allison, Peterson, Williams and FerrignoAllison and Peterson, 1989).
Methods
Recent retreat of the glaciers on Puncak Jaya was measured using IKONOS images of the Puncak Jaya glaciers acquired on 8 June 2000 and 11 June 2002 (Fig. 3). In the mapping, a three-band color composite image was created using 0.632– 0.698 μm, 0.506–0.595 μm and 0.445–0.516 μm for the red, green and blue bands, respectively. As the images were acquired at the same time of the year, the solar zenith and solar azimuth angles were comparable for the two images, which was advantageous both for image co-registration and for mapping, as shadowing was quite similar between the two images.
The standard IKONOS georectified products are rectified to a map projection and datum which in this study was Universal Transverse Mercator (UTM) projection (zone 53 S) and the World Geodetic System 1984 (WGS84) datum. However, standard IKONOS products are not orthorectified and positional accuracy is limited by relief displacement. Therefore, image misregistration can complicate glacier mapping.
Image co-registration
Preliminary investigations revealed differences in the UTM coordinates of stable and easily identifiable features between the two images of approximately 50 m. An automated image correlation routine was used to achieve a more exacting co-registration of image subsets of the glaciated areas (Fig. 3). Correlation between the search and reference images was accomplished through cross-correlation using 128 × 128 pixel subsets of single-band grayscale images. For each correlated location, the correlation routine returns the X, Y offset of the search image relative to the reference image, an estimate of the correlation strength and a probable root-mean-square error for the final alignment solution. The image correlation routine used the 2002 image as a base map and a 20 m spacing in X and Y Using this automated procedure, over 25 000 precise ground-control points (GCPs) were identified that had a high strength correlation and a probable rms error of < 1 m.
Final rectification of the 2000 image to the 2002 image was accomplished using Delaunay triangulation for localized adjustments (Reference GoshtasbyGoshtasby, 1986). Careful visual examination of the co-registration was then undertaken to assure its accuracy was sufficient for mapping glacial boundary change. Over much of the image, the two images were aligned to within <1 m. In a few areas of high relief with complicated shadowing, offsets between the two images of up to 8 m were observed. However, these areas covered less than approximately 5% of the subset images.
Glacial boundary mapping
Following co-registration, precise mapping of the glacial margins for both dates was accomplished within a GIS, through visual image interpretation and manual digitization. The 1 m spatial resolution and high quality of the two IKONOS images provided a clear spectral contrast between the glacier ice and the surrounding bedrock, allowing the glacier margins to be clearly distinguished in the IKONOS images. Figure 4 illustrates the 2000 and 2002 mapping while Figure 5 shows an enlarged example for a portion of Carstensz Glacier. The glaciers of Irian Jaya currently lack marginal moraines and large areas of debris-covered ice, which also facilitated glacier mapping.
Changes in the extent of the Puncak Jaya glaciers from 2000 to 2002 for the Eastern Northwall Firn, Carstensz Glacier and the Western Northwall Firn. The numbers correspond to the separate ice masses listed in Table 1. The background image is the 11 June 2002 IKONOS image.

Mapped glacier boundaries for the upper regions of Carstensz Glacier in 2000 and 2002.

Glacier mapping of individual ice masses within the three largest remaining ice regions on Puncak Jaya was accomplished through visual analysis of the IKONOS images and manual digitization as follows. Along most of the length of the glacier margins, identification of the glacial margin at the individual 1 m pixel level could be accomplished by onscreen mapping at scales of 1 :1000 or higher. However, in some locations the similar color of the glacier ice and surrounding bedrock in the color composites made it difficult to separate glacier and bedrock at the individual pixel level at that scale. Along these portions of the glacier margin, the glacier area was first delineated at a smaller map scale (1 :4000). Once the general glacier margin had been mapped at this smaller scale, it was possible to more precisely locate the glacier margin at a mapping scale of 1 :1000. In a few extremely difficult cases, mapping was restricted to the 1 : 4000 scale. Overall, along most (90%) of the length of the glacier margins, it was possible to identify the margin within a single pixel or ±1 m.
Only ice masses with areas of at least 500 m2 were analyzed, due to difficulties in assessing the boundaries of smaller ice masses. The extent of Southwall Hanging Glacier could not be adequately mapped due to deep shadowing in the upper regions of this small ice mass. Once the glacier margins were mapped, glacier areas were calculated within a GIS.
As no field validation of the two images at the time of image acquisition was possible, our mapping relies on standard image interpretation. It is important to recognize that the mapped areas represent the maximum glacier extents, as the mapping may misidentify snow-covered bedrock as a glacier surface. However, the images are of high resolution, and even in the higher-altitude snow-covered areas the glacier boundaries appear quite distinct. Ice is easily distinguished from snow in the color composites by its lower reflectance and bluish tint.
Figure 5 illustrates our mapping of the upper reaches of Carstensz Glacier for both of the IKONOS images and represents one of the most difficult areas to accurately map. As can be seen in the figure, it appears visually that there is little snow outside the glaciers. In both years, bare ice is visible along much of the glacier margins providing added confidence in the mapped extents.
Additionally, as also can be seen in Figure 5, there is good correspondence between the mapped glacier boundaries between the two image acquisitions, even in the high-reflectance snow-covered areas. Consistent misidentifica-tion of glacier boundaries due to transient snow cover would have required similar transient snow extents to exist during both image acquisitions. Moreover, there is clear evidence for glacier retreat during the two periods, which also suggests that transient snow cover is not severely affecting our mapped glacier margins. One potential measure of mapping errors and co-registration errors is areas that were mapped as glacier in 2002, but not in 2000, which is probably unlikely. In total, these potentially misidentified (or misaligned) glacier areas represent approximately 0.2% of the mapped 2000 glacier area. Thus, any mapping errors associated with misidentification of transient snow cover as glacier are small, and are much smaller than the observed glacier retreat over the 2 year period.
A Shuttle Radar Topography Mission (SRTM) digital elevation model (DEM) provided topography for the region. The SRTM mission was flown in February 2000 and used interferometric synthetic aperture radar (SAR) techniques to acquire topography for most of the world lying between 60° N and 56° S latitudes (Reference Rabus, Eineder, Roth and BamlerRabus and others, 2003). For the study area, elevations at 3 arcsec postings (approximately 90 m) are publicly available (Fig. 2). For the majority of the unglaciated part of the study area, the DEM was complete. However, for portions of the glaciers, holes present in the DEM were interpolated using the standard tools available in the ENVI image-processing software.
Results and Discussion
Glacier mapping from the 2000 and 2002 IKONOS images reveals that the dramatic retreat of the Puncak Jaya glaciers that began in the mid-1800s has continued. Of the seven main ice masses occupying Puncak Jaya in 1972 – the Eastern and Western Northwall Firn, Meren, Carstensz, Wollaston and Van de Water Glaciers and Southwall Hanging Glacier (Reference AllisonAllison, 1975) – only four can be definitely identified as existing in 2002 (Fig. 4). These are the Eastern and Western Northwall Firn, Carstensz Glacier and South-wall Hanging Glacier. Meren Glacier has disappeared and its previous accumulation area now constitutes a portion of the Eastern Northwall Firn. Wollaston Glacier seems to have disappeared entirely and Van de Water Glacier has, at the very least, been reduced to small fragmented ice masses (Fig. 5). In this study, the areas of these small remaining fragments are included in the area totals for Carstensz Glacier.
Previously published glacier extents
Comparisons of the 2000/2002 areas (Table 1) with previously published extents are listed in Table 2, which attempts to construct a complete and accurate picture of the changing glacier areas on Puncak Jaya. (Mapped glacier extents for 1972, 1987 and 2002 are illustrated in Figure 6.) A graphical representation of the recession of these glaciers since the mid-19th century is shown in Figure 7 while Table 3 compares the annual rates of ice loss between measured periods. The surface ice areas prior to our 2000/2002 measurements are derived from the compilations of Reference AllisonAllison (1975), Reference Allison, Bennett, Hope, Peterson, Radok, Allison and RotterdamAllison and Peterson (1976, Reference Allison, Peterson, Williams and Ferrigno1989) and Reference Peterson and PetersonPeterson and Peterson (1994). Here we highlight uncertainties in the published areas and discuss the process by which the comparisons were made.
Comparison of Puncak Jaya glacier extents in 1972 (Reference Hope, Peterson, Radok, Allison, Rotterdam and BalkemaHope and others, 1976), 1987 (Reference Allison, Peterson, Williams and FerrignoAllison and Peterson, 1989) and 2002 (this work). The background image is the 11 June 2002 IKONOS image.

Areas of the Puncak Jaya glaciers from ~1850 to 2002. Circles indicate years for which published observations of glacier areas exist.

Areas and ice loss of Puncak Jaya glaciers from 2000 to 2002 as determined from analysis of IKONOS images

Areas (km2) of the Puncak Jaya glaciers. Italicized values represent our totals computed from published areas

Rates of ice loss (km2 a –1) from ~1850 to 2002 computed from the areas in Table 2

The 1972 extents given in Table 2 were acquired during the Carstensz field expeditions (Reference AllisonAllison, 1975; Reference Allison, Peterson, Hope, Peterson, Radok, Allison and BalkemaAllison and Peterson, 1976). As part of the expeditions, the glacier boundaries were outlined and a topographic map was created. The positions of the glacier fronts are considered quite accurate. However, the boundaries of the Western Northwall Firn, the far western and eastern boundaries of the Eastern Northwall Firn and the most eastern and southeastern boundaries of the Carstensz Glacier system (including the glacier boundaries of Wollaston and Van de Water Glaciers) were mapped with much lower confidence. These glacier margins were plotted either solely from oblique aerial photographs or by a combination of field survey and photographs (Reference Allison, Peterson, Hope, Peterson, Radok, Allison and BalkemaAllison and Peterson, 1976).
A subsequent study by Reference Allison, Peterson, Williams and FerrignoAllison and Peterson (1989), using a 1974 Landsat multispectral scanner (MSS) image, determined that the eastern and far western boundaries of the Eastern Northwall Firn mapped in 1972 did not correlate well with the snow and ice areas visible in the Landsat MSS image. Therefore, approximately 0.25 km2 was added to the area of Meren Glacier and 0.2 km2 was added to the area of Carstenz Glacier; these changes are represented by the 1972 corrected values in Table 2. While both the 1972 and 1972(corrected) areas are provided in Table 2, the corrected values were selected for computing the historical ice loss record for the region (Table 3; Fig. 7).
Figure 6 illustrates some of the difficulties in comparing the 1972 eastern boundaries with the 2000/2002 boundaries of the Eastern Northwall Firn and Carstensz Glacier, as considerable discrepancy can be seen along the eastern margins. The lack of good GCPs and the rugged topography over the eastern regions hinders an exact registration of the maps to the IKONOS images. However, distortion of the 1972 maps is thought to be minimal because the surface areas of the glaciers, determined using GIS for 1972, replicated the area measurements provided in the literature. Reference Peterson and PetersonPeterson and Peterson (1994) reported similar results when correlating the surface extents they extracted from a 1987 Systeme Probatoire pour l’Observation de la Terre (SPOT) image with the 1972 areas. Therefore, this study confirms the conclusions of Reference Allison, Peterson, Williams and FerrignoAllison and Peterson (1989) and Reference Peterson and PetersonPeterson and Peterson (1994) that satellite technology can significantly facilitate defining these glacier boundaries.
From a SPOT satellite image, Reference Peterson and PetersonPeterson and Peterson (1994) calculated the area of ice on Puncak Jaya to be a little less than 3 km2 in 1987. While they did not differentiate the areas of individual ice masses, they did provide a map showing glacier extents in 1987 along with ice extents and terminus locations from previous studies. This map was scanned and co-registered to our 2002 IKONOS image in order to calculate the areas of individual ice masses in 1987 with a GIS (areas are listed in brackets in Table 2). The GIS computation determined the total area of ice on Puncak Jaya (excluding Southwall Hanging Glacier) from the 1987 map to be 5 km2. The accuracy of our calculation was verified in three ways. Firstly, the graphical scale bar of the original map was checked against the measured distance in our GIS and was found to be correct. Secondly, the area of a small lake, Danau Dugundugu, was measured from the 1987 map and from the 2002 IKONOS image. The areas were found to be comparable. Finally, the area of the 1972 Western Northwall Firn shown on the 1987 map was determined using GIS and was found to be the same as the published values. Therefore, we believe that our 5 km2 estimate of the ice area on Puncak Jaya in 1987 is accurate and our discussion is based on these modified 1987 areas.
A final complication exists in comparing the Puncak Jaya surface extents. This concerns the definitions of the Meren Glacier/Northwall Firn and the Carstensz Glacier systems. In 1972, the boundary between Meren Glacier and the Eastern Northwall Firn was determined through field studies. It was expected that this boundary would shift as Meren Glacier continued to recede (Reference AllisonAllison, 1975). Between 1987 and 1991, Meren Glacier separated from the firn area feeding it (Reference Peterson and PetersonPeterson and Peterson, 1994). By 2000, the lower reaches of Meren Glacier had disappeared entirely. Therefore, the firn area previously feeding Meren Glacier is included in the Eastern Northwall Firn totals for 2000 and 2002. A similar problem exists in separating Wollaston and Van de Water Glaciers from each other and from Carstensz Glacier. In addition, as explained above, uncertainties exist in determining the 1972 boundaries of these glaciers. Therefore, in Table 3 and in Figure 7, individual and contiguous system ice extents are provided, when available, in an effort to accurately illustrate the recession of these glaciers since the mid-19th century.
Changes in Puncak Jaya ice extent 1850–2000
Based on the observed ice losses from the 2000 and 2002 IKONOS images, and from previous published studies of the region’s glaciers, a history of ice loss on Puncak Jaya has been constructed (Fig. 7;Table 3). From 1850 to 2002 the ice area on Puncak Jaya (excluding Southwall Hanging and Harrer Glaciers) decreased from 17.8 km2 to 2.15 km2. This represents a loss of 15.6 km2 or 88% of the total neoglacial ice area. Of the total Puncak Jaya ice loss, the Northwall Firn/Meren Glacier system and the Carstensz Glacier system represent 81.5% and 18.5%, respectively.
From the neoglacial through to 2002, the rate of ice loss on Puncak Jaya has been far from uniform as is evident in Figure 7 and Table 3. The firn fields and valley glaciers have exhibited different patterns of retreat. Overall, ice loss on Puncak Jaya has been primarily driven by area loss in the Northwall Firn rather than in the two valley glaciers.
The Northwall Firn appears to have experienced rapid retreat from 1936 to 1942, which is consistent with worldwide tropical glacier retreat during the same period (Reference KaserKaser, 1999). During the early 1970s a second period of rapid retreat of the Northwall Firn seems to have occurred. However, it does not appear that the Puncak Jaya valley glaciers suffered a similar high rate of area loss during the 1930s or the 1970s. Comparing the glacier areas mapped in 2000 with the mapped areas of 1972, from which the most detailed area totals are available, reveals that by 2000 the glaciers had lost 67.6% of their 1972 area, being reduced in area from 7.2 to 2.33 km2 of ice.
Also evident from Figure 7 is that the rates of ice loss are higher from 1987 to 2000 than from 1974 to 1987. Meren Glacier and the Northwall Firn continued to prominently affect the amount of ice lost on Puncak Jaya during this time. However, in addition, and unlike earlier periods, the Carstensz Glacier system appears to have experienced a significantly increased rate of area loss during this period. The rate of ice loss appears to have slowed from 2000 to 2002, with recession rates being less than half of those of 1987–2000 (Table 3).
Changes in Puncak Jaya ice extent, 2000–2002
Comparing the two high-resolution IKONOS images enables a detailed examination of ice loss over this 2year period. The computed total surface area for all mapped ice masses on Puncak Jaya was 2.326 km2 and 2.152 km2 in 2000 and 2002, respectively (Table 1). Over this 2 year period, the Puncak Jaya glaciers lost an overall area of 0.174 km2 which constituted 7.48% of the glacier area mapped in 2000. Of this observed glacier wastage, the Western Northwall Firn contributed 39.1%, the Eastern Northwall Firn 31.6% and Carstensz Glacier 29.3%.
Retreat was observed along most of the glacier margins. In a few instances, there appears to have been some extension of the glacier margins between 2000 and 2002 (Fig. 4). However, many of the areas experiencing an apparent advance are also areas of rugged topography. Some of the apparent gain in area is probably the result of misregistration of the two images for isolated areas.
Detailed glacier changes
In addition to examining changes in the total ice area on Puncak Jaya, it is illuminating to examine changes in the individual ice masses in greater detail. The amount and patterns of retreat differ among the ice masses on Puncak Jaya.
The Northwall Firn and Meren Glacier
Since the neoglacial, the Northwall Firn has retreated. Some time between 1942 and 1962 the Northwall Firn separated into two parts and since then it has continued to disintegrate and fragment. Meren Glacier has steadily retreated until separating from the Northwall Firn some time between 1987 and 1991 (Reference Peterson and PetersonPeterson and Peterson, 1994). In particular, the Northwall Firn/Meren Glacier system experienced high rates of area loss from 1936 to 1942 and again from 1972 to 1974. Comparing the area losses from the neoglacial until 1972, it is clear that the Northwall Firn was losing area at a much higher annual rate than Meren Glacier.
As can be seen in Table 2, the Western Northwall Firn lost significant area (4.2 km2) between 1936 and 1972. From 1972 to 1987, the Western Northwall Firn decreased from 2.5 to 1.3 km2, nearly half its area. From 1987 to 2000, its rate of ice loss was nearly the same (Table 3), and by 2000 its area had declined to 0.35 km2, 27% of its 1987 area.
In both 2000 and 2002, the Western Northwall Firn consisted of four small ice masses. As three ice masses were observed in a 1983 Landsat image by Reference Allison, Peterson, Williams and FerrignoAllison and Peterson (1989) (one of which is outside the mapped area shown in Fig. 6), it would appear that the Western Northwall Firn has continued its disintegration and fragmentation into smaller and smaller ice bodies. From 2000 to 2002, the Western Northwall Firn lost 0.068 km2 or approximately 19.4% of its total area, reducing its size from 0.351 km2 in 2000 to 0.283 km2 in 2002. Thus the Western Northwall Firn has lost 89% of its 1972 (uncorrected) area over the 30 year period ending in 2002.
In comparison to its western counterpart, the Eastern Northwall Firn has largely remained contiguous from 1972 to 2002, with only two very small outlying ice masses observed in 2002. The smaller of the two outlying ice masses located on the northeast side of the firn field had an area of 0.003 km2, while the ice mass on the southwest side was too small to accurately determine and is too small to be seen in Figure 4. From 2000 to 2002, the Eastern Northwall Firn lost 0.055 km2, an approximate 4.5% area loss over the 2 years.
In 1972, Meren Glacier had an area of 2.2 km2 which included the accumulation area shared with the Eastern Northwall Firn. However, the glacier was not visible in either 2000 or 2002 and therefore all areas outside the Eastern Northwall Firn area that fed this glacier disappeared some time after 1991. This finding is consistent with the assessment of Reference Peterson and PetersonPeterson and Peterson (1994) that Meren Glacier had separated from its firn field and would completely melt within a few years.
Carstensz Glacier
The rate of ice loss from Carstensz Glacier is much lower than that of Meren Glacier and the Northwall Firn. In fact, assuming the date of the neoglacial maximum is 1850, the rate of area loss from the 1930s until the 1980s was actually lower than that from the neoglacial maximum to the 1930s. Reference Peterson and PetersonPeterson and Peterson (1994) proposed that the slower retreat of Carstensz Glacier compared to Meren Glacier was due to a higher proportion of its accumulation area existing at higher elevations than Meren Glacier.
The surface area of the entire Carstensz Glacier system was determined to be 1.4 km2, 1.4 km2, 0.747 km2 and 0.696 km2 in 1972, 1987, 2000 and 2002, respectively. Between 1972 and 2000, the Carstensz system lost an area of 0.653km2 or 46.6% of its 1972 area. However, Carstensz Glacier did not lose considerable ice mass from 1972 to 1987. This is consistent with the assessment of Reference AllisonAllison (1975), based on his numerical modeling, that Carstensz Glacier was nearing an equilibrium position in 1974, while Meren Glacier would retreat much farther. However, in the 1980s the rate of area loss of Carstensz Glacier increased significantly (Table 3), but it slowed appreciably from 2000 to 2002. Over the 2000–02 period, the Carstensz Glacier system lost an additional 0.051 km2, which amounts to 6.8% of its 2000 area.
The IKONOS images show that along the northeastern margin of Carstensz Glacier, in the uppermost accumulation area, the ice appears to be disintegrating. While six smaller ice masses were observed in this region in the 2000 image, only three remained in 2002. Of these small ice surfaces, only two were both large enough to accurately map and located in areas lacking significant shadowing. Although fairly insignificant in size, these areas are included in the totals for the Carstensz Glacier system listed in Table 1.
While we found it difficult to clearly delineate between Carstensz and Wollaston Glaciers on the IKONOS images, comparison with 1972 maps suggests that Wollaston Glacier has receded to the point that it is no longer discernible from Carstensz Glacier in the 2000 IKONOS image. Based on our visual interpretation and the conclusion of Reference Peterson and PetersonPeterson and Peterson (1994) that Wollaston Glacier was distinguishable but nearly gone in 1991, we are fairly confident that Wollaston Glacier no longer constitutes an ice area of its own. Similarly, Van de Water Glacier has either disappeared entirely, or been reduced to a few small remnants (Fig. 5). However, without substantiating field mapping or independent collaboration from other authors concerning this area, it is difficult to state the current status of this glacier.
Southwall Hanging Glacier
Southwall Hanging Glacier was identified in both the 2000 and 2002 images. However, its small size and its location on the southern side of a steep cliff with deep shadowing of its upper portion prohibited accurate delineation of its boundaries, so the glacier was not mapped and its areas are not included in the results.
Nagga Pilimsit
The small Nagga Pilimsit ice cap was visible in Landsat MSS images as late as 19 March 1983 (Reference Allison, Peterson, Williams and FerrignoAllison and Peterson, 1989). However it is not visible in a Landsat-7 Enhanced Thematic Mapper Plus (ETM+) image from 29 May 2003 nor an Advanced Spaceborne Thermal Emission and Reflection Radiometer (ASTER) acquired image of 9 May 2003. Therefore, this glacier disappeared entirely within the intervening time period.
Possible causes for the retreat of the Puncak Jaya glaciers
As the glaciers of Puncak Jaya have receded, their elevation ranges have also diminished. Integrating the mapped areas of these glaciers in 1972, 1987 and 2002 with a SRTM DEM enabled a preliminary investigation of hyposmetric (area– altitude) changes in elevations containing glacier ice. The DEM appears quite reasonable for the Western Northwall Firn and for Carstensz Glacier, but unfortunately the currently glaciated portions of the Eastern Northwall Firn required greater interpolation. In addition, the 1972 mapping of the eastern margins of the Eastern Northwall Firn and Carstensz Glacier are approximate. Thus changes in the upper regions (above about 4600 m) of the Carstensz Glacier system between 1972 and 1987 can only be considered approximate. Since the study utilizes 2000 elevations, lowering of the surface over time cannot be accounted for in this analysis. Despite these problems, an initial picture of elevation changes in these glaciers can be constructed, especially for those altitudes that have become ice-free since the early 1970s.
Figure 8 illustrates changes in altitudinal extent of these glacier masses since 1972. Not surprisingly, all three ice masses show greater loss in their lower altitudes from 1972 to 1987 than from 1987 to 2002. From 1972 to 1987, altitudes below 4550 m experienced the greatest ice loss, while from 1987 to 2002 higher altitudes began losing significant mass as well.
Hypsometric (area-altitude) relationships for (a) the Western Northwall Firn, (b) the Eastern Northwall Firn and (c) Carstensz Glacier. The gray bars on the positive side of each of the three graphs illustrate the surface areas (km2) falling in 25 m elevation bins for each glacier. Dotted bins indicate those altitude bins in which >25% of the DEM elevations were interpolated. The lines on the negative side of the graph illustrate the loss of glacier area (in km2) between 1972 and 1987 (solid line) and 1987 and 2002 (dashed line). Note that, due to uncertainties in the 1972 map, Carstensz Glacier areas at altitudes above 4500 m in 1972 are only approximate.

As is evident from Figure 8a, the Western Northwall Firn experienced much greater mass losses in both time periods than did the other two ice masses. The altitudes at which the Western Northwall Firn fields existed narrowed from a lower limit of approximately 4510 m and an upper limit of 4750m in 1972 (Reference Allison, Peterson, Hope, Peterson, Radok, Allison and BalkemaAllison and Peterson, 1976) to 4575 m and 4625 m, respectively, in 2002. While the altitudes with the greatest area loss have increased between the two time periods, extensive loss of glacier area has occurred at all altitudes. The remnants of the Western Northwall Firn are not found at the highest altitudes encompassed by its former extent.
For the combined Eastern Northwall Firn/Meren Glacier system (Fig. 8b), there is a clear shift to higher altitudes in the elevations that lost mass between 1972 and 1987 and between 1987 and 2002. While all altitudes experienced some area loss from 1972 to 1987, altitudes below 4500 m experienced the greatest ice loss, while from 1987 to 2002, altitudes between 4450 and 4625 m experienced a considerable loss of area. The lower margin of the Eastern Northwall Firn/Meren Glacier system increased from approximately 4260 m in 1972 (Reference Allison, Peterson, Hope, Peterson, Radok, Allison and BalkemaAllison and Peterson, 1976) to 4425 m in 2002, a rise of 165 m.
The Carstensz Glacier system, which flowed from 4800 m to 4380m in 1972 (Reference Allison, Peterson, Hope, Peterson, Radok, Allison and BalkemaAllison and Peterson, 1976), only reached approximately 4500m in 2002, indicating a rise of the terminus of 120m from 1972 to 2002. While it is difficult to examine area loss as a function of elevation from 1972 to 1987, from 1987 to 2002 it is clear that glacier area was lost at all elevations.
In 1972, mass-balance surveys placed the equilibriumline altitude (ELA) of the Puncak Jaya glaciers at 4580 m. This altitude may be higher than average for the time period, as 1972 was considered a drought year (Reference AllisonAllison, 1975). Several converging lines of evidence suggest that by ~2000 the ELA of these tropical glaciers had risen by approximately 100m. The first line of evidence is the disappearance of Meren Glacier below altitudes of about 4650–4700m, as determined from the 1972 topography presented in Reference AllisonAllison (1975). Loss of all ice below this altitude means the ELA must lie above 4650m.
Observations of the transient snowline also support the hypothesis of a rising ELA. In both the 2000 and 2002 images, snow was limited to areas located above 4600 m for all the ice masses. The transient snowline was slightly higher at the time the 2000 image was acquired, with transient snowlines at approximately 4600m on the Eastern North-wall Firn, 4650 m on the Western Northwall Firn and 4650– 4700 m on Carstensz Glacier. This would indicate that in 2000 and 2002 the ELA would be at a minimum at these altitudes. The IKONOS images show considerable melt was occurring at elevations below the transient snowline on the lower reaches of Carstensz Glacier.
Numerous englacial melt ponds, similar to those described by Reference Allison, Bennett, Hope, Peterson, Radok, Allison and RotterdamAllison and Peterson (1976) for Meren Glacier, are visible in the 2000 image on Carstensz Glacier. In earlier times, heavy crevassing on Carstensz Glacier prohibited the formation of these melt ponds, and only one was reported in 1972. Thus the formation of these englacial melt ponds suggests a change in glacial dynamics for at least the lower portions of Carstensz Glacier, as crevassing is no longer preventing pond formation.
The emergence of a sizable rock outcrop at 4600 m in the ablation area of Carstensz Glacier between 2000 and 2002 provides additional evidence that Carstensz Glacier is thinning (Fig. 4). Based on the elevation changes and the location of the transient snowline in the two IKONOS images, we estimate that the ELA in 2002 has risen to at least 4650 m. This is, at a minimum, an increase of 70 m over the ELA of 4580 m reported for 1972 (Reference AllisonAllison, 1975).
Both the theoretical work of Reference KaserKaser (2001) and detailed field studies of other inner tropical glaciers (Reference Favier, Wagnon and RibsteinFavier and others, 2004a, Reference Favier, Wagnon, Chazarin, Maisincho and Coudrainb; Reference Francou, Vuille and FavierFrancou and others, 2004) indicate these Irian Jaya glaciers should exhibit a high sensitivity to an increase in air temperature. In fact, the theoretical model which was able to successfully reproduce the observed measured vertical mass-balance profiles of these Irian Jaya glaciers indicates that the observed 100 m rise in the ELA does not require large perturbations in either air temperature or global radiation (Reference KaserKaser, 2001). In fact, a 100 m rise in the ELA could be caused by a perturbation in air temperature of < 1K or slightly more than a 1 MJm–2d–1 change in global radiation.
However, observations of the precipitation regime on Puncak Jaya in the early 1970s indicated that at 4250 m most of the observed precipitation fell as rain, while on the summit of Nagga Pulu, at 4862 m, most of the precipitation fell as snow (Reference AllisonAllison, 1975). Precipitation within the accumulation zone of the glaciers was observed to fall as sleet or wet snow (Reference Allison, Bennett, Hope, Peterson, Radok, Allison and RotterdamAllison and Bennett, 1976). Thus, as on Antizana glacier 15, the relationship between the observed rise in the ELA and increases in air temperature may be indirect and more likely to be caused by changes in the phase of precipitation rather than simply through increases in the sensible-heat flux.
Both detailed analysis of the area losses of the Puncak Jaya ice masses over time and the loss of glacier area as a function of elevation show considerable differences between the Western Northwall Firn, the Eastern Northwall Firn/Meren Glacier system and the Carstensz Glacier system (Fig. 8). In addition to having a much larger area and proportion of neoglacial ice lost, the Western Northwall Firn appears to have lost a considerable amount of its area at all elevations. This would suggest that ice loss is being driven by a more complicated set of factors than a simple temperature-driven increase in the ELA. In the 2000 IKONOS image, only a small portion of the largest remaining ice mass in the Western Northwall Firn was covered by snow. The remainder of the Western Northwall Firn surface was snow-free, indicating that most of the firn field was ablation area at this time.
In the 2000 and 2002 IKONOS images, it can be seen that the remaining ice masses of the Western Northwall Firn are found in protected south-facing localities that provide a degree of shelter from incoming solar radiation when the sun is to the north. This leads us to speculate that variation in net radiation across the glacier surfaces may be the driving force for differential ablation of these ice masses, rather than temperature acting alone. Very limited energy-balance measurements made on the Puncak Jaya glaciers in 1972 indicate the importance of net radiation in providing energy for melt (Reference Allison, Bennett, Hope, Peterson, Radok, Allison and RotterdamAllison and Bennett, 1976), but this conclusion must be treated cautiously. However, these observations do suggest that a radiation modeling study similar to those of Reference Klein, Masek and IsacksKlein and others (1996) and Reference Mölg, Georges and KaserMölg and others (2003a, Reference Mölg, Hardy and Kaserb) may be able to provide insight into the differential retreat of the ice masses on Puncak Jaya.
Conclusions
While a long-term mass-balance record for the Puncak Jaya glaciers does not exist, a long history of visits and published reports documenting the recession of these glaciers does exist. This study extends this history by documenting changes in the glaciers of Puncak Jaya, through visual analysis and detailed mapping of glacier boundaries from IKONOS images acquired in 2000 and 2002.
Glacial recession on Puncak Jaya has continued over the past century and a half, and by 2002 the glaciers of Puncak Jaya had retreated to only 22% of their maximum neoglacial extent. Relatively rapid retreat of the glaciers of Puncak Jaya continued from 2000 to 2002, with the glaciers losing 7.48% of their 2000 area during this 2 year period. Some time between 1992 and 2000, Meren Glacier disappeared entirely.
However, it is not apparent that the glaciers of Irian Jaya are presently experiencing their highest rates of glacier recession. The observed pattern of recent retreat of the Puncak Jaya glaciers is consistent with what is known about the general state of tropical glacier retreat (Reference Kaser and OsmastonKaser and Osmaston, 2002) and is somewhat contradictory to the assessment of tropical glacier retreat presented in Reference HoughtonHoughton and others (2001).
Overall changes in the extent of the Puncak Jaya glaciers are driven by changes in the extent of the Northwall Firn. Based on historical mapping, the Northwall Firn appears to have experienced two distinct short periods of accelerated melting, one from 1936 to 1942 and another from 1972 to 1974. Once the Northwall Firn divided into two portions, some time before 1962, the western portion began rapidly disintegrating, while the eastern portion has largely remained contiguous. Following a period of rapid recession during the early 1970s, the retreat rate of the Northwall Firn appears to have diminished. The Carstensz Glacier experienced accelerated retreat from the 1970s through to the late 1980s.
The focus of this study was to use remote sensing to update the retreat history of the Irian Jaya ice masses. It serves as a basis for continued monitoring of the retreat of these unique ice masses using satellite technologies. This work is also serving as the foundation for examining the observed retreat of these tropical glaciers in light of regional trends in temperature and precipitation as well as spatial patterns of solar radiation, to better understand what climatic changes may be responsible for the observed retreat.
If the short-term retreat rates from 2000 to 2002 continue, the glaciers on Irian Jaya can be expected to disappear entirely within the next 50 years. If retreat continues at the rate measured from 2000 to 2002, the Eastern Northwall Firn will disappear in 11 years, Carstensz Glacier in 30 years and the Western Northwall Firn in 45 years.
Acknowledgements
Hongxing Liu of Texas A&M kindly provided his image correlation code to this project, and B. Hunter Priest provided extensive computer support. The project was funded by the NASA Young Investigators Program grant 02-000-0115. We thank two anonymous reviewers whose thoughtful comments greatly improved the manuscript.


