


1. Introduction
Florida has historically been the largest citrus-producing state in the U.S. In 2004, for example, Florida accounted for 80% of the total domestic production (USDA-NASS 2024a). But since 2005, the Florida citrus industry has been facing the challenges posed by citrus greening or Huanglongbing (HLB) disease. HLB is considered to be the most devastating citrus disease worldwide (Huang et al. Reference Huang, Araujo, Nño, Kund, Trumble, Roper, Godfrey and Jin2021), negatively affecting yield, fruit size and quality, and tree mortality. In an attempt to manage the disease, Florida citrus growers have tried adopting several different practices (Li et al. Reference Li, Wu, Duan, Singerman and Guan2020), but most had no remarkable effect other than resulting in an increased cost of production. The significant increase in cost of production per acre and simultaneous decrease in yield resulted in an estimated increase in the real cost of production per box of more than 400% (Singerman Reference Singerman2019). Despite that prices increased as a consequence of the lower supply, it was not enough to offset the increase in cost. Thus, the disease has been causing economic losses to growers and other industry stakeholders season after season, driving many of them out of business and progressively shrinking the state’s citrus industry (Singerman Reference Singerman2024a). By 2024 citrus production in Florida had decreased by 93% since the disease was first found in the state (USDA-NASS 2024a).
While scientists have been searching for a cure to the disease or even a treatment to manage its symptoms over the past two decades, they have not been successful so far (Li et al. Reference Li, Wu, Duan, Singerman and Guan2020). Only the implementation of a landscape approach to controlling the vector of the disease by using an area-wide pest management program has shown evidence of achieving a differential economic benefit both in Brazil and in Florida. However, attaining the required threshold level of participation among growers is challenging (Bassanezi et al. Reference Bassanezi, Montesino, Gimenes-Fernandes, Yamamoto, Gottwald, Amorim and Filho2013, Reference Bassanezi, Primiano, Quaggio, Boaretto, Ayres and Bové2024; Singerman et al. Reference Singerman, Lence and Useche2017). Recently, trunk injection of antibiotics has been proposed as a potential method for mitigating HLB’s symptoms. Unlike foliar sprays and soil drenches, trunk injection ensures direct delivery of antibiotics into the tree’s vascular system, which could result in increased fruit yield and extended tree productivity (Archer et al. Reference Archer, Kunwar, Alferez, Batuman and Albrecht2023; Hu et al. Reference Hu, Jiang and Wang2018). Thus, the U.S. Environmental Protection Agency (EPA) has granted an emergency approval for the use of oxytetracycline (OTC) trunk injections in Florida citrus crops for three consecutive seasons, from 2022/23 to 2024/25. While the biological response of orange trees to this recently approved technology is key to deal with the disease, another critical aspect for assessing the feasibility of antibiotic trunk injections is whether the adoption of such technology is economically viable and what market and welfare effects might result from it.
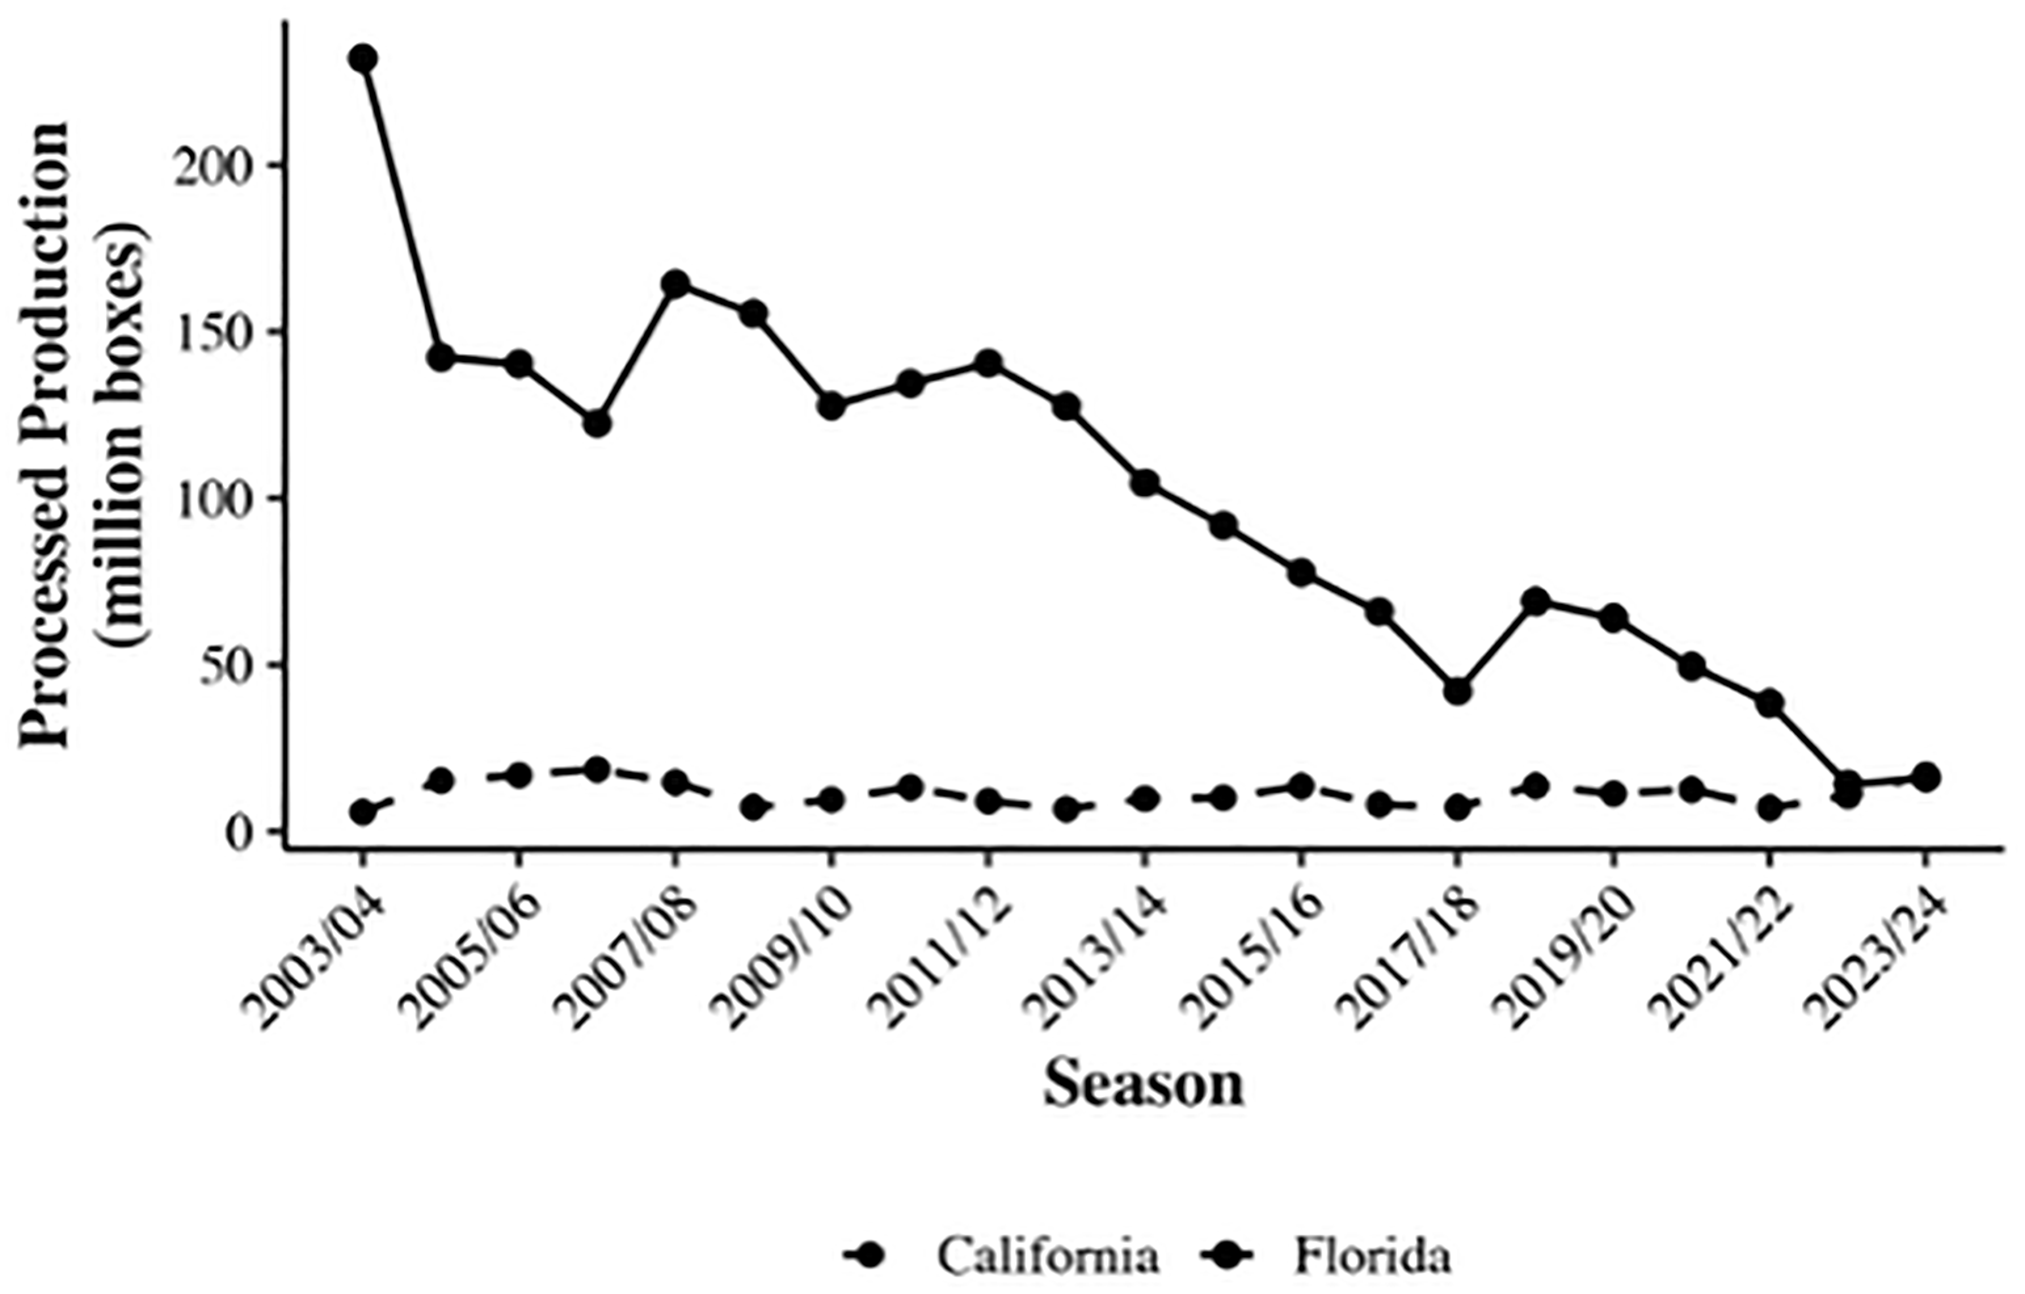
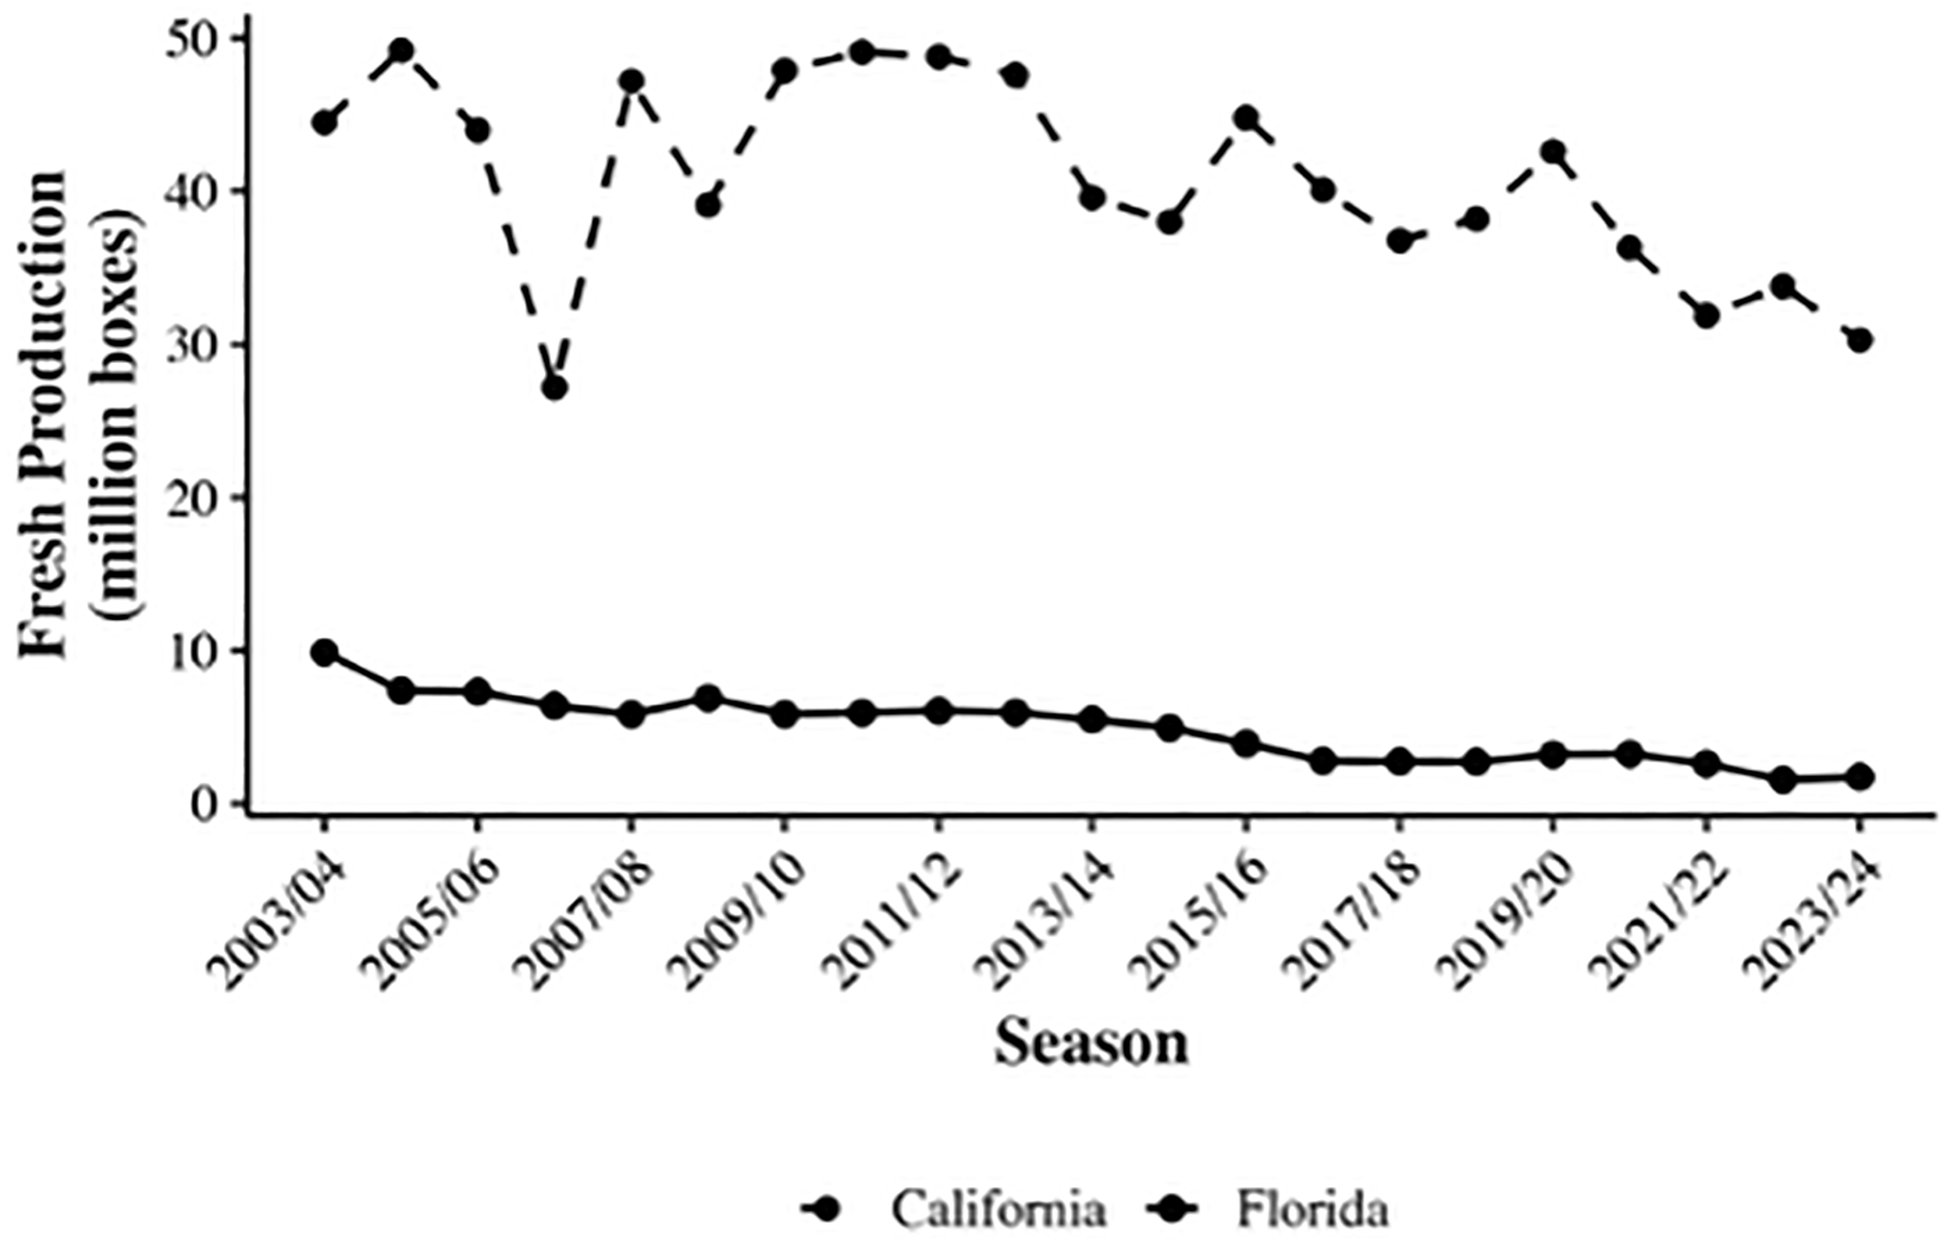
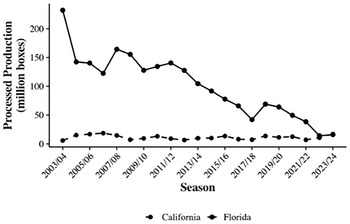
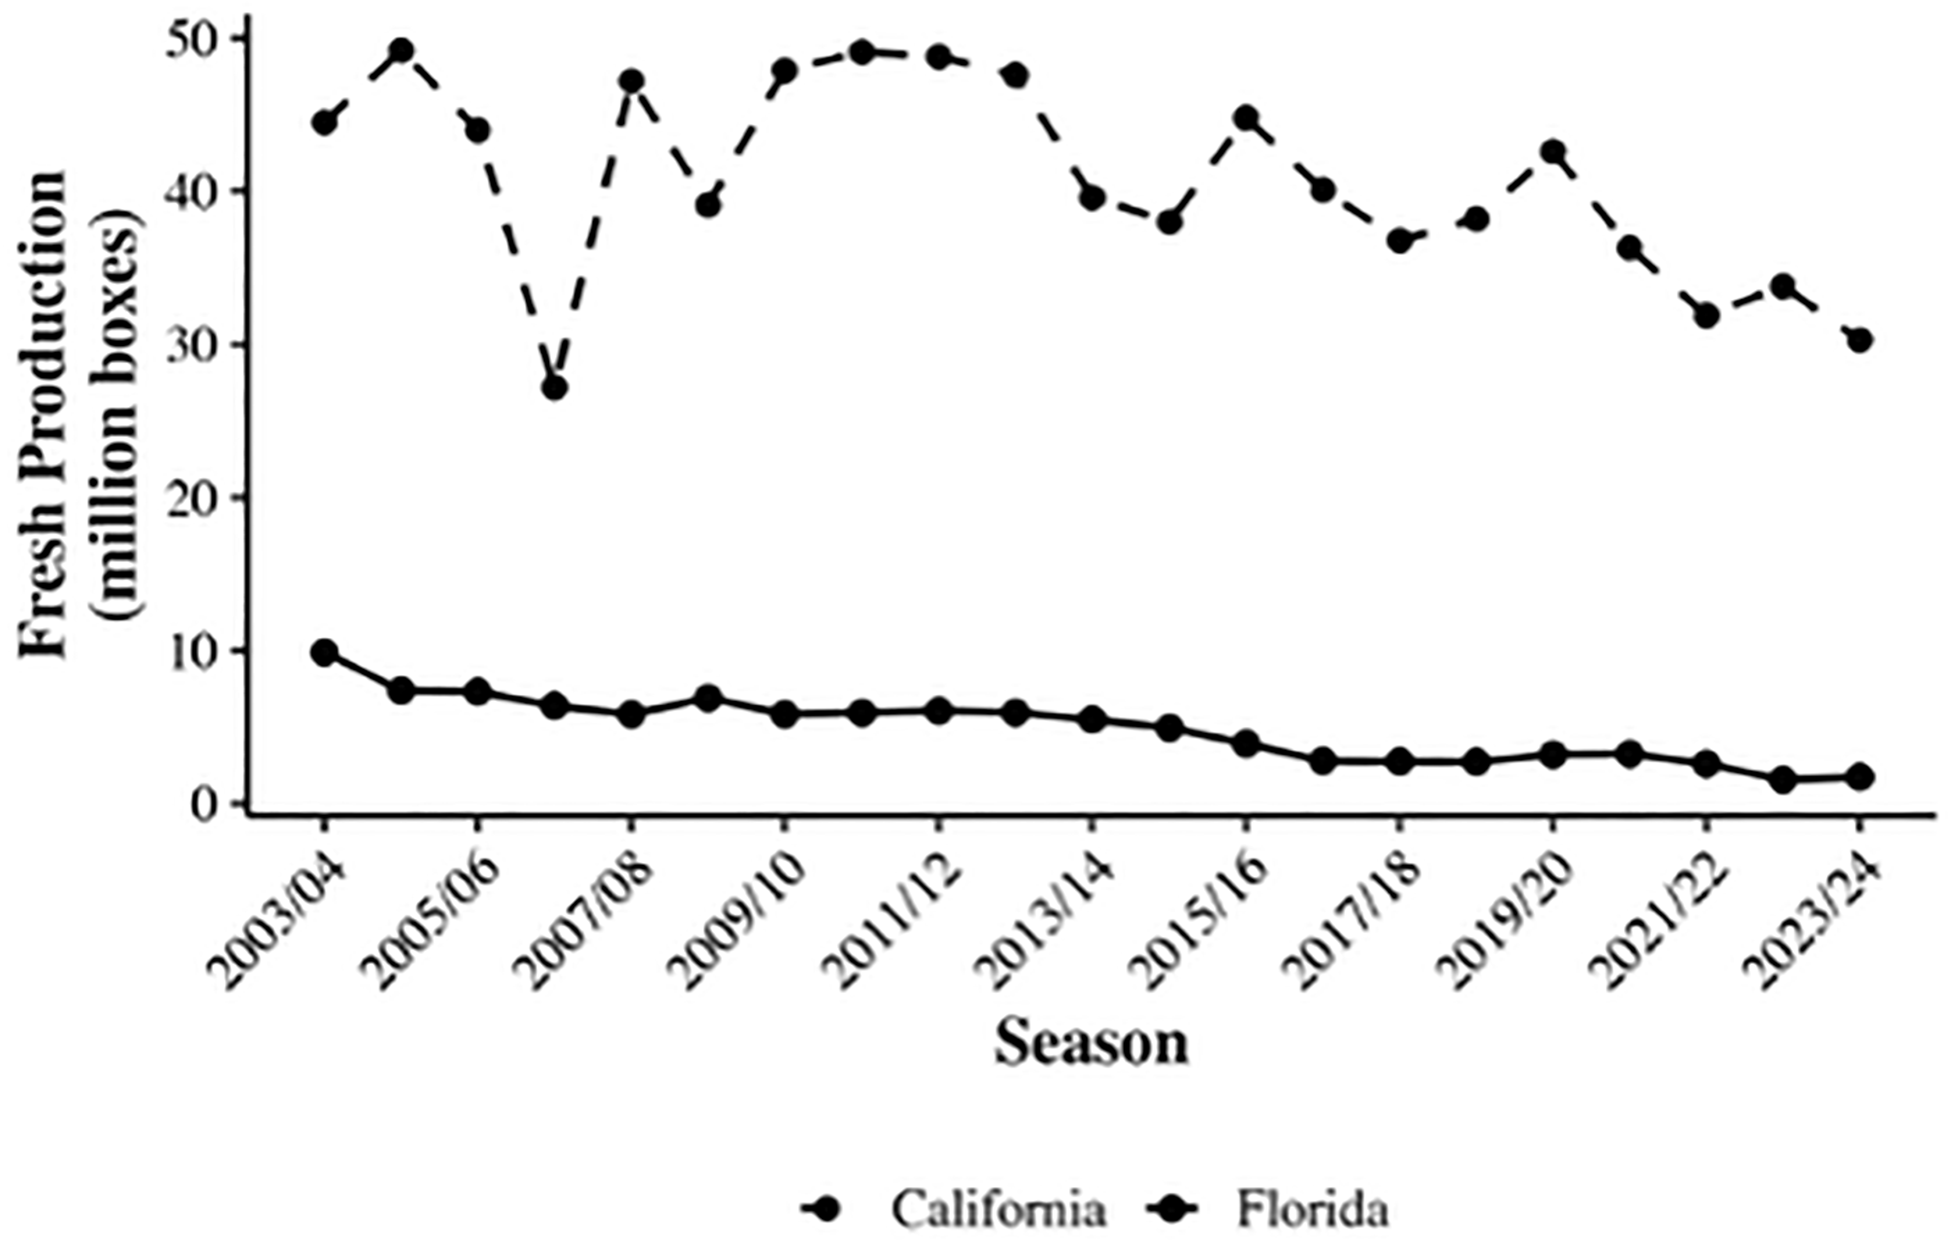
Approximately 90% of Florida’s citrus output is oranges and, typically, over 90% of them are processed into juice. As shown in Figure 1, Florida is a leading state in the production of processed oranges, while California, another leading state in orange production, supplies mainly fresh oranges (Figure 2). Unlike Florida, where HLB is now endemic, California’s commercial citrus groves remain free of HLB under strict quarantine programs (Citrus Industry 2024; Quan Reference Quan2024). Consequently, the severe supply shock caused by HLB in Florida has mostly impacted the domestic processed sector.
Processed orange production between Florida and California from 2003/04 to 2023/24.
Fresh orange production between Florida and California from 2003/04 to 2023/24.
Orange juice consists of two main products: frozen concentrate orange juice (FCOJ) and not-from-concentrate (NFC) orange juice. The major differences between the two are the costs of evaporation, storage, and transportation. Prior to 2005, FCOJ dominated the U.S. orange juice market but starting that season, NFC orange juice production began to surpass that of FCOJ driven by the higher market price that NFC commanded (FDOC 2016). The reduction in the state’s (and the US’s) supply of oranges due to the impact of HLB has led to a corresponding reduction in the supply of NFC orange juice. In 2004, just before the discovery of HLB, the supply of NFC orange juice from Florida was able to meet most of the U.S. demand, and domestic production more than doubled the volume of imports (FDOC 2021). However, by 2023, Florida’s share of NFC orange juice supply decreased to approximately 45%, with imports – predominantly from Brazil – filling in the remainder (FDOC 2024a). Still, in 2023, NFC orange juice accounted for the use of approximately 91% of Florida’s processed oranges (FDOC 2024a). Thus, given the preponderance of NFC and the key role of Florida supplying it, the analysis we present herein focuses on the NFC orange juice market.
In this study, we investigate the feasibility and profitability of applying antibiotics using trunk injections to mitigate the impact of HLB on Florida orange trees. To do so, we first examine its economic feasibility by analyzing the net present value (NPV) of adopting this technology by Florida producers. Then, using a spatial equilibrium model (SEM), we estimate the market and welfare impacts in the U.S. NFC orange juice market for two scenarios: applying trunk injections and not applying them. The SEM framework was first developed by Samuelson (Reference Samuelson1952) and operationalized by Takayama and Judge (Reference Takayama and Judge1964) for analyzing competitive equilibrium across spatially separated markets. It has been applied, for example, in intertemporal models of perennial crops like apples (Fuchs et al. Reference Fuchs, Farrish and Bohall1974), in models that integrated plant location theory with interregional trade analysis (von Oppen and Scott Reference von Oppen and Scott1976), and in large-scale analyses of the wheat and dairy industries (Golz and Koo Reference Golz and Koo1993; Yavuz et al. Reference Yavuz, Zulauf, Schnitkey and Miranda1996). More recently, the framework has been used to analyze the market-wide consequences of specific shocks, such as policy changes, new technologies, and disease outbreaks (see Guajardo and Elizondo Reference Guajardo and Elizondo2003; Vitale et al. Reference Vitale, Boyer, Uaiene and Sanders2007; and Busdieker-Jesse et al. Reference Busdieker-Jesse, Nogueira, Onal and Bullock2016).
The SEM is particularly well-suited for our analysis because it incorporates international trade linkages among key market participants – in our case: the United States, Brazil, and the European Union – and accounts for important trade factors such as tariffs, transportation costs, and insurance. This allows us to examine how Florida’s supply following the adoption of antibiotic trunk injection might affect market dynamics and enables us to assess potential welfare impacts for Florida growers and U.S. consumers. Unlike general equilibrium models, which capture interactions across multiple interconnected markets, the SEM – which is a partial equilibrium model – provides a more focused and tractable framework by isolating the effects within a single market.
Based on the framework of the SEM, we use the vintage production approach (Akiyama and Trivedi Reference Akiyama and Trivedi1987) on the supply side to reflect the perennial nature of citrus production, which accounts for tree age and productivity dynamics. In addition, we quantify the welfare effects from antibiotic trunk injections induced supply shifts by using a comparative static model, similarly to that used by Alston et al. (Reference Alston, Norton and Pardey1995). Finally, we test the robustness of our welfare estimates by conducting a sensitivity analysis across a range of demand price elasticities for orange juice in the U.S.
Our contributions to the literature can be summarized as follows. First, our analysis not only provides estimates regarding the on-farm financial feasibility of antibiotic trunk injections to deal with the impact of HLB affecting the Florida citrus industry but also quantifies the resulting welfare impacts on Florida orange growers and U.S. consumers. In doing so, our study expands upon the existing literature, which has primarily analyzed the adoption of different technologies by focusing on its viability and impact at the individual grower level (Li et al. Reference Li, Wu, Duan, Singerman and Guan2020; Singerman et al. Reference Singerman, Burani-Arouca and Futch2018). Specifically, we estimate the distribution of economic benefits by measuring the changes in Florida producer surplus, U.S. consumer surplus, and total social surplus. Second, to our knowledge, this is the first study to employ the SEM incorporating international trade flows and trade costs to analyze their changes due to a specific technological adoption in the U.S. citrus industry to address the impact of HLB. We comprehensively model the U.S. NFC orange juice market within its global context, explicitly incorporating Brazil as the dominant exporter and the EU as a competing importer. This framework allows us to capture how a technological advancement in Florida can have ripple effects through international markets via price adjustments and trade flow reallocations. Finally, while previous studies have investigated the biological feasibility of trunk injections (Archer et al. Reference Archer, Kunwar, Alferez, Batuman and Albrecht2023; Castellano-Hinojosa et al. Reference Castellano-Hinojosa, González-López, Tardivo, Monus, de Freitas, Strauss and Albrecht2024), our study is the first to translate these scientific findings into potential welfare impacts, thereby bridging the gap between agronomic research and economic policy analysis. By connecting the adoption of a specific emerging technology to address a plant disease with its potential effects on domestic producers, consumers, and international trade, this study provides a more thorough understanding of the consequences of such an adoption, which should be useful for policymakers and industry stakeholders.
2. Model
In this section, we begin by describing the main assumptions we make and subsequently provide details on each of the key components of our model. We use the SEM to estimate the potential change in welfare and outcomes in the U.S. NFC orange juice market, resulting from a supply curve shift as a consequence of a (potential) positive yield response due to the application of antibiotic trunk injections to orange trees in Florida. To obtain those estimates, we model two scenarios: applying trunk injections and not applying trunk injections. We then compare the results between the two.Footnote 1 We assume a perfectly competitive market in which producers, processors, and consumers all act as price-takers.
Regarding trade linkages, Brazil – the world’s largest orange juice producer and exporter – is assumed to be the only exporter whereas the U.S. and the EU are importers. We limit our SEM to the United States, Brazil, and the European Union because these three regions dominate the global trade dynamics of the NFC orange juice market. According to the United Nations Comtrade database, which reports global annual and monthly trade statistics by product and trading partner, Brazil is by far the largest exporter of NFC orange juice; in 2023, Brazil accounted for 77% of global exports. The U.S. and the E.U. are the two largest import markets, jointly accounting for 76% of global import demand in 2023. Given that these three regions represent the overwhelming majority of global trade flows, focusing the model on them captures the core structure of the international NFC orange juice market while maintaining model parsimony.
We also make several assumptions about supply and demand. We assume linear supply and demand curves, which are widely used in the literature because they simplify the analysis by enabling straightforward calculations of surplus changes (Alston et al. Reference Alston, Norton and Pardey1995). Specifically for domestic supply, we assume a perfectly inelastic supply curve because the EPA approval for the use of OTC trunk injections in Florida citrus is for three seasons only. This implies that the supply curve is not impacted by changes in price, which is justified for two reasons. First, while price changes typically influence growers’ planting decisions, it takes three years for citrus trees to bear fruit. Thus, any price changes will not alter Florida orange production due to new plantings within the three-year OTC approval period. In other words, the number of bearing trees relevant for domestic production will be fixed within the three-year period because any new plantings will not contribute to production.Footnote 2 Second, while yield, the second component of production, can be influenced by the growers’ cultural practices to some extent, it is mostly affected by climatic conditions, pests, and diseases. Those shocks (or lack thereof) will shift the vertical supply either to the left or to the right. Finally, we assume a parallel supply shift resulting from the change in production due to the adoption of trunk injections. As argued by Alston et al. (Reference Alston, Norton and Pardey1995), when a parallel shift is used, the functional form is largely irrelevant, and the use of a linear model provides a good approximation regardless of the true functional form of supply.
2.1. Domestic supply and prices
We obtain the total domestic supply of oranges (
 \begin{align}S_{{O_t}}^{U{S_j}}\end{align}
) in any given season t by estimating the production of Valencia and Early & Mid-season varieties (j), which is the result of summing the product of the tree inventory (
\begin{align}S_{{O_t}}^{U{S_j}}\end{align}
) in any given season t by estimating the production of Valencia and Early & Mid-season varieties (j), which is the result of summing the product of the tree inventory (
 \begin{align}N_{i,t}^j\end{align}
, the number of bearing trees in a specific age i) by their corresponding yield (
\begin{align}N_{i,t}^j\end{align}
, the number of bearing trees in a specific age i) by their corresponding yield (
 \begin{align}Y_{i,t}^j\end{align}
), as follows:
\begin{align}Y_{i,t}^j\end{align}
), as follows:
 \begin{align} {S}_{O_{t}}^{US_{j}}=\sum _{i}({N}_{i,t}^{j}\cdot {Y}_{i,t}^{j}) \end{align}
Thus, under the scenario in which trunk injections are applied, the domestic orange production of Valencia or Early & Mid-season is given by:
 \begin{align} {S}_{O_{t}}^{US_{j}} =\sum _{i}[{N}_{i,t}^{j}\cdot A\cdot {Y}_{i,t}^{j}+{N}_{i,t}^{j}\cdot (1-A)\cdot {Y}_{i,t}^{j \prime}] \end{align}
where A represents the adoption rate of trunk injections, and
 \begin{align}Y_{i,t}^j\end{align}
(
\begin{align}Y_{i,t}^j\end{align}
(
 \begin{align}Y_{i,t}^{j\prime }\end{align}
) represents the yield of trees treated (not treated) with trunk injections.Footnote
3
\begin{align}Y_{i,t}^{j\prime }\end{align}
) represents the yield of trees treated (not treated) with trunk injections.Footnote
3
We then obtain an estimate of the domestic production of NFC orange juice extracted from variety j in season t (
 \begin{align}S_{NFC,t}^{U{S_j}}\end{align}
) by taking into account the proportion of oranges in Florida that goes into processing. In addition, we also consider the proportion of that total that goes into NFC. So that,
\begin{align}S_{NFC,t}^{U{S_j}}\end{align}
) by taking into account the proportion of oranges in Florida that goes into processing. In addition, we also consider the proportion of that total that goes into NFC. So that,
 \begin{align} {S}_{NFC, t}^{US_{j}}={S}_{O_{t}}^{US_{j}}\cdot \textit{Processed%}\cdot NFC\% \end{align}
where Processed% represents the percentage of processed oranges relative to total orange production, and NFC% represents the percentage of orange juice extracted from processed oranges that goes into NFC production. The total domestic production of NFC orange juice is calculated as the weighted sum of NFC orange juice production from Valencia oranges and Early & Mid-season oranges, as denoted by the following expression:
 \begin{align} {S}_{NFC, t}^{US}=\sum _{j}{S}_{NFC, t}^{US_{j}}\cdot W_{j,t} \end{align}
where
 \begin{align}S_{NFC,t}^{US}\end{align}
is the total Florida production of NFC orange juice, and W
j,t
is the share of NFC orange juice processed from orange variety j.
\begin{align}S_{NFC,t}^{US}\end{align}
is the total Florida production of NFC orange juice, and W
j,t
is the share of NFC orange juice processed from orange variety j.
The farm price (i.e., on-tree price) for NFC orange juice is computed as the weighted average of the prices for Valencia oranges and for Early & Mid-season oranges, where the weight for each variety is its proportion of the total NFC production:Footnote 4
 \begin{align} {P}_{t}^{\,farm.US}=\sum _{j}{P}_{j,t}^{\,farm.US}\cdot {{S}_{NFC, t}^{US_{j}} \over {S}_{NFC, t}^{US}} \end{align}
where
 \begin{align}{P}_{t}^{farm.US}\end{align}
is the U.S. on-tree price for NFC orange juice in season t,
\begin{align}{P}_{t}^{farm.US}\end{align}
is the U.S. on-tree price for NFC orange juice in season t,
 \begin{align}P_{j,t}^{{\kern 1pt} farm.US}\end{align}
denotes the U.S. on-tree price for NFC orange juice from variety j, and
\begin{align}P_{j,t}^{{\kern 1pt} farm.US}\end{align}
denotes the U.S. on-tree price for NFC orange juice from variety j, and
 \begin{align}{{S_{NFC,t}^{U{S_j}}} \over {S_{NFC,t}^{US}}}\end{align}
represents the proportion of the total NFC orange juice processed from variety j.Footnote
5
We estimate the U.S. retail price by scaling up the farm price as follows:
\begin{align}{{S_{NFC,t}^{U{S_j}}} \over {S_{NFC,t}^{US}}}\end{align}
represents the proportion of the total NFC orange juice processed from variety j.Footnote
5
We estimate the U.S. retail price by scaling up the farm price as follows:
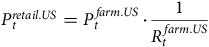 \begin{align} {P}_{t}^{\textit{retail}.US}={P}_{t}^{\,farm.US}\cdot {1 \over {R}_{t}^{\,farm.US}} \end{align}
where
 \begin{align}P_t^{retail.US}\end{align}
denotes the retail price for U.S. NFC orange juice in season t and
\begin{align}P_t^{retail.US}\end{align}
denotes the retail price for U.S. NFC orange juice in season t and
 \begin{align}{R}_{t}^{\,farm.US}\end{align}
is the share that the farm price represents out of the retail price.
\begin{align}{R}_{t}^{\,farm.US}\end{align}
is the share that the farm price represents out of the retail price.
2.2. Spatial equilibrium model
In the model, equilibrium prices and quantities are determined by the global market-clearing condition. This condition dictates that the equilibrium prices are obtained when the price differences between markets are less than or equal to the transportation and other transaction costs, and that the quantity of total NFC orange juice exported from Brazil equals the combined imports of the U.S. and the EU, as shown in the following conditions:
 \begin{align} {P}_{t}^{\, farm.US}-{P}_{t}^{\textit{Brazil}} \leq {TI}_{t}^{US,\textit{Brazil}}+T{F}_{t}^{US,\textit{Brazil}} \end{align}
 \begin{align} {P}_{t}^{EU}-{P}_{t}^{\textit{Brazil}}\leq {TI}_{t}^{EU,\textit{Brazil}}+T{F}_{t}^{EU,\textit{Brazil}} \end{align}
 \begin{align} {EX}_{t}^{\textit{Brazil}}={IM}_{t}^{US}+{IM}_{t}^{EU} \end{align}
In Equations (3) and (4),
 \begin{align}{P}_{t}^{\textit{Brazil}}\end{align}
and
\begin{align}{P}_{t}^{\textit{Brazil}}\end{align}
and
 \begin{align}{P}_{t}^{EU}\end{align}
are the on-tree prices for NFC orange juice in Brazil and the EU in season
\begin{align}{P}_{t}^{EU}\end{align}
are the on-tree prices for NFC orange juice in Brazil and the EU in season
 \begin{align}t ; {TI}_{t}^{US,\textit{Brazil}}\end{align}
and
\begin{align}t ; {TI}_{t}^{US,\textit{Brazil}}\end{align}
and
 \begin{align}{TI}_{t}^{EU,\textit{Brazil}}\end{align}
represent the transportation and insurance costs between the U.S. and Brazil and between the EU and Brazil, respectively; and
\begin{align}{TI}_{t}^{EU,\textit{Brazil}}\end{align}
represent the transportation and insurance costs between the U.S. and Brazil and between the EU and Brazil, respectively; and
 \begin{align}T{F}_{t}^{US,\textit{Brazil}}\end{align}
and
\begin{align}T{F}_{t}^{US,\textit{Brazil}}\end{align}
and
 \begin{align}T{F}_{t}^{EU,\textit{Brazil}}\end{align}
denote the import tariffs applied by the U.S. and the EU on shipments from Brazil, respectively. In Equation (5),
\begin{align}T{F}_{t}^{EU,\textit{Brazil}}\end{align}
denote the import tariffs applied by the U.S. and the EU on shipments from Brazil, respectively. In Equation (5),
 \begin{align}{EX}_{t}^{\textit{Brazil}}\end{align}
represents total exports from Brazil in season
\begin{align}{EX}_{t}^{\textit{Brazil}}\end{align}
represents total exports from Brazil in season
 \begin{align}t\end{align}
, and
\begin{align}t\end{align}
, and
 \begin{align}{IM}_{t}^{US}\end{align}
and
\begin{align}{IM}_{t}^{US}\end{align}
and
 \begin{align}{IM}_{t}^{EU}\end{align}
represent the quantities imported by the U.S. and the EU, respectively. Those imports, combined with domestic supply, consist of total supply (
\begin{align}{IM}_{t}^{EU}\end{align}
represent the quantities imported by the U.S. and the EU, respectively. Those imports, combined with domestic supply, consist of total supply (
 \begin{align}{TS}_{NFC,t}^{c}\end{align}
) in country
\begin{align}{TS}_{NFC,t}^{c}\end{align}
) in country
 \begin{align}c\end{align}
(i.e., Brazil, the EU, or the U.S.):
\begin{align}c\end{align}
(i.e., Brazil, the EU, or the U.S.):
 \begin{align} {TS}_{NFC, t}^{c}={SD}_{t}^{c}+I{M}_{t}^{c} \end{align}
where
 \begin{align}{SD}_{t}^{c}\end{align}
represents domestic supply of NFC orange juice, which consists of domestic NFC orange juice production (
\begin{align}{SD}_{t}^{c}\end{align}
represents domestic supply of NFC orange juice, which consists of domestic NFC orange juice production (
 \begin{align}S_{NFC,\;t}^c\end{align}
) and the beginning inventory (
\begin{align}S_{NFC,\;t}^c\end{align}
) and the beginning inventory (
 \begin{align}B{I}_{t}^{c}\end{align}
) from the previous season:
\begin{align}B{I}_{t}^{c}\end{align}
) from the previous season:
 \begin{align} {SD}_{t}^{c}={{S}_{NFC, t}^{c}+BI}_{t}^{c} \end{align}
The demand function for NFC orange juice in country c (
 \begin{align}D_{NFC,t}^c\end{align}
) is given by:
\begin{align}D_{NFC,t}^c\end{align}
) is given by:
 \begin{align} {D}_{NFC, t}^{c}=\alpha ^{c}-\beta ^{c}{P}_{d,t}^{c} \end{align}
where
 \begin{align}\alpha ^{c}\gt 0\end{align}
and
\begin{align}\alpha ^{c}\gt 0\end{align}
and
 \begin{align}\beta ^{c}\gt 0\end{align}
represent the demand equation parameters for country
\begin{align}\beta ^{c}\gt 0\end{align}
represent the demand equation parameters for country
 \begin{align}c\end{align}
, and
\begin{align}c\end{align}
, and
 \begin{align}{P}_{d,t}^{c}\end{align}
is the demand price in the specific country. Total demand (
\begin{align}{P}_{d,t}^{c}\end{align}
is the demand price in the specific country. Total demand (
 \begin{align}{TD}_{NFC,t}^{c}\end{align}
) incorporates domestic demand as well as exports and ending inventory in season
\begin{align}{TD}_{NFC,t}^{c}\end{align}
) incorporates domestic demand as well as exports and ending inventory in season
 \begin{align}t\end{align}
:
\begin{align}t\end{align}
:
 \begin{align} {TD}_{NFC, t}^{c}={D}_{NFC, t}^{c}+{EX}_{t}^{c}+{EI}_{t}^{c} \end{align}
where
 \begin{align}{EX}_{t}^{c}\end{align}
is the quantity of exports, and
\begin{align}{EX}_{t}^{c}\end{align}
is the quantity of exports, and
 \begin{align}{EI}_{t}^{c}\end{align}
is the ending inventory.
\begin{align}{EI}_{t}^{c}\end{align}
is the ending inventory.
Following Takayama and Judge (Reference Takayama and Judge1964), to implement the SEM, we use a quadratic programming model to maximize the net social payoff, which is given by:
 \begin{align}f\left(P\right)=d^{T}P-{1 \over 2}P^{T}DP\end{align}
where
 \begin{align}d = \Big( {\matrix{ {{\alpha ^c}} \cr { - SD_t^c} \cr } } \Big) = {[{\alpha ^{US}},{\alpha ^{Brazil}},{\alpha ^{EU}}, - SD_t^{US}, - SD_t^{Brazil}, - SD_t^{EU}]^T}\end{align}
is a vector containing the parameters in the demand and supply functions;
\begin{align}d = \Big( {\matrix{ {{\alpha ^c}} \cr { - SD_t^c} \cr } } \Big) = {[{\alpha ^{US}},{\alpha ^{Brazil}},{\alpha ^{EU}}, - SD_t^{US}, - SD_t^{Brazil}, - SD_t^{EU}]^T}\end{align}
is a vector containing the parameters in the demand and supply functions;
 \begin{align}P=[{P}_{d,t}^{US},{P}_{d,t}^{\textit{Brazil}},{P}_{d,t}^{EU},{P}_{s,t}^{US},{P}_{s,t}^{\textit{Brazil}},{P}_{s,t}^{EU}]^{T}\end{align}
is a vector containing the demand and supply on-tree prices in the three countries; and D = diag[β
US
,β
Brazil
,β
EU
,0, 0, 0] is the diagonal matrix containing the magnitude of slopes of the demand and supply functions. To ensure that on-tree prices in each country are nonnegative and that the difference between the demand price in country 1 and the supply price in country 2 does not exceed the trade costs (i.e., tariffs, transport costs, and insurance), two constraints applied to this model:
\begin{align}P=[{P}_{d,t}^{US},{P}_{d,t}^{\textit{Brazil}},{P}_{d,t}^{EU},{P}_{s,t}^{US},{P}_{s,t}^{\textit{Brazil}},{P}_{s,t}^{EU}]^{T}\end{align}
is a vector containing the demand and supply on-tree prices in the three countries; and D = diag[β
US
,β
Brazil
,β
EU
,0, 0, 0] is the diagonal matrix containing the magnitude of slopes of the demand and supply functions. To ensure that on-tree prices in each country are nonnegative and that the difference between the demand price in country 1 and the supply price in country 2 does not exceed the trade costs (i.e., tariffs, transport costs, and insurance), two constraints applied to this model:
 \begin{align} {P}_{d,t}^{c1},{P}_{s,t}^{c2}\geq 0 \end{align}
 \begin{align} {P}_{d,t}^{c1}-{P}_{s,t}^{c2}\leq T{F}_{t}^{c1,c2}+T{I}_{t}^{c1,c2} \end{align}
where c1, c2 ∈ {US, EU, Brazil} and c1 ≠ c2.
2.3. Welfare measurement
Using the resulting equilibrium prices and quantities from our model, we estimate U.S. consumer and Florida producer surplus. For example, consumer surplus (
 \begin{align}{CS}_{t}^{T}\end{align}
) is estimated by integrating the demand function from the equilibrium retail price (
\begin{align}{CS}_{t}^{T}\end{align}
) is estimated by integrating the demand function from the equilibrium retail price (
 \begin{align}{P}_{t}^{\textit{retail}.US}\end{align}
) to the choke price (
\begin{align}{P}_{t}^{\textit{retail}.US}\end{align}
) to the choke price (
 \begin{align}{P}_{t}^{\textit{choke}.US}\end{align}
) for each of the two antibiotic treatments, represented by T = {Apply, Not Apply}:
\begin{align}{P}_{t}^{\textit{choke}.US}\end{align}
) for each of the two antibiotic treatments, represented by T = {Apply, Not Apply}:
 \begin{align}CS_t^T = \int _{P_t^{retail.US}}^{P_t^{choke.US}}TD_{NFC,t}^{US}dp\end{align}
So the change in U.S. consumer surplus from applying antibiotic trunk injections relative to not applying them is denoted by ΔCS
t
= CS
t
Apply
− CS
t
Not Apply
. Given the vertical supply curve that we are considering due to the short-term period of analysis, producer surplus (
 \begin{align}{PS}_{t}^{T}\end{align}
) is calculated as the difference between revenue and cost:
\begin{align}{PS}_{t}^{T}\end{align}
) is calculated as the difference between revenue and cost:
 \begin{align}PS_t^T = \int _0^{S_{NFC,t}^{US}}[P_t^{farm.US} - M{C_t}(q)]dq\end{align}
where MC t (q) represents the marginal cost function, which in our model is the additional costs from applying antibiotic trunk injections. Consequently, the change in producer surplus accounts for the difference in total revenue and the additional costs under trunk injection scenario: ΔPS t = PS t Apply − PS t Not Apply . The overall change in societal welfare (ΔTS t ) is calculated as the sum of the changes in consumer surplus and producer surplus: ΔTS t = ΔCS t + ΔPS t .
3. Data and estimation
In this section, we begin by describing the NPV analysis to evaluate the farm-level profitability from adopting antibiotic trunk injections to deal with the disease. Subsequently, we describe the data sources and methodologies for estimating orange trees, yield, production, and key price parameters. Then, we present the parameterization and calibration of the SEM for analyzing market-wide effects.
3.1. Farm-level net present value from antibiotic trunk injection adoption
To evaluate the economic feasibility of the adoption of antibiotic trunk injections by Florida citrus growers, we calculate the differential NPV on a per-tree basis of applying the treatment versus not applying it. The NPV for each scenario is given by the following expression:
 \begin{align}NPV_j^T = \sum\limits_{{\rm{t}} = 0}^3 {{{P_{j,t}^{farm.US,T} \cdot {\rm{Y}}_{j,t}^T - C_t^T + {I_t}} \over {{{\left( {1 + r} \right)}^t}}}} \end{align}
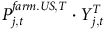
where T represents either the scenario in which antibiotic trunk injections are applied or the one in which they are not, and r denotes the discount rate. The term
 \begin{align}{P}_{j,t}^{farm.US,T}\cdot {Y}_{j,t}^{T}\end{align}
captures the per-tree revenue cash flow in season t for either variety j (Valencia or Early & Mid-season), where the first term represents the farm price per SSE gallon for NFC orange juice and the second term represents the per-tree yield (in SSE gallons). Additionally,
\begin{align}{P}_{j,t}^{farm.US,T}\cdot {Y}_{j,t}^{T}\end{align}
captures the per-tree revenue cash flow in season t for either variety j (Valencia or Early & Mid-season), where the first term represents the farm price per SSE gallon for NFC orange juice and the second term represents the per-tree yield (in SSE gallons). Additionally,
 \begin{align}{C}_{t}^{T}\end{align}
encompasses total cultural production costs incurred under each scenario, while I
t
stands for the average payout growers have been receiving.Footnote
6
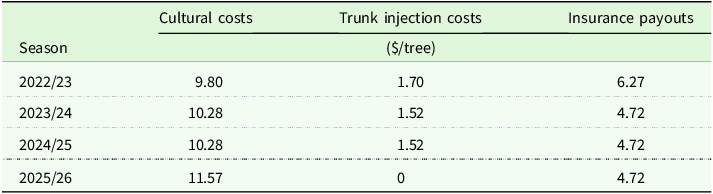
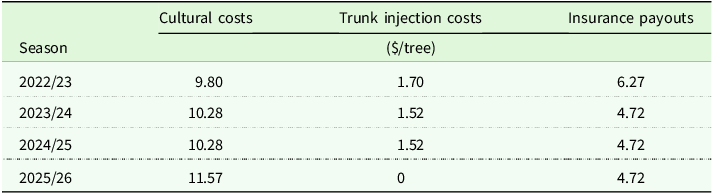
We gather the different cost estimates for cultural costs and payouts for 2022/23 and 2023/24 from Singerman (Reference Singerman2023a; Reference Singerman2024b, Reference Singerman2024c, Reference Singerman2024d), adjusting both to a per-tree basis under the assumption that the density of trees is 150 trees per acre (which is the average tree density for orange groves in Florida). We assume that per-acre cultural costs and payouts remain at their 2023/24 levels for the following two years.
\begin{align}{C}_{t}^{T}\end{align}
encompasses total cultural production costs incurred under each scenario, while I
t
stands for the average payout growers have been receiving.Footnote
6
We gather the different cost estimates for cultural costs and payouts for 2022/23 and 2023/24 from Singerman (Reference Singerman2023a; Reference Singerman2024b, Reference Singerman2024c, Reference Singerman2024d), adjusting both to a per-tree basis under the assumption that the density of trees is 150 trees per acre (which is the average tree density for orange groves in Florida). We assume that per-acre cultural costs and payouts remain at their 2023/24 levels for the following two years.
The scenario denoting the application of antibiotic trunk injections includes the estimates described above as well as the costs related to the application of the injections, which include the cost of the antibiotic compound, the cost of the injectors, as well as the cost of labor. We use the reported estimate of antibiotic trunk injection costs of $1.70 ($1.52) per tree for 2022/23 (2023/24, 2024/2025 and 2025/26), which corresponds to treating trees with the largest trunk diameter (Singerman Reference Singerman2024d). Table 1 summarizes the cost components and payout used in our calculation.
Florida orange growers cultural costs, trunk injection costs, and insurance payouts from 2022/23 to 2025/26
Source: Singerman (Reference Singerman2023a, Reference Singerman2024b, Reference Singerman2024c, Reference Singerman2024d) and Authors’ calculations.
All cash flows are discounted using a rate r of 5%, 10%, and 15%, with t = 0 corresponding to the end of 2022/23 season.Footnote 7 A positive (negative) NPV indicates that the present value of benefits (costs) exceeds costs (benefits). Using the NPVs derived for each treatment scenario, we compute the differential NPV as the difference between the NPVs from applying and from not applying antibiotic trunk injections. We assess the economic feasibility of antibiotic trunk injections separately for Valencia and Early & Mid-season oranges.
3.2. State-level tree stock, yield, and production
We use data from USDA-NASS for the number of bearing trees and yield to estimate orange production in Florida. The number of bearing trees by age from 2007/08 to 2023/24 is provided in the USDA-NASS data set (USDA-NASS 2009 to 2025).Footnote 8 To estimate the number of bearing trees beyond 2023/24, we use the average mortality rates during the last five seasons,Footnote 9 and then apply these averages to estimate the trees by age i in 2024/25 and 2025/26, as shown in the following equation:
 \begin{align} {N}_{i,t}^{j}={N}_{i-1,t-1}^{j}\cdot \left(1-\overline{M}_{i}\right) \end{align}
 \begin{align} i\geq 1, \end{align}
 \begin{align} \overline{M}_{i}\geq 0, \end{align}
where
 \begin{align}{N}_{i,t}^{j}\end{align}
(
\begin{align}{N}_{i,t}^{j}\end{align}
(
 \begin{align}{N}_{i-1,t-1}^{j}\end{align}
) represents the number of bearing trees, of variety j, aged i (i − 1) years old in season t (t − 1), and
\begin{align}{N}_{i-1,t-1}^{j}\end{align}
) represents the number of bearing trees, of variety j, aged i (i − 1) years old in season t (t − 1), and
 \begin{align}\overline{M}_{i}\end{align}
is the average mortality rate for trees aged i years old.
\begin{align}\overline{M}_{i}\end{align}
is the average mortality rate for trees aged i years old.
We estimate orange yield in Florida from 2007/08 to 2025/26 by constructing two matrices, one for Valencia oranges and another for Early & Mid-season oranges.Footnote 10 The yield is estimated on a cohort basis, where all trees within a given age cohort are assumed to have the same yield. This approach is consistent with the data reporting structure used in reports from USDA-NASS (2009 to 2025). Specifically, the age cohorts are indexed by m, which are defined by grouping individual tree ages (i) as follows: 3 to 5 years old (m = 1), 6 to 8 years old (m = 2), 9 to 13 years old (m = 3), 14 to 23 years old (m = 4), and 24 years or older (m = 5). Therefore, yield by age cohort is estimated as:
 \begin{align} {Y}_{m,t}^{j}={Y}_{m,t-1}^{j}\cdot \left[1+E\left({Y}_{m,t}^{j}\right)\right] \end{align}
where
 \begin{align}Y_{m,t}^j\end{align}
(
\begin{align}Y_{m,t}^j\end{align}
(
 \begin{align}{Y}_{m,t-1}^{j}\end{align}
) is the yield of trees of variety j in age cohort m in season t (t − 1), and
\begin{align}{Y}_{m,t-1}^{j}\end{align}
) is the yield of trees of variety j in age cohort m in season t (t − 1), and
 \begin{align}E({Y}_{m,t}^{j})\end{align}
) is the expected yield response to antibiotic trunk injections in the year after the application.Footnote
11
\begin{align}E({Y}_{m,t}^{j})\end{align}
) is the expected yield response to antibiotic trunk injections in the year after the application.Footnote
11
Equation (8) represents the change in yield for trees that remain within the same age cohort. For trees that transition into the next age cohort (i.e., from
 \begin{align}{Y}_{m-1,t-1}^{j}\end{align}
to
\begin{align}{Y}_{m-1,t-1}^{j}\end{align}
to
 \begin{align}{Y}_{m,t}^{j}\end{align}
), their yield is modeled by incorporating both the expected yield response to trunk injections and the additional effect due to the cohort transition, so that:
\begin{align}{Y}_{m,t}^{j}\end{align}
), their yield is modeled by incorporating both the expected yield response to trunk injections and the additional effect due to the cohort transition, so that:
 \begin{align} {Y}_{m,t}^{j}={Y}_{m-1,t-1}^{j}\cdot [1+E({Y}_{m,t}^{j})+{Y}_{\textit{transition},t}^{j}] \end{align}
where Y transition, t j stands for the additional effect associated with the transition from one cohort to the next.
Based on the preliminary experimental field data results reported by Albrecht et al. (Reference Albrecht, Tardivo, Moreno, de Freitas, Singerman, Plotto and Bai2025), we assume antibiotic trunk injections result in further yield increases in seasons 2024/25 and 2025/26. More specifically, yield in 2024/25 is assumed to be 98% higher than that in the 2023/24 season, and yield in 2025/26 is assumed to be 156% higher than that for 2024/25. Those increases in yield are very substantial, and no Florida citrus grower has yet reported obtaining a similar yield response in his groves. But if growers were to attain such a yield response to the application of antibiotic trunk injections, it would cause a rightward shift in the domestic NFC supply curve and, as a consequence, a leftward shift in the excess demand curve faced by Brazil, which would lead to changes in equilibrium prices and quantities. In the scenario that denotes no adoption of antibiotic trunk injections, we model yield similarly to that in which there is adoption but without the assumed benefits of antibiotic trunk injections.
3.3. Prices
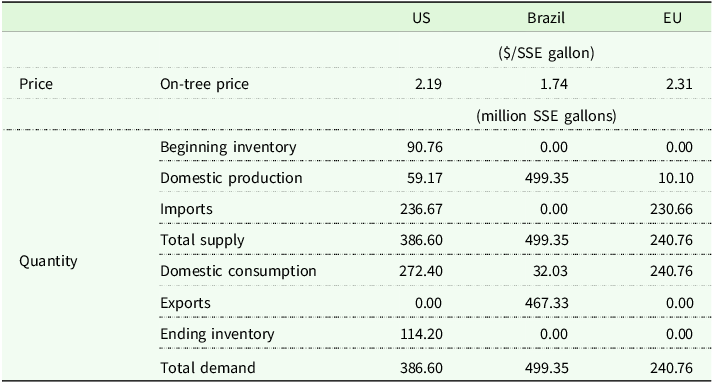
We use delivered-in prices for processed Valencia and Early & Mid-season oranges in the U.S., based on data from the Florida Department of Citrus (FDOC 2023a, 2023b; 2024b, 2024c), along with data on harvesting costs (Singerman Reference Singerman2023b), to obtain farm prices expressed in terms of NFC orange juice for 2022/23 and 2023/24. The farm prices for 2024/25 and 2025/26 are determined by the market-clearing conditions within the SEM. For the 2022/23 farm price, we calculate the weighted average of the prices for Valencia oranges and for Early & Mid-season oranges based on the quantities of NFC orange juice produced from each of them, as illustrated in equation (1), resulting in a U.S. farm price of $2.19 per SSE gallon. Following Equation (2), the U.S. retail price is $9.74 per SSE gallon.Footnote 12
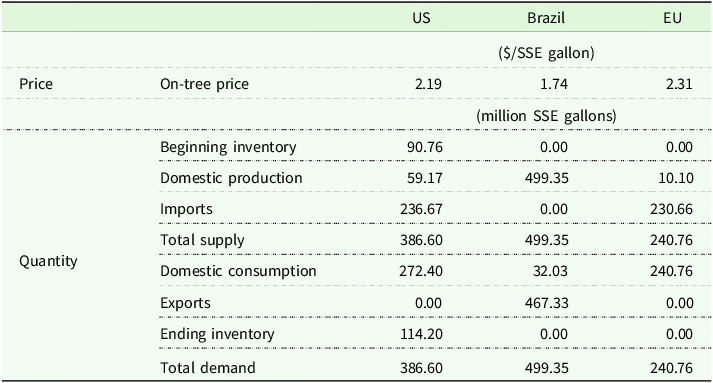
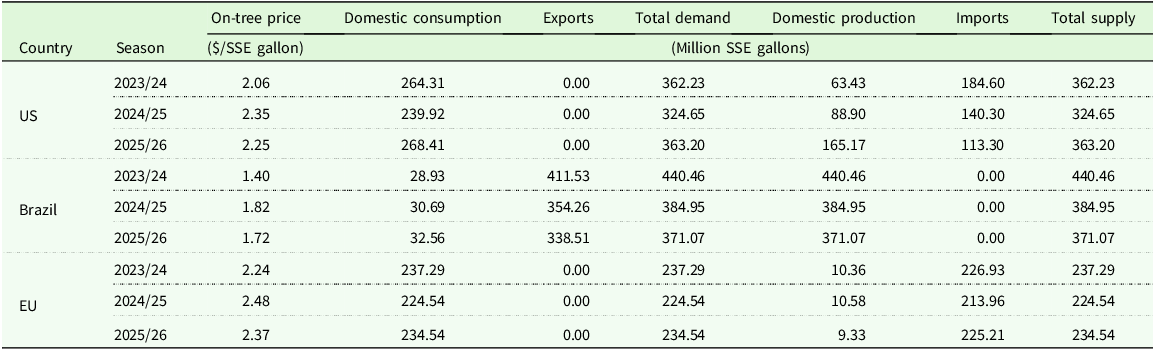
As shown by Equation (3) and (4), prices in different regions are linked by tariffs, as well as transportation and insurance costs. The U.S. imposes a tariff of $0.17 per SSE gallon (4.5 cents per liter) on NFC orange juice imports (WTO 2024), and the EU imposes a 12.2% ad valorem tariff (European Commission 2024).Footnote 13 Transportation and insurance costs are calculated by subtracting FOB values from CIF values for NFC orange juice, which are provided by the United States Census Bureau. The cost of shipment between the U.S. and Brazil is estimated at $0.27 per SSE gallon. Using such a value as a baseline, we adjust the costs for other routes based on distance: the cost from the U.S. to the EU is $0.23 per SSE gallon and from Brazil to the EU is $0.32 per SSE gallon.Footnote 14 Based on those cost estimates, we derive the farm prices for NFC orange juice in Brazil and the EU in 2022/23, which are $1.74 and $2.31 per SSE gallon, respectively. Those prices, along with production, consumption, trade quantities, and inventory quantities for that season, constitute the starting point for our SEM model and are summarized in Table 2.
3.4. Supply and demand parameters
The price elasticities of demand for NFC orange juice are assumed to be −2.14 for the U.S., −1.00 for Brazil, and −0.94 for the EU based on Luckstead et al. (Reference Luckstead, Devadoss and Mittelhammer2015). Combining these elasticities with the baseline equilibrium prices and quantities for 2022/23, we estimate the parameters for the linear demand functions and perfectly inelastic supply functions in each country, which are presented in Table 3. As illustrated in Equations (6) and (7), for each country c, α
c
represents the intercept of the demand function, reflecting the maximum potential demand for NFC orange juice when price is zero; β
c
represents the magnitude of the slope of each demand curve, indicating the rate at which quantity demanded changes with price; and SD
t
c
represents domestic supply of NFC orange juice, which is fixed for a given scenario and season. The corresponding supply curve shifts horizontally based on changes in this production level. For the projection period 2023/24–2025/26, SD
t
US
is determined by U.S. orange production estimates. The production levels in Brazil and the EU,
 \begin{align}{SD}_{t}^{\textit{Brazil}}\end{align}
and
\begin{align}{SD}_{t}^{\textit{Brazil}}\end{align}
and
 \begin{align}{SD}_{t}^{EU}\end{align}
, for the projection seasons (2024/25 and 2025/26) are estimated using polynomial regression based on the historical production data available for each region.
\begin{align}{SD}_{t}^{EU}\end{align}
, for the projection seasons (2024/25 and 2025/26) are estimated using polynomial regression based on the historical production data available for each region.
Parameters for the supply and demand curves for the U.S., Brazil, and the EU in 2022/23

Notes: α is the demand intercept, − β is the slope of the demand curve, and SD is the domestic supply.
Source: Authors’ calculations.
4. Results
This section presents the results of our empirical analysis, beginning with the farm-level NPV analysis of adopting antibiotic trunk injections. We then provide the SEM estimated changes in U.S. production, the resulting new equilibrium prices and trade flows, and the changes in welfare from such technology adoption. We also provide a sensitivity analysis for both the farm-level NPV and the SEM.
4.1. Net present value (NPV) for farm-level technology adoption
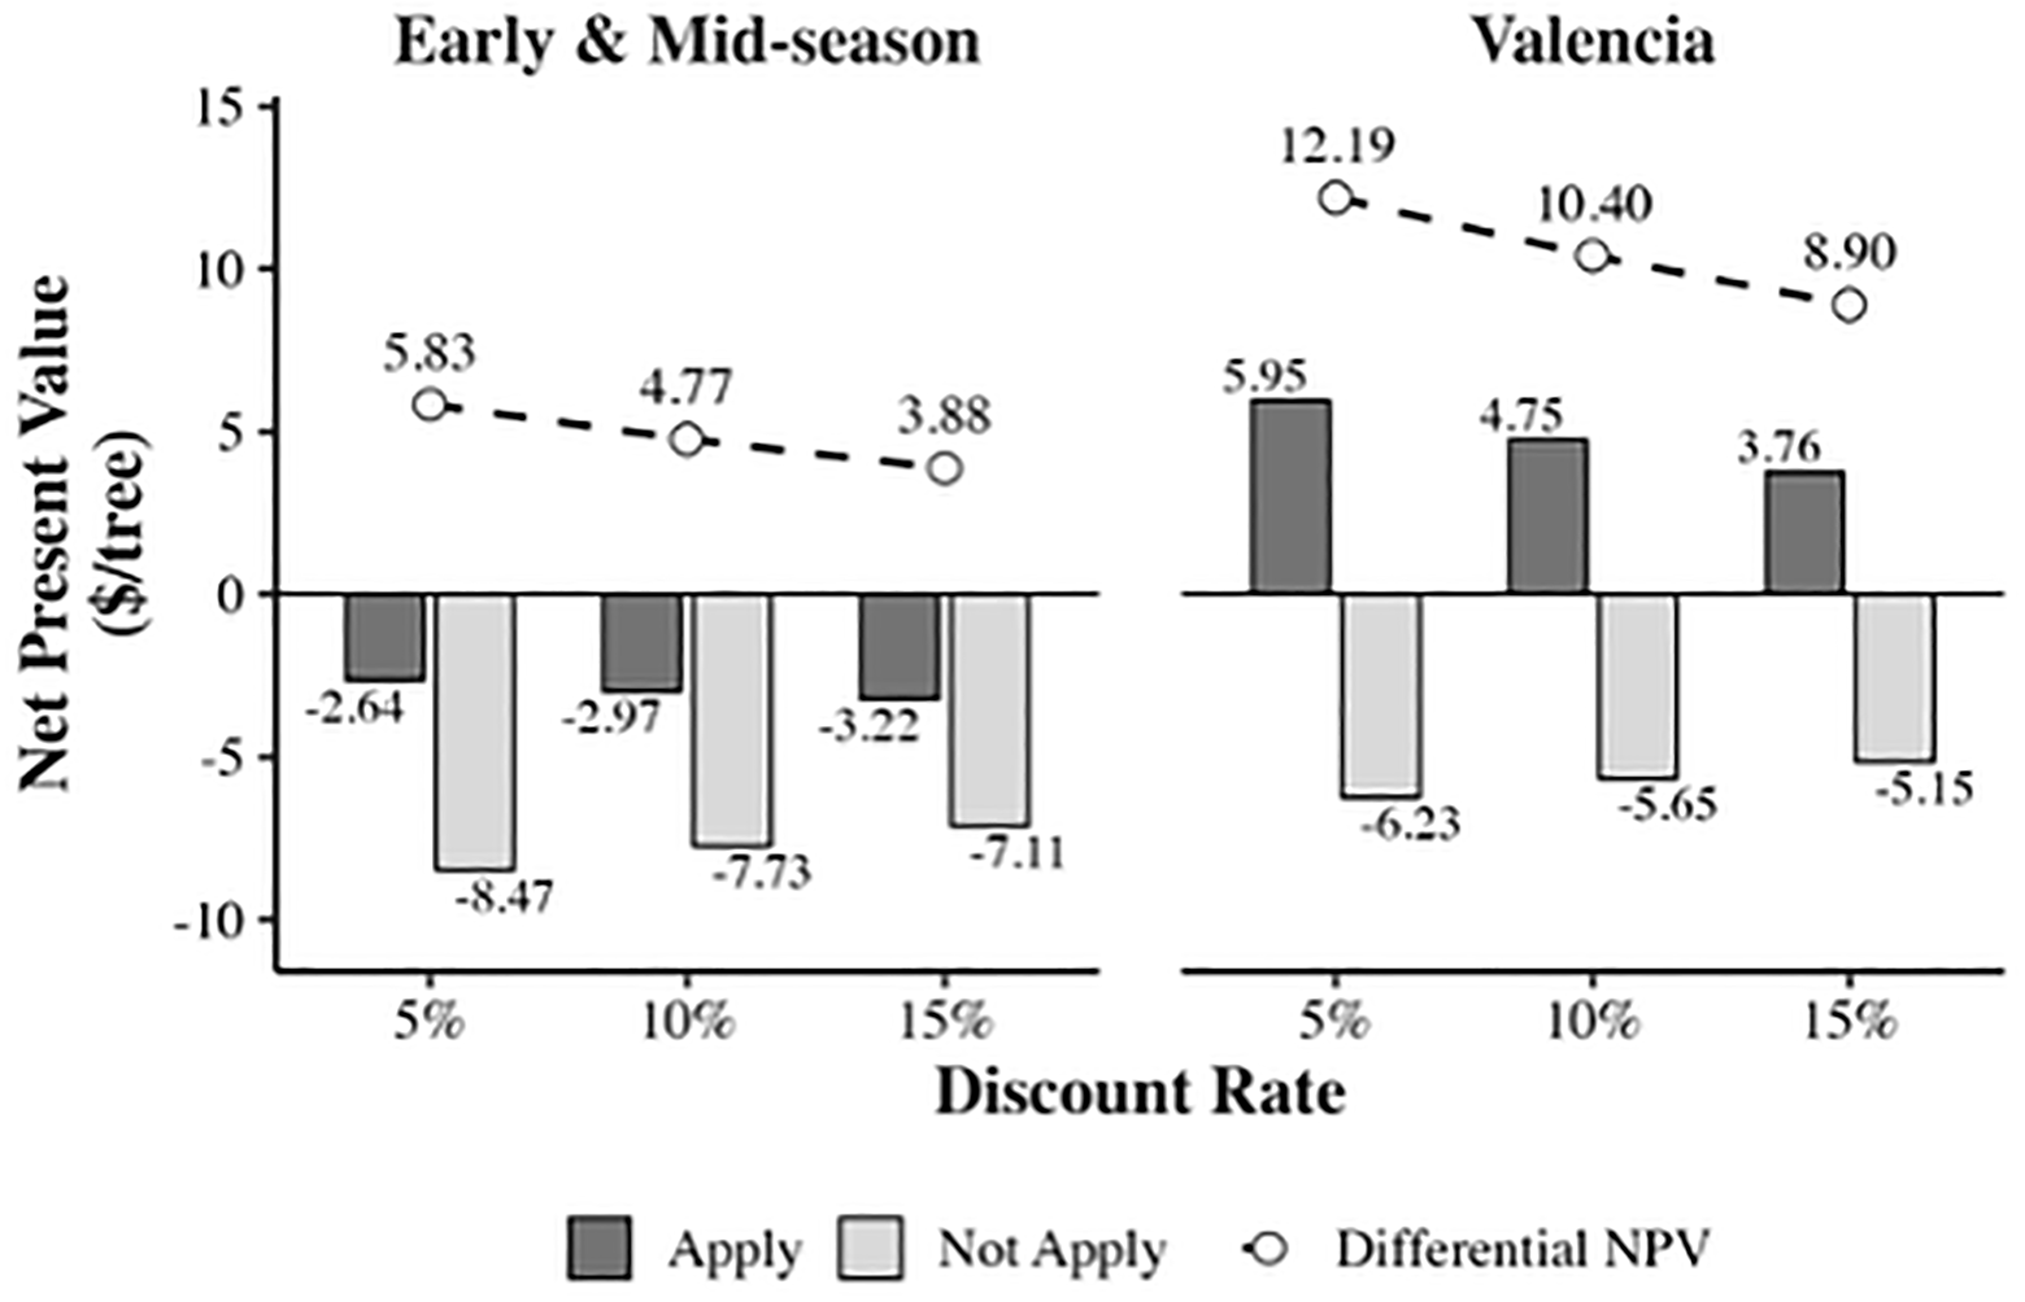
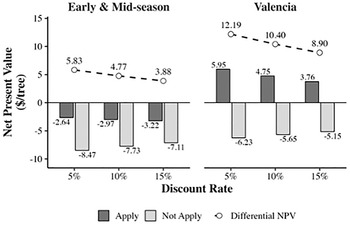
The NPV analysis, which we conduct separately for Valencia and Early & Mid-season oranges, reveals differences in the economic viability of adopting antibiotic trunk injections at the farm level. As shown in Figure 3, we find that for Early & Mid-season oranges the NPVs are negative but the differential NPVs per tree are positive for all discount rates: $5.83 (5%), $4.77 (10%), and $3.88 (15%). This denotes that applying antibiotic trunk injections in Early & Mid-season orange groves improves the financial outcome relative to the alternative of no application, but those groves still yield losses within the analyzed time frame.Footnote 15 As also shown in Figure 3, for Valencia oranges, we find that both the NPVs and the differential NPVs are positive across all discount rates, denoting that adopting antibiotic trunk injections is profitable for such groves. Importantly, this result is obtained when assuming that growers would be able to attain the same level of yield increase as that reported by Albrecht et al. (Reference Albrecht, Tardivo, Moreno, de Freitas, Singerman, Plotto and Bai2025) for experimental trials; namely, an increase of 98% in the second season and an increase of 156% in the third season. We also compute the break-even yield, that is, the minimum level of yield required for the economic viability of antibiotic trunk injections at the farm level. We find that the yield per tree of Valencia oranges would need to increase by more than 74% (78%) [82%] in 2024/25 and 2025/26 when applying a discount rate of 5% (10%) [15%] for the NPV to become positive,Footnote 16 indicating that the required yield increase for antibiotic trunk injections to be profitable is very substantial.
Farm-level net present value (NPV) and differential NPVs per tree for early & m,id-season and Valencia oranges: comparison of applying versus not applying antibiotic trunk injections.
4.2. Spatial equilibrium model (SEM)
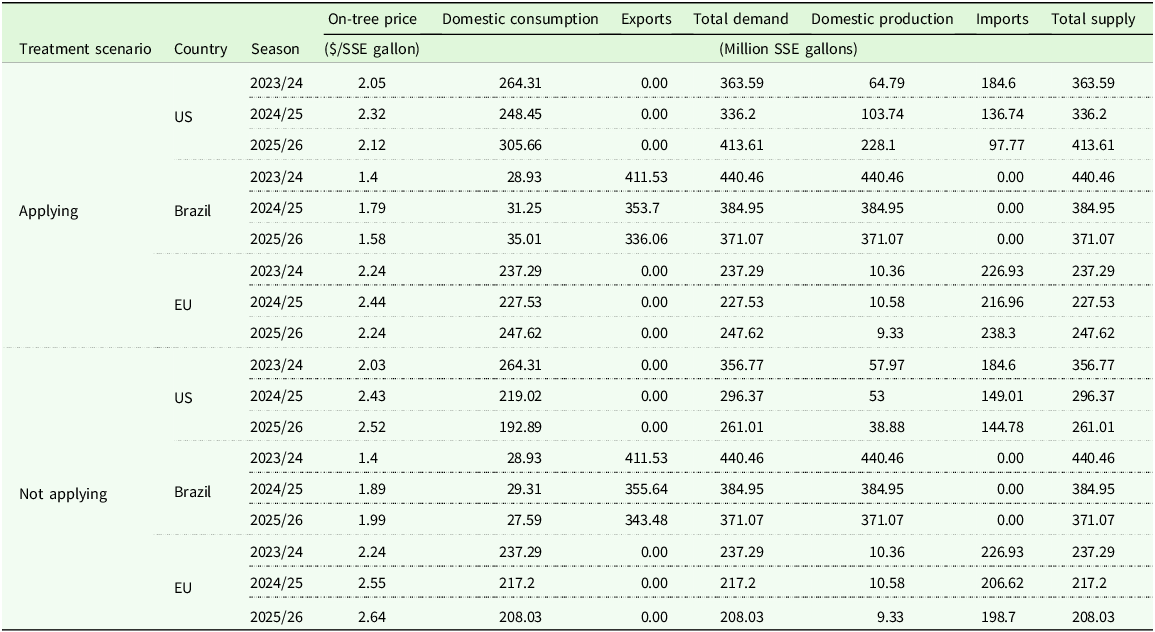
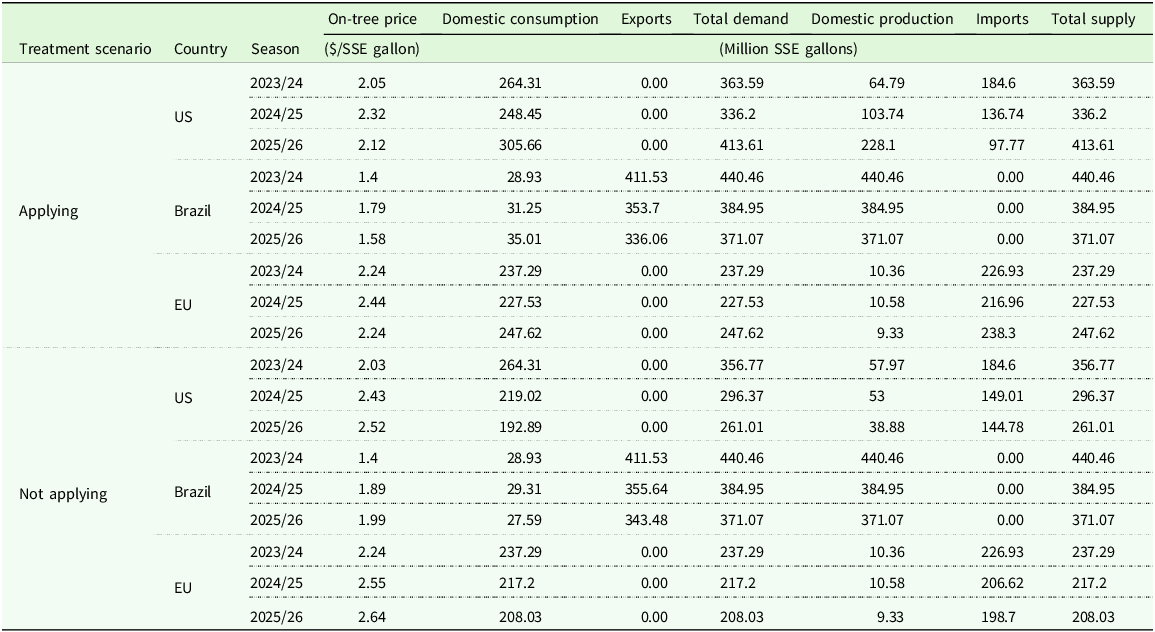
Table 4 summarizes the results of the SEM for the NFC orange juice market, comparing the treatment scenarios of applying and not applying antibiotic trunk injections over the three consecutive seasons in the baseline case, when the value of the demand elasticity in the U.S. was set at −2.14. Our estimates show that under the scenario in which antibiotic trunk injections are applied, domestic production of NFC orange juice in the U.S. is projected to increase significantly, starting at 64.79 million SSE gallons in 2023/24 and reaching 228.10 million SSE gallons by 2025/26. In contrast, under the scenario in which antibiotic trunk injections are not applied, production is expected to decrease over the same period, from 57.97 million SSE gallons in 2023/24 to 38.88 million SSE gallons by 2025/26. These estimates highlight the potential role of antibiotic trunk injections in alleviating the symptoms of HLB-infected trees and, therefore, increasing their yield. Conversely, the consistent decline projected in the absence of trunk injections underscores the anticipated difficulties in sustaining production levels if no treatment is adopted.
Spatial equilibrium model results for the not-from-concentrate (NFC) orange juice market in the U.S., Brazil, and the EU: impact of florida orange growers applying versus not applying antibiotic trunk injections (U.S. demand elasticity = −2.14)
Source: Authors’ calculations and FundeCitrus (2024).
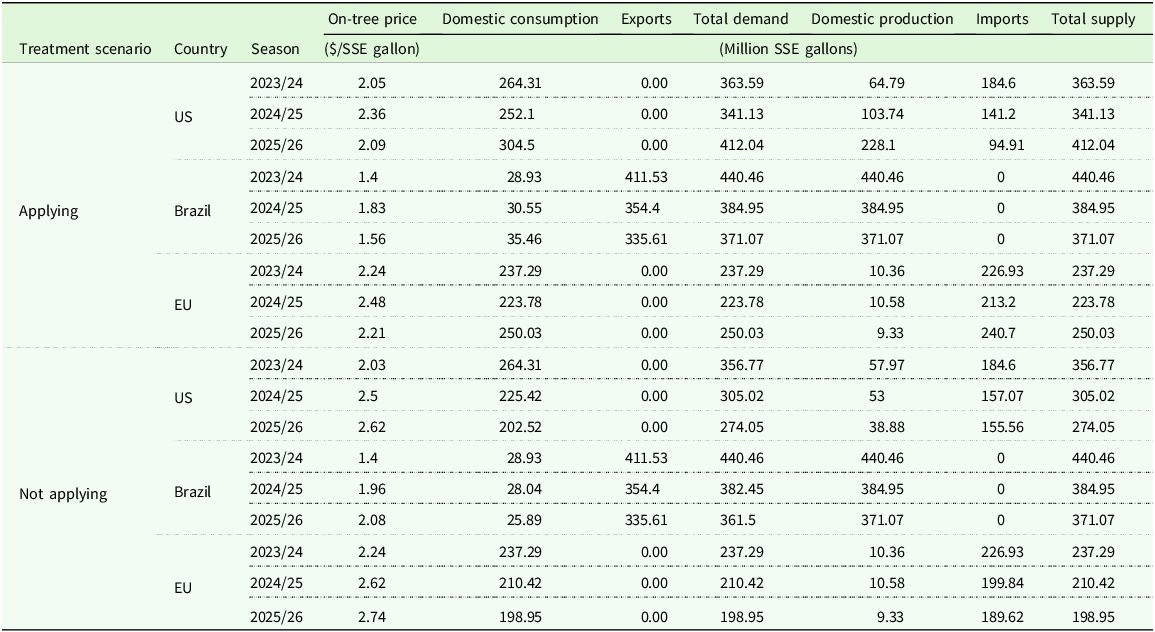
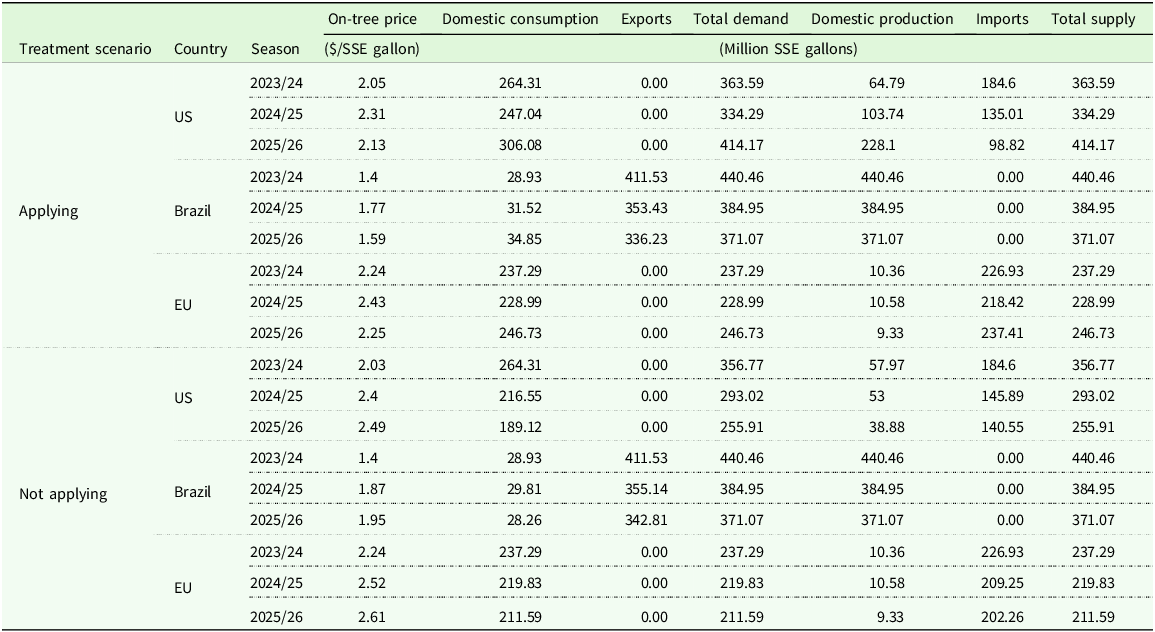
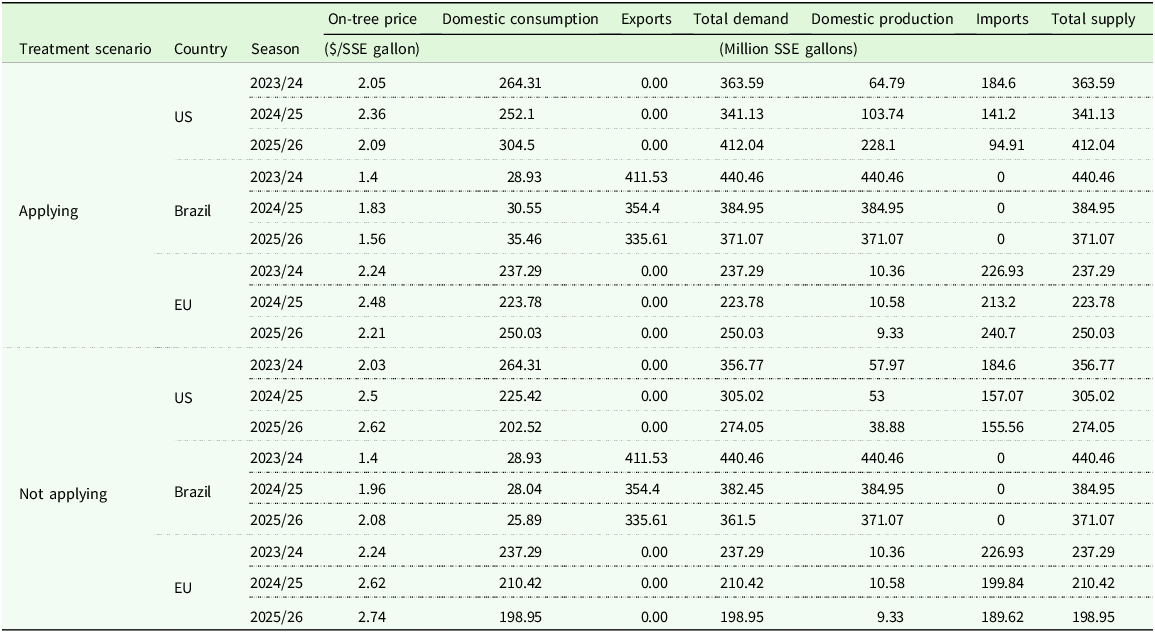
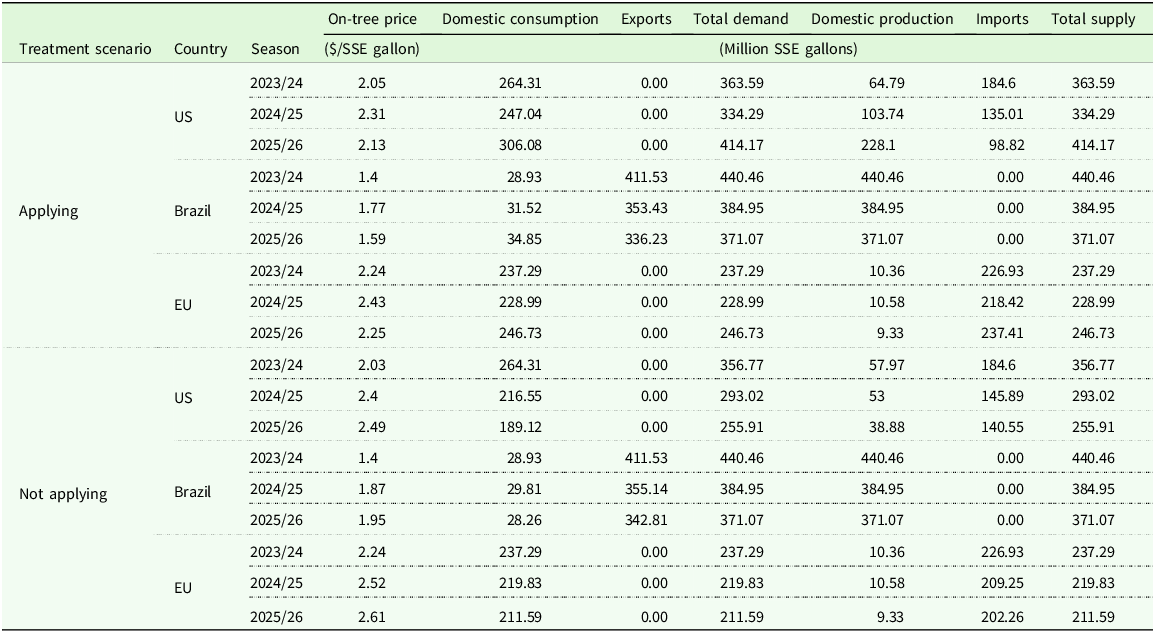
To assess the robustness of our main findings to the consumer demand responsiveness, we conduct a sensitivity analysis on U.S price elasticity of demand. Thus, we vary such an elasticity by considering two additional values: one for a less elastic case in which the elasticity is assumed to be −1.50 and one for a more elastic case in which the elasticity is assumed to be −2.50. For each elasticity value, we re-calibrate the corresponding demand functions for the three countries. The results for those two additional demand elasticity values are presented in Tables 5 and 6.
Spatial equilibrium model results for the not-from-concentrate (NFC) orange juice market in the U.S., Brazil, and the EU: impact of florida orange growers applying versus not applying antibiotic trunk injections (U.S. demand elasticity = −1.50)
Source: Authors’ calculations and FundeCitrus (2024).
Spatial equilibrium model results for the not-from-concentrate (NFC) orange juice market in the U.S., Brazil, and the EU: impact of florida orange growers applying versus not applying antibiotic trunk injections (U.S. demand elasticity = −2.50)
Source: Authors’ calculations and FundeCitrus (2024).
The results in Tables 4–6 show that for a given supply shift, as expected, the change in price from one season to the next is smaller under a more elastic demand compared to what it would be under a less elastic one. For example, under the baseline U.S. demand elasticity of −2.14, the U.S on-tree price under “apply” scenario is projected to decrease from $2.32 per SSE gallon in 2024/25 to $2.12 in 2025/26 (Table 4). Such a $0.20 decrease in price is smaller relative to the $0.27 price decrease observed under the less elastic demand scenario of −1.50 (Table 5), but larger than the $0.18 price decrease under the more elastic demand scenario of −2.50 (Table 6). This relationship also holds true under the “no apply” scenario. From 2024/25 to 2025/26, the differences in the U.S. on-tree price are $0.12 (Table 4), $0.09 (Table 5), and $0.08 (Table 6) per SSE gallon for demand elasticities of −1.50, −2.14, and −2.50, respectively.
Several consistent patterns emerge when comparing the outcomes for the three values of the U.S. demand elasticity. First, U.S. on-tree prices are generally lower under the “apply” scenario than under its alternative, an expected consequence of the increased global supply of NFC orange juice driven by higher U.S. production levels resulting from the technology. Second, U.S. NFC orange juice production shows a significant upward trend with trunk injections, projected to increase from 64.79 million SSE gallons in 2023/24 to 228.10 million SSE gallons by 2025/26. In contrast, Brazil’s production is projected to decline over the same period – declining from 440.46 million SSE gallons in 2023/24 to 371.07 million SSE gallons in 2025/26 – primarily reflecting the adverse effects of HLB, while the EU’s NFC orange juice production shows only minor fluctuations. Finally, U.S. imports of NFC orange juice decline substantially under the “apply” scenario across all three demand elasticities. This reflects the increasing contribution of domestic production to meeting U.S. consumption. While U.S. imports also trend downward under the “no apply” scenario (due to reduced export capacity from Brazil), the extent of this decrease is not as pronounced as under the “apply” scenario, as higher U.S. domestic production lessens the reliance on imports.
A noteworthy, more nuanced trend is observed in the U.S. on-tree prices under the “apply” scenario. As an example, as seen in Table 4, despite an increase in U.S. production, the on-tree price is estimated to be higher in 2024/25 ($2.32) relative to 2023/24 ($2.05). This seemingly counterintuitive result is due to the sharp decrease in Brazil’s production during that year, which reduced total global supply and caused, in turn, an increase in prices that outweighed the effect of increased U.S. output. However, by 2025/26, the substantial increase in U.S. domestic production from the adoption of antibiotic trunk injections is estimated to more than offset the decline in Brazil’s supply. This leads to a larger total supply available in the U.S. market in 2025/26, which is estimated at 413.61 million SSE gallons and a correspondingly lower price of $2.12 per SSE gallon in 2025/26 compared to $2.32 per SSE gallon in 2024/25.
The international trade flows resulting from our model reflect the changes in production and changes described above. For example, as shown in Table 4 for the demand elasticity of −2.14, we estimate that applying antibiotic trunk injections results in a decrease in U.S. imports from 184.60 million SSE gallons in 2023/24 to 97.77 million SSE gallons in 2025/26. Such a reduction, in turn, allows for increased EU imports from Brazil, which are estimated at 238.30 million SSE gallons. Conversely, under the alternative of no adoption, U.S. imports decrease less sharply, from 184.60 million SSE gallons in 2023/24 to 144.78 million SSE gallons in 2025/26. Consequently, EU imports from Brazil are lower in this scenario, projected at 198.70 million SSE gallons in 2025/26. Similar directional impacts on trade flows, though with varying magnitudes, are observed under the lower U.S. demand elasticity value of −1.50 (Table 5) and under the higher U.S. demand elasticity value of −2.50 (Table 6). For instance, under the −1.50 (−2.50) elasticity, U.S. imports in 2025/26 are 94.91 (98.82) million SSE gallons when applying antibiotic trunk injections versus 155.56 (140.55) million SSE gallons when not applying them.Footnote 17
4.3. Welfare analysis
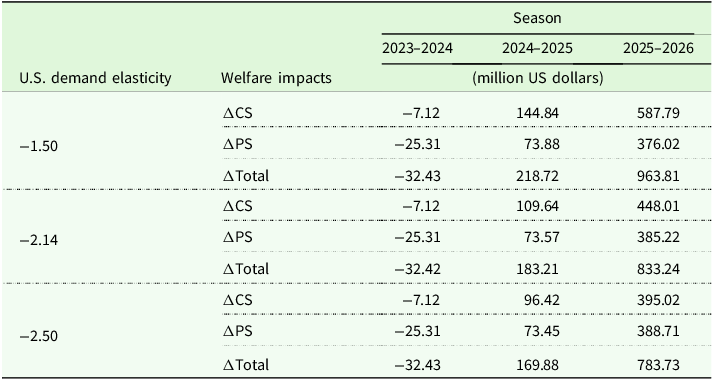
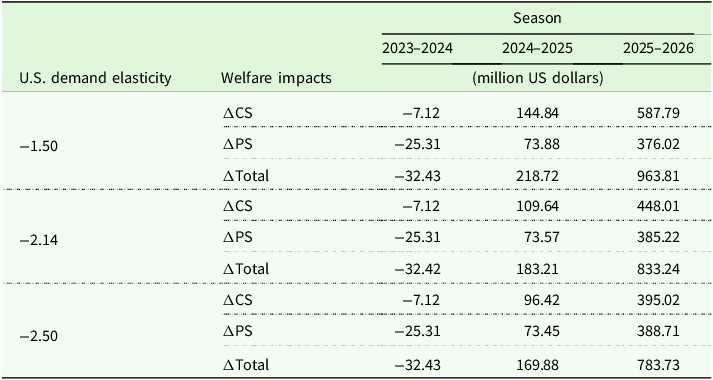
We summarize the estimated welfare changes from adopting versus not adopting antibiotic trunk injections for the 2023/24, 2024/25, and 2025/26 seasons in Table 8, including changes in U.S. consumer surplus (ΔCS), Florida producer surplus (ΔPS), and total social welfare (ΔTotal).
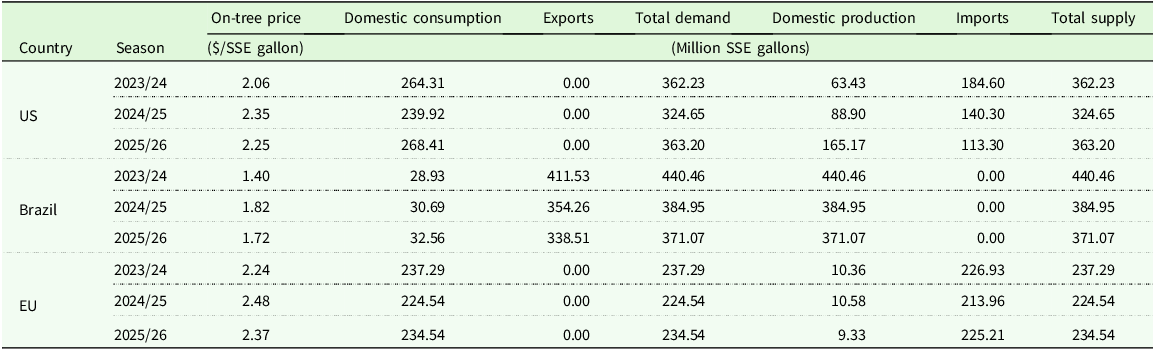
Spatial equilibrium model results for the not-from-concentrate (NFC) orange juice market in the U.S., Brazil, and the EU: valencia-only adoption of antibiotic trunk injections (U.S. demand elasticity = −2.14)
Source Authors’ calculations and FundeCitrus (2024).
Welfare impacts in the U.S. from applying antibiotic trunk injections across three U.S. demand elasticity values
Source: Authors’ calculations.
Overall, the results reveal a progressive increase in surplus over time as the benefits from the technology’s adoption accumulate. These findings are not surprising given the substantial increases in yield upon which we model the response to antibiotic trunk injections, which were reported by Albrecht et al. (Reference Albrecht, Tardivo, Moreno, de Freitas, Singerman, Plotto and Bai2025) based on experimental field data. Because no Florida citrus grower has yet reported obtaining a similar yield response in commercial groves, our results represent the potential best-case scenario for adopting such a technology and may not reflect actual outcomes.
For U.S. consumers, the adoption of antibiotic trunk injections by Florida growers leads to positive gains for all elasticity values in 2024/25 and 2025/26. There is a negative impact in 2023/24 because the retail price is marginally higher in the “apply” scenario ($9.10) than in the “no apply” scenario ($9.05). This retail price difference stems from a compositional shift at the farm level. Specifically, the yield increase from the treatment is more pronounced for the higher-priced Valencia variety than for the less expensive Early & Mid-season oranges, increasing the weighted-average on-tree price and, consequently, the retail price. However, this effect is quickly compensated, and the overall gain in consumer surplus is generally larger in a scenario with less elastic demand, where a larger price decrease would provide greater per-unit saving. By 2025/26, the substantial increase in production drives down market prices, leading to a considerable gain in consumer surplus that ranges from $395.02 million when the value of the demand elasticity is −2.50 to $587.79 million when the value of the demand elasticity is −1.50.
For Florida producers, the impact from adoption in 2023/24 is negative across all three demand elasticity values. This is due to the increase in variable costs from applying antibiotic trunk injections. However, this trend reverses in subsequent years. By 2024/25, the change in producer surplus becomes positive and increases by 2025/26, reaching between $376.02 million when the value of the demand elasticity is −1.50 and $388.71 million when the demand elasticity value is −2.50.
Despite the initial negative estimates for 2023/24, the cumulative change in total social welfare (ΔTotal) from adopting antibiotic trunk injections is positive. By 2024/25, the change in total surplus becomes positive across all U.S. demand elasticity values, and by 2025/26 the estimated gains in total social welfare are substantial in magnitude, ranging from $783.73 million when the value of the demand elasticity is −2.50 to $963.81 million when the value of the demand elasticity is −1.50. Similar to consumer surplus, the total welfare gain is largest when the demand is less elastic, indicating that the larger consumer benefits in this scenario more than offset the associated variations in producer benefits.
For the sake of completeness, and to provide a sensitivity analysis on the yield response from adopting antibiotic trunk injections, we also compute the minimum level of yield that would be needed at the aggregate level so that the producer surplus in Florida be positive. We find that yield would need to increase by more than 79% (83%) [87%] in 2024/25 and 2025/26 when using a discount rate of 5% (10%) [15%] to generate a positive producer surplus when adopting antibiotic trunk injections.
5. Conclusions
In this study, we provide an ex-ante farm-level assessment of the economic viability of the adoption of antibiotic trunk injections by Florida citrus growers to deal with HLB based on preliminary experimental field data results. Because no Florida citrus grower has yet reported obtaining a similar yield response in commercial groves, our results represent the potential best-case scenario for adopting such a technology and may not reflect actual outcomes. The analysis indicates that the technology’s profitability is variety-specific, making Valencia orange groves profitable while only improving the situation for Early & Mid-season orange groves but not achieving a profitable level for the period analyzed.
We also provide potential estimates of the changes in the U.S. NFC orange juice market derived from the adoption of antibiotic trunk injections. Should antibiotic trunk injections yield similar results in commercial groves as those obtained in experimental fields, our findings suggest that the adoption of antibiotic trunk injections would contribute to increase production of oranges in Florida. More specifically, we find that the adoption of such a technology will result in increased juice production, leading to lower domestic prices and imports, and net welfare gains in the U.S., with benefits accruing to both consumers and producers. These results are robust across various U.S. demand elasticity assumptions. Our findings are policy relevant because while a distinctive characteristic of the effective management of invasive species like HLB is addressing the public-good nature of the problem they pose, there is evidence that growers in Florida prefer the underlying source of uncertainty of a technology such as that of antibiotics over the strategic uncertainty involved in coordinating actions among them (Singerman and Lence Reference Singerman and Lence2023).
Antibiotic trunk injections for Florida citrus trees have only been approved for three seasons so far. Such a short approval timeframe limits the incentives for growers to invest in a capital investment that a new grove represents. Should the approval be extended, a limitation to our analysis is that it focuses on the short run. In the long run, market dynamics could make the results be different. The initial increase in producer surplus driven by the adoption of antibiotic injections would create an economic incentive for growers to invest in new plantings. As these new trees mature over several years, the aggregate industry supply would increase. Such an increase would exert downward pressure on market prices, leading to a situation where the gains in U.S. consumer surplus would likely be larger than our short-run estimates. The ultimate effect on Florida producer surplus, however, may become ambiguous; while early adopters would benefit, the decrease in prices could erode aggregate profits over time.
Data availability statement
The authors confirm that the data supporting the findings of this study will be available within the article.
Funding statement
This research was funded by the U.S. Department of Agriculture NIFA grant 2021-70029-36056.
Competing interests
None of the coauthors have relevant material or financial interests in the subject of the research (actual, potential, or perceived conflicts of interest).


 Open access

