


1. INTRODUCTION
Snow that falls in the cold, dry interiors of polar ice sheets slowly transforms into ice through an intermediate stage called firn. Firn density, ρ, increases with depth and time due largely to overburden stress from accumulation of new snow. The densification of firn is often divided into three zones. In zone 1  $(\rho \lt 550{\kern 1pt} \,{\rm kg}\,{\rm m}^{ - 3})$, firn becomes denser due to grain-boundary sliding and grain growth (Alley, Reference Alley1987). The density of 550 kg m–3 (porosity 40%) marks the transition to zone 2 and corresponds to the maximum packing density of uniform spheres (Cuffey and Paterson, Reference Cuffey and Paterson2010, p. 21). In zone 2 $(550{\kern 1pt} \,{\rm kg}\,{\rm m}^{ - 3}\, \lt \,\rho \lt 830\,{\kern 1pt} {\rm kg}\,{\rm m}^{ - 3})$, densification occurs primarily through sintering. During sintering, grain deformation occurs at the interface between grains. In this process the distance between the midpoints of neighboring grains is reduced, thereby densifying the firn. The transition to zone 3 occurs at the bubble close-off (BCO) density of ~830 kg m–3. Bubbles of air are trapped and are isolated from the overlying atmosphere. In zone 3, densification occurs through bubble compression until the density of ice is reached at ~917 kg m–3. These processes mentioned are the dominant ones; however, other processes may be important. Detailed observations of firn density profiles show that the transitions between the different zones are not as abrupt and clear as implied here (Hörhold and others, Reference Hörhold, Kipfstuhl, Wilhelms, Freitag and Frenzel2011), suggesting that the transition between these dominant modes of densification occurs gradually. The discussion here focuses on the dry snow zone, where summertime melt occurs only very rarely and meltwater percolation and refreezing do not need to be considered.
Understanding the processes of firn evolution including densification is important for several applications in glaciology. For ice core interpretation, firn-densification models are needed to establish a consistent chronology for the ice and for the gases trapped within it (Schwander and others, Reference Schwander1997; Goujon and others, Reference Goujon, Barnola and Ritz2003). Bubbles of air trapped in ice provide a direct measurement of past atmospheric composition, and stable isotopes in the ice provide a proxy for temperature and/or moisture source. The age of gas trapped in bubbles differs from that of the surrounding ice; this gas-age/ice-age difference (Δage) arises because gases diffuse rapidly through the porous and permeable firn (Schwander and Stauffer, Reference Schwander and Stauffer1984); for example, modern air is being trapped today in ice layers that can be hundreds to thousands of years old. Firn-densification models are needed to find the age of the firn at the lock-in depth (i.e. depth at which air can no longer exchange with the free atmosphere) in order to calculate Δage (e.g. see Buizert and Severinghaus, Reference Buizert and Severinghaus2016).
Satellite and airborne altimetry using radar or LiDAR allow centimeter-scale-resolution measurements of surface elevations of glaciers and ice sheets, which can be used to measure volume changes (e.g. Wingham and others, Reference Wingham, Ridout, Scharroo, Arthern and Shum1998; Zwally and others, Reference Zwally2005; Helm and others, Reference Helm, Humbert and Miller2014). A firn-densification model must be used to convert measured volume changes to mass changes. Firn models are also used to determine density-depth profiles in ice shelves and mountain glaciers to correctly model their rheological properties when firn comprises a large fraction of their thickness (Gagliardini and Meyssonnier, Reference Gagliardini and Meyssonnier1997; Lüthi and Funk, Reference Lüthi and Funk2000; Zwinger and others, Reference Zwinger, Greve, Gagliardini, Shiraiwa and Lyly2007).
Uncertainties in firn-densification physics introduce uncertainties into each of these firn-model applications. Uncertainty from firn modeling is the largest contributor of uncertainty in mass-balance estimates from altimetry methods, where the thickness change from the densification can be greater than the change in thickness due to mass-balance changes (Helsen and others, Reference Helsen2008; Shepherd and others, Reference Shepherd2012). In ice core research, fundamental lead-lag analysis between temperature changes and changes in atmospheric-gas concentrations requires a precise understanding of the Δage. Often the uncertainty in Δage estimation is larger than the lag between temperature change and atmospheric CO2 concentration change (Parrenin and others, Reference Parrenin2012).
In steady state at a given site (constant climate, no change in the firn density-depth profile and no ice-sheet thickness change) the firn-densification rate at any depth is also constant through time; the mass of the snow added by accumulation each year equals the mass of ice removed from the bottom of the firn column by downward ice flow. In reality, firn columns in ice sheets and glaciers are seldom, if ever, in the steady state envisioned in Sorge's Law (e.g. Bader, Reference Bader1954; Cuffey and Paterson, Reference Cuffey and Paterson2010, p. 19). For example, the difference between gas age and ice age is highly variable through space and time because firn densification depends strongly on accumulation rate and temperature, both of which vary spatially and temporally. Mass-balance studies of ice sheets can have significant uncertainty in estimating the mass of polar firn due to spatial and temporal variations in firn densification (Pritchard and others, Reference Pritchard2012).
The uncertainties in firn-densification models arise from the fact that no accurate, physically-based, widely applicable and widely accepted constitutive law yet exists for snow densification. Firn modeling has largely been an empirical process, calibrating models to present-day observed density profiles (e.g. Herron and Langway, Reference Herron and Langway1980; Spencer and others, Reference Spencer, Alley and Creyts2001). Some models determine effective viscosity, or firn stiffness, in a constitutive formulation that relates known overburden stress to measured strain densification rates (e.g. Arthern and others, Reference Arthern, Vaughan, Rankin, Mulvaney and Thomas2010; Morris and Wingham, Reference Morris and Wingham2014). These models take firn densification one step closer to a fully physics-based set of equations that can model transient behavior. The effective viscosity is generally calibrated empirically to firn texture such as grain size (e.g. Arthern and others, Reference Arthern, Vaughan, Rankin, Mulvaney and Thomas2010), to thermal history (e.g. Morris and Wingham, Reference Morris and Wingham2014), or to chemical impurities that control texture (e.g. Freitag and others, Reference Freitag, Kipfstuhl, Laepple and Wilhelms2013). Arnaud and others (Reference Arnaud, Barnola and Duval2000) described a model based on physics of grain sliding and plastic deformation, but its structural parameters are still empirical.
Three questions arise about firn models:
(1) When models are based on similar physical concepts, do their results agree? (inter-model variance);
(2) When models are calibrated under steady-state conditions, do they produce similar histories of change under transient conditions? (extension to transient physics);
(3) Do the models reliably represent ‘reality’, within and beyond their calibration range? (validation).
In this work, we address questions (1) and (2). Question (3) cannot be addressed fully until (1) and (2) are resolved, and we leave (3) as a topic for future work by the glaciological community.
Here, we present the results of the Firn Model InterComparison Experiment (FirnMICE). We compared the steady-state and transient behavior of eight firn-densification models and one seasonal-snow model by forcing all models with the same suite of temperature and accumulation-rate boundary conditions. By running FirnMICE we seek to provide a fundamental understanding in the variability among firn models and to provide direction for future firn research.
Our goal is to compare results and differences among results that would be obtained if a nonmodeler were to ask a modeler peer to solve a posed question about firn, with each peer expert using his or her model with its own governing equations in the manner that he or she determined was most appropriate for the question. We are not assessing numerical implementations of governing equations in the individual models. Because each of these models has previously been published in peer-reviewed literature, we accept here that basic concerns about numerics have been adequately addressed by authors and peer reviewers. Comparing results from different numerical implementations of a specific set of model equations is a different question, worthy of future research.
This paper is not a review paper; we do not provide here an exhaustive review of firn observations and modeling work. FirnMICE was not designed to select a favored firn model among numerous options. At the current stage of firn-model development, an appropriate firn model for any particular study must be chosen based on the complexity required for the analysis and the temporal and/or spatial domain and climate conditions. The ice core and altimetry scientific communities often use different firn-densification models. The spatial domain and resolution are the same for these two applications, but the time steps are often different: firn-model applications for ice core studies use sparse data to model long-term (multidecadal and longer) changes in the firn, whereas firn-model applications for altimetry studies use daily or monthly weather data and outputs from regional-climate models to investigate seasonal and interannual changes in the firn. However, firn evolution is ultimately based on physical laws, and a model implementing those physics should be able to predict firn evolution on any timescale regardless of the model's application. A goal of the FirnMICE project is to identify firn-model commonalities and discrepancies and to encourage connections among firn-research applications in order to improve the physical descriptions and parameterizations.
As an extension of this idea, we recognize that seasonal-snow models also compute densification rates of ice/air mixtures, but often emphasize different processes (such as melting and percolation) and are optimized for much shorter temporal and spatial steps. This can lead to significantly different responses when they are applied to firn. However, a long-term challenge would be development of a unified evolution model that could be applied to both seasonal snow and firn.
2. EXPERIMENT DESIGN
2.1. Participating models
We compared eight firn-densification models, designated as follows: HLA and HLS (Herron and Langway, Reference Herron and Langway1980), BAR (Barnola and others, Reference Barnola, Pimienta, Raynaud and Korotkevich1991), GOU (Goujon and others, Reference Goujon, Barnola and Ritz2003), ART (Arthern and others, Reference Arthern, Vaughan, Rankin, Mulvaney and Thomas2010), LIG (Ligtenberg and others, Reference Ligtenberg, Helsen and van den Broeke2011), SIM (Simonsen and others, Reference Simonsen2013) and CMG (Cummings and others, Reference Cummings, Johnson and Brinkerhoff2013). The Herron and Langway (Reference Herron and Langway1980) model has two solutions presented: an analytical solution (Herron and Langway, Reference Herron and Langway1980, Eqns (7) and (10)) and a stress-based solution (Herron and Langway, Reference Herron and Langway1980, Eqn (4c)). Features of the models and details about their implementation are shown in Table 1. Specific details about the models and their original applications are described in the Appendix.
The participating models vary in densification physics, numerics, and application. See Appendix for more detail

Continued.

The models have similarities; for example, all of the models use temperature and accumulation rate as the primary drivers of firn densification. Most of the participating models differentiate between zone 1 and zone 2 densification, and all of the models have an Arrhenius temperature dependence. However, the models differ in numerical implementation and description of firn-densification physics. The activation energies used in the Arrhenius term vary among models. The ART model includes a grain-size factor.
All of the models are empirical to some degree. The HLA, HLS, LIG, CMG, GOU, SIM, HLS and BAR models each have between four and seven adjustable parameters that have been tuned to match density-depth profiles from polar firn. The particular range of climatic conditions to which each model has been tuned is unique to that model (e.g. LIG was tuned using cores from 47 Antarctic sites; HLA was tuned with seven cores from Greenland and ten cores from Antarctica), although there is overlap in the sites used to tune (e.g. both LIG and HLA are tuned using data from South Pole). The ART model has only two adjustable parameters tuned to match strain rates measured in boreholes at sites that are relatively warm and have relatively high accumulation rate.
Firn-densification models are often categorized as either being ice core Δage models or altimetry mass-balance models, and we recognize the original application of each model in Table 1. The models may also be categorized by the physical description of the densification rate Dρ/Dt in a Lagrangian (material-following) coordinate system and by the assumptions built into the model physics. In Table 1, we describe how models treat stress in their densification-rate equations: some models implicitly represent stress through the accumulation rate, some models include the stress directly in their evolution equations and some parameterize the stress using the mean accumulation rate over the lifetime of a parcel of firn. The latter method is effectively the same as using the stress. None explicitly incorporates conservation of mass, momentum and energy. If the stress is parameterized by the immediate accumulation rate, the densification rate of a given parcel will have an instantaneous change when the accumulation rate is changed. If stress is included directly or parameterized by the mean accumulation rate over the lifetime of a parcel of firn, the densification rate of a parcel of firn will gradually adjust to the changing load history that accompanies an accumulation-rate change.
Groups of firn models share common ancestries. The Herron and Langway (Reference Herron and Langway1980) model serves as a benchmark firn-densification model. Herron and Langway (Reference Herron and Langway1980) compiled data of density as a function of depth from firn cores from Antarctica and Greenland. They assumed that the depth/density relationship was invariant in time and derived densification-rate equations, tuning parameters to fit the measured density profiles. In the absence of sufficient strain-rate data from varied sites spanning a broad range of climatic conditions, most modeling efforts have continued to use the steady-state assumption. In the present study, the Barnola and others (Reference Barnola, Pimienta, Raynaud and Korotkevich1991) model explicitly uses the Herron and Langway (Reference Herron and Langway1980) equation for zone-1 densification. Arthern and others (Reference Arthern, Vaughan, Rankin, Mulvaney and Thomas2010) measured firn strain rates to derive a densification equation (the model included in this study), but also invoked a steady-state assumption to find updated coefficients for the Herron and Langway (Reference Herron and Langway1980) model. The Ligtenberg and others (Reference Ligtenberg, Helsen and van den Broeke2011) and Simonsen and others (Reference Simonsen2013) models are both extensions of the Arthern and others (Reference Arthern, Vaughan, Rankin, Mulvaney and Thomas2010) steady-state model, where the coefficients are updated to apply to a larger range of polar climates. Cummings and others (Reference Cummings, Johnson and Brinkerhoff2013) use the Ligtenberg and others (Reference Ligtenberg, Helsen and van den Broeke2011) densification equation with an enthalpy formulation.
The Goujon and others (Reference Goujon, Barnola and Ritz2003) model draws upon the physics described by Alley (Reference Alley1987) and Arnaud and others (Reference Arnaud, Barnola and Duval2000). The models that are compared in this work do not constitute an exhaustive list of firn models. Notable exceptions include the models described by Alley (Reference Alley1987), Spencer and others (Reference Spencer, Alley and Creyts2001), Li and Zwally (Reference Li and Zwally2004), Helsen and others (Reference Helsen2008), Li and Zwally (Reference Li and Zwally2011) and Kuipers Munneke and others (Reference Kuipers Munneke2015).
The ESS seasonal-snow model (Essery and others, Reference Essery, Morin, Lejeune and Ménard2013) has been included to see how well a physics-based seasonal-snow model can perform when applied to long timescales and surface conditions far outside its calibration range. The model incorporates a surface energy balance and stress-based densification, and itself represents the results of a wide-ranging intercomparison of seasonal-snow models.
2.2. Synthetic boundary conditions
We forced the models using synthetic temperature and accumulation-rate boundary conditions. There are a number of advantages to using this approach for this type of research question. It isolates the differences between empirical tuning and physics among models by examining steady state and transient model responses. The models show steady-state differences that are attributed to differences in empirical tuning and transient differences that are attributed to the way that the models describe firn-densification physics. The introduction of a climatic step change isolates effects of temperature and accumulation rate on each model's densification physics.
Future work could include incorporating temperature and accumulation rates for a particular site from reanalysis or ice-core reconstructions, but there are complications with using reconstructed data for the purpose of understanding fundamental firn physics. Firn models use empirical tuning to account for an imperfect description of physics. If an intercomparison experiment were designed to force the set of firn models for reconstructed boundary conditions for the last 2000 years, the modeled depth-density profile at present could be compared with observed depth-density profiles for a particular site. Models empirically tuned to particular sites or regions would likely outperform other models (e.g. firn models tuned for Summit, Greenland are not necessarily expected to fit East-Antarctica data well), and the experiment might demonstrate which models have been empirically tuned for the site rather than which has the best representation of firn-densification physics. An experiment using site-specific reconstructed accumulation rates and temperatures must also consider the uncertainties in the reconstructed boundary conditions. If there is a model-output misfit to observed density profiles, is it an error in the reconstructed boundary conditions or a poor choice in the model physics? For this study we focused on investigating how differences among the models, including physics and empirical tuning, affect the firn density and age.
2.3. Methods
We compared the models in a series of six experiments by forcing the models with temperature and accumulation-rate step changes. FirnMICE participants completed model runs and submitted model output for the suite of experiments. The models were spun-up to an initial steady state using initial temperature and accumulation-rate boundary conditions specific to each experiment. Each FirnMICE participant was allowed to choose how specifically to spin-up his or her model; Table 1 includes a description of how participating models were initialized. After the spin-up, the model run began (t = 0 years). A step change in either temperature (Experiments 1–3; 5 K increase) or accumulation rate (Experiments 4–6; 0.05 m a–1 increase) was prescribed at t = 100 years into the 2000-year model run. Figure 1 shows the initial conditions and step changes. The accumulation-rate and temperature boundary conditions are within the range of values observed in polar regions. The six experiments were designed to (1) probe 12 steady-state model solutions, as the initial and final steady-state conditions for each of the experiments are unique, and (2) investigate the transient response of each model to the climate perturbation. The following constraints were also prescribed:
(1) The surface density was held constant at $\rho _0 = 360{\kern 1pt} \,{\rm kg}\,{\rm m}^{ - 3}$.
(2) The Neumann (gradient) temperature boundary condition at the bottom of the firn was set to 0 K m–1, ~1000 m below the surface. This large model domain (~10 times the firn column thickness) was chosen to account for the large thermal mass of the ice sheet.
(3) At high latitudes where surface temperature is driven by sunlight, the annual temperature cycle often shows a coreless winter, because the lowest portion of the sinusoidal insolation signal is effectively truncated in periods of total darkness. This effect can be further enhanced by higher windiness in winter; this can disrupt the boundary-layer temperature inversion more frequently in winter (Thompson, Reference Thompson1969).

Participants could choose to implement a seasonal temperature cycle T seas (K) that varied around the mean annual temperature. The recommended seasonal cycle (supplementary material in Orsi and others, Reference Orsi, Cornuelle and Severinghaus2012) was
 $$T_{seas} = A({\rm cos}(2\pi t) + 0.3{\rm cos}(4\pi t)),$$
where the amplitude of the seasonal cycle A was given as 10 K, t is time in years, and the second term generates a coreless winter. The optional addition of this cycle was included to allow participants to preserve authenticity of the models as they are typically used.
The accumulation-rate and temperature boundary conditions specified for the six experiments. In Experiments 1–3 there was a positive 5 K temperature step change while accumulation rate remained constant at 0.1 m a–1 (ice equiv.). In Experiments 4–6 there was a positive 0.05 m a–1 accumulation rate step change while the temperature remained constant at −30°C.

The initial grain size was not prescribed, nor was the parameterization for thermal conductivity. Participants were free to use their preferred values in their models.
2.4. Model output and derived quantities BCO and depth-integrated porosity (DIP)
Model outputs for the six experiments were firn age, density and temperature as functions of depth. From these outputs, it is possible to calculate the depth and age of lock-in and BCO as well as the DIP, which is the total amount of air in the firn column. The lock-in age is needed to calculate Δage in the past. Δage is the lock-in age less the age of the enclosed gas; however, the latter is very small (usually on the order of tens of years). For our synthetic modeling experiments in which we investigate differences among models, all participants calculated the depth and age of the 815 kg m–3 horizon, which we call the BCO horizon, following Barnola and others; if the results were to be used for gas-mobility studies, we would consider the firn age and depth at the lock-in density. DIP is used in studies of ice-sheet mass balance as a correction to altimetry measurements (e.g. Sandberg Sørensen and others, Reference Sandberg Sørensen2011). The DIP is the porosity ϕ integrated over depth z from the surface to depth z i where ice density ρ i is reached:
 $$DIP = \int_0^{z_i} \phi (z)dz = \int_0^{z_i} \displaystyle{{\rho _i - \rho (z)} \over {\rho _i}}dz.$$
3. MODELING RESULTS
3.1. Steady-state firn-model variability
Because the six experiments start at steady state and end very near a new steady state (see Section 3.2), the DIP and BCO values from times t = 0 and t = 2000 years provide steady-state model results for 12 temperature and accumulation-rate pairs. Figure 2 shows steady-state (or near steady-state) values of DIP, BCO depth and BCO age for those 12 steady climates. Figures 2a–c show DIP, BCO depth and BCO age as a function of temperatures from −50°C to −25°C for a constant accumulation rate of 0.1 m a–1. Figures 2d–f show DIP, BCO depth and BCO age as a function of accumulation rates from 0.02 m a–1 to 0.30 m a–1 for a constant temperature of −30°C. The standard deviations (SDs) provide a measure of the variation among the models for each calculation. The general pattern of variability includes relatively higher SD at the lower and upper bounds of the temperatures and accumulation rates in the experiment, because not all of the models have used data from those extremes in their calibrations. Figure 2f shows the highest variability in BCO age at low accumulation rates, for which the SD is ~200 years at 0.02 m a–1. This is attributable in large part to the ART model, which was calibrated only with warmer, higher-accumulation conditions in the Antarctic Peninsula and was not intended to apply to deeper, very-cold firn. The highest SD for depth is ~8 m at −20°C in Figures 2b, e.
The FirnMICE models were at steady state at t = 0 after spin-up and near steady state at t = 2000 years (see discussion of transients in Section 3.2, providing 12 steady-state realizations of DIP and BCO). An accumulation rate of 0.1 m a–1 and a range of temperatures produced the steady-state values for DIP and BCO shown in a–c. A temperature of −30°C and a range of accumulation rates produced the steady-state results for DIP and BCO shown in d–f. The SD among the eight models is shown in the lower panel for each DIP and BCO figure. See Section 2.1 and Appendix A for explanation of model legend.

The models’ similar approach to tuning (to measured depth-density profiles) may explain some of the agreement in their steady-state responses. The ART model's lower sensitivity to accumulation rate may reflect differences in the number of adjustable parameters, the target used for tuning (warmer, higher accumulation sites), the representation of the underlying physical mechanisms, or in a combination of the three. Until the sensitivity of density-depth profiles to accumulation rate and temperature can be reproduced by a physically-based model without any adjustable parameters, there will be some uncertainty as to the physical explanation for this sensitivity. Further, this will translate into uncertainty in the accuracy of the models when they are applied to climatic conditions different from the tuning datasets, or to modeling the response to temporal changes in climate. The transient FirnMICE simulations are designed to quantify this uncertainty in more detail.
Excluding the accumulation rate = 0.02 m a–1 data point, 1 SD, shown in Figure 2, is ~2 m for DIP, <8 m for BCO-depth, and <60 years for BCO-age. The range of steady-state values given by FirnMICE models can be interpreted as the limit to which firn models can be tuned, such that this tuning can be extrapolated to other sites in a similar temperature and accumulation range. For example, DIP is unlikely to be inferred with confidence from a firn model to better than 2 m in steady state at a specific site with known accumulation rate and temperature. These limits are due to calibration differences, differences in the thermal coefficients in the advection-diffusion equation and other factors beyond temperature and accumulation rate that are not included in the models.
3.1.1. Sensitivity to temperature
Each of the FirnMICE models incorporates sensitivity to temperature through an Arrhenius exponential factor with a constant activation energy. Their activation energies for the second stage range from 17.6 kJ mol–1 (ART, LIG, in a steady-temperature regime) to 60 kJ mol–1 (BAR, GOU). This Arrhenius relationship causes a nonlinear sensitivity to temperature: the (absolute value of) slopes of steady-state DIP, BCO depth and BCO age with respect to temperature increase with decreasing temperature (Figs 2a–c), i.e. the models predict a larger difference in steady-state DIP and BCO values for a given difference in steady-state temperature at colder steady-state temperatures. The models with lower activation energies (HLA, ART, SIM, LIG) appear to have a slightly higher sensitivity to temperature. From the form of the model equations (see Appendix), however, we might expect the differing activation energies among the models to have a major influence on the temperature sensitivities. However, that influence is likely counteracted by other model factors, for example differing sensitivities to accumulation rate.
It is not clear whether colder firn should have an increased sensitivity to temperature. Capron and others (Reference Capron2013) compared firn thickness in Antarctica predicted by the Goujon and others (Reference Goujon, Barnola and Ritz2003) firn-densification model to ice core δ 15N data, a proxy for firn thickness in the past. They found that the firn model failed to predict the observed δ 15N variations during the last deglaciation and suggested that the sensitivity to temperature in firn models may be overestimated and sensitivity to accumulation rate may be underestimated. Zwally and Li (Reference Zwally and Li2002) suggested that activation energy is itself a function of temperature. The effective activation energy for firn densification also may depend on two or more activation energies for separate processes (e.g. see Arthern and others, Reference Arthern, Vaughan, Rankin, Mulvaney and Thomas2010), which need to be determined independently.
3.1.2. Sensitivity to accumulation rate ḃ
FirnMICE models show an increase in DIP and BCO depth with increasing accumulation rate  $\dot b$. A higher $\dot b$ yields younger firn at any given depth due to faster downward advection. This younger firn has had less time to compact and thus has lower density (higher porosity); as a result, the close-off density is not achieved until a greater depth. Because densification is driven by overburden load σ, densification rate at a given depth will be lower when the average density above that depth is lower due to higher accumulation rate. This reduced densification rate at a given depth, together with reduced time to compact before reaching that depth, further increases the sensitivity of model DIP and BCO depth to accumulation rate $\dot b$. This increased sensitivity is enhanced further in models with higher stress exponent. However, the BCO age decreases with increasing accumulation rate for all models, because the greater stress σ due to greater overburden load at any age tends to produce faster densification so that close-off density is reached sooner.
These generalizations hold even though the models differ widely in their representation of the dependence of the densification rate on accumulation rate. Although ART qualitatively follows these trends, it is an outlier in (Figs 2d–e), showing less sensitivity to accumulation rate. ART is based on Nabarro-Herring creep, which has a linear stress dependence, and therefore might be expected to have less sensitivity to  $\dot b$ than GOU and BAR, which are based on dislocation creep, with a cubic dependence on σ. Furthermore, densification is also opposed by larger grain size. Like stress σ, grain size r 2 also grows linearly with time, but from a nonzero starting point $r_0^2 $. This further reduces the sensitivity to $\dot b$. As a result, ART is almost insensitive to the accumulation rate.
LIG used a steady-accumulation formulation of ART that includes a linear dependence on  $\dot b$ (see Appendix), and introduced a dependence on $ - {\rm ln}(\dot b)$. CMG follows the same equation as LIG and has a very similar response. GOU and BAR are based on dislocation creep, with a dependence on σ 3, and interestingly give similar results to LIG and CMG. HLS and SIM are the most sensitive to the accumulation rate, and for these models the densification rate is proportional to $\sqrt {\dot b} $.
3.1.3. Challenges constraining temperature and accumulation-rate sensitivities
It is difficult to accurately constrain the stress dependence and activation energy with modern field data because in practice, accumulation and temperature are almost always correlated (accumulation rate increases with temperature) and increasing temperature and increasing accumulation rate have opposite effects on firn-densification rate. Improved constraints on activation energy and stress dependence may come from controlled experiments on deformation of firn in a laboratory, where the temperature and loading history can be isolated. Progress has been made on this problem for snow using micro-computed tomography (e.g. Schleef and Löwe, Reference Schleef and Löwe2013). However, under typical stress levels found in nature, the long timescales for firn densification may prove to be challenging for laboratory experiments. Additionally, setting the rate of incremental loading would be very difficult. Therefore, field investigations will also be needed at targeted suites of sites where accumulation varies significantly while temperature does not, and vice versa. For example, on a 20-km south-north transect across Taylor Dome, temperature changes by only 3°C (Waddington and Morse, Reference Waddington and Morse1994), while accumulation rate varies by a factor of four (Morse and others, Reference Morse1999). That site could isolate accumulation-rate effects. Identifying other sites or suites of sites with similar accumulation rates but substantially different temperatures could help isolate temperature effects.
3.2. Transient firn-model variability
3.2.1. Density variability
Figure 3 shows each model's predicted depth-density profile at t = 2000 years and the mean density profile of all the models  $\bar \rho (z,t = 2000)$ for Experiment 1. In Figure 4, we characterize the differences among the models’ predicted depth-density profiles using the ${\rm S}{\rm D}_\rho (z,t)$ of the models’ predicted densities $\rho (z,t)$ at selected times t. Because $\bar \rho (z,t)$ increases monotonically with depth z, we use $\bar \rho (z,t)$ as a proxy for depth to produce the same independent variable for all six experiments. The pattern of density variability is qualitatively the same through time for the six experiments, shown at 0, 150, 250 and 2000 years. The density variability is small at the surface where the models are constrained by the prescribed initial condition and at depth where they all approach ice density.
Depth-density profiles and the mean depth-density profile  $\bar \rho (z,t)$ for Experiment 1 at the end (t = 2000 years) of the model run. GOU predicts a faster densification rate in zone 1, and its transition to zone 2 happens at a shallower depth and lower density than the other models (see Appendix). This behavior creates the first maximum in standard deviation ${\rm S}{\rm D}_\rho (z,t)$ seen in Figure 4. Deeper in the firn, the models’ predicted depth-density profiles diverge, leading to the second ${\rm S}{\rm D}_\rho (z,t)$ maximum seen in Figure 4. The figure is representative of all the experiments. See Section 2.1 and Appendix A for explanation of model legend.

The variation of standard deviation  ${\rm S}{\rm D}_\rho (z)$ among the models at depth z where mean density is $\bar \rho (z)$ is shown at times t = 0, 150, 250 and 2000 years. Using $\bar \rho (z)$ as a depth proxy allows us to show results from all six experiments on a common independent variable. The depth pattern of density variability among the models is maintained through time for the six experiments, with a minimum in variation at ~600 kg m–3 and maxima at 450 kg m–3 and at 750–850 kg m–3.

A local minimum in density variability among the models also occurs at ~600 kg m–3, which is near the density commonly accepted as the transition from zone 1 to zone 2. This minimum is a result of the variance in the models’ densification rates in zone 1 and zone 2, as can be seen in Figure 3. Compared with the other models, the GOU model predicts a higher densification rate as a function of depth in zone 1 and a transition to zone 2 densification at a lower density. As a result,  ${\rm S}{\rm D}_\rho (z,t)$ increases in zone 1 as GOU diverges from the other models. Below the zone 1/zone 2 transition, ${\rm S}{\rm D}_\rho (z,t)$ decreases as GOU predicts a lower densification rate as a function of depth in the upper part of zone 2 and its predicted depth-density profile approaches the mean depth-density profile. Deeper in the firn, variance in the models’ predicted densification rates causes the modeled depth-density profiles to diverge, and ${\rm S}{\rm D}_\rho (z,t)$ increases to a maximum between the densities of 750 and 850 kg m–3 before the models converge to the ice density at depth. Although Figure 3 only shows results from Experiment 1, it is representative of all the experiments: GOU consistently predicts a higher densification rate in zone 1, but no single model consistently predicts higher or lower densification rates in zone 2.
3.2.2. Temperature variability
Temperature profiles of the model results for Experiment 1 are shown at times 0, 150 and 2000 years in Figure 5. At initialization, the models have (mostly) reached steady state, with nearly constant and uniform temperature of −50°C. At time t = 150 years, the temperature profiles have been responding for 50 years to the 5°C increase in temperature. The Herron and Langway (Reference Herron and Langway1980) analytic model immediately takes the new temperature of −45°C and the CMG model is slowest to respond, due to differences in the parameterization of the diffusion-advection equation. The time-dependent temperature models differ at 150 and 2000 years, reflecting different tuning in heat-equation terms, including the thermal conductivity, density, and specific-heat terms of the heat equation. At 2000 years the temperature results show that a new thermal steady state has not yet been reached; however, we can treat density profiles as approximately steady state, and BCO and DIP, two measures of interest, undergo only small differences beyond 2000 years.
Temperature profiles from the firn models in Experiment 1 are shown at 0, 150 and 2000 years. The results have not reached steady state at 2000 years. Differences among the models arise both from differing rates of densification and differences in the firn-thermal-diffusivity parameterization. See Section 2.1 and Appendix A for explanation of model legend.

The time to reach thermal equilibrium after a surface-temperature change (Experiments 1, 2 and 3) is longer than the 2000 years of the model run. This (diffusive) timescale is a result of the large thermal mass of the underlying ice sheet, which introduces a strong memory effect. We can estimate the diffusive e-folding timescale τ to 200 m depth for the temperature perturbation by nondimensionalizing the heat equation: τ ≈ z 2/κ. Approximating the thermal diffusivity of firn  $\kappa = 8 \times 10^{ - 7}{\kern 1pt} {\rm m}^2{\kern 1pt} {\rm s}^{ - 1}$ (Giese and Hawley, Reference Giese and Hawley2015): $\tau \approx (200\,{\rm m})^2/(8 \times 10^{ - 7}{\rm m}^2/{\rm s}) \approx 1600\,{\rm years}$. The advective heat-transport timescale is of similar magnitude: it can be approximated as $\tau \approx z/\dot b = 200\,{\rm m}/0.1\,{\rm m}{\rm a}^{ - 1} = 2000\,\,{\rm years}\,$.
3.3. DIP results
The DIP (Eqn (2)), which is the total amount of air in the firn column, is the key model result needed for studies of ice-sheet mass balance in order to correct observations of surface-elevation change for changes in firn-air content. In Figure 6, DIP is shown through time for the six experiments. The DIP varies among models in both the steady-state and transient behavior. First, we note that following spin-up (i.e. during the first 100 years), the DIPs calculated by the various models vary by a range of typically 4–8 m of air in the firn column. These differences among the models represent a large uncertainty in the total amount of air in the firn column, which is typically between 20 and 40 m.
The DIP for six experiments from participating models. The time is shown to 1000 years to highlight variation after the step change at 100 years. (a–c): For all models in steady state (t = 0–100 years), DIP is smaller when the mean annual temperature is greater, and the step-change temperature increase causes a decrease in DIP. (d–f): DIP is larger when the accumulation rate is higher, and the accumulation-rate increase causes an increase in DIP. The magnitude of the change is larger when the climate perturbation is proportionately larger (e.g. Experiment 4 is a 250% increase in accumulation rate, while Experiment 6 is just a 20% increase). See Section 2.1 and Appendix A for explanation of model legend.

The transient behavior (i.e. after the temperature or accumulation rate perturbation 100 years into the run) generally results in a decrease in DIP with an increase in temperature (Figs 6a–c), and an increase in DIP with an increase in accumulation rate (Figs 6d–f), as noted in Section 3.1. After the transients have run their course, the models generally tend to settle back into the same relative order of DIP; however, the amount of change varies among the models, shown in Figure 7. These differences among models indicate the range of uncertainty, which should be taken into account when calculating the mass change in an ice sheet in response to climate changes.
As in Figure 6, but each model has its initial steady-state value subtracted from the time series to highlight the variation in model-predicted DIP change that results from the climate step change. See Section 2.1 and Appendix A for explanation of model legend.

The majority of the models tend to relax monotonically toward their new DIP states over centennial timescales. This is to be expected for models that depend only on climate states represented by surface temperature T and accumulation rate  $\dot b$, because their evolution depends explicitly only on firn temperature and overburden load. However, in recognition that firn structural properties affect densification rate, models based on Arthern and others (Reference Arthern, Vaughan, Rankin, Mulvaney and Thomas2010) either explicitly (ART) or implicitly (LIG, SIM, CMG) incorporate the additional physical process of grain growth. These additional processes can influence densification rates over shorter timescales because aggregates of larger grains compact more slowly in those models. This effect can modify or even reverse the changes in DIP over time, producing histories that are more complex. Output from LIG shows an initial increase in DIP following the step increase in temperature (Figs 6a–c). However, DIP ultimately decreases, following the general trend of the other models. This pattern could be explained by initial stiffening of the near-surface firn due to larger snow grains or enhanced grain growth initially exceeding the ultimate softening due to warmer temperatures throughout the firn column. This is not the case for the Simonsen and others (Reference Simonsen2013) model (SIM), although they share the same temperature dependency with the same coefficients in their Arrhenius term (see Appendix). SIM does, however, include an additional Arrhenius term in its zone-2 densification equation, which could explain the different transient responses to temperature.
Unlike in the other models, which all show only a monotonic increase in DIP driven by enhanced burial rate of lower-density firn following the step increase in accumulation rate (Figs 6d–f), the initial increase in DIP in the ART and SIM models is then followed by a gradual decrease. This ‘overshoot’ behavior occurs due to the different timescales of grain growth and advection. The increase in accumulation rate causes the firn to thicken as more air is incorporated (see Fig. 10); the new climate effectively adds snow to the surface more rapidly, and that snow has less time to consolidate before reaching any given depth; just as in the simpler models, this factor initially increases the DIP. The increased accumulation rate also increases the downward advection rate of a parcel of firn relative to the transient surface, meaning that a firn parcel at a given depth is younger than a parcel at the same depth before the accumulation increase. Grain growth is a time-dependent firn-stiffening mechanism, and so the younger firn is softer. Eventually, the increased softness of the firn becomes the dominant process as the older, stiffer firn is replaced by the younger, softer firn. The softer firn column then compacts more rapidly at any depth when compared with times before the climate step, and the DIP decreases again. However, as in the other models, DIP ultimately still reaches a greater value than it had initially.
Figure 8 shows the time derivative of the DIP, i.e. the slopes of the curves in Figure 6, illustrating the rate at which firn responds to the climate changes with each model. The models generally predict that DIP changes quickly after the climate step change, but the magnitudes of the predicted rates of change vary. The rate of DIP change decreases through time, but not necessarily monotonically.
The time derivative of the depth-integrated porosity (dDIP/dt) for participating models in the six experiments. (a–c): Experiments 1–3, step increase in temperature. (d–f): Experiments 4–6, step increase in accumulation rate. Most models exhibit monotonic relaxation to the new steady state. Models with additional physics can show more complex adjustment patterns in the initial decades to centuries. In (a–c): see LIG. In (d–f): see ART. See Section 2.1 and Appendix A for explanation of model legend.

3.4. BCO results
BCO age and depth are key model results for ice core paleoclimate studies. The BCO age and depth are shown for the six synthetic experiments in Figures 9 and 10. The BCO age generally decreases with the increase in temperature and accumulation rate. The BCO depth decreases with an increase in temperature due to the increase in densification rate; however, the BCO depth increases with an increasing accumulation rate since the increase in advection rate outweighs the increase in densification due to the overburden load.
The BCO age of the six experiments for the participating model. (a–c): The BCO age is younger with increased temperature and (d–f) increased accumulation rate. See Section 2.1 and Appendix A for explanation of model legend.

As with the model-predicted DIP, the transient BCO responses vary considerably among the models. In the temperature-step-change experiments (1–3) there is disagreement in the sign of the BCO age response immediately following the step change (Figs 9a–c). Additionally, ART shows an initial decrease in BCO depth, followed by an abrupt increase and then again a decrease towards the new steady state (Figs 10a–c), as the grain-size and viscosity continue to adjust after the step change. The time the models take to reach equilibrium with a new accumulation rate (experiments 4–6) is relatively short and approximately equal to the BCO age. This is the (advective) timescale needed to refresh the firn column with snow deposited under the new climatic conditions. Once the entire firn column has been refreshed down to the BCO, no memory remains of the previous climatic state. Note that the DIP response time (Fig. 6) is longer, because it involves density changes in the entire firn column and not just in the upper firn above the BCO depth. The magnitudes of the predicted changes in the BCO metrics vary as well, similarly to the DIP changes shown in Figure 7.
The BCO depth for the six experiments for participating models. (a–c): The BCO depth decreases with increased temperature and (d–f): increases with increased accumulation rate. See Section 2.1 and Appendix A for explanation of model legend.

In Experiment 4, the ART and SIM models show sudden discontinuous jumps in BCO age (Fig. 9d) and depth (Fig. 10d). These models incorporate grain-size dependence such that presence of large grains slows densification. Snow deposited after the accumulation-rate step change (an increase by a factor of 3.5) can reach any depth faster than snow deposited before the step increase, and at that depth the snow has a history of smaller grains and lower effective viscosity. It has therefore experienced significantly more densification and achieved higher density. For some time following the step change, the firn deposited after the step change can achieve a density higher than the older firn below it that was deposited before the step change. During that time span, BCO is still achieved only in the pre-step-change firn, but a density reversal can develop in the density-depth profile (i.e. higher-density firn shallower than lower-density firn). When the first layer of post-step-change firn reaches the close-off density, it creates a second, shallower BCO transition and air exchange between the atmosphere and the deeper pre-step-change firn is abruptly blocked. Until the last pre-step-change firn achieves BCO, there are two BCO transitions, a deep BCO in the pre-step-change firn and a shallow BCO in the post-change firn. However, only the shallower BCO is tracked, because it is the important one for air exchange and bubble occlusion.
4. DISCUSSION
4.1 Model variability and extension to transient physics
We address questions (1), (2) and (3) posed in Section 1.
(1) When models are based on similar physical concepts, do their results agree? (model variance) Agreement can be assessed with measures such as density variation with depth and age, and with measures such as DIP and BCO, which are integrated through the firn column. We recognize that experiments 1–6 explore subtle differences in model variation, where a small change in density
$\rho (z)$ can produce a large change in DIP and BCO. Figure 2 shows variability in BCO and DIP among models for steady-state temperature and accumulation rate. Figure 4 shows that the models are more tightly clustered at some densities than others. Aside from Experiment 4 (which is a climate likely outside of the models’ calibration ranges, and was designed to push the models to their limits), the models generally show similar SDs, ${\rm S}{\rm D}_\rho (z)$ at similar mean densities $\bar \rho (z)$ in zone 1 (${\rm S}{\rm D}_\rho (z){\rm \sim} 30{\kern 1pt} {\rm kg}{\kern 1pt} {\rm m}^{ - 3}$ at $\bar \rho (z){\rm \sim} 450{\kern 1pt} {\rm kg}{\kern 1pt} {\rm m}^{ - 3}$) and zone 2 (${\rm S}{\rm D}_\rho (z){\rm \sim} 10 - 20{\kern 1pt} {\rm kg}{\kern 1pt} {\rm m}^{ - 3}$ at $\bar \rho (z){\rm \sim} 700 - 800{\kern 1pt} {\rm kg}{\kern 1pt} {\rm m}^{ - 3}$). The peak SD is then ~7% of the mean.Figures 9 and 10 show significant steady-state variation at t = 0 and t = 2000. Transient variation is most notably shown in time series for DIP and BCO, in Figures 6, 9 and 10. Here we see disagreement in the shape of the response signal and response timescale for step changes in surface conditions. Figure 8 shows how this disagreement among physical models could even lead to conflicting estimates of the sign of mass change in an ice sheet. General agreement among the models includes that increased temperature or accumulation rate increases the densification rate; however, the large variation in the DIP and BCO has the ability to change interpretations for mass balance and paleoclimate analysis from ice core data.
(2) When models are calibrated under steady-state conditions, do they produce similar histories of change under transient conditions? (extension to transient physics); The Herron and Langway (Reference Herron and Langway1980) steady-state equation is extended to transient dynamics in different ways. A variety of empirical tuning options can be used to fit model results to measured (or assumed) steady-state profiles, including adjusting coefficients and exponents in different mathematical terms that are loosely tied to physical mechanisms. We see that these models may effectively overfit steady-state results, where they disagree in the generalization to transient cases.
(3) Do the models reliably represent reality, within and beyond their calibration range?(validation) We leave the topic of validation of models to future work. We have purposely avoided awarding a single model the title of ‘best’ since most are tuned to particular sites and in choosing any single site we would favor an arbitrary ‘best’ model. We encourage work developing physics-based models that are supported by in-situ field studies targeting formulation of constitutive relationships.


4.2. Parameter dependence and nonuniqueness
In Section 1 we discussed the difficulty of separating the influences of site accumulation rate and temperature when empirically tuning models to steady-state firn-profile data. Inferring model parameters from a dataset is an inverse problem (e.g. Aster and others, Reference Aster, Borchers and Thurber2005). When models are calibrated with incomplete data over a limited range, nonuniqueness is difficult to avoid, in that multiple combinations some model parameters can all allow output from a model to match a dataset at an acceptable tolerance level.
When transients are considered, additional confounding interactions can arise because model parameters are not independent. Additional trade-offs are possible. For example different values of thermal conductivity can produce different transient temperature profiles, but could still match transient data from depth-density profiles with a different value of the activation energy, which can stiffen or soften the firn to compensate.
As in any inverse problem, the way to reduce nonuniqueness is to incorporate additional model parameters that cause the model to respond in more specific ways to specific forcings or to specific data and to acquire additional data that can discriminate more effectively among the forcing influences. This is additional motivation for future physics-based models that can specifically incorporate more processes.
4.3. Firn models and snow models
Firn-evolution models clearly share some elements with models of seasonal-snow evolution, since both deal with densification of ice/air mixtures. There is a large literature on snow models (see Essery and others (Reference Essery, Morin, Lejeune and Ménard2013) and references therein), because they have been applied widely in global climate models. Because seasonal snow changes rapidly in response to changing weather and seasonal conditions, snow models are already necessarily strongly based on physical processes, with some empirical parameters. In an intercomparison study of snow models, Essery and others (Reference Essery, Morin, Lejeune and Ménard2013) found an unexpectedly wide variance in their responses to common forcing based on data from a site in the French Alps, and presented recommendations for reducing that variation.
Because we anticipate that future firn models will become more directly process-based, we have included the process-based Essery snow model (ESS) in the six experiments. Seasonal snow by definition lasts <12 months, is often on the order of 1 m deep, and seldom develops densities approaching the ice density, while firn profiles develop over centuries and to depths of typically 100 m. Therefore, the six FirnMICE experiments present a severe extrapolation challenge for snow models. Figure 11 shows the initial and final depth-density profiles for the Essery and others (Reference Essery, Morin, Lejeune and Ménard2013) model (ESS) and the Herron and Langway (Reference Herron and Langway1980) model (HLA). The snow model produces profiles that densify too rapidly with depth, because physical processes that inhibit densification at high densities are incomplete in or missing from snow models; these processes are not needed in the typical calibration ranges of snow models.
Snow models and firn models both compute the densification of ice/air mixtures, but are calibrated under very different conditions in which different processes can be dominant. Here we compare depth-density profiles from the Essery and others (Reference Essery, Morin, Lejeune and Ménard2013) snow model (ESS, blue) and from the Herron and Langway (Reference Herron and Langway1980) model (HLA, red) for the six firn experiments. Dashed curves are initial steady states, and solid curves are final states.

Development of process-based firn models is not as advanced as the development of snow models, and we can be confident that current firn models would do a poor job of simulating seasonal snow cover. In the future, a model that can accurately simulate ice/air mixtures over the complete spectrum of time, depth and density found in nature will need to incorporate the physics currently in snow models or even empirical fits to simplified models of those processes, while adding additional processes that become dominant at higher densities, longer times and colder temperatures.
4.4. Moving beyond the current generation of empirical firn-densification models
In reality, firn-densification rate is affected by the microstructural characteristics and processes occurring at the grain scale, including density layering, hoar, nonuniformity of grain shapes and sizes, impurity loading and crystal orientation and bonding, yet the current generation of densification models has a limited representation of these processes and most ignore microstructure. Most of the firn models included in this work are empirical, with constitutive relations based on simplified, idealized physics, tuned to fit depth-density profiles that are assumed to be in steady state. An important goal in firn research is to improve our understanding of the relevant firn physics on the scale of individual grains, with the aim of building a ‘next-generation’ densification model; however, a full model description of all the relevant physics at the microstructure level will necessarily have more free parameters than can be constrained using field observations. When simulating firn evolution on large spatial or temporal scales, these data are unavailable. In the interior of the Antarctic continent surface precipitation is transformed into ice over a period on the order of several thousand years. Observational programs on these timescales are not possible; therefore, some degree of empiricism is likely to be unavoidable for practical applications, particularly when studying firn with small densification rate or with large spatial/temporal scales.
The hope is that improved understanding of grain-scale densification physics will lead to more accurate constitutive relationships. Arthern and others (Reference Arthern, Vaughan, Rankin, Mulvaney and Thomas2010) measured in-situ densification rates in Antarctic firn and used those data to calibrate a firn model that includes grain growth and temperature seasonality. Our comparisons highlight the need for time-dependent observational constraints that move beyond temperature and density profiles that are assumed to be in steady state. Constraints on transient behavior of depth-density profiles and microstructural profiles could come from modern observations and also from ice core records of abrupt climatic variations; an example is the WAIS Divide core, where a pronounced accumulation anomaly ~12 ka BP is accompanied by a response in δ 15N, a proxy for firn thickness in the past(WAIS Divide Project Members, 2015).
Over recent decades, other strategies have been developed for dealing with model shortcomings. First, in reconstructing past Δage in Greenland ice cores, constraints are available during abrupt Dansgaard–Oeschger (D–O) climatic variations. The D–O events are recorded both in the ice phase (δ 18O of water) and in the gas phase (CH4, thermal fractionation in δ 15N of N2); comparing the two provides a direct Δage estimate that is independent of firn models (Leuenberger and others, Reference Leuenberger, Lang and Schwander1999; Rasmussen and others, Reference Rasmussen2013). Moreover, the present-day Δage can be estimated very accurately using firn air sampling experiments (Schwander and others, Reference Schwander1993; Battle and others, Reference Battle2011; Buizert and others, Reference Buizert2012). The firn model is then forced to fit the data-based constraints, thereby minimizing potential model biases.
Another approach to firn modeling involves firn model ensembles of model physics and coefficients (Buizert and others, Reference Buizert2014, Reference Buizert2015). Parrenin and others (Reference Parrenin2012) used estimates of firn-column thickness derived from δ 15N data together with an ice-flow model to reconstruct ice core Δdepth (the difference in the depths of ice and trapped air of equivalent age), rather than Δage.
The three firn models that have historically been used for Δage reconstructions are the Barnola and others (Reference Barnola, Pimienta, Raynaud and Korotkevich1991) model, the Goujon and others (Reference Goujon, Barnola and Ritz2003) model and the dynamical Herron and Langway (Reference Herron and Langway1980) model (Table 1). None of these three models include microstructure evolution, as is used in the Arthern-based models (ART, LIG, SIM). Comparison of the transient responses (Figs 9 and 10) suggests that when grain evolution is included in the model it does impact short-term model behavior. As such, an investigation of the effects of grain evolution on Δage reconstructions is warranted, particularly in Greenland where transient effects are expected to be most important given the evidence of past rapid climate changes (Severinghaus and Brook, Reference Severinghaus and Brook1999).
The application of densification models to ice-sheet altimetry (e.g. Arthern and Wingham, Reference Arthern and Wingham1998; Zwally and Li, Reference Zwally and Li2002) is a more recent development than Δage reconstruction (Barnola and others, Reference Barnola, Pimienta, Raynaud and Korotkevich1991). Notable recent developments in the application to altimetry include empirical corrections that allow the models to be used over a wider range of climatic conditions (e.g. Ligtenberg and others, Reference Ligtenberg, Helsen and van den Broeke2011) and inclusion of additional physical processes, such as meltwater percolation and refreezing (e.g. Reeh, Reference Reeh2008; Ligtenberg and others, Reference Ligtenberg, Helsen and van den Broeke2011). New experimental techniques have allowed the measurement of strain rates in the upper layers of the ice sheets (Arthern and others, Reference Arthern, Vaughan, Rankin, Mulvaney and Thomas2010; Morris and Wingham, Reference Morris and Wingham2011; Hawley and Waddington, Reference Hawley and Waddington2011). These methods provide data that can be directly related to densification rates without assuming that a firn column is in steady state, and they allow a more direct exploration of the effects of temperature on the rate of densification. For the purposes of correcting satellite altimetry on continental scales, models of firn densification are usually driven by climatic information derived from regional climate models (Ligtenberg and others, Reference Ligtenberg, Helsen and van den Broeke2011) or from remote sensing (Zwally and others, Reference Zwally2005).
Differences in the evolution of DIP are significant for mass-balance modeling from altimetry, where firn densification is the largest source of uncertainty (Shepherd and others, Reference Shepherd2012). The disagreement among the models in the sign of the immediate firn response to a climate change could cause misleading inferences of ice-sheet mass changes derived from altimetry data. In real-world applications, surface elevation change dh/dt predictions from firn models furthermore depend strongly on the quality of input data (temperature, accumulation rate), which is not investigated here. Altimetric applications of firn models have not usually explored the effect of using different models of firn densification on their results, or different forcing data, but the results of this study show that significant differences can arise depending upon the choice of model. This indicates that ensembles that bracket a range of different models, a range of different parameter choices and a range of forcing data might prove just as useful in altimetric applications as they have in studies of Δage reconstruction.
The strategies identified here for moving beyond the shortcomings of the current generation of firn-densification models (i.e. developing a next-generation physically-informed model, and increased use of model ensembles and data constraints) will have to be pursued in parallel. Developing the next-generation model requires time-dependent strain-rate observations and in the meantime important scientific questions in ice-sheet altimetry and ice core science must be addressed. We believe that the FirnMICE project both provides a motivation to increase efforts in firn-model development, as well as informs the glaciological community about the existing model shortcomings in steady-state and transient behavior.
5. CONCLUSIONS
The FirnMICE experiments consist of step changes in boundary conditions; however, this work is concerned with the variation among model output in a broader sense than any particular combination of boundary conditions or numerical implementations of governing equations. Our goal is to explore the range of results that a researcher could expect when collaborating with a range of modeler colleagues, each of whom runs a respective model at its optimum capabilities for a given problem.
Empirically-tuned models included in this study can match firn-density and strain-rate data reasonably well in the region(s) for which they were calibrated, but we have shown that the models do not agree with each other well in a steady state using the metrics of DIP, BCO depth and BCO age, which are in most cases the desired quantities for which the models were developed. The temperature sensitivities of the models are similar because there is consensus among the models that firn densification has an Arrhenius temperature dependence, and differences in activation energy have been compensated by differences in other empirical factors. The accumulation-rate sensitivities show more variance, indicating that a similar consensus on the relation between stress and strain rate has not been achieved.
The transient behavior of the models also shows variance; the general trends of change in the firn are consistent after the step changes, but the models disagree on the rates of change and the magnitudes of short-term and long-term changes. Examining the range of transient results here does not necessarily give insight into transient firn evolution: most of the models are calibrated using depth-density profiles that are assumed to be steady-state, and transients are not considered in calibration. It may not be appropriate to extend these steady-state-based models to transient evolution.
We have avoided choosing a ‘best’ firn model; the best-firn model for one particular application may be different than the best model for another application. We used the mean of the nine models as a metric to compare the models, but the mean of the set of models is unlikely to be the ‘best’ or ‘true’ solution. We used synthetic boundary conditions specifically to identify the variation among the models rather than testing which model can best match the data.
This work underscores the need to develop a ‘next-generation’ firn model that includes physically-based constitutive relationships rather than an empirical tuning to match measured firn-density profiles. As ice core and altimetry data continue to be sampled at higher temporal resolution, firn models need to improve to be able to predict past Δage and to convert surface elevation change to mass change at the accuracies demanded by those data. Strain-rate data offer the potential to constrain transient responses in densification, and concurrent measurements of firn microstructure and chemistry offer an opportunity to better understand the constitutive relationship. These data are currently sparse, but progress is being made (e.g. Arthern and others, Reference Arthern, Vaughan, Rankin, Mulvaney and Thomas2010; Freitag and others, Reference Freitag, Kipfstuhl, Laepple and Wilhelms2013; Morris and Wingham, Reference Morris and Wingham2014; Proksch and others, Reference Proksch, Löwe and Schneebeli2015) to expand these datasets and to better understand firn evolution.
ACKNOWLEDGEMENTS
We are grateful to Jeff Severinghaus and Ed Brook for inspiring the idea for this intercomparison. We acknowledge Michiel van den Broeke's leadership and contributions to IMAU firn modeling. This work was supported by National Science Foundation Partnerships in International Research and Education (PIRE) grant 0968391.
CONTRIBUTION STATEMENT
J. Lundin designed the experiment, produced model output and wrote the manuscript. C. M. Stevens wrote and edited the manuscript, processed data and produced figures. C. Buizert and A. Orsi designed the experiment, produced model output and contributed feedback to the manuscript. R. Arthern, S. Ligtenberg, S. Simonsen, R. Essery and E. Cummings produced model output and contributed feedback to the manuscript. W. Leahy processed the data and produced figures. P. Harris developed model code. M. Helsen contributed feedback to the manuscript. E. Waddington wrote and edited the manuscript.
Appendix A
PARTICIPATING MODELS
In combination with Table 1, we provide further detail about the participating firn models. Symbols representing some variables have been altered from the referenced work to allow comparison of the constitutive relationships and empirical tuning present in the densification equations.
A.1. HLA, HLS – (Herron and Langway, Reference Herron and Langway1980)
The Herron and Langway (Reference Herron and Langway1980) model is a benchmark firn-densification model and is the basis for a significant proportion of later models. The model was developed to be a ‘widely applicable model of the first and second stages of polar snow densification’ (Herron and Langway, Reference Herron and Langway1980). In the Herron and Langway model, the mathematical description of the rate of densification changes at critical densities and divides the firn into three densification zones. Herron and Langway (Reference Herron and Langway1980) derived empirical equations based on the assumption attributed to Robin (Reference Robin1958) that the change in density is proportional to the change in stress that results from new accumulation. That assumption leads to a linear relationship between the natural log of the density ratio  $\rho /(\rho _i - \rho )$ and depth z. By assuming steady state, the model parameterizes the annual increase in overburden stress using annual accumulation rate, and the densification rate is assumed to have an Arrhenius-type temperature dependence. The model was tuned using seven depth-density profiles from Greenland and ten profiles from Antarctica. We describe three ways to formulate the Herron and Langway (Reference Herron and Langway1980) model: (1) analytically, (2) dynamically and (3) stress-based. We recognize that the original Herron and Langway (Reference Herron and Langway1980) equations have inconsistencies in the formulation of the units; we do not attempt to rectify those here except in the cases where corrections are needed to make the equations work.
A.1.1. HLA – analytic model
The analytic model is a steady-state model that determines the density, depth and age relationship based on the surface density ρ 0, accumulation rate  $\dot b$ (m w.e. a–1) and temperature T.
The density at depth z is
 $$\eqalign{& \rho (z) = \rho _i\displaystyle{{\displaystyle{{\rho _0} \over {\rho _i - \rho _0}}\exp \left( {\displaystyle{{\rho _i} \over {\rho _{\rm w}}}k_0z} \right)} \over {1 + \displaystyle{{\rho _0} \over {\rho _i - \rho _0}}\exp \left( {\displaystyle{{\rho _i} \over {\rho _{\rm w}}}k_0z} \right)}}, \cr & \quad \quad \quad \rho \le 550\,{\rm kg}\,{\rm m}^{ - 3}} $$
and
 $$\eqalign{& \rho (z) = \rho _i\displaystyle{{\displaystyle{{\rho _{550}} \over {\rho _i - \rho _{550}}}\exp \left[ {\displaystyle{{\rho _i} \over {\rho _{\rm w}}}\displaystyle{{k_1} \over {\dot b_{\rm w}^b}} (z - z_{550})} \right]} \over {1 + \displaystyle{{\rho _{550}} \over {\rho _i - \rho _{550}}}\exp \left[ {\displaystyle{{\rho _i} \over {\rho _{\rm w}}}\displaystyle{{k_1} \over {\dot b_{\rm w}^b}} (z - z_{550})} \right]}}, \cr & \quad \quad \quad \rho \gt 550\,{\rm kg}\,{\rm m}^{ - 3}.} $$
We have added the 1/ρ w factor in the exponential terms for unit consistency. The analytic age of the firn is given by
 $$Age(\rho ) = \displaystyle{1 \over {k_0\dot b_{\rm w}^{\rm a}}} \ln \left[ {\displaystyle{{\rho _i - \rho _0} \over {\rho _i - \rho}}} \right],\quad \quad \rho \le 550\,{\rm kg}\,{\rm m}^{ - 3}$$
and
 $$\eqalign{& Age(\rho ) = \displaystyle{1 \over {k_1\dot b_{\rm w}^{\rm b}}} \ln \left[ {\displaystyle{{\rho _i - \rho _{550}} \over {\rho _i - \rho}}} \right] + Age(550), \cr & \quad \quad \quad \rho \gt 550\,{\rm kg}\,{\rm m}^{ - 3}.} $$
The powers a and b are site-specific constants determined from the slope of the line formed by  $\ln (\rho /(\rho _i - \rho )$ plotted as a function of $\dot b_w$. The mean and SD of a and b are respectively, 1.1 ± 0.2 and 0.5 ± 0.2. Based on that result, Herron and Langway set a = 1 and b = 0.5. The coefficients k 0 (units m–1) and k 1 (units m–1/2 a–1/2) in the Herron and Langway model incorporate an Arrhenius rate law including temperature T in Kelvin and the gas constant R, 8.314 J mol–1 K–1 and are given by:
 $$k_0 = 11\;\exp \left[ { - \displaystyle{{10160} \over {RT}}} \right]$$
 $$k_1 = 575\;\exp \left[ { - \displaystyle{{21400} \over {RT}}} \right],$$
where 10 160 and 21 400 are the effective activation energies for the two zones (units J mol–1).
A.1.2. Dynamic model
The dynamic Herron and Langway (Reference Herron and Langway1980) model assumes the rate of densification changes at critical densities. Results from the dynamical model are not included in the FirnMICE project; however, the equations are included here since multiple future models build on these physics.
 $$\displaystyle{{D\rho} \over {Dt}} = c_0(\rho _i - \rho )\quad \quad \rho \le 550\;{\rm kg}\,{\rm m}^{ - 3}$$
 $$\displaystyle{{D\rho} \over {Dt}} = c_1(\rho _i - \rho )\quad \quad \rho \gt 550\;{\rm kg}\,{\rm m}^{ - 3}$$
with
 $$c_0 = \dot b_{\rm w}^{\rm a} k_0$$
 $$c_1 = \dot b_{\rm w}^{\rm b} k_1$$
where a = 1 and b = 1/2.
A.1.3. HLS – stress-based model
The Herron and Langway (Reference Herron and Langway1980) model includes a suggested modification from reviewer Sigfus J. Johnsen, incorporating a substitution for the overburden stress σ for the second densification zone:
 $$\eqalign{& \displaystyle{{D\rho} \over {Dt}} = \displaystyle{{k_1^2} \over {\rho _{\rm w}{\kern 1pt} g}}\displaystyle{{(\sigma _\rho - \sigma _{550})(\rho _i - \rho )} \over {ln[(\rho _i - 550)/(\rho _i - \rho )]}} \cr & \quad \quad \quad \rho \gt 550\;{\rm kg}\,{\rm m}^{ - 3}.} $$
A value of 42.6 kJ mol–1 was recommended for the activation energy in Eqn (A6). We note the omission of the factor  $\rho _{\rm w}{\kern 1pt} g$ in the denominator of Eqn (4c) of Herron and Langway (Reference Herron and Langway1980), and a typo in which ρ was represented by p on the left side of the equation.
A.2. ART – Arthern and others (Reference Arthern, Vaughan, Rankin, Mulvaney and Thomas2010)
The Arthern and others (Reference Arthern, Vaughan, Rankin, Mulvaney and Thomas2010) model was originally developed for ice-sheet mass balance, but could also be applied to ice core Δage. The model used in FirnMICE is the coupled densification, heat-transfer and grain-growth model described in Appendix B of Arthern and others (Reference Arthern, Vaughan, Rankin, Mulvaney and Thomas2010). The dependence of the densification rate on temperature, snow load, density and grain-size is derived from a sintering theory. This theory applies to sintering by lattice diffusion creep, a grain-size dependent process. The grain-size profile is evolved dynamically by solving an equation for normal grain growth. Temperature is evolved by solving the heat equation; it influences both creep rates and grain growth.
The coupled densification, grain growth and heat-transfer system of equations (Arthern and others, Reference Arthern, Vaughan, Rankin, Mulvaney and Thomas2010, Equns (B1) and (B2)) includes densification by Nabarro-Herring creep incorporating the grain-size radius r,
 $$\displaystyle{{D\rho} \over {Dt}} = k_{\rm c}(\rho _i - \rho )\exp \left[ { - \displaystyle{{E_c} \over {RT}}} \right]\displaystyle{\sigma \over {r^2}},$$
using a grain-growth model dependent on the temperature (Gow and others, Reference Gow, Meese and Bialas2004),
 $$\displaystyle{{D(r^2)} \over {Dt}} = k_{\rm g}\exp \left[ { - \displaystyle{{E_{\rm g}} \over {RT}}} \right].$$
The model has two adjustable parameters k c1 and k c2 which are the coefficients for lattice-diffusion creep applied to low and high density snow respectively; values for these were selected to give the best agreement with strain-rates measured in boreholes on the Antarctic Peninsula and Berkner Island. The coefficient k g for grain growth is 1.3 × 10⁻⁷ m2 s–1. The model has not been tuned to match any density-depth profiles from ice-cores. Even for simple step changes in climate forcing, the interactions between grain growth, heat conduction, firn advection, and compaction can give a complicated response.
Arthern and others (Reference Arthern, Vaughan, Rankin, Mulvaney and Thomas2010) also used a steady-accumulation assumption to formulate a simplified version of their model. The Nabarro-Herring creep and grain-growth physics were coupled to find rate coefficients c 0 and c 1 for the firn-densification Eqns (A7) and (A8):
 $$c_0^{(ART)} = 0.07\;\dot bg\;\exp \left[ { - \displaystyle{{E_c} \over {RT}} + \displaystyle{{E_{\rm g}} \over {RT_{av}}}} \right],$$
and
 $$c_1^{(ART)} = 0.03\;\dot bg\;\exp \left[ { - \displaystyle{{E_c} \over {RT}} + \displaystyle{{E_{\rm g}} \over {RT_{av}}}} \right].$$
The activation energies for creep E c and grain-growth E g are 60 kJ mol–1 and 42.4 kJ mol–1. Here  $\dot b$ has units of kg m–2 a–1 and the leading numerical coefficients have units of Pa–1.
A.3. ESS – Essery and others (Reference Essery, Morin, Lejeune and Ménard2013)
The Essery and others (Reference Essery, Morin, Lejeune and Ménard2013) model determines the seasonal snow-model surface boundary condition for atmospheric modeling and is therefore expected to be an outlier among the participating models, due to model tuning for mountain snow packs outside of polar regions. The densification equation,
 $$\displaystyle{{D\rho} \over {Dt}} = \rho \displaystyle{\sigma \over {\nu _0}}\exp \left[ {\displaystyle{{k_{\rm T}} \over {T_{\rm m}}} - \displaystyle{{k_{\rm T}} \over T} - \displaystyle{\rho \over {\rho _0}}} \right],$$
has no limitation of compaction beyond firn densities and differs in the exponential temperature dependence. The terms include viscosity ν 0 (kg m–1 s–1), reference density ρ 0, temperature scale k T (K); and melting point T m (K). The model is tuned to datasets, as described in Kojima (Reference Kojima1967).
A.4. GOU – Goujon and others (Reference Goujon, Barnola and Ritz2003)
The densification scheme of Goujon and others (Reference Goujon, Barnola and Ritz2003) builds upon metallurgy material science (Arnaud and others, Reference Arnaud, Barnola and Duval2000). The first stage of densification  $(\rho /\rho _i \lt 0.6)$ is based on (Alley, Reference Alley1987),
 $$\displaystyle{{D(\rho /\rho _i)} \over {Dt}} = \gamma \displaystyle{\sigma \over {{(\rho /\rho _i)}^2}}(1 - \displaystyle{5 \over 3}\rho /\rho _i),$$
where γ is a function of grain-boundary viscosity and geometrical parameters, with units of inverse viscosity.
For 0.6 < ρ/ρ i < 0s.9 (Zone 2), the densification equation is,
 $$\displaystyle{{D(\rho /\rho _i)} \over {Dt}} = 5.3A\left( {{\left( {\rho /\rho _i} \right)}^2D_0} \right)^{1/3}\left( {\displaystyle{a \over \pi}} \right)^{1/2}\displaystyle{{\sigma ^{^\ast}} \over 3}^3.$$
Fluidity A is given by
 $$A = 7.89 \times 10^3{\rm exp}\left[ { - \displaystyle{E \over {RT}}} \right]\quad \quad {\rm MP}{\rm a}^{ - 3}\;{\rm s}^{ - 1}$$
The activation energy is E = 60 kJ mol–1. The densification includes an empirical coefficient D 0,
 $$D_0 = 0.0026 \times T_s{(^\circ} C) + 0.647,$$
which is the relative density at the transition from Zone 1 to Zone 2. In the second zone, the overburden stress σ due to the firn column above is all carried on limited contact areas between grains, and the effective pressure σ* on those grain contacts depends on the coordination number Z and on the average contact area a which is expressed as a dimensionless ratio relative to the contact area at the Zone 1–2 transition.
 $$\sigma ^{^\ast} = \displaystyle{{4\pi \sigma} \over {aZ(\rho /\rho _i)}}.$$
For 0.9 < ρ/ρ i > 0.95 the densification equation is
 $$\displaystyle{{D(\rho /\rho _i)} \over {Dt}} = 2A\left[ {\displaystyle{{\rho /\rho _i(1 - \rho /\rho _i)} \over {{(1 - {(1 - \rho /\rho _i)}^{1/3})}^3}}} \right]\left( {\displaystyle{{2\sigma _{eff}} \over 3}} \right)^3.$$
The effective pressure is
 $$\sigma _{eff} = \sigma + \sigma _{atm} - \sigma _b.$$
For ρ/ρ i > 0.95 the densification equation is:
 $$\displaystyle{{D(\rho /\rho _i)} \over {Dt}} = \displaystyle{9 \over 4}A(1 - \rho /\rho _i)\sigma _{eff}.$$
where  $A = 1.2 \times 10^3\exp ( - E/RT)$ (MPa–1 s–1).
A.5. LIG – Ligtenberg and others (Reference Ligtenberg, Helsen and van den Broeke2011)
The Ligtenberg and others (Reference Ligtenberg, Helsen and van den Broeke2011) model is based on the principles of Herron and Langway (Reference Herron and Langway1980) and is updated with the densification expressions of Arthern and others (Reference Arthern, Vaughan, Rankin, Mulvaney and Thomas2010). These densification equations are validated and tuned towards depth-density observations from Van den Broeke (Reference Van den Broeke2008). To make the model applicable on the complete ice sheet, snowmelt processes (retention, percolation, refreezing and run off) are included, although these are not used within FirnMICE. The main focus of the model is on ice-sheet mass balance and surface elevation changes.
Ligtenberg and others (Reference Ligtenberg, Helsen and van den Broeke2011) tuned the steady-accumulation derivation of (Arthern and others, Reference Arthern, Vaughan, Rankin, Mulvaney and Thomas2010, Eqns (A14) and (A15) in this work) model, using the mean-surface temperature  $\bar T_{\rm s}$ and the same coefficients $c_0^{(ART)} $ and $c_1^{(ART)} $ for the low and high density firn:
 $$c_0^{(LIG)} = M_0c_0^{(ART)}, $$
 $$c_1^{(LIG)} = M_1c_1^{(ART)}, $$
The coefficients M tune the model for the low and high density firn to match depth-density profiles in Greenland and Antarctica,
 $$M_0 = 1.435 - 0.151\ln (\dot b)\quad \quad \rho \lt 550\,{\rm kg}\,{\rm m}^{ - 3},$$
 $$M_1 = 2.366 - 0.293\ln (\dot b)\quad \quad \rho \gt 550\,{\rm kg}\,{\rm m}^{ - 3}.$$
Eqns (A25) and (A26) are substituted into Eqns (A7) and (A8) respectively to construct the firn-densification model.
A.6. CMG – Cummings and others (Reference Cummings, Johnson and Brinkerhoff2013)
The Cummings and others (Reference Cummings, Johnson and Brinkerhoff2013) model was developed to simulate creation of ice lenses and the water transport in the ablation zones of ice sheets for ice-sheet mass-balance applications. The model for the internal energy θ = c iT from the diffusion-advection equation is
 $$\rho \left( {\displaystyle{{\partial \theta} \over {\partial t}} + w\displaystyle{{\partial \theta} \over {\partial z}}} \right) = \displaystyle{\partial \over {\partial z}}\left( {\displaystyle{k \over c}\displaystyle{{\partial \theta} \over {\partial z}}} \right),$$
where density ρ, thermal conductivity k, and heat capacity c vary in the presence of water and temperature. For the applications here, only cold firn is modeled and the thermal parameters reduce to those used by Arthern and others (Reference Arthern, Vaughan, Rankin, Mulvaney and Thomas2010),
 $$k = 2.1\left( {\displaystyle{\rho \over {\rho _i}}} \right)^2,\quad c = 2009.$$
The surface temperature evolves based on the equation
 $$T_{\rm S} = T_{avg} + 10(\cos (2\pi t) + 0.3\cos (4\pi t)).$$
The firn compaction velocity w is derived from Zwally and Li (Reference Zwally and Li2002, Eqn (3)),
 $$w(z,t) = \int_{z_i}^z \displaystyle{1 \over {\rho (z)}}\displaystyle{{d\rho (z)} \over {dt}}dz,$$
where z i is the depth where the firn transitions into ice.
A.7. BAR – Barnola and others (Reference Barnola, Pimienta, Raynaud and Korotkevich1991)
The Barnola and others (Reference Barnola, Pimienta, Raynaud and Korotkevich1991) model was designed to calculate the ice core Δage. For the first zone of densification, the Herron and Langway (Reference Herron and Langway1980) dynamic model is used. For ρ > 550 kg m−3, the densification model is
 $$\displaystyle{{D\rho} \over {Dt}} = \rho _iA_0{\kern 1pt} \exp \left[ { - \displaystyle{Q \over {RT}}} \right]f\sigma _{eff}^n, $$
where A 0 is a constant, activation energy Q is 60 kJ mol–1 and the empirical function f is written as f e for  $\rho = 550 - 800\,{\kern 1pt} {\rm kg}\,{\rm m}^{ - 3}$ and f s for $\rho \gt 800\,{\kern 1pt} {\rm kg}\,{\kern 1pt} {\rm m}^{ - 3}$$
 $$f_{\rm e} = 10^{\alpha \rho ^3 + \beta \rho ^2 + \delta \rho + \gamma },$$
with α, β, δ and γ equal to −37.455, 99.743, −95.027 and 30.673. For ρ > 800 kg m−3,
 $$f_{\rm s} = \displaystyle{3 \over {16}}\displaystyle{{(1 - \rho /\rho _i)} \over {{[1 - {(1 - \rho /\rho _i)}^{1/3}]}^3}}.$$
A.8. SIM – Simonsen and others (Reference Simonsen2013)
The Simonsen and others (Reference Simonsen2013) model was built on the empirical description of firn densification by Herron and Langway (Reference Herron and Langway1980) and the parameter updates of Arthern and others (Reference Arthern, Vaughan, Rankin, Mulvaney and Thomas2010). Further tuning of the model has been done to assimilate Greenland conditions, including the Flade Isblink and NGRIP ice cores and radar profiles of the EGIG-line (Simonsen and others, Reference Simonsen2013). The model was developed for ice-sheet mass-balance studies and the model tuning has focused on the upper firn, but the model has been shown to be capable of giving a full description of the firn pack until the firn/ice transition. The model is aimed at giving an ice sheet wide description of changes in firn compaction over short time periods (<100 years at sub-annual resolution). The modular model framework allows for modules to be turned on/off or replaced, including a modular description of 1-D percolation of meltwater; however, this process is not used for the FirnMICE experiments. The full model system (densification, heat transfer and percolation) is computationally efficient, which enables parameter studies by Monte Carlo inversion.
The Arthern and others (Reference Arthern, Vaughan, Rankin, Mulvaney and Thomas2010) coefficients  $c_0^{(ART)} $ and $c_1^{(ART)} $ (Eqns (A14) and (A15) in this work) are additionally tuned by scalars f 0 and f 1
 $$c_0^{(SIM)} = f_0\;c_0^{(ART)}, $$
 $$c_1^{(SIM)} = f_1\;\displaystyle{{61.7} \over {{\dot b}^{0.5}}}\;\exp \left[ { - \displaystyle{{3800} \over {RT_{\rm a}}}} \right]\;c_1^{(ART)}. $$
Equation (A37) includes a modification of the accumulation rate and Arrhenius temperature dependence. To formulate a densification model,  $c_0^{(SIM)} $ and $c_1^{(SIM)} $ are substituted in Eqns (A7) and (A8).
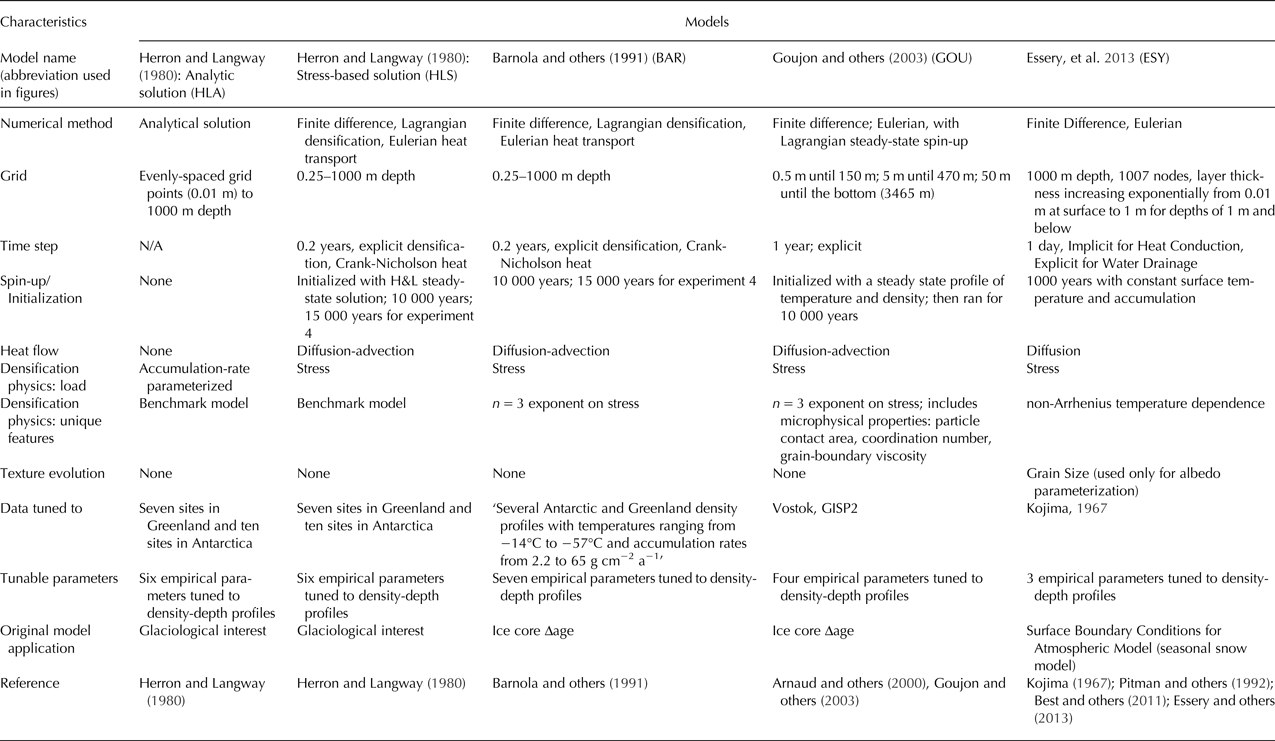
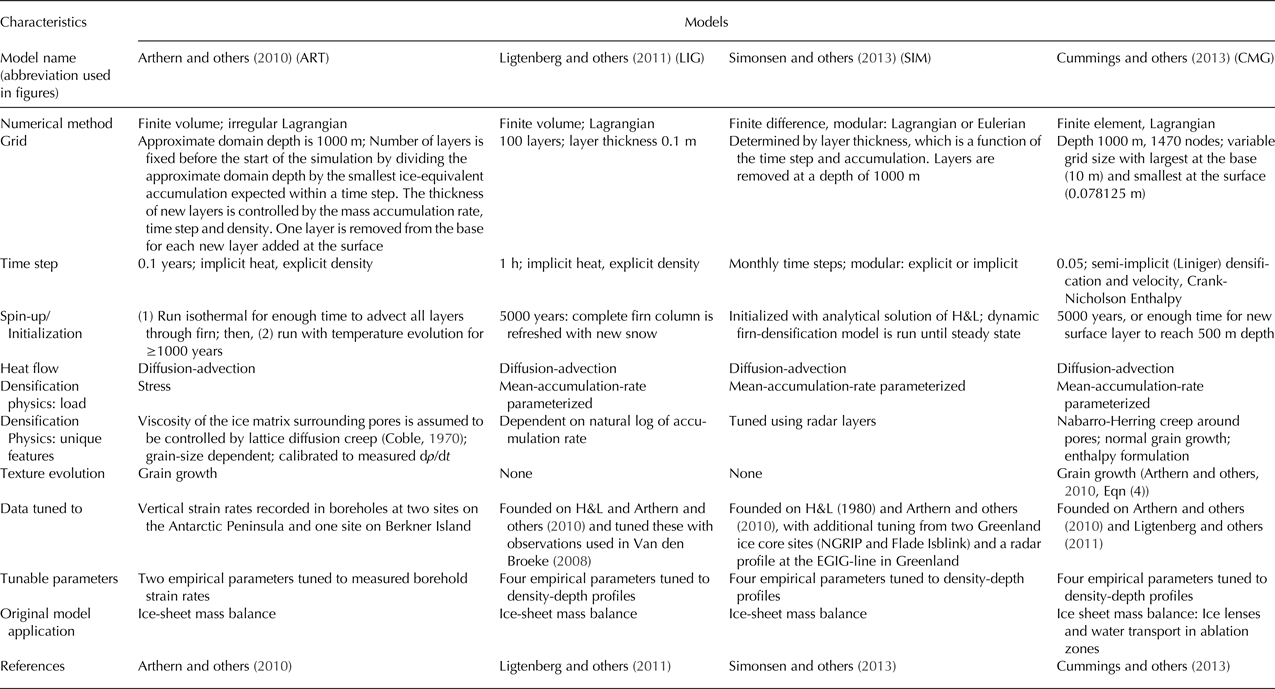
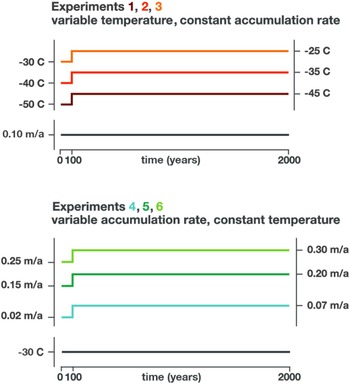
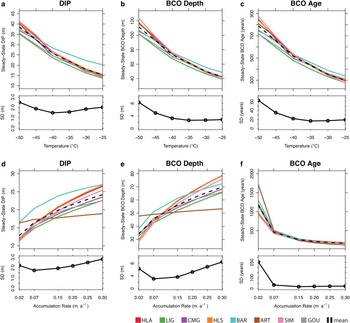
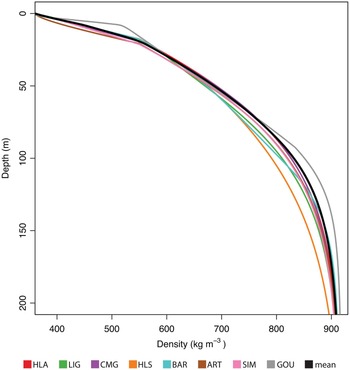
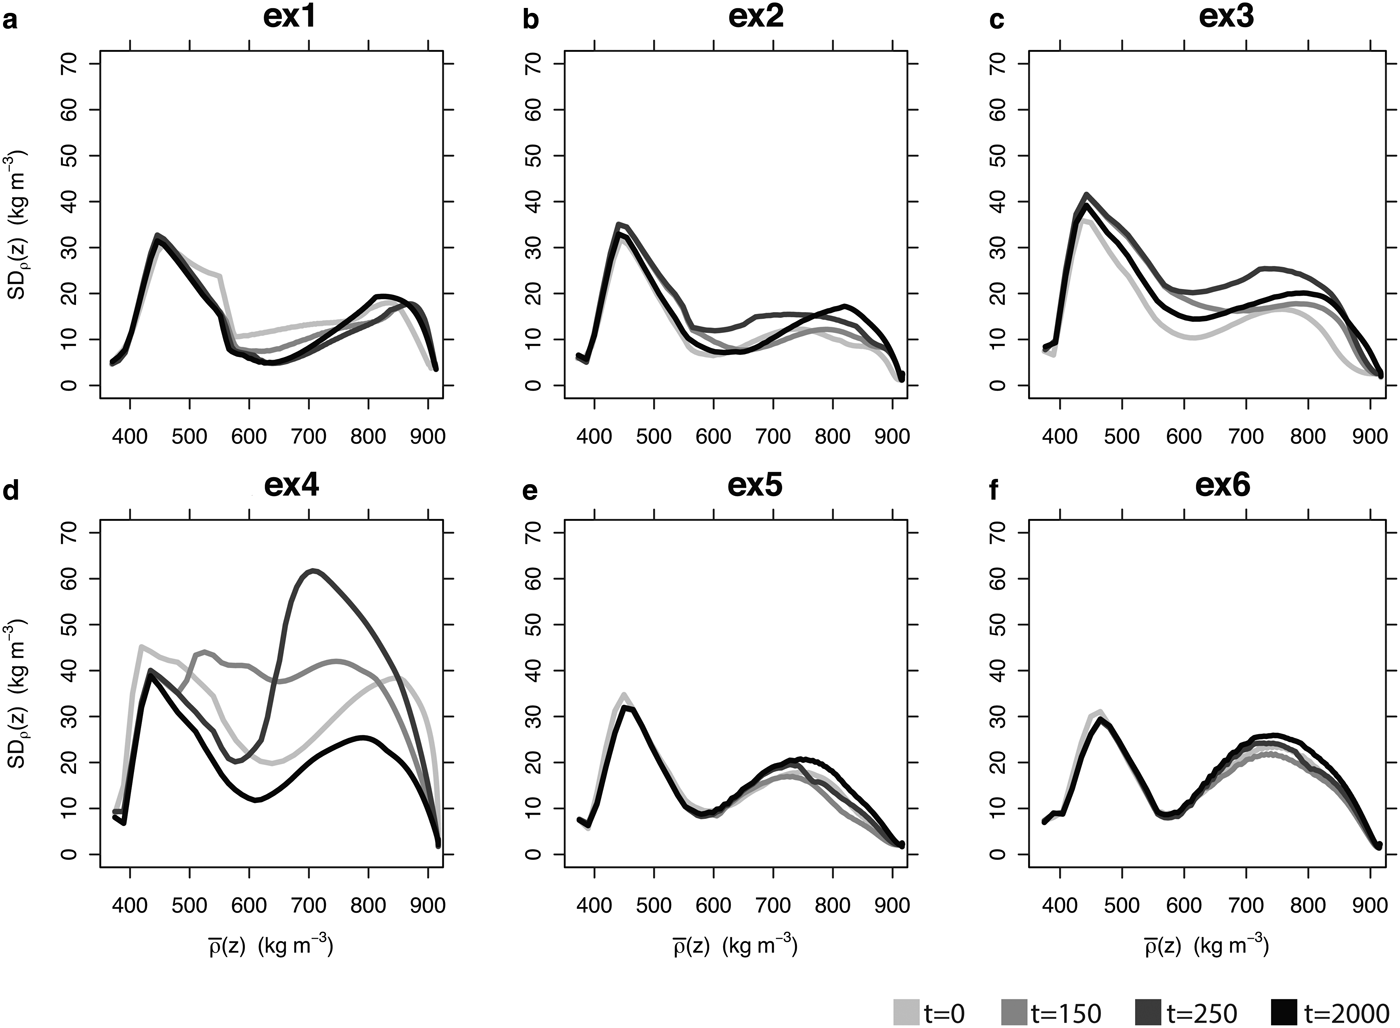
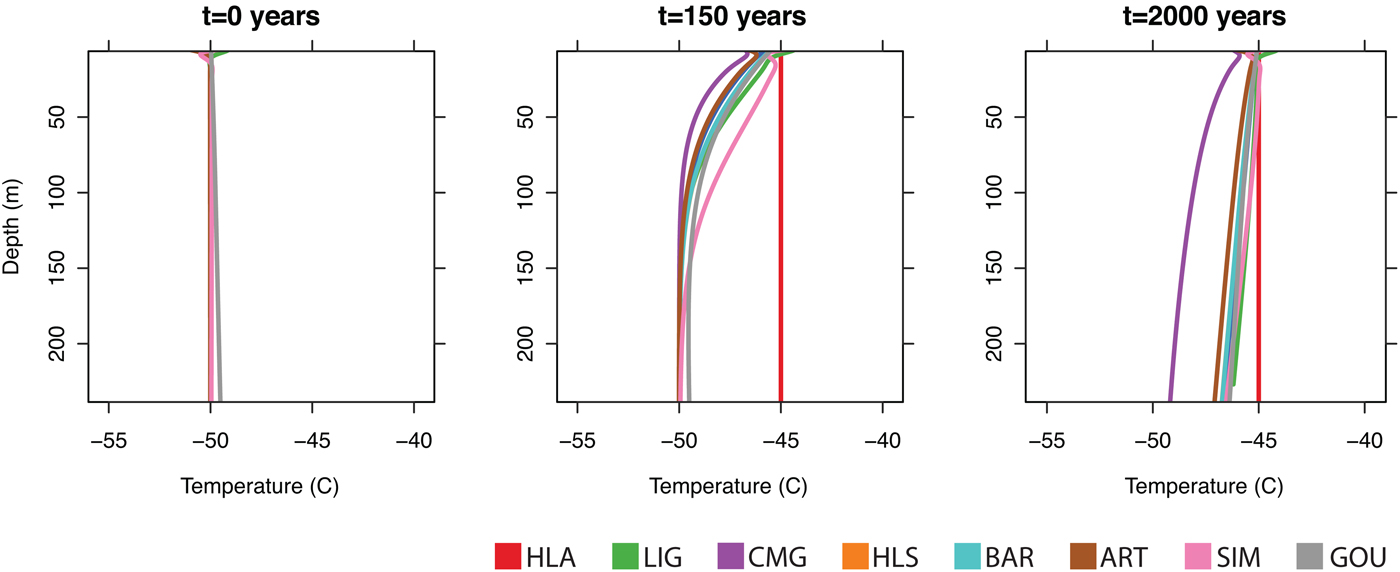
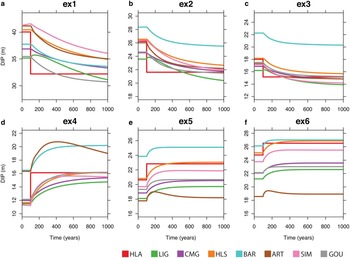
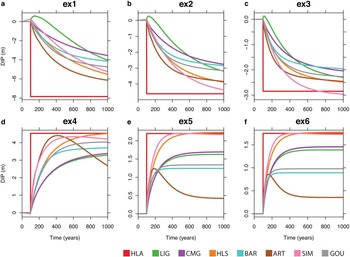
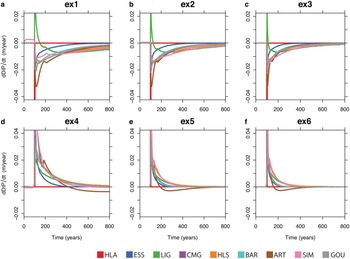
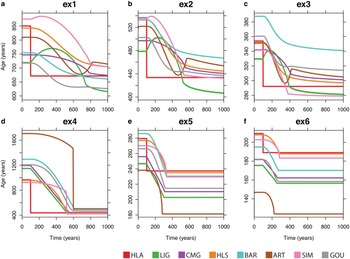
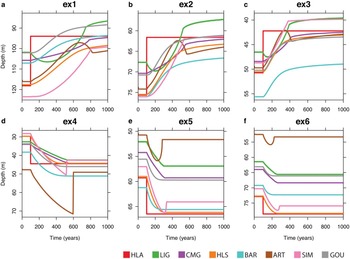
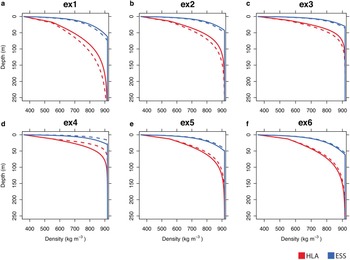

 Open access

