


Introduction
The increasing rates of depression among adolescents represent a significant global mental health concern (Avenevoli, Swendsen, He, Burstein, & Merikangas, Reference Avenevoli, Swendsen, He, Burstein and Merikangas2015; Mojtabai, Olfson, & Han, Reference Mojtabai, Olfson and Han2016). The onset of depression during this critical developmental period adversely affects functioning across multiple domains, including increased risk of academic failure, truancy, family conflict, substance abuse, and the persistence and recurrence of depression into adulthood (Kessler, Avenevoli, & Merikangas, Reference Kessler, Avenevoli and Merikangas2001). Cognitive control refers to a set of processes that enable the flexible adaptation of thought and behavior in accordance with current goals (Miller & Cohen, Reference Miller and Cohen2001). Impaired cognitive control has been observed in adolescents with Major Depressive Disorder (MDD) (Cataldo, Nobile, Lorusso, Battaglia, & Molteni, Reference Cataldo, Nobile, Lorusso, Battaglia and Molteni2005; Peterson et al., Reference Peterson, Snyder, Neilson, Rosenberg, Hough, Sandman, Ohanian, Garcia, Kotz, Finegan, Ryan, Gyimah, Sileo, Miklowitz, Friedman and Kaiser2022; Romer & Pizzagalli, Reference Romer and Pizzagalli2021; Vijayakumar et al., Reference Vijayakumar, Whittle, Yücel, Byrne, Schwartz, Simmons and Allen2015; Wilkinson & Goodyer, Reference Wilkinson and Goodyer2006). While deficits in cognitive control are central to understanding and treating depression (Beloe & Derakshan, Reference Beloe and Derakshan2019; De Voogd, Wiers, Zwitser, & Salemink, Reference De Voogd, Wiers, Zwitser and Salemink2016), existing research has primarily focused on charting these deficits, with limited attention to their underlying mechanisms. To address this gap, the present study draws on motivational theories of cognitive control to examine how reward modulates cognitive control processes in adolescents with depression.
Building on this framework, the Expected Value of Control (EVC) theory offers a mechanistic perspective, suggesting that such deficits in depression may stem from altered expectations about the value of exerting control (Grahek, Shenhav, Musslick, Krebs, & Koster, Reference Grahek, Shenhav, Musslick, Krebs and Koster2019). This model conceptualizes cognitive control as a decision-making process involving the allocation of control, a process influenced by motivational factors, with reward playing a critical role (Shenhav, Botvinick, & Cohen, Reference Shenhav, Botvinick and Cohen2013). When deciding whether to exert cognitive control, individuals weigh the anticipated reward against the effort cost required to obtain it, thereby forming an evaluation of the expected value of control (Frömer, Lin, Wolf, Inzlicht, & Shenhav, Reference Frömer, Lin, Wolf, Inzlicht and Shenhav2021). Individuals tend to allocate cognitive control resources when the anticipated payoff outweighs the cost; otherwise, such allocation is less likely (Shenhav, Fahey, & Grahek, Reference Shenhav, Fahey and Grahek2021). Previous studies have consistently found that depressed adolescents exhibit decreased reward-related brain responses during both the anticipation and feedback phases (Auerbach et al., Reference Auerbach, Pagliaccio, Hubbard, Frosch, Kremens, Cosby, Jones, Siless, Lo, Henin, Hofmann, Gabrieli, Yendiki, Whitfield-Gabrieli and Pizzagalli2021; Forbes et al., Reference Forbes, Hariri, Martin, Silk, Moyles, Fisher, Brown, Ryan, Birmaher, Axelson and Dahl2008; Rzepa, Fisk, & McCabe, Reference Rzepa, Fisk and McCabe2017; Sharp et al., Reference Sharp, Kim, Herman, Pane, Reuter and Strathearn2014; Stringaris et al., Reference Stringaris, Belil, Artiges, Lemaitre, Gollier-Briant, Wolke, Vulser, Miranda, Penttilä, Struve, Fadai, Kappel, Grimmer, Goodman, Poustka, Conrod, Cattrell, Banaschewski, Bokde and Paillère-Martinot2015; Webb et al., Reference Webb, Auerbach, Bondy, Stanton, Foti and Pizzagalli2016), potentially reflecting reduced motivation to seek rewards or greater difficulty in experiencing pleasure during reward processing (Kujawa & Burkhouse, Reference Kujawa and Burkhouse2016). Consequently, depressed adolescents may underestimate anticipated rewards and overestimate the effort costs associated with exerting control, resulting in diminished expectations about the expected value of control. The reduced EVC decreases the likelihood of allocating cognitive control, thereby impairing task performance. Recent empirical evidence has provided initial validation for the EVC framework. For example, Toobaei, Taghavi, Goodarzi, Sarafraz, and Jobson (Reference Toobaei, Taghavi, Goodarzi, Sarafraz and Jobson2023) reported significantly reduced EVC in individuals with MDD. A subsequent study demonstrated that depressed adults exhibited lower accuracy under high-reward conditions relative to both healthy controls and their own performance in low-reward contexts, suggesting a reduced EVC and impairments in reward-modulated cognitive control (Toobaei, Taghavi, & Jobson, Reference Toobaei, Taghavi and Jobson2025). However, these findings have been limited to adult samples. Whether such deficits manifest during adolescence remains insufficiently explored, making it crucial to clarify their developmental onset for extending the theoretical relevance of the EVC framework to adolescents.
Adolescence represents a critical developmental period characterized by the rapid maturation of both the reward system and the prefrontal cognitive control system (Casey, Jones, & Hare, Reference Casey, Jones and Hare2008; Somerville & Casey, Reference Somerville and Casey2010). Prior research has emphasized that achieving a functional balance between these systems constitutes a central developmental task during this stage (Ernst & Fudge, Reference Ernst and Fudge2008). However, aberrant development or dysregulation within either system has been implicated in the pathogenesis of depression (Davey, Yücel, & Allen, Reference Davey, Yücel and Allen2007). This vulnerability is hypothesized to be particularly pronounced during adolescence and may be characterized by two core features: reduced neural responsiveness to rewards and impaired engagement of the prefrontal cortex during cognitive control tasks (Forbes & Dahl, Reference Forbes and Dahl2011). Empirical studies have shown that adolescents with depression exhibit diminished enhancement of cognitive control under reward conditions (Hardin, Schroth, Pine, & Ernst, Reference Hardin, Schroth, Pine and Ernst2007; Jazbec, McClure, Hardin, Pine, & Ernst, Reference Jazbec, McClure, Hardin, Pine and Ernst2005) and are less likely to select high-reward options compared to their non-depressed counterparts (Forbes, Shaw, & Dahl, Reference Forbes, Shaw and Dahl2006). However, these studies have primarily conceptualized the impairment as a reduced capacity to exert control, rather than viewing cognitive control as a decision-making process, as posited by the EVC framework. Consequently, existing research has predominantly relied on behavioral measures such as accuracy and response times, which may not fully capture the motivational dynamics involved in control allocation.
The Drift-Diffusion Model (DDM), with over 45 years of application (Ratcliff, Reference Ratcliff1978), is a well-established tool for investigating mechanisms of reward processing and cognitive control (Ballard, Waskom, Nix, & D’Esposito, Reference Ballard, Waskom, Nix and D’Esposito2024; Dillon et al., Reference Dillon, Belleau, Origlio, McKee, Jahan, Meyer, Souther, Brunner, Kuhn, Ang, Cusin, Fava and Pizzagalli2024; Lam et al., Reference Lam, Borduqui, Hallak, Roque, Anticevic, Krystal, Wang and Murray2021; Liu et al., Reference Liu, Cheng, Hu, Wang, Hu, Zhu, Zhuang, Mei, Li, Zhou, Zhang, Tang and Zhou2022). By modeling full response times (RT) distributions for both correct and incorrect responses, the DDM enables a more nuanced analysis of decision-making and captures trial-level variability. Prior research has demonstrated that the DDM can reveal cognitive deficits often overlooked by traditional analyses of mean RT and accuracy (Pe, Vandekerckhove, & Kuppens, Reference Pe, Vandekerckhove and Kuppens2013; White, Ratcliff, Vasey, & McKoon, Reference White, Ratcliff, Vasey and McKoon2010). Reward-related cognitive control reflects a dynamic, evidence-based decision-making process in which individuals adapt response strategies based on task demands and anticipated outcomes. Following the development of the EVC framework, researchers have increasingly recognized the potential value of integrating EVC with the DDM, as both frameworks conceptualize control allocation as a computational decision-making process (Grahek, Musslick, & Shenhav, Reference Grahek, Musslick and Shenhav2020; Musslick, Shenhav, Botvinick, & Cohen, Reference Musslick, Shenhav, Botvinick and Cohen2015). The DDM captures this process by decomposing observable behavior into four key parameters: drift rate, decision threshold, starting bias, and non-decision time. Empirical studies have linked greater depressive symptom severity with reduced drift rate (Pitliya, Nelson, Hajcak, & Jin, Reference Pitliya, Nelson, Hajcak and Jin2022), elevated decision thresholds (Lawlor et al., Reference Lawlor, Webb, Wiecki, Frank, Trivedi, Pizzagalli and Dillon2019; Shen et al., Reference Shen, Hu, Lv, Yi, Gong and Yan2024; Vaghi et al., Reference Vaghi, Hagen, Jones, Mumford, Bissett and Poldrack2022), and altered starting biases (Pitliya et al., Reference Pitliya, Nelson, Hajcak and Jin2022), suggesting the utility of the DDM in elucidating the cognitive mechanisms underlying depressive symptomatology within the context of reward.
This study combines the AX version of the Continuous Performance Test (AX-CPT) with functional Near-Infrared Spectroscopy (fNIRS) to investigate how reward conditions influence cognitive control processes in adolescents with MDD. The lateral prefrontal cortex (LPFC) has been implicated in implementing control signals to support task performance (Dixon & Christoff, Reference Dixon and Christoff2012; Jimura, Locke, & Braver, Reference Jimura, Locke and Braver2010; Ott & Nieder, Reference Ott and Nieder2019). Specifically, it adjusts the intensity of these signals based on cost–benefit evaluations, facilitating the adaptive regulation of cognitive control (Shenhav, Cohen, & Botvinick, Reference Shenhav, Cohen and Botvinick2016). Both the dorsolateral (DLPFC) and ventrolateral prefrontal cortex (VLPFC) have been empirically implicated in implementing reward-enhanced control processes (Kennerley & Wallis, Reference Kennerley and Wallis2009; Savine & Braver, Reference Savine and Braver2010). The AX-CPT paradigm allows for the differentiation between proactive and reactive control. Proactive control involves the sustained maintenance of goal-relevant information in anticipation of future demands, whereas reactive control entails resolving interference as it arises during task execution (Braver, Reference Braver2012). Sustained activation in the DLPFC is associated with proactive control (Braver, Reference Braver2012; Braver, Paxton, Locke, & Deanna, Reference Braver, Paxton, Locke and Deanna2009), while the VLPFC supports preparatory processes underlying reactive response inhibition and contributes to flexible cognitive adjustments. Findings regarding DLPFC and VLPFC activation in depressed adolescents during cognitive control tasks have been inconsistent. While some studies report reduced DLPFC activation (Colich, Foland-Ross, Eggleston, Singh, & Gotlib, Reference Colich, Foland-Ross, Eggleston, Singh and Gotlib2015; Halari et al., Reference Halari, Simic, Pariante, Papadopoulos, Cleare, Brammer, Fombonne and Rubia2009), a meta-analysis focusing on adolescent depression found increased activation in both the DLPFC and VLPFC (Miller, Hamilton, Sacchet, & Gotlib, Reference Miller, Hamilton, Sacchet and Gotlib2015). Notably, these tasks did not involve reward contexts. Therefore, it remains unclear how adolescents with MDD modulate prefrontal activation during reward-related cognitive control. It is plausible that reward-related flexibility within these prefrontal regions are compromised, reflecting a reduced capacity to adapt cognitive control based on reward. This possibility provides additional neural evidence in support of the EVC theory.
Building on previous findings, we formulated the following hypotheses. Firstly, we anticipated that adolescents with MDD would exhibit poorer behavioral performance compared to healthy controls (HC) in both reward and non-reward conditions. Second, we hypothesized that differences between the MDD and HC groups would be more pronounced in the reward condition due to aberrant reward processing and reduced EVC in MDD patients. Additionally, we hypothesized that the MDD group would exhibit slower drift rates, wider decision thresholds, and less biased starting points toward accuracy under reward conditions. Lastly, given the mixed evidence regarding DLPFC and VLPFC activation during cognitive tasks in adolescents with MDD, we postulated that adolescents with MDD would show less flexible modulation of prefrontal activation in response to reward-based cognitive demands, without specifying the direction of activation differences.
Methods
Participants
Participant recruitment was guided by a power analysis conducted using G*Power 3.1.9, which determined that a sample size of 56 would be adequate to achieve a power level (1 − β) of 0.95, based on anticipated effect sizes from a previous study on rewarded cognitive control (Chaillou, Giersch, Hoonakker, Capa, & Bonnefond, Reference Chaillou, Giersch, Hoonakker, Capa and Bonnefond2017). Seventy-four adolescents (aged 12–18 years) participated in this study, including 42 patients with a primary DSM-5 diagnosis of MDD and 32 healthy controls (HC). Participants were recruited through flyers posted at Chengdu Fourth People’s Hospital and nearby schools, as well as through online advertisements (e.g., via WeChat public accounts). As in previous studies involving adolescents and social rewards (Davis et al., Reference Davis, Modi, Skymba, Finnegan, Haigler, Telzer and Rudolph2022), each participant received a compensation of 50 RMB for completing the tasks. If necessary, additional subsidies for transportation and meals were also provided. The diagnosis of MDD was confirmed by licensed psychiatrists based on DSM-5 criteria and a Hamilton Depression Rating Scale (HAMD) score of ≥18. HCs were eligible if neither they nor their first-degree relatives had a current or past diagnosis of MDD. Exclusion criteria for all participants included any current or lifetime physical disorders (n = 1 from the MDD group), neurological disorders, or other Axis I disorders (n = 4, all from the MDD group). Due to technical issues affecting fNIRS data quality, five participants were excluded from the analysis (two from the MDD group and three from the HC group), resulting in a final analysis of 64 participants (see Table 1). Written informed consent was obtained from all participants and their legal guardians, and the study protocol was approved by the Ethics Committee of the Fourth People’s Hospital of Chengdu.
Demographical characteristics of the MDD and HC group (M ± SD)

Abbreviations: BDI: Beck Depression Inventory; BAS-R: Behavioral Activation System-Reward; BAS-D: Behavioral Activation System-Drive; BAS-FS: Behavioral Activation System-Fun Seeking; BIS: Behavioral Inhibition System.
a See Supplementary Table S1 in Supplementary Materials A for the medications.
Clinical assessments
Prior to the experiment, participants completed two questionnaires: (1) The Beck Depression Inventory-II (BDI-II; Beck, Steer, Ball, & Ranieri, Reference Beck, Steer, Ball and Ranieri1996), consisting of 21 items measuring depressive symptom severity. Higher total scores indicate more severe depression levels. (2) The Behavioral Inhibition System and Behavioral Activation System Scale (BAS/BIS; Carver & White, Reference Carver and White1994), comprising 18 items assessing BAS sensitivity and six items evaluating BIS sensitivity. BAS items can be categorized into three domains: “Reward Responsiveness,” “Drive,” and “Fun Seeking,” each containing six items. Elevated scores indicate greater BAS/BIS sensitivity.
AX version of continuous performance task (AX-CPT)
The AX Continuous Performance Task (AX-CPT), implemented using E-Prime software (Psychology Software Tools, Inc., Pittsburgh, PA), was employed in this study to assess cognitive control processes. In this paradigm, participants were presented with two types of cues (A or B) followed by two types of probes (X or Y), resulting in four possible cue–probe combinations: AX, AY, BX, and BY trials. Participants were instructed to make a target response only to AX trials and a non-target response to all other trial types (i.e., AY, BX, and BY). Cue B allowed participants to determine the correct response immediately, placing minimal demand on cognitive control. In contrast, when cue A appeared, participants needed to wait for the subsequent probe to identify the correct response, thus imposing greater cognitive demands.
In the present study, AX trials constituted 70% of the total trials, with the remaining trials (AY, BX, and BY) occurring at frequencies of 10%, 12.5%, and 7.5%, respectively (Lesh et al., Reference Lesh, Tanase, Geib, Niendam, Yoon, Minzenberg, Ragland, Solomon and Carter2015). Due to the high frequency of AX trials, participants were likely to develop a response bias upon encountering either the A cue or the X probe. Consequently, the task requires participants to engage both proactive and reactive control mechanisms. Upon presentation of a cue (A or B), participants are required to actively maintain cue-related information throughout the delay period, reflecting the use of proactive control. This enables them to prepare for the forthcoming probe. Once the probe (X or Y) is presented, participants must engage reactive control to determine whether the response should be a target or non-target.
Each trial begins with the presentation of a fixation cross for a jittered duration of 300, 600, or 900 ms, followed by the cue, which is displayed for 300 ms. A 4700-ms delay then ensues, during which participants are expected to maintain the cue information using proactive control. The probe is subsequently presented for 300 ms, followed by a blank screen lasting 1700 ms. After the probe appears, participants are required to engage in reactive control to evaluate the probe and determine the correct response. Participants were instructed to press the “F” key for a target response and the “J” key for a non-target response. The assignment of response keys was counterbalanced across participants. Feedback is presented for 1000 ms, followed by a jittered inter-trial interval of 3500 to 4500 ms. The total duration of each trial ranges from approximately 11,800 to 13,400 ms (Braver et al., Reference Braver, Paxton, Locke and Deanna2009) (see Supplementary Figure S1 in Supplementary Materials B).
The task comprised two Non-reward and two Reward blocks, presented in an alternating order. Each block consisted of 40 trials, preceded by a 20-second fixation period. The task duration was approximately 20 min. In the Reward block, participants were instructed to respond as quickly as possible within a preset time frame to earn rewards. The preset time was determined based on the average response time during the practice session for the same paradigm (10 trials). To enhance the task’s ecological validity and account for social-processing deficits in depression (Sequeira, Silk, Hutchinson, Jones, & Ladouceur, Reference Sequeira, Silk, Hutchinson, Jones and Ladouceur2021), we present a thumbs-up image, commonly used in social media and research (Davis et al., Reference Davis, Modi, Skymba, Finnegan, Haigler, Telzer and Rudolph2022; Demurie, Roeyers, Baeyens, & Sonuga-Barke, Reference Demurie, Roeyers, Baeyens and Sonuga-Barke2012; Liang et al., Reference Liang, Lin, Chang, Zeng, Chan and Hung2023). Correct and timely responses were rewarded with a picture of a thumbs-up, whereas incorrect or slow responses were followed by the display of a two-bar equals sign. Conversely, in the Non-reward block, participants received feedback displaying the two-bar equals sign, regardless of their response.
Functional near-infrared spectroscopy (fNIRS) data acquisition and analysis
fNIRS is a non-invasive method characterized by high temporal resolution and reasonable spatial resolution, making it suitable for both adolescent populations and individuals with neurological disorders (Westgarth, Hogan, Neumann, & Shum, Reference Westgarth, Hogan, Neumann and Shum2021). In this study, data were acquired using the NIRSport system (NIRSport, NIRx Medical Technologies, Glen Head, NY, USA) emitting near-infrared light at two wavelengths (typically 760 nm and 850 nm) to measure changes in oxyhemoglobin and deoxyhemoglobin concentrations in the cortical regions. Data were recorded continuously at a sampling rate of 7.81 Hz. Eight sources and seven detectors were positioned to cover the prefrontal cortex, forming a total of 20 channels. The average distance between sources and detectors was approximately 3 cm. Based on the channel locations derived from the 10–20 system, the 20 channels in the prefrontal cortex were divided into five Regions of Interest (ROIs), including the right ventrolateral prefrontal cortex (rVLPFC), left ventrolateral prefrontal cortex (lVLPFC), right dorsolateral prefrontal cortex (rDLPFC), left dorsolateral prefrontal cortex (lDLPFC) and central prefrontal cortex (Gilman et al., Reference Gilman, Schmitt, Potter, Kendzior, Pachas, Hickey, Makary, Huestis and Evins2022). The corresponding relation between ROIs and channels was as follows: lDLPFC included channels 1, 2, and 5; rDLPFC included channels 15, 17, and 18; lVLPFC included channels 3, 4, and 6; rVLPFC included channels 16, 19, and 20 (Supplementary Figure S2 in Supplementary Materials C).
Raw fNIRS data underwent preprocessing using nirsLAB software (http://nirx.net/nirslab-1/) (Dou, Lei, Cheng, Wang, & Leppänen, Reference Dou, Lei, Cheng, Wang and Leppänen2020). Preprocessing involved the following steps: first, spike artifacts were smoothed using a semi-automated procedure, and contaminated data were replaced by linear interpolation. Next, discontinuities exceeding 5 SD from the variance of the rest of the data were automatically detected and removed. Subsequently, the fNIRS data were bandpass-filtered (0.01–0.2 Hz) to remove high-frequency physiological artifacts (including cardiac and respiratory signals) as well as low-frequency drift, consistent with methods used in studies of depressed adolescents (Liu et al., Reference Liu, Chen, Cheng, Zhuang, Zhang, Tang and Zhou2023; Liu, Wang, Wang, Xiao, & Shi, Reference Liu, Wang, Wang, Xiao and Shi2022) and cognitive control tasks (Ding et al., Reference Ding, Ou, Yao, Wu, Chen, Shen, Lan and Xu2024; Ding, Wang, Wang, Li, & Li, Reference Ding, Wang, Wang, Li and Li2023). The data were then converted into concentration changes of oxygenated hemoglobin (HbO) and deoxygenated hemoglobin (HbR) using the modified Beer–Lambert law (Cope & Delpy, Reference Cope and Delpy1988). Given that HbO exhibits a higher signal-to-noise ratio compared to HbR and offers better contrast-to-noise ratio, only HbO concentration changes were analyzed (Strangman, Culver, Thompson, & Boas, Reference Strangman, Culver, Thompson and Boas2002). Finally, in line with previous studies (Holper, Brincke, Wolf, & Murphy, Reference Holper, Brincke, Wolf and Murphy2014; Lei & Rau, Reference Lei and Rau2022), Δ[HbO] was obtained by subtracting the 20-second resting baseline before each block from the 5-second post-stimulus period. We normalized signals as Z-scores, because the absolute concentration values significantly differed among participants. We obtained the Z-scores (z) by the Δ[HbO] divided by the standard deviations during the baseline period (σ): z = Δ[HbO]/σ (Dou et al., Reference Dou, Lei, Cheng, Wang and Leppänen2020).
Statistical analysis
For the behavioral data, we analyzed the overall error rates and response times. A 2 (Group: MDD vs. HC) × 2 (Condition: Non-Reward vs. Reward) repeated measures analysis of variance (ANOVA) was conducted for both indices. When Mauchly’s test indicated a violation of the sphericity assumption, the Greenhouse–Geisser correction was applied to adjust the degrees of freedom. A significant interaction effect was followed up with simple effects analyses to examine group differences under each condition and condition differences within each group. Pairwise comparisons were Bonferroni-corrected, with the significance level set at α = 0.05. Additionally, the AX-CPT task allowed for the analysis of error rates and RTs across the four cue-probe conditions. Therefore, a 2 (Group: MDD vs. HC) × 2 (Condition: Non-Reward vs. Reward) × 4 (Cue-Probe Condition: AX vs. AY vs. BX vs. BY) repeated measures ANOVA was conducted for both indices. Results of these analyses are provided in Supplementary Materials D.
For the fNIRS data, the average Δ[HbO] values from the three channels interfacing with the left and right hemispheres of the DLPFC and VLPFC were computed separately. Given that the neural response during cue processing was used to detect the utilization of proactive cognitive control, a 2 (Group: MDD vs. HC) × 2 (Condition: Non-Reward vs. Reward) × 2 (Cue: A vs. B) repeated measures ANOVA was performed on the four ROI regions. To account for multiple comparisons, the significance level was adjusted using Bonferroni corrections, with a threshold p value of 0.0125 (0.05/4).
HDDM analysis
The Hierarchical Drift Diffusion Model (HDDM; Wiecki, Sofer, & Frank, Reference Wiecki, Sofer and Frank2013) was applied to model response times (RT) distributions in a reward-modulated AX-CPT task. This Bayesian approach estimates latent cognitive parameters from full RT distributions, accounting for both group and individual variability. Based on prior studies (Dillon et al., Reference Dillon, Belleau, Origlio, McKee, Jahan, Meyer, Souther, Brunner, Kuhn, Ang, Cusin, Fava and Pizzagalli2024; Pitliya et al., Reference Pitliya, Nelson, Hajcak and Jin2022), we expected evidence accumulation to vary across groups and reward conditions, so models were fit separately for each using Markov Chain Monte Carlo (MCMC) sampling with 5,000 iterations and 2,500 burn-in samples. Convergence was assessed using the Gelman-Rubin R-hat statistic, with values below 1.1 indicating successful convergence. Model comparison was conducted using the Deviance Information Criterion (DIC), with the model having the smallest DIC value considered the best fit. The model, including decision threshold (a), starting point (z), and non-decision time (t), provided the best fit (DIC = 1631.06). Accordingly, our analysis focused on these three key parameters. To examine group or condition differences, we used Bayesian inference, which allows us to directly estimate the probability that one group differs from another based on the observed data (Gür et al., Reference Gür, Duyan, Türkakın, Arkan, Karson and Balcı2020; Shen et al., Reference Shen, Hu, Lv, Yi, Gong and Yan2024). We reported these results as posterior probabilities (PP) for the hypotheses of interest. A posterior probability of 0.95 or higher was considered statistically significant (Kruschke, Reference Kruschke2021).
In the AX-CPT task, participants were required to accumulate evidence about the cue-probe pairing in order to respond with either a target response (AX) or a non-target response (AY, BX, BY). The decision threshold represents the amount of evidence required before making a choice. In this task, participants were instructed to respond both accurately and quickly to gain a reward. Thus, a lower decision threshold may reflect a strategic adjustment to meet the dual demands of speed and accuracy in pursuit of rewards. The starting point captures initial response bias, which may be influenced by the higher frequency of A cues, potentially favoring responses toward the target boundary. Moreover, the higher frequency of A cues makes these cues more rewarding. Non-decision time accounts for processes outside the decision stage, such as stimulus encoding and motor response execution. Lower non-decision time may reflect more efficient perceptual or motor processing (Figure 1).
The Hierarchical Drift Diffusion Model (HDDM). The HDDM models decisions as evidence accumulation towards response boundaries, with a decision threshold determining when a response is made. In this experiment, participants responded to target (AX) or non-target (AY, BX, and BY) cues. A lower decision threshold indicates that less evidence is required before responding, suggesting a strategic shift toward faster responses in the context of social rewards. The starting point captures initial bias, influenced by A cues frequency or reward presence, while non-decision time accounts for processes like stimulus encoding and motor execution. The Bayesian framework allows for enhanced parameter estimation across reward conditions and groups, providing insights into how reward influences decision-making and cognitive efficiency.

Results
Behavioral results
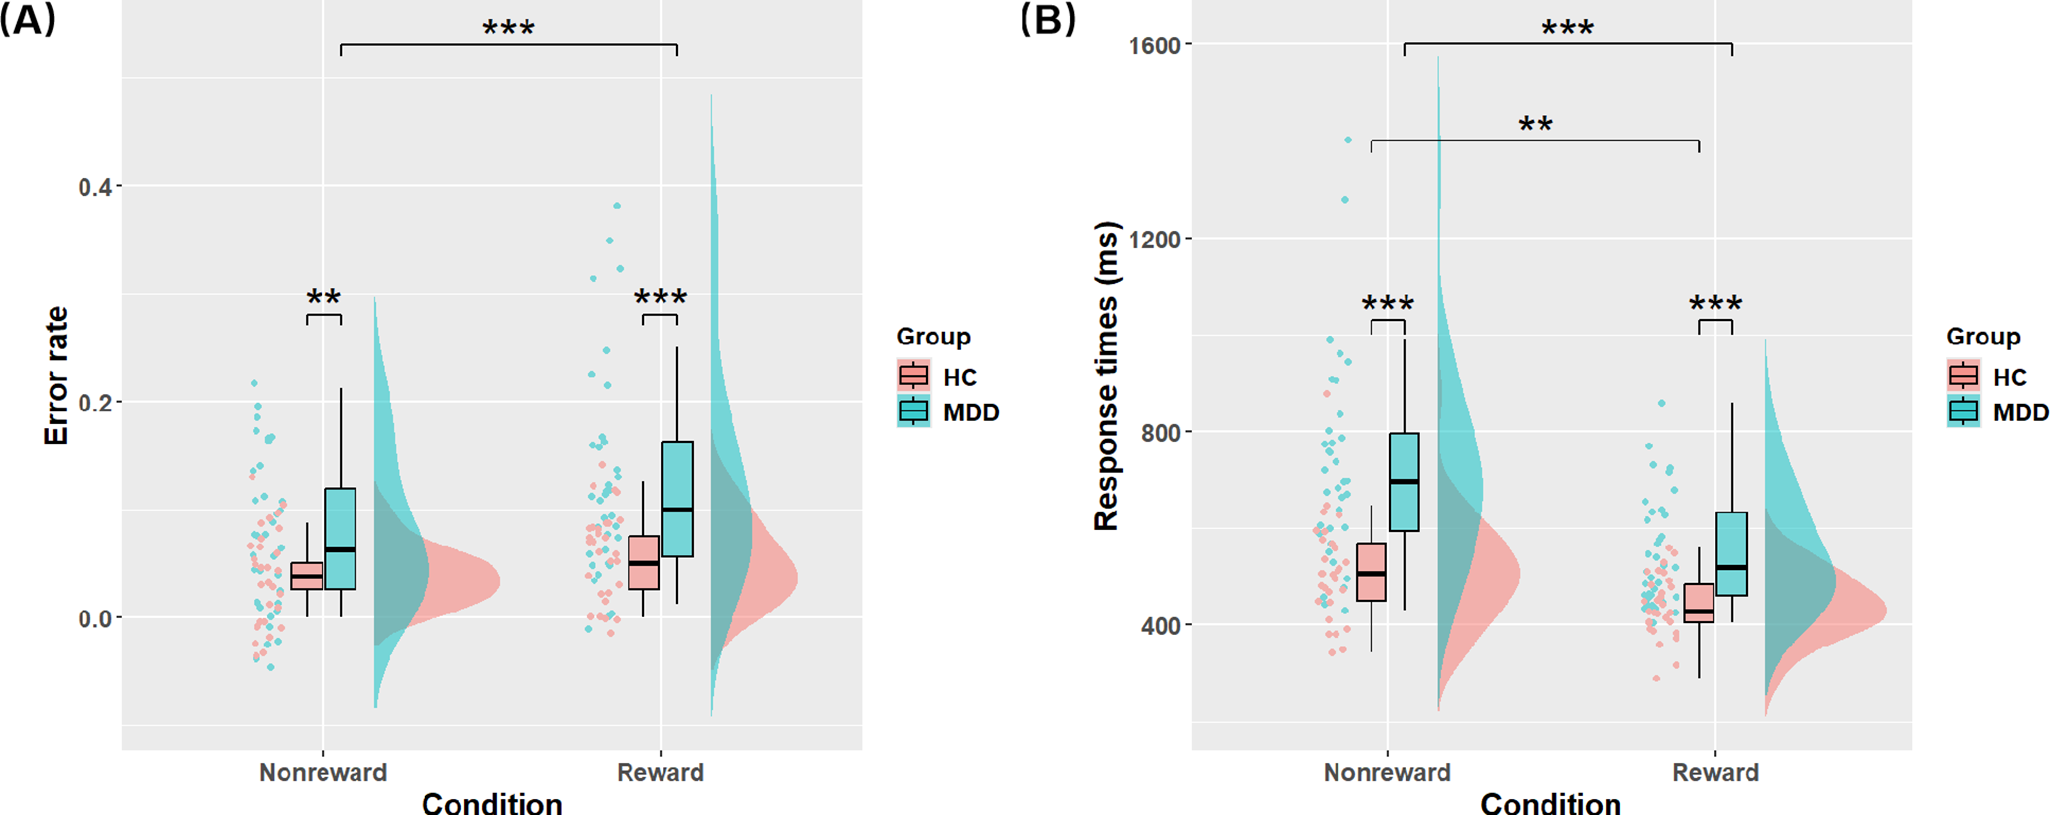
Error rates: The analysis revealed a significant main effect of Condition (F (1, 62) = 12.208, p = 0.001, η2p = 0.165): the error rates in the Reward condition (M ± SD: 0.092 ± 0.086) were higher than those in the Non-Reward condition (0.059 ± 0.053). The main effect of Group was significant (F (1, 62) = 17.386, p < 0.001, η2p = 0.219): the error rates in MDD group (0.102 ± 0.009) were higher than those in HC group (0.044 ± 0.010). The interaction effect of Condition and Group was also significant (F (1, 62) = 4.484, p = 0.038, η2p = 0.067). Further simple effects analyses showed that in the Non-Reward condition, the MDD group exhibited significantly higher error rates than the HC group (F(1, 62) = 9.157, p = 0.004, η2p = 0.129). In the Reward condition, the MDD group also showed significantly higher error rates than the HC group (F(1, 62) = 15.253, p < 0.001, η2p = 0.197). Notably, the difference between the MDD and HC groups was larger in the Reward condition (Figure 2A).
Raincloud plots representing data distributions in Reward and Non-Reward conditions for both the healthy control group and the MDD group (A) Error rates (B) Response times. Box plots represent the median and interquartile ranges of these values. *p < 0.05, **p < 0.01 and ***p < 0.001.

Response Times (RT) A significant main effect of Condition was found (F (1, 62) = 49.870, p < 0.001, η2p = 0.446): the RT in the Reward condition (495.599 ± 11.999) was faster than that in the Non-Reward condition (619.150 ± 21.964). The main effect of Group was significant (F (1, 62) = 28.196, p < 0.001, η2p = 0.313): the RT in MDD group (639.062 ± 20.711) was slower than that in HC group (475.687 ± 22.753). The interaction effect of Condition and Group was also significant (F (1, 62) = 8.440, p = 0.005, η2p = 0.120). Simple effects analyses revealed that both the MDD group (F(1, 62) = 54.809, p < 0.001, η2p = 0.469) and HC group (F(1, 62) = 7.898, p = 0.007, η2p = 0.113) displayed faster RT in the Reward condition compared to the Non-Reward condition. As expected, the MDD group exhibited slower RT than the HC group in both the Non-Reward (F(1, 62) = 23.778, p < 0.001, η2p = 0.277) and Reward condition (F(1, 62) = 21.996, p < 0.001, η2p = 0.262) (Figure 2B).
HDDM parameters
Both groups showed an initial bias toward the target boundary in the Reward condition (MDD = 0.624; HC = 0.656). The MDD group exhibited a lower bias than the HC group in this condition (posterior probability [PP] = 0.996) and also showed lower bias in the Reward compared to the Non-Reward condition (PP > 0.999). Regarding decision thresholds, the MDD group demonstrated significantly larger thresholds than the HC group in both the Non-Reward (PP > 0.999) and Reward conditions (PP = 0.999). Additionally, both groups showed higher thresholds in the Non-Reward condition compared to the Reward condition (MDD: PP > 0.999; HC: PP = 0.995). Both groups also exhibited longer non-decision time in the Non-Reward condition than in the Reward condition (MDD: PP = 0.996; HC: PP = 0.975) (refer to Supplementary Table S3 and Supplementary Figure S3 in Supplementary Materials E).
fNIRS results
Activation results
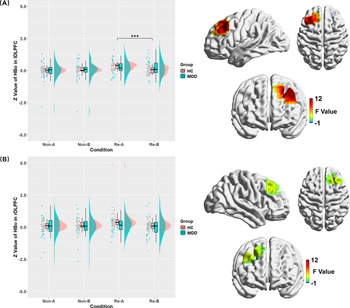
lDLPFC: The main effect of Cue was significant (F (1, 62) = 15.537, p < 0.001, η2p = 0.200): A cues (0.148 ± 0.512) elicited greater activation compared to B cues (0.086 ± 0.531). Notably, a significant three-way interaction among Group, Condition, and Cue was observed (F (1, 62) = 12.945, p = 0.001, η2p = 0.173). To break down this three-way interaction, we tested the two-way interaction of Cue × Group in the Reward and Non-Reward conditions separately. The interaction effect of Cue × Group was only significant in the Reward condition (F (1, 62) = 27.778, p < 0.001, η2p = 0.309). Simple effects analysis indicated that A cues resulted in significantly greater activation than B cues in the HC group (F (1, 62) = 59.999, p < 0.001, η2p = 0.492), whereas this difference was not significant in the MDD group (F (1, 62) = 0.462, p = 0.499, η2p = 0.007) (Figure 3A).
Left panel: Raincloud plots representing data distributions of oxygenated hemoglobin for A cues and B cues under Reward and Non-Reward conditions in healthy control and MDD groups in (A) left DLPFC and (B) right DLPFC. Box plots display the median and interquartile ranges of these values, with all values converted to Z scores. Right panel: The topographic map shows the corresponding locations with interaction F values among Group, Condition, and Cue. *p < 0.05, **p < 0.01, and ***p < 0.001.

rDLPFC: The interaction effect between Condition and Cue was significant (F (1, 62) = 7.153, p = 0.010, η2p = 0.103). Simple effects analysis revealed that A cues exhibited greater activation than B cues in the Reward condition (F (1, 62) = 6.653, p = 0.012, η2p = 0.097), while the difference was not significant in the Non-Reward condition (F (1, 62) = 0.901, p = 0.346, η2p = 0.014) (Figure 3B).
lVLPFC: The interaction effect among Group, Condition, and Cue was significant (F (1, 62) = 7.918, p = 0.007, η2p = 0.113). We tested the two-way interaction of Cue × Group in the Reward and Non-Reward conditions separately. The interaction effect of Cue × Group was only significant in the Reward condition (F (1, 62) = 19.255, p < 0.001, η2p = 0.237). Simple effects analysis indicated that A cues resulted in significantly greater activation than B cues in the HC group (F (1, 62) = 27.109, p < 0.001, η2p = 0.304), whereas this difference was not significant in the MDD group (F (1, 62) = 0.638, p = 0.427, η2p = 0.010) (Figure 4A).
Left panel: Raincloud plots representing data distributions of oxygenated hemoglobin for A cues and B cues under Reward and Non-Reward conditions in healthy control and MDD groups in (A) left VLPFC and (B) right VLPFC. Box plots display the median and interquartile ranges of these values, with all values converted to Z scores. Right panel: The topographic map shows the corresponding locations with interaction F values among Group, Condition, and Cue. *p < 0.05, **p < 0.01, and ***p < 0.001.

rVLPFC: The main effect of Cue was significant (F (1, 62) = 7.422, p = 0.008, η2p = 0.107): A cues (0.191 ± 0.528) showed greater activation than the B cues (0.131 ± 0.598). Additionally, the interaction effect among Group, Condition, and Cue was significant (F (1, 62) = 6.477, p = 0.012, η2p = 0.095). We tested the two-way interaction of Cue × Group in the Reward and Non-Reward conditions separately. The interaction effect of Cue × Group was only significant in the Reward condition (F (1, 62) = 11.205, p = 0.001, η2p = 0.153). Simple effects analysis indicated that A cues resulted in significantly greater activation than B cues in the HC group (F (1, 62) = 30.163, p < 0.001, η2p = 0.327), whereas this difference was not significant in the MDD group (F (1, 62) = 1.125, p = 0.293, η2p = 0.018) (Figure 4B).
The functional connectivity results
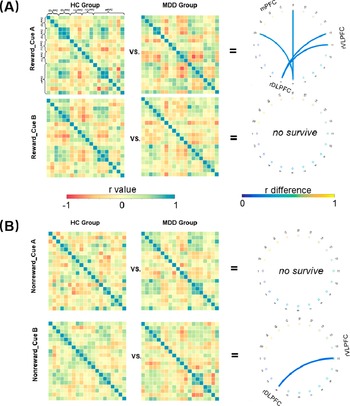
Our results demonstrated that, in the Reward condition following A cues, the connectivity between the rDLPFC and rVLPFC (CH17 vs. CH19, r = 0.153; CH17 vs. CH20, r = 0.274) in the MDD group was significantly weaker compared to the HC group (CH17 vs. CH19, r = 0.655, p = 0.003; CH17 vs. CH20, r = 0.750, p = 0.002) (Figure 5A). Furthermore, in the Non-Reward condition following B cues, the connectivity between rDLPFC and rVLPFC (CH15 vs. CH19, r = 0.095) in the MDD group was significantly weaker than in the HC group (CH15 vs. CH19, r = 0.623, p = 0.002) (Figure 5B).
Functional connectivity results under (A) Reward condition and (B) Non-Reward condition. The left panel represents the average functional connectivity matrices extracted from both groups. Each figure illustrates the functional connectivity matrices for each channel pair of HbO under Non-Reward and Reward conditions following A and B cues, displayed as 20 × 20 square matrices. The right panel displays the chord diagram, representing the differences in functional connectivity between the two groups under different reward and cue conditions.

Correlations between BIS/BAS scores and behavioral, computational, and neural indicators
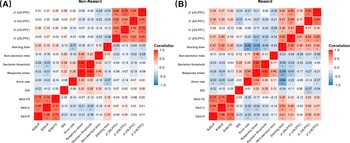
Based on the above findings, we conducted correlation analyses to examine the relationships between BIS/BAS scores and behavioral, computational, and neural measures. As group differences were more evident under the reward condition, we report results from this condition. Lower BAS-R and BAS-D scores were associated with higher error rates, slower response times, a lower starting bias, and smaller activation differences in the left DLPFC, left VLPFC, and right VLPFC. Moreover, better behavioral performance (e.g., lower error rates, faster response times, lower decision thresholds, higher starting bias) was consistently associated with greater activation differences in the prefrontal cortex (see Figure 6B).
Correlations between BIS/BAS scores, behavioral performance, and neural activation in (A) Non-Reward and (B) Reward conditions. Behavioral indices include error rate, response times, and HDDM parameters. Neural activation refers to the difference in activation between cue A and cue B in both the left and right DLPFC and VLPFC. *p < 0.05, **p < 0.01, and ***p < 0.001 (uncorrected). BAS-R: Behavioral Activation System-Reward; BAS-D: Behavioral Activation System-Drive; BAS-FS: Behavioral Activation System-Fun Seeking; BIS: Behavioral Inhibition System; d’: difference activation between cue A and cue B; r: Right; l: Left.

Discussion
In this study, we combined a reward-related AX-CPT paradigm with functional Near-Infrared Spectroscopy (fNIRS) to examine behavioral and neural alterations in adolescents with MDD. We found that adolescents with MDD showed poorer behavioral performance than healthy controls under both reward and non-reward conditions, with particularly impaired performance in the reward context. At the neural level, healthy adolescents exhibited greater activation differences in the left DLPFC, left VLPFC, and right VLPFC in response to cues requiring high versus low cognitive control, whereas adolescents with MDD did not show such differential activation. Moreover, healthy adolescents demonstrated stronger functional connectivity between the DLPFC and VLPFC. We also found that greater anhedonia severity was associated with poorer behavioral and neural performance.
Consistent with our hypothesis, adolescents with depression demonstrated impaired cognitive control, as evidenced by slower response times and higher error rates, in line with prior research (Peterson et al., Reference Peterson, Snyder, Neilson, Rosenberg, Hough, Sandman, Ohanian, Garcia, Kotz, Finegan, Ryan, Gyimah, Sileo, Miklowitz, Friedman and Kaiser2022; Romer & Pizzagalli, Reference Romer and Pizzagalli2021). This impairment was more pronounced under the reward condition. Extending these behavioral findings, the HDDM results revealed altered decision-making processes, including higher decision thresholds and smaller starting point biases, suggesting that depressed adolescents require more evidence before making a decision and are less inclined to favor the more frequently rewarded response (Pitliya et al., Reference Pitliya, Nelson, Hajcak and Jin2022; Shen et al., Reference Shen, Hu, Lv, Yi, Gong and Yan2024). Together, these results indicate deficits in reward-modulated cognitive control in adolescents with MDD, which are evident not only in overt behavioral measures, such as accuracy and response times, but also in deeper impairments in the internal decision-making process.
Our results also showed that individuals with depression exhibited higher error rates under the reward condition than under the non-reward condition, which may reflect mechanisms proposed by the Expected Value of Control (EVC) theory. In our study, the reward condition demanded greater cognitive effort to reach the expected outcome. However, due to their reduced sensitivity to rewards, as indicated by the BIS/BAS scores, and a generally lower sense of control over tasks (Pizzagalli, Reference Pizzagalli2014), individuals with depression tended to overestimate the effort required to attain rewards. When the perceived cost exceeds the expected payoff, their evaluation of the expected value of control diminishes, making them less willing to invest effort. This, in turn, results in suboptimal allocation of cognitive resources and compromised cognitive control. Although adolescents with depression responded faster under the reward condition, this may be because faster responses do not necessarily require greater cognitive control. This finding aligns with previous research showing that individuals with depression are less inclined to expend high effort for high reward (Hershenberg et al., Reference Hershenberg, Satterthwaite, Daldal, Katchmar, Moore, Kable and Wolf2016; Horne, Topp, & Quigley, Reference Horne, Topp and Quigley2021). Moreover, our results are consistent with findings from adult depression studies (Toobaei et al., Reference Toobaei, Taghavi, Goodarzi, Sarafraz and Jobson2023, Reference Toobaei, Taghavi and Jobson2025). Taken together, the behavioral and computational modeling results provide converging empirical support for the EVC framework and suggest that motivational deficits may contribute to impaired cognitive control in adolescents with depression.
Distinct group differences emerged in patterns of cognitive control activation, particularly in proactive control. Healthy adolescents showed differential activation in response to cues signaling high (A cues) versus low (B cues) cognitive control demands, while adolescents with depression exhibited no such modulation. Furthermore, healthy adolescents demonstrated stronger functional connectivity between the VLPFC and DLPFC during A-cue trials. These differences in activation and connectivity likely reflect group-level variations in cognitive control flexibility, which is the capacity to dynamically adjust control allocation in response to changing task demands. Efficient cognitive control may depend on the ability to allocate more resources to demanding tasks while minimizing effort for easier ones. Supporting this interpretation, our correlational analysis revealed that greater neural differentiation between A and B cues was associated with better behavioral performance. This pattern aligns with findings from a meta-analysis, which reported that adolescents with depression showed heightened activation in both regions during cognitive control tasks but performed worse (Miller et al., Reference Miller, Hamilton, Sacchet and Gotlib2015). This discrepancy may reflect an inefficient deployment of cognitive control, where elevated activation fails to translate into effective regulation. Notably, these group differences were observed only under reward conditions, suggesting that impairments or inflexibility in prefrontal cortex regulation become evident specifically when cognitive control is motivated by reward. This provides nuanced neural evidence supporting the EVC framework, indicating that cognitive control deficits in depression may be linked to reduced adaptability of prefrontal regulation in reward-motivated contexts.
Our correlational analysis revealed that individuals with more severe anhedonia exhibited poorer cognitive control under the reward condition, as reflected in both behavioral performance and neural activation. This finding further supports the notion that cognitive control deficits in individuals with depression may be linked to dysfunctions in the motivational system. Specifically, BAS/BIS scores reflect elevated levels of anhedonia and a diminished capacity to anticipate pleasure from reward. The motivational deficits may be associated with an increased estimation of the cognitive effort required to obtain potential rewards, which could in turn reduce the expected value of exerting control. This diminished valuation manifests behaviorally in impaired cognitive control, including increased error rates, prolonged response times, elevated decision thresholds, and a reduced initial bias toward more rewarding response. At the neural level, it is further characterized by rigid activation patterns and attenuated functional connectivity within prefrontal control network. Building on these results, we propose a refined theoretical model of cognitive control impairments in adolescents with depression, extending the EVC theory to earlier developmental stages. Collectively, these findings contribute to constructing a comprehensive EVC framework by integrating behavioral, computational modeling, and neuroimaging evidence. This integrated model advances our understanding of cognitive control dysfunction in depression from a developmental perspective.
This study also offers several clinical implications. First, while cognitive control tasks can serve as supplementary tools in the diagnosis of depression (Insel et al., Reference Insel, Cuthbert, Garvey, Heinssen, Pine, Quinn, Sanislow and Wang2010), some studies have failed to observe cognitive control impairments in depressed adolescents (Colich et al., Reference Colich, Foland-Ross, Eggleston, Singh and Gotlib2015; Mannie, Harmer, Cowen, & Norbury, Reference Mannie, Harmer, Cowen and Norbury2009; Pan et al., Reference Pan, Batezati-Alves, Almeida, Segreti, Akkal, Hassel, Lakdawala, Brent and Phillips2011). Notably, these studies did not include a reward-related condition. Our findings suggest that cognitive control impairments in depressed adolescents may be more pronounced under the reward condition. These task-specific deficits not only support the use of reward-related cognitive control tasks in diagnostic practices but also reveal meaningful associations with core symptoms, such as anhedonia. Such insights could inform the development of more personalized intervention strategies. Second, it is important to incorporate reward-based approaches into cognitive control interventions for depression. Current treatments often focus primarily on improving cognitive control abilities (Beloe & Derakshan, Reference Beloe and Derakshan2019; Edwards et al., Reference Edwards, Zec, Campbell, Hoorelbeke, Koster, Derakshan and Wynne2022), while overlooking how patients assess the value of cognitive effort. Enhancing patients’ expectations of rewarding outcomes, such as experiencing positive emotions after recovery or imagining a more hopeful future, and reinforcing their belief in their ability to exert control to achieve these outcomes, may improve motivation and increase treatment engagement. In addition, although all participants in our study were diagnosed with severe depression, we also examined how individual differences in depression severity were associated with behavioral and neural measures (see Supplementary Materials H). Under reward condition, higher BDI-II scores were associated with poorer behavioral and inflexible neural performance. These findings suggest that the observed effects may not be confined to individuals with severe depression but may also extend across a broader spectrum of depressive severity. Identifying similar impairments in at-risk individuals could therefore aid in early prevention or intervention efforts.
Several limitations should be acknowledged. First, all participants in the MDD group were receiving antidepressant treatment, with varying durations of use. Therefore, the potential influence of medication cannot be entirely ruled out. We conducted correlation analyses between medication duration and behavioral, computational, and neural measures in the MDD group (see Supplementary Materials I), but found no significant associations. This is consistent with a prior meta-analysis reporting no moderating effect of medication status on reward-related behavior in MDD (Halahakoon et al., Reference Halahakoon, Kieslich, O’Driscoll, Nair, Lewis and Roiser2020). Nonetheless, the inability to fully control for medication effects remains a limitation. Future randomized controlled trials directly comparing medicated and unmedicated patients are needed to more clearly elucidate the impact of medication on reward-related cognitive control. Second, although the ‘thumbs up’ symbol has been widely used in previous studies (Davis et al., Reference Davis, Modi, Skymba, Finnegan, Haigler, Telzer and Rudolph2022; Rudolph, Davis, Skymba, Modi, & Telzer, Reference Rudolph, Davis, Skymba, Modi and Telzer2020), it may not fully capture the dynamics of real social interactions and lacks the natural, biologically salient features of stimuli such as smiling faces (Matyjek, Meliss, Dziobek, & Murayama, Reference Matyjek, Meliss, Dziobek and Murayama2020). While prior research has reported comparable behavioral effects across various reward types (Sailer, Wurm, & Pfabigan, Reference Sailer, Wurm and Pfabigan2023), further studies are needed to investigate how different forms of social and non-social rewards influence cognitive control, particularly in adolescents who are highly sensitive to social cues (Telzer, Jorgensen, Prinstein, & Lindquist, Reference Telzer, Jorgensen, Prinstein and Lindquist2020). Moreover, given the presence of feedback after each trial, we did not use the pre-stimulus period as the baseline, as it may still reflect residual activity from the preceding trial. Instead, a 20-second resting-state period prior to each block was used for baseline correction. While this approach may overlook dynamic changes in brain activation throughout the task, it was adopted to balance task duration, minimize participant fatigue, and maintain the reliability of the fNIRS data. Future studies may explore the use of longer or additional inter-trial intervals (ITIs) if experimental conditions permit, to further refine baseline estimation.
In conclusion, this study investigated the neural mechanisms underlying the interaction between reward and cognitive control in adolescents with MDD. Our findings indicate that adolescents with MDD (1) exhibited slower response times and higher error rates than HC group; (2) faster response times but higher error rates under reward conditions; (3) demonstrated a reduced starting bias towards more rewarding response and a broader decision threshold in reward contexts; and (4) showed inflexible activation patterns in the DLPFC and VLPFC, along with weakened connectivity between these regions during proactive control in reward pursuit. Together, these results provide integrated behavioral, computational modeling, and neural evidence within the framework of the Expected Value of Control (EVC) theory, supporting the notion of impaired cognitive control in depressed adolescents.
Supplementary material
The supplementary material for this article can be found at http://doi.org/10.1017/S003329172510202X.
Data availability statement
The data that support the findings of this study are available from the corresponding author upon.
Acknowledgments
The authors would like to acknowledge the support of the Public Schools and thank the dedicated staff who participated in the study.
Funding statement
This study was supported by grants from STI 2030 – Major Projects [2022ZD0210900], the National Natural Science Foundation of China (NSFC32271142, NSFC32300928); Guangdong Key Project in ‘Development of new tools for diagnosis and treatment of Autism’ (2018B030335001); Ministry of Education Key Projects of Philosophy and Social Sciences Research (grant number 21JZD063). The Outstanding Young Researcher International Training Program of Guangdong Province (No. 8672311-000001). The Ministry of Education of Humanities and Social Science project [23YJC190003]; Natural Science Foundation of Sichuan Province [2025ZNSFSC1023].
Ethical standard
The statements regarding ethical approval and informed consent can be found on page 3 of the manuscript.


 Open access