


1. Introduction
For decades, behavioral decision research has been intrigued with the way people make decisions involving rare events. In their seminal prospect theory paper, Kahneman and Tversky wrote: “Because people are limited in their ability to comprehend and evaluate extreme probabilities, highly unlikely events are either ignored or overweighted” (Kahneman & Tversky, Reference Kahneman and Tversky1979, pp. 282–283). Understanding human decision making in this context is of huge significance for analysis of many industries and domains, from finance and insurance to law and public policy. As a recent example of the puzzling patterns people exhibit, the coronavirus pandemic seems to have triggered both panic and complacency reactions, the former consistent with overweighting the rare risk and the latter consistent with ignoring it (Erev et al., Reference Erev, Plonsky and Roth2020).
Historically, mainstream decision research has followed the basic assumption of prospect theory and its derivatives (e.g., cumulative prospect theory, Tversky & Kahneman, Reference Tversky and Kahneman1992); that people behave as if they overweight rare events. This assumption is often empirically corroborated when studying the behavior of individuals who make one-shot decisions based on a description of the payoff structure (the setting to which prospect theory pertains). More recently, however, it has been shown that when people make decisions based on experience with similar decisions, they behave as if they underweight (or “ignore”) rare events, reflecting a “description-experience gap” (Hertwig & Erev, Reference Hertwig and Erev2009). The bias to underweight rare events in decisions from experience (Erev & Haruvy, Reference Erev, Haruvy, Kagel and Roth2016) was documented in many settings including repeated risky decisions with partial (Barron & Erev, Reference Barron and Erev2003), complete (Camilleri & Newell, Reference Camilleri and Newell2011), and biased feedback (Plonsky & Teodorescu, Reference Plonsky and Teodorescu2020a); repeated (Jessup et al., Reference Jessup, Bishara and Busemeyer2008), and one-shot (Cohen et al., Reference Cohen, Plonsky and Erev2020) decisions from description with feedback; one-shot decisions from sampling (Hertwig et al., Reference Hertwig, Barron, Weber and Erev2004); investment decisions (Taleb, Reference Taleb2007); time-saving decisions (Munichor et al., Reference Munichor, Erev and Lotem2006); signal detection tasks (Barkan et al., Reference Barkan, Zohar and Erev1998); consumer choice (Wulff et al., Reference Wulff, Hills and Hertwig2015); choice among experts (Erev et al., Reference Erev, Roth and Sonsino2022), and among decision rules (Bonder et al., Reference Bonder, Erev, Ludvig and Roth2023); and animal choice behavior (Shafir et al., Reference Shafir, Reich, Tsur, Erev and Lotem2008).
While there is extensive research on the role of rare events in individual decision making, only few studies have directly investigated their role in the context of strategic interactions. One likely reason for this gap is that basic research on decision making in strategic settings commonly abstracts agents’ payoffs in economic games as expected values or utilities of the feasible actions (see, e.g., Camerer, Reference Camerer2011), thereby overlooking effects of uncertainty in payoffs. This practice may reflect a reasonable desire to study the effects of social or strategic uncertainty that emerges when outcomes depend on the decisions of others, separately from the effects of environmental uncertainty that emerges when outcomes are drawn from an underlying distribution (Bruttel et al., Reference Bruttel, Bulutay, Cornand, Heinemann and Zylbersztejn2023; Messick et al., Reference Messick, Allison and Samuelson1988; Nagel et al., Reference Nagel, Brovelli, Heinemann and Coricelli2018; Suleiman & Rapoport, Reference Suleiman and Rapoport1988).Footnote 1
Although this may be a reasonable research strategy, there is significant importance in examining the joint effect of the two types of uncertainty. It is hard to think of natural settings in which there is absolutely no environmental or no social/strategic uncertainty, and their joint interacting influence may well differ from the sum of their independent effects. Indeed, studies that incorporated both forms of uncertainty revealed important insights (e.g., Avrahami et al., Reference Avrahami, Güth and Kareev2005; Fudenberg et al., Reference Fudenberg, Rand and Dreber2012; Moisan & Gonzalez, Reference Moisan and Gonzalez2017; Schulze & Newell, Reference Schulze and Newell2015). For example, studies found that adding or increasing environmental uncertainty reduces cooperation in public good games (Berger & Hershey, Reference Berger and Hershey1994; Dickinson, Reference Dickinson1998; Levati et al., Reference Levati, Morone and Fiore2009; Wit & Wilke, Reference Wit and Wilke1998), in resource dilemma games (Budescu et al., Reference Budescu, Rapoport and Suleiman1990; Rapoport et al., Reference Rapoport, Budescu, Suleiman, Weg, Liebrand, Messick and Wilke1992), and in repeated prisoner’s dilemma games (Aoyagi et al., Reference Aoyagi, Bhaskar and Fréchette2019; Aoyagi & Fréchette, Reference Aoyagi and Fréchette2009; Bereby-Meyer & Roth, Reference Bereby-Meyer and Roth2006; Gong et al., Reference Gong, Baron and Kunreuther2009; Kunreuther et al., Reference Kunreuther, Silvasi, Bradlow and Small2009). The payoff variability effect (Busemeyer & Townsend, Reference Busemeyer and Townsend1993) demonstrated in individual learning paradigms is one plausible explanation for these findings, suggesting basic learning processes may extend to strategic interactions. Moreover, studies suggest that environmental uncertainty may have a larger influence on behavior than social uncertainty (Rapoport et al., Reference Rapoport, Budescu, Suleiman, Weg, Liebrand, Messick and Wilke1992).
As noted, studies that directly examined behavior in strategic interactions in the presence of rare events are scarce. Artinger et al. (Reference Artinger, Fleischhut, Levati, Stevens, N., D. and R. P.2012) studied one-shot public good games with rare events. They compared behavior of participants who learned the outcome probabilities either via description or via sampling (“experience”) and found little differences. They also found mixed evidence concerning the apparent ‘weighting’ participants give to rare events. Yet, their results may stem from the fact that decisions were not repeated. Indeed, Erev et al. (Reference Erev, Ert and Roth2010) organized a competition to predict behavior in 4-person repeated market entry games, some of which included rare events, and showed that models that imply that rare events are underweighted performed best. Yet, they did not systematically investigate the impact of rare events in these settings nor were participants in their study provided with a description of the payoff structure, the common practice when studying behavior in economic games. Finally, Plonsky et al. (Reference Plonsky, Roth and Erev2021) studied a 4-person 3-alternative game abstracting behavior in a pandemic that provided the first clear evidence for behavior consistent with the underweighting of rare events in fully described repeated games. While convincing, this latter study demonstrates this pattern in only a single specific symmetric game in which all players face potential rare events. It remains unknown whether findings generalize to other types of games, and particularly how players whose payoffs do not include rare events respond when other players underweight rare events: Can they learn to exploit this bias, and if they do, can people “unlearn” to underweight the rare events (and so forth)? Additionally, these studies did not systematically compare settings with and without social uncertainty to uncover how this additional aspect impacts behavior. Finally, extant research did not systematically examine the importance of the presence of rare events in strategic interactions relative to varying social dimensions.
The goal of the current study is to start investigating these questions empirically using 2-person asymmetric repeated games with rare events. In the main treatment (Game “Rare Disasters”), one player chooses between an outside option and a stochastically dominated alternative, which offers the chance to get an outcome of a “rare disasters” lottery. That is, often, the lottery yields a good outcome but rarely it yields a “disaster.” This implies that players who behave as if they underweight rare events may be tempted to choose the (stochastically) dominated action. Strategic uncertainty complicates these decisions however, since it is the decision of the second player that determines whether the first player gets a chance to play the lottery, or loses with certainty. Importantly, for the first player to play the lottery, the second player should himself choose a dominated action. Hence, both players have a dominant action, which they should play in equilibrium of the stage game. Yet, the game is designed such that if the first player behaves as if she underweights rare events, and if the second player realizes it, then we expect both players to play their off-equilibrium actions.
Our experiment reveals that this is indeed how most participants play. To rule out alternative explanations for this pattern of choice, we design and test a second treatment (Game “Rare Treasures”) in which these alternative explanations have similar predictions to the main treatment, but underweighting of rare events prescribes a major shift in the first player’s behavior, which we find. Finally, we present a simple, and indeed simplistic, behavioral model to explain this behavior and estimate it using two additional experiments that replicate and extend the first experiment. Together, our results suggest underweighting of rare events plays a central role in these games, although players’ behavior is also sensitive to the social and strategic context.
2. Games design and behavioral predictions
2.1. Two-person games with rare events
Our main treatment involves the asymmetric simultaneous-move 2-player finitely repeated game presented in Figure 1. The focus in our study is on the choices made here by Player 1 (P1). In this “Rare Disasters” game, P1 chooses between playing OUT, an outside option that guarantees a payoff of zero, and playing IN, an option that involves both social/strategic uncertainty and environmental uncertainty. The social uncertainty is the result of Player 2’s (P2) choice: If P2 plays RIGHT – his strictly dominant action in the stage game – then P1 is guaranteed to lose 5. If, however, P2 plays LEFT (a dominated action), then P1 is faced in addition with environmental uncertainty that includes rare events: her payoff is an outcome of the lottery “+5 with probability .9, −100 otherwise,” which has expected value (EV) of −5.5.
The stage game in Game Rare Disasters, presented in normal form (a) and extensive form (b). w.p. = with probability. Players make choices simultaneously and independently

In addition to this main treatment, we also consider the “Rare Treasures” game presented in Figure 2. Game Rare Treasures is identical to Game Rare Disasters from Figure 1, except that the risky lottery that P1s can potentially play is replaced from one with a potential “disaster” (a negative rare event, −100) to one with a potential “treasure” (a positive rare event, +100). The lottery in this Rare Treasures game is also slightly better on average (EV = −4.5) than the lottery in the main treatment, although it is still bad.
The stage game in Game Rare Treasures, presented in normal form (a) and extensive form (b). w.p. = with probability. Players make choices simultaneously and independently

2.2. Behavioral predictions
As mentioned, because P1s in the games presented above face both environmental and social/strategic uncertainty, we focus on their decisions. What are the behavioral predictions of different theories/models for P1s behavior in these games? We start by discussing the expected pattern of behavior if P1s underweight rare events (as we predict), and then show that this expected pattern qualitatively differs from the expected behavior under alternative considerations.
Underweighting of rare events. In both games, playing IN provides an expected loss (vs. an outside option of zero). Yet, if P1 underweights rare events, she may choose to play IN in our main treatment, Game Rare Disasters (Figure 1). This happens because the weight given to the potential “disaster” event in the lottery (−100) would be smaller than it objectively deserves, potentially making the lottery appear attractive. For example, in the extreme case of complete neglect of the possibility of the rare event here (i.e., behaving as if the payoff of the lottery is guaranteed to be +5), playing IN is the payoff-maximizing choice under the belief that P2 is more likely to play LEFT than he is to play RIGHT. In Game Rare Treasures (Figure 2), in contrast, if P1 underweights rare events, she would treat the long-shot gamble that includes a potential “treasure” (+100) as even less attractive than it objectively is. Hence, in this game, P1 is expected to play OUT. Therefore, our main qualitative prediction under behavior that appears as underweighting of rare events is higher IN rates in Game Rare Disasters than in Game Rare Treasures. Moreover, we may expect P1s to play IN with rates higher than chance in Game Rare Disasters and with rates lower than chance in Game Rare Treasures. Note however, that the choice rates themselves also depend on the beliefs, and actual behavior, of P2s.
Utility maximization/Equilibrium of the stage game. In both games, the EV of the lottery P1 may get is negative. Hence, P1’s payoff from playing OUT (0 with certainty) has second-order stochastic dominance over the possible payoffs from playing IN (which are all negative in expectation). This implies that any risk averse (or risk neutral) utility maximizing agent should always prefer OUT over IN (Rothschild & Stiglitz, Reference Rothschild and Stiglitz1970), and OUT is the action prescribed in equilibrium of the stage game.Footnote 2
Prospect theory. In Game Rare Disasters (Figure 1), both loss aversion and overweighting of rare events decrease the attractiveness of IN relative to the utility maximization benchmark since losses are only possible when playing IN, and since the rare event is large and negative. Hence, in this game, playing OUT is also expected if P1 has prospect theory (Kahneman & Tversky, Reference Kahneman and Tversky1979) type preferences. In Game Rare Treasures (Figure 2), loss aversion and overweighting of rare events operate in opposite directions, so in principle an agent who adheres to prospect theory may play either way; yet in any case prospect theory preferences cannot account for higher IN rates in Game Rare Disasters than in Game Rare Treasures.
Theories of levels of reasoning (Level-k). For any level of reasoning higher than 0, theories of levels or reasoning (Camerer et al., Reference Camerer, Ho and Chong2004; Nagel, Reference Nagel1995; Stahl & Wilson, Reference Stahl and Wilson1995) predict that the decision of P1 should correspond with utility maximization given beliefs on the actions of P2. As discussed above, utility maximization implies OUT in both games regardless of the actions of P2 (for all non risk-seeking agents). Hence these theories also predict P1s would play OUT, at least most of the time (level-0 implies random choice). These models do not predict different behavior in the two games.
Inequity aversion. Common models of inequity aversion (Fehr & Schmidt, Reference Fehr and Schmidt1999) cannot justify playing IN in Game Rare Disasters, as we show in the Supplementary Material (SM). Intuitively, playing IN leads to strong disadvantageous inequality in payoffs (difference of at least 15 points in expectation) whereas playing OUT leads to mild advantageous inequality in payoffs which is likely preferred. In Game Rare Treasures, models of inequity aversion would be somewhat more likely to predict IN (because the disadvantageous payoff inequality is smaller in expectation), and if anything, would thus predict higher IN rates in Game Rare Treasures than in Game Rare Disasters.
Altruism. P1s may realize that by constantly playing OUT (in either game) they sentence the other player to a fixed loss, so some degree of altruism can help account for them playing IN (Cooper & Kagel, Reference Cooper, Kagel, Roth and Kagel2016). Note however, that altruism cannot account for difference in behavior between the two games: altruistic players would play IN to the same degree in both games.
Boredom. Constantly playing OUT, and getting zero for sure, may be quite boring (Pirla & Navarro-Martinez, Reference Pirla and Navarro-Martinez2022). Hence, in both games, boredom can imply P1s would play IN. Again, however, boredom does not predict different behavior in the two games.
Efficiency seeking. In both games, the highest joint (expected) payoff for the players is obtained under the profile (IN, RIGHT). Hence, efficiency concerns may lead P1s to play IN (under the belief that P2 will play RIGHT). Yet, efficiency seeking does not predict different IN rates in the two games.
To sum, behavior that appears as underweighting of rare events makes a unique qualitative prediction concerning the behavior of P1s that none of the other explanations make: higher IN rates in Game Rare Disasters (Figure 1) than in Game Rare Treasures (Figure 2). In addition, underweighting of rare events may also predict relatively high IN rates in Game Rare Disasters, although IN is a (stochastically) dominated action in this game. This latter prediction can also be made based on other considerations, like boredom, efficiency seeking, and altruism. Yet, behavior that appears as underweighting of rare events is the only explanation that would also predict dominated play by P2s.
Specifically, note that even if P1 behaves as if she underweights rare events, she will only play IN in Game Rare Disasters if she believes it is likely that P2 will play LEFT, a dominated action in the stage game. Since the game is repeated over many rounds, and since the worst possible outcome for P2s occurs if P1s play OUT, such dominated play can in principle be justified (and perhaps anticipated by P1s), but only if P2s believe, or learn from experience, that playing LEFT increases the chances that P1s would play IN in future rounds.Footnote 3 Note that such belief or learning is unlikely if P1 plays IN due to boredom, altruism, or efficiency seeking. Under these mechanisms, P1 does not benefit (and can even suffer disutility) from P2 playing LEFT, and P2 should therefore play RIGHT instead. Thus, although analysis of equilibrium in dominant strategies (as well as analysis of many popular choice models) would predict that in the Rare Disasters game (Figure 1), P1 will play OUT and P2 will play RIGHT, if P1 behaves as if she underweights rare events in this game, and if P2 realizes it, then we may expect both players to play their off-equilibrium actions (IN, LEFT).
3. Experiment 1
The experiment was programmed using O-Tree (Chen et al., Reference Chen, Schonger and Wickens2016) and received IRB approval from the University of Haifa.
3.1. Method
3.1.1. Procedure
Participants played 60 rounds of either Game Rare Disasters presented in Figure 1 or Game Rare Treasures presented in Figure 2. All participants in the same session played the same game. After providing consent to participate, participants read the instructions, which included an explicit presentation of the game they were about to face, in extensive form. In addition, the instructions included an explanation that they were about to be randomly paired, for the whole experiment, with one anonymous participant and that one of them will play the role of P1 and the other the role of P2 throughout the game. After answering two open text comprehension questions concerning the payoff structure of the game, participants were paired and randomly assigned to their role (P1 or P2).
Throughout the game, participants always saw a full description of the game in extensive form on-screen. In each round of the game, they each had to individually and simultaneously select between IN and OUT (P1s) or between LEFT and RIGHT (P2s). After both made a choice, they were each given feedback for that round. Feedback included the choice they made, the payoff they obtained, the forgone payoff they would have obtained had they chosen the alternative (note this counterfactual assumes the other player choice does not change), the choice made by the other player, and the payoff the other player obtained.
To avoid delays, participants had a limit of 10 seconds to submit their choice (this limit was extended to 18 seconds in the first three rounds). If they failed to submit their choice by that time, the computer randomly made a choice for them, played it out as usual, and deducted 2 points from their payoff. The limit and associated penalty were clearly stated in the instructions. A failure to submit a choice in time in a particular round was also clearly stated as part of both players’ feedback for that round (i.e., it was also communicated to the other player). In all analyses, we excluded pairs in which at least one of the players did not make a choice in time in more than 10% of the rounds. All choice rates we report exclude any decisions made automatically by the computer upon time out (2.2% of the decisions). The median time for completion of the experiment in full (including wait times) was 17.7 minutes (IQR = 5.1).Footnote 4
Participants knew that they would be paid a bonus that is contingent on their realized payoff in one randomly selected round, with each point worth $0.01, in addition to an endowment of 100 points from which a negative realized payoff could be deducted.
3.1.2. Participants
Participants were recruited from Amazon Mechanical Turk (MTurk). In total, 119 pairs of participants started the experiment (logged in, completed the comprehension questions, paired with one another and made at least one decision). In 15 of these pairs, one of the participants stopped responding at some point in the experiment, leaving 104 pairs who completed the experiment in full. Thirty-four pairs were excluded from the analysis because at least one of the players did not make a choice in time in more than 10% of the rounds.Footnote 5 Thus, we analyze data of 140 participants (87 males, 53 female; M age = 36.5, SD age = 11.8). Of these, 78 (39 pairs) played Game Rare Disasters and 62 (31 pairs) played Game Rare Treasures.
Participants received a show up fee of $2 and a mean performance-contingent bonus of $0.98 (SD = 0.13). 63% of participants answered both (open text) comprehension questions correctly. While we do not discard participants who answered any of the questions falsely, we also repeated all analyses for the subgroup that answered both questions correctly, with qualitatively similar results, although decreased power implies fewer tests reach the required significance level.
3.2. Results
Figure 3 shows the rates of off-equilibrium play for both players in both games. Namely, for each P1, we computed the IN-rate, the proportion of rounds in which the participant chose to play IN, and for each P2, we computed the LEFT-rate, the proportion of rounds in which the participant chose to play LEFT. (In computing both proportions, we first excluded rounds in which the participant had timed out.) As Figure 3 shows, most participants in Game Rare Disasters (Figure 1), but not in Game Rare Treasures (Figure 2), deviated from their prescribed action in equilibrium of the stage game.

Specifically, in game Rare Disasters, the mean IN-rate was 62.7%, significantly greater than chance, t(38) = 2.77, p = .009, suggesting P1s were more likely to play a stochastically dominated action over the action prescribed in equilibrium of the stage game. This is despite the fact that by playing OUT participants could have guaranteed a payoff of zero, whereas their average obtained payoff from playing IN in this game was significantly lower than zero: M = −3.87, t(38) = −5.41, p < .001.Footnote 6 In Game Rare Treasures, in contrast, the mean IN-rate was only 32%, significantly lower than chance, t(30) = −3.76, p < .001, suggesting P1s in this game played the action in equilibrium of the stage game more often than not. Most importantly, the difference between the IN-rates in the two games is large and significant: M = 0.307, 95% CI [0.175, 0.440], t(66.29) = 4.63, p < .001.Footnote 7 This difference is directly predicted by a tendency of P1s to underweight rare events, but cannot be predicted by alternative explanations as discussed in Section 2.2.
Figure 4 presents the average obtained payoffs of the pairs of players in each game, in comparison with the expected payoffs, if both play pure strategies for all 60 rounds. It shows that in Game Rare Disasters, but not in Game Rare Treasures, the observed average payoffs are closer to the payoffs that would be expected if both players always play their dominated strategies (IN, LEFT) than to their expected payoffs had they always played the equilibrium in dominant actions strategy (OUT, RIGHT). In both games, the payoffs are far from the payoffs expected if P1s were altruistic or efficiency seeking (IN, RIGHT).
Average payoffs in Experiment 1. Each dot represents the average payoff of one (fixed) pair. Red triangles represent the mean aggregate average payoffs in each game. Blue marks show the expected payoffs under pure strategies in each game. The stage-game equilibrium prediction, in both games, is (OUT, RIGHT)

Figure 5a shows the learning curves, the off-equilibrium rates in five blocks of 12 rounds each. While the choice rate of P1s in Game Rare Disasters appears to be rather stable across blocks, in Game Rare Treasures, P1s clearly learn in the direction of payoff maximization (i.e., staying out and getting zero for sure). This pattern suggests that the behavior consistent with underweighting of rare events is robust and is not eliminated with additional rounds of feedback, at least in the medium term. Figure 5b shows that the average difference in obtained payoffs within each pair stabilizes over time in both games. Yet, while in Game Rare Treasures the average payoffs are equalizing (perhaps suggesting ex-post fairness considerations are at play in this game), in Game Rare Disasters, where underweighting of rare events implies lower average payoffs for P1s, the average payoff difference remains significantly and strongly below zero over time, with P1s’ payoffs lower on average than P2s. That is, P1s continue to choose IN throughout the game despite getting much worse payoffs than the payoffs obtained by their counterparts, which implies ex-post fairness considerations are less relevant.
Choices and outcomes over time in Experiment 1. (a) Mean aggregate off-equilibrium choice rates (IN-rates for P1s and LEFT-rates for P2s) over time. (b) Mean aggregate average payoff difference between players in the same pair over time (negative numbers indicate higher payoff of P2). Results are shown in blocks of 12 rounds each. Game Rare Disasters is shown in Figure 1 and Game Rare Treasures is shown in Figure 2. Error bars correspond to 95% CI for the mean

Table 1 presents the choice rates of P1s in a particular round t contingent on P2s choice and the lottery outcome in the previous round t − 1. Most clearly, it shows that P2’s play in t − 1 is strongly associated with P1’s play in round t: P1s play IN much more after P2s play LEFT than after they play RIGHT. This supports the stance that P1s prefer P2s to play LEFT although altruism and efficiency seeking would predict otherwise. More importantly, Table 1 further shows behavior consistent with underweighting of the rare events is not eliminated even after players directly observe the rare events being generated by the risky lottery. In Game Rare Disasters, P1s choose IN immediately after observing the −100 event in 86 of the 128 (67.2%) instances in which they see it occur. This IN rate is significantly greater than chance in a sign test, p < .001. In Game Rare Treasures, in contrast, P1s play IN in only 13 of the 35 (37.1%) rounds that immediately follow a +100 event, a rate which is not significantly lower than 50% (p = .18). Finally, Table 1 also shows that despite the round-by-round independence, and the full information available, the outcome of the lottery in t − 1 is associated with the choice rates at t. This suggests that players used the feedback on previous choices to inform their future ones, perhaps because they do not understand or believe the objective probability information, and the outcomes can then speak to the actual probability of payoffs. Interestingly, however, in Game Rare Treasures, P1s play IN less often after seeing the lottery provide a large win (+100) than after it provides a smaller loss (−10). This type of behavior, which does not emerge in Game Rare Disasters here, contradicts common models of learning in games, like reinforcement learning (Erev & Roth, Reference Erev and Roth1998) and directional learning (Selten & Stoecker, Reference Selten and Stoecker1986), but may be consistent with some type of a gambler’s fallacy or pattern seeking (e.g., Plonsky & Teodorescu, Reference Plonsky and Teodorescu2020b; Plonsky et al., Reference Plonsky, Teodorescu and Erev2015), or with ex-post fairness considerations.
Choice rates contingent on events in previous round

Note: Cells in bold font mark the choice rates following the rare events; n marks the number of rounds in which the contingency occurred. Outcomes −100 and +5 pertain to Game Rare Disasters, whereas outcomes −10 and +100 pertain to Game Rare Treasures. In rounds in which P2 chooses RIGHT, P1 does not get information on the outcome of the lottery.
P2s behavior, while of lesser focus in the current study, is also striking (see Figure 3). In Game Rare Disasters, P2s mean LEFT-rate was 63.2%, significantly higher than chance, t(38) = 2.62, p = .012, despite the fact that LEFT is strictly dominated by the alternative. This behavior suggests that P2s strategically choose a dominated action in an effort to get P1s to play IN. This interpretation is supported by the learning curve in Figure 5a, suggesting that in this game, P2s learn to play LEFT more often. In particular, the LEFT-rate in the first block (49.9%) is lower than the LEFT-rate in the last block (65.8%), and the difference is significant: t(38) = −2.96, p = .005. In Game Rare Treasures, P2s mean LEFT-rate was 41.8%, which is not significantly lower than chance (p = 0.11), but it is significantly different than the LEFT-rate in Game Rare Disasters: M = 0.214, 95% CI [0.072, 0.356], t(67.06) = 3.01, p = .003. Notably, however, it is not clear how P2s should behave in this game under the assumption that P1s underweight rare events and hence are unlikely to play IN regardless of P2s actions.
Figures S1 and S2 in the SM show the choice rates over time for each pair of players separately. They show most pairs in Game Rare Disasters (but not in Game Rare Treasures) are converging toward the profile (IN, LEFT), in which both actions are off-equilibrium of the stage game.
3.3. Discussion
The results show that in Game Rare Disasters, P1s tend to play IN with high rates, even though choosing IN leads to losses on average while their outside option provides zero with certainty. This tendency is robust throughout 60 rounds and is not eliminated even in the rounds that immediately follow rounds in which the lottery from IN generates a catastrophic −100 payoff. This type of behavior cannot be explained by many popular models, but it is consistent with the assumption that people behave as if they underweight rare events. Most diagnostically, underweighting of rare events predicts higher IN rates in Game Rare Disasters than in Game Rare Treasures, and the results indeed show a large and significant difference between the IN-rates in the two games. Recall that the only difference between these two games is the risky lottery P1s get when playing IN, and therefore alternative explanations for P1s behavior like boredom, altruism, risk loving preferences, or efficiency concerns cannot fully capture the results.
4. Modelling P1s behavior: The REALS model
As discussed above, it is hard to qualitatively account for the observed behavior in the two games presented above without assuming P1s behave as if they underweight rare events. Yet, it is possible that other factors also come into play. To better understand the different factors that affect behavior in these settings, we decided to develop a computational model that can capture the observed behavior not only qualitatively but also quantitatively.
Our search for such a model starts with the assumption that it must include a mechanism that implies underweighting of rare events. In the literature on individual decision making with feedback, a common modelling approach is to assume participants behave as if they rely on small samples of past experiences (Barron & Erev, Reference Barron and Erev2003; Plonsky et al., Reference Plonsky, Teodorescu and Erev2015). This “reliance on small samples” assertion is the basic tenet in choice models that performed best in a series of competitions to predict human choice behavior (Chen et al., Reference Chen, Liu, Chen and Lee2011; Erev et al., Reference Erev, Ert, Plonsky, Cohen and Cohen2017; Erev et al., Reference Erev, Ert, Roth, Haruvy, Herzog, Hau, Hertwig, Stewart, West and Lebiere2010; Plonsky et al., Reference Plonsky, Apel, Ert, Tennenholtz, Bourgin, Peterson, Reichman, Griffiths, Russell, Carter, Cavanagh and Erev2019), and can explain many behavioral phenomena, including underweighting of rare events (Chater et al., Reference Chater, Zhu, Spicer, Sundh, León-Villagrá and Sanborn2020; Erev et al., Reference Erev, Ert, Plonsky and Roth2023; Fiedler, Reference Fiedler2000; Hertwig & Pleskac, Reference Hertwig and Pleskac2010; Kareev, Reference Kareev2000; Osborne & Rubinstein, Reference Osborne and Rubinstein1998; Rakow & Newell, Reference Rakow and Newell2010; Selten & Chmura, Reference Selten and Chmura2008). To see why, consider a simplistic “reliance on a sample of 5” model (Erev et al., Reference Erev, Ert, Plonsky and Roth2023; Erev & Roth, Reference Erev and Roth2014) in which agents randomly draw five past experiences from memory and then choose the option with the highest payoff average in this (small) set of five experiences. This model captures underweighting of rare events because, for example, 59% of samples of size five that are drawn from a distribution yielding Event E with probability .1 will not include Event E at all, and thus, in most cases, choice will reflect the “neglect” of Event E. Simple models of reliance on small samples, like the sample-of-5 model, have been shown to capture well behavior in symmetric games with rare events (Plonsky et al., Reference Plonsky, Roth and Erev2021; Roth et al., Reference Roth, Plonsky, Shalev and Erev2020), although they are indifferent to the existence of other interacting agents.
Motivated by this extensive literature, we decided to examine the predictions of several simple models that assume reliance on small samples (see SM). Our examination confirmed that such models capture the main qualitative prediction based on underweighting of rare events: higher IN-rates in Game Rare Disasters than in Game Rare Treasures. Quantitatively, the simple reliance on small sample models are also much more accurate than models that assume agents choose to maximize expected value or choose actions that have a higher running average based on the observed outcomes. However, these simple models also all heavily underpredict the IN-rates in both games. That is, participants in Experiment 1 played IN much more than would be expected under simple models of reliance on small samples. Our analysis suggests that this happens because of the social-strategic setting: Playing IN does not guarantee P1s a draw from the risky lottery; their payoffs also depend on the choices of P2. Hence, our results seem to imply that the behavior of P1s is sensitive to the existence of another player in the game, and specifically, that P1s are “friendlier” toward P2s (play IN more frequently) than simple reliance on small sample models assume.
We therefore developed a simplistic model that assumes P1s’ behavior is driven both by a tendency to rely on small samples and by sensitivity to the existence and the behavior of P2s. The model Reciprocal Altruistic Sampler (REALS) assumes P1s’ behavior is a function of three components: payoff-based behavior, social-based behavior, and strategic behavior. Payoff-based behavior is the part of the behavior that is driven directly by the payoffs the player herself obtains in the game. In REALS, this component reflects reliance on small samples (and thus underweighting of rare events). Social-based behavior is the part of the behavior that is driven by the payoffs that the other player can obtain in the game. In REALS, this component reflects “friendliness” toward the other player, or some level of altruism. Strategic behavior is the part of the behavior that is the result of the player’s strategic response to the choices that the other player makes. In REALS, this component reflects a tendency to reciprocate the actions of the other player (Bolton & Ockenfels, Reference Bolton and Ockenfels2000).
Specifically, REALS computes  $U\left( a \right)_t^i$, the utility of agent i from taking action a in round t, as follows:
 \begin{equation*}U\left( a \right)_t^i = {U_{payoff}}\left( a \right)_t^i + {U_{social}}\left( a \right)_t^i + {U_{strategic}}\left( a \right)_t^i\end{equation*}
 Here,  ${U_{payoff}}\left( a \right)_t^i$ is the average payoff that agent i observed action a providing in
  $k_t^i$ rounds that are drawn, at random with replacement, from all rounds 1,…, t − 1. The sample size
  $k_t^i$ is uniformly drawn:
  $k_t^i \sim Uni\left[ {1,\kappa } \right]$ and
  $\kappa $ is a positive integer free parameter to be estimatedFootnote 8;
  ${U_{social}}\left( a \right)_t^i$ is the utility of agent i that is associated with the level of altruism or “friendliness” involved in playing action a in round t; and
  ${U_{strategic}}\left( a \right)_t^i$ is the utility of agent i associated with the level of reciprocity involved in playing action a in round t given the behavior of the other player in rounds 1,…, t − 1. The agent then randomly chooses among actions that maximize
  $U\left( a \right)_t^i$.Footnote 9
In the current games (Figures 1 and 2), we assume for simplicity that for action OUT, in all rounds, all three components are equal to zero. Further, since the payoff of P2s is strictly negative when P1s play OUT, and strictly positive when P1s play IN, we assume 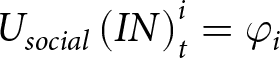 ${U_{social}}\left( {IN} \right)_t^i = {\varphi _i}$ for all t, with
 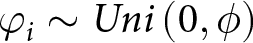 ${\varphi _i} \sim Uni\left( {0,\phi } \right)$ a property of agent i, and
  $\phi \geq 0$ a free parameter capturing the population’s tendency to play altruistically in these games. To compute
 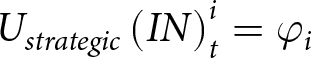 ${U_{strategic}}\left( {IN} \right)_t^i = {\varphi _i}$, we first assume that P1s want P2s to play LEFT (otherwise, playing IN results in a guaranteed negative payoff), and reciprocate such play (or punish alternative play). Specifically, our implementation assumes:
 \begin{equation*}{U_{strategic}}\left( {IN} \right)_t^i = \left\{ {\begin{array}{*{20}{c}}
{ - {\theta _i},\;if\;a_{t - 1}^{P2} = RIGHT} \\
{0,\;if\;a_{t - 1}^{P2} = LEFT}
\end{array}} \right.\end{equation*}
\begin{equation*}{U_{strategic}}\left( {IN} \right)_t^i = \left\{ {\begin{array}{*{20}{c}}
{ - {\theta _i},\;if\;a_{t - 1}^{P2} = RIGHT} \\
{0,\;if\;a_{t - 1}^{P2} = LEFT}
\end{array}} \right.\end{equation*} Where  $a_{t - 1}^{P2}$ is the action chosen by P2 in round t − 1,
 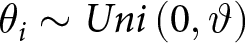 ${\theta _i} \sim Uni\left( {0,\vartheta } \right)$ a property of agent i, and
  $\vartheta \geq 0$ is a free parameter capturing the population’s tendency to reciprocate (or punish) in these games. That is, we assume P1s have a disutility from playing IN following rounds in which P2s choose RIGHT.Footnote 10
In total, REALS includes three free parameters, one for each mechanism that it assumes drives behavior. It is easy to find values for these three free parameters that would make it capture well the two aggregate IN-rates of P1s in Experiment 1.Footnote 11 However, we chose instead to examine the model’s main assertions experimentally, using Experiments 2 and 3.
5. Experiments 2 and 3
5.1. Method
The goal of Experiments 2 and 3 was to evaluate the different factors driving the behavior of P1s in the games above, as per the assumptions of REALS. To that end, both experiments included three conditions: Strategic, Dictator, and Individual. Condition Strategic was a within-subject conceptual replication of Experiment 1. In Condition Dictator, we eliminated the strategic component of the decisions of P1s. While P2s were still part of the game, they were passive players, assigned to play LEFT in every round. Hence the difference between the behavior of P1s in Condition Strategic and Condition Dictator should reflect the strategic component of the utility of P1s from playing IN. In Condition Individual, we further eliminated the social component of the decisions of P1s. In this condition, P1s were engaged in an individual choice task, without having their choices impact the payoff of another player. Hence the difference between the behavior of P1s in Condition Dictator and Condition Individual should reflect the social component of the utility of P1s from playing IN. By comparing the behavior of P1s across the three conditions we could thus disentangle the three factors that REALS assumes drive choice in these games. The two experiments were identical to one another, with the exception that Experiment 2 was run online using a crowdsourcing platform, whereas Experiment 3 was run in a physical lab with a student population.
5.1.1. Procedure
The procedures used in Experiments 2 and 3 are identical. Participants played variants of both the Rare Disasters game (Figure 1) and the Rare Treasures game (Figure 2) in one of three conditions: Strategic, Dictator, and Individual. A session included either only Condition Strategic or both Condition Dictator and Condition Individual. Sessions of Condition Strategic were similar to Experiment 1, with the exception that players played both games within-subject in a counter-balanced order. As in Experiment 1, participants in these sessions were randomly allocated to the role of P1 or the role of P2. They remained in that role for both games. However, partners were replaced between the two games, such that each participant played each game with a different fixed partner.
In sessions that included the other two conditions (Dictator and Individual), participants were randomly allocated to play in either Condition Dictator or Condition Individual. In Condition Dictator, all participants (all playing as P1) were aware that their decisions affect both their own payoffs and the payoffs of another passive player they were paired with. The games in this condition were equivalent to the Rare Disasters and Rare Treasures games from Condition Strategic, under the constraint that P2s are obligated to choose LEFT. For example, in the Rare Disasters game here, every IN choice resulted in a payoff of “5 with probability .9 and −100 otherwise” for P1 and +5 for (passive) P2. In Condition Individual, the payoff structure of P1s was identical to that of Condition Dictator, however, participants (again, all P1s) played alone and were not paired with another player. To avoid deceit, all participants allocated to Condition Individual were also automatically assigned as P2s in the Dictator condition (i.e., each person was paired with a player from Condition Dictator that determined part of their payoff). Participants knew that their final bonus will also depend on the decisions made by another person participating in that experiment, but did not know how this additional payoff was determined.
Other than the allocation to the different conditions, we implemented several modifications to the experimental paradigm from that of Experiment 1. First, we added the current round number on screen at all times. This ensured that participants could easily know exactly how many rounds they have left in the game. Second, participants were required to answer one (open text) comprehension question concerning the payoff structure before each game (for a total of two such questions in the session), and were unable to progress to the game without answering the question correctly (i.e., when inserting a wrong answer, they were prompted to read the instructions again and provide a new answer). This helps ensure that all participants understand the described payoff structure before the games start. Participants failed to correctly answer the comprehension question on their first attempt in 14.1% and 15.6% of the cases in Experiment 2 and Experiment 3 respectively. Before providing the correct answer that allowed them to progress, they gave 0.4 wrong answers in Experiment 2 and 0.24 wrong answers in Experiment 3, on average. Third, we changed the names of the actions of P1s from IN and OUT to HEADS and TAILS, respectively. This helps ensure a more neutral framing of these actions. Note however, that in our analysis we continue to call these actions IN and OUT for consistency. Finally, we increased the penalty provided when not adhering to the deadline to 3 points. The increase in penalty may have been effective: While in Experiment 1, participants did not respond in time in 2.2% of the rounds, in Experiments 2 and 3, these rates dropped to 0.8% and 0.4% of the rounds respectively (0.8% and 0.5% when considering Condition Strategic only). The median time for completion of the experiment in full (including wait times) was 34.5 (IQR = 10.1) and 29 (IQR = 5.8) minutes in Experiments 2 and 3 respectively.
5.1.2. Participants
Participants in Experiment 2 were recruited from Prolific. In total, 180 participants (113 males, 66 females; M age = 40.1, SD age = 11.8) started the experiment. Of these, 46 were assigned to Condition Individual, 46 were assigned to Condition Dictator, and 88 were assigned to Condition Strategic (44 to the role of P1 and 44 to the role of P2). Two participants in Condition Dictator, paired with each other, stopped responding midway through the experiment. Further, as in Experiment 1, we excluded from the analyses data from games in which a participant timed out in more than 10% of the rounds. In Condition Strategic, but not in the other conditions, this implied the exclusion of data from both players of the pair in that game. After these exclusions, we were left with: (a) in Condition Strategic, data for 43 pairs in Game Rare Disasters and for 42 pairs in Game Rare Treasures; (b) in Condition Dictator, data for 45 players in Game Rare Disasters and for 46 players in Game Rare Treasures; and (c) in Condition Individual, data for 45 players in both games. Participants received a show up fee of £5.50, and an additional bonus composed of an endowment of 105 points and the payoff received in one randomly selected round, at a conversion rate of 44 points to £1. The average bonus was £2.33 (SD = 0.27).
In Experiment 3, we recruited 128 students from the Technion (77 males, 51 females; M age = 24.03, SD Age = 2.5) through a centralized experiment system (Sona). They were randomly assigned to one of the three conditions: 32 participants in Condition Individual, 32 in Condition Dictator, and 64 in Condition Strategic (32 to the role of P1 and 32 to the role of P2). In this experiment, none of the participants dropped out or timed out in more than 10% of the rounds, and thus all participants were included in the analyses. Participants received course credit. In addition, participants were paid the equivalent of the sum of an initial endowment of 100 points and the points they earned in one randomly selected round, with each point worth 0.2 NIS. The average payment was 20.35 NIS (SD = 4.83), equivalent to approximately $5.50.
5.1.3. Data analysis
As in Experiment 1, we computed, for each participant, the IN-rate (or the LEFT-rate), which is the proportion of rounds in which the participant chose IN (LEFT) out of all rounds in which the participant made a choice in time. To analyze the difference between the behavior of P1s in the three conditions, we implemented, using restricted maximum likelihood methods and packages lme4 (Bates et al., Reference Bates, Mächler, Bolker and Walker2014) and lmerTest (Kuznetsova et al., Reference Kuznetsova, Brockhoff and Christensen2017) in R, linear mixed-effects models with random factor for participant and fixed effects for game (2 levels), for condition (3 levels), and for their interaction. To analyze the interaction, we used estimated marginal means using R package emmeans (Lenth, Reference Lenth2018), making pairwise comparisons of conditions within game, and report p-values adjusted for multiple comparisons using Tukey method.
5.2. Results
5.2.1. Experiment 2
We start by presenting the results of Condition Strategic alone, as it serves as a within-subject replication of Experiment 1. Figure 6 shows the rates of off-equilibrium play for both players in both games. The pattern from Experiment 1 is largely replicated, although the effects are smaller. Specifically, in Game Rare Disasters, the mean IN-rate was 56.3%, which is not significantly greater than chance, t(42) = 1.18, p = .244. In Game Rare Treasures, the mean IN-rate was 37.3%, which is significantly lower than chance, t(41) = − 2.09, p = .043. More importantly, however, is the fact that when considering the within-person difference between the IN-rates of the two games, the average difference is large and significant: M = 0.206, 95% CI [0.079, 0.332], t(40) = 3.28, p = .002, suggesting the average participant chose to play IN more often in the Rare Disasters game than in the Rare Treasures game, as is predicted by a tendency to underweight rare events. This observation is particularly striking given that the average observed payoff from playing IN in Game Rare Disasters (M = −6.14, which is itself significantly lower than the outside payoff of zero, p < .001) was lower than the average observed payoff from playing IN in Game Rare Treasures (M = −4.66, also significantly lower than zero, p < .001), and this (within-person) difference is significant: t(40) = −3.15, p = .003. That is, participants played IN more frequently in Game Rare Disasters, although the average payoff they saw IN generates in that game was lower.
The IN-rates (P1s) and LEFT-rates (P2s) in Condition Strategic of Experiment 2. Each dot is the choice rate of one person. Diamonds represent the mean aggregate choice rates and error bars correspond to 95% CI for the mean

The somewhat lower IN-rate in Game Rare Disasters here (compared to Experiment 1) may be explained by the fact that P2s in this game exhibited mean LEFT-rates of 50.6%, notably lower than the LEFT-rate in the same game in Experiment 1. However, this still implies that about half of the choices were deviations from a dominant strategy. In Game Rare Treasures, P2s mean LEFT-rate was 42.9%. Both LEFT-rates are not significantly different than 50% (ps > .20).
We also analyzed Condition Strategic in this experiment for the average obtained payoff tuples, for behavior over time, and for participants’ sequential behavior contingent on last round’s events. Given that the results parallel the main findings of these analyses in Experiment 1, we present them in the SM.
We next turn to the comparison of the IN-rates across the three conditions. Figure 7 shows these rates for each of the conditions in each of the games. Consistent with the idea of underweighting of rare events, the results of a linear mixed-effects model (see SM for full regression table) show a main effect for game, χ 2(1) = 74.9, p < .001, with a large and significant difference between the IN-rate in the Rare Disasters game (M = 66.7%) and the IN-rate in the Rare Treasures game (M = 37.1%) when averaging across conditions, t(130) = 8.59, p < .001. The statistical model also shows a main effect for condition, χ 2(2) = 6.83, p = .033. Averaging over the two games, the IN-rate in Condition Dictator (M = 60.3%) is higher than in Condition Strategic (M = 46.9%) and in Condition Individual (M = 48.1%), although the pairwise differences are only marginally significant (p = .056 and p = .082 respectively). Yet, the effect of condition is different in the two games, as indicated by a significant interaction between game and condition χ 2(2) = 6.61, p = .037. Post-hoc tests show that in Game Rare Disasters, the IN-rate in Condition Strategic (M = 56.3%) is significantly different than the IN-rate in Condition Dictator (M = 74.7%), t(239) = −2.51, p = .034. This difference suggests that in this game, the additional strategic element of the game (the fact that the players’ payoffs depend also on the choices of another player) lowers the IN-rate. Note that this is consistent with the conjecture that in the Rare Disasters game P1s prefer to play IN as long as their outcome is a draw from the bad (negative EV) lottery. Yet, the IN-rate of Condition Individual (M = 68.7%) is not significantly different than the IN-rates in the other two conditions (ps > .22). Specifically, this suggests that the addition of the social component (the fact the players’ choices impact the payoff of another person) does not influence behavior in the Rare Disasters game.
The In-rates in Experiment 2. Each dot is the in-rate of one person. Diamonds represent the mean aggregate IN-rates and error bars correspond to 95% CI for the mean

In contrast, in Game Rare Treasures, the IN-rate in Condition Individual (M = 27.4%) is significantly different than the IN-rate in Condition Dictator (M = 46.3%), t(237) = 2.64, p = .024. One potential reason for the discrepancy between the games in the impact of the addition of the social component is a ceiling effect in the Rare Disasters game. The IN-rate of Condition Strategic (M = 37.3%) is not significantly different than the IN-rates in the other two conditions in the Rare Treasures game (ps > .37), implying that here the addition of the strategic component has little influence on P1s behavior. A possible explanation here would be that P1s who choose to play IN in this game are relatively indifferent to P2s choices, as with any P2 choice their payoff is unfavorable.
5.2.2. Experiment 3
Again, we start with the results of Condition Strategic alone. Figure 8 shows the rates of off-equilibrium play for both players in both games. The IN-rates of P1s in this experiment are markedly lower than in the other experiments. In Game Rare Disasters, the mean IN-rate was 38.7%, and in Game Rare Treasures, the mean IN-rate was 18.9%, both significantly lower than chance: t(31) = −2.19, p = .036, and t(31) = −9.61, p < .001, respectively. This result suggests that in this experiment, participants played much more in accordance with the prescribed action in equilibrium of the stage game. Importantly, however, they did not play similarly in the two games. Consistent with the prediction of an impact to underweighting of rare events, the average within-person difference between the IN-rates of the two games is large and significant: M = 0.198, 95% CI [0.088, 0.307], t(31) = 3.69, p < .001. This suggests P1s chose IN more when such choice allowed for a (bad) lottery with frequent good outcomes than when it allowed for a (also bad, but slightly better) lottery with large but rare good outcomes. Again, this is despite the fact that the average observed payoff from playing IN in Game Rare Disasters (M = −5.55) was lower than the average observed payoff from playing IN in Game Rare Treasures (M = −4.42), with a marginally significant within-person difference, t(31) = −1.83, p = .076.
The IN-rates (P1s) and LEFT-rates (P2s) in Condition Strategic of Experiment 3. Each dot is the choice rate of one person. Diamonds represent the mean aggregate choice rates and error bars correspond to 95% CI for the mean

P2s in this experiment exhibited very similar LEFT-rates to those from Experiment 2: 50.2% in Game Rare Disasters and 44.6% in Game Rare Treasures. Both rates are not statistically different from chance (ps > .36). Again, we present the analysis of tuple payoffs, of learning, and of contingent sequential play in the SM.
Figure 9 shows the comparison of IN-rates between the three conditions. The results of a linear mixed-effects model (see SM) show, again consistent with underweighting of rare events, a significant main effect for game, χ 2(1) = 69.8, p < .001, with a large and significant difference between the IN-rate in the Rare Disasters game (M = 53.5%) and the IN-rate in the Rare Treasures game (M = 24.4%) when averaging across conditions, t(93) = 8.36, p < .001. In addition, the results show a main effect for condition, χ 2(2) = 9.73, p = .008. Averaging over the two games, the IN-rate in Condition Strategic (M = 28.9%) is significantly different than the IN-rate in Condition Dictator (M = 44.1%), t(93) = −2.71 p = .021, and also significantly different than the IN-rate in Condition Individual (M = 43.9%), t(93) = −2.70 p = .023. The difference between conditions Dictator and Individual is non-significant (p > .99). Furthermore, the interaction between game and condition is not significant, χ 2(2) = 4.0, p = .135. This suggests that in this experiment, the strategic component of the games had an influence on P1s behavior, reducing their IN-rates, but the social component of the games did not appear to make much of a difference.
The IN-rates in Experiment 3. Each dot is the in-rate of one person. Diamonds represent the mean aggregate IN-rates and error bars correspond to 95% CI for the mean

5.3. REALS model
We use a cross-validation procedure to fit the model REALS to some of the data in Experiments 2 and 3, and use the fitted model to predict the aggregate choice of out-of-sample participants. Specifically, we divided the participants in each experiment to five mutually exclusive folds and iterated over the folds, each time using four of the folds as training data and the held-out fold as the test data. That is, in each iteration, we fitted the model’s parameters to data of 80% of the participants and generated the fitted model’s predictions for the behavior of the other participants. Our estimates for the best-fit parameters are the median (for κ, an integer) or average (for φ and θ, real numbers) of the best fit values across the five iterations, and the model’s predicted choice rates are the aggregated out-of-sample predictions.
Recall that the model REALS assumes players’ behavior in the type of games we present here is driven by three separable and independent components, Upayoff, Usocial, and Ustrategic, which involve each one free parameter to estimate. Together with the experimental design of Experiments 2 and 3, this property allows us to fit REALS to the (training) data in these experiments in a sequential manner (see similar approach in Marchiori et al., Reference Marchiori, Di Guida and Erev2015). Specifically, we first use the data in Condition Individual to estimate  $\kappa $, the parameter involved in setting Upayoff. Then, with
  $\kappa $ fixed, we use the data in Condition Dictator to estimate
  $\phi $, the parameter involved in setting Usocial. Finally, with both
  $\kappa $ and
  $\phi $ fixed, we use the data in Condition Strategic to estimate
  $\vartheta $, the parameter involved in setting Ustrategic. By using this sequential procedure, we enforce (and test) the independence of the three components of the model.Footnote 12
We used a grid search over the parameter space, aiming to minimize the mean squared deviation of the model from the training data. To derive the model’s predictions under a given set of parameter values, we simulated, for each participant, 1000 REALS agents observing the actual sequence of payoffs observed by the participant (recall the feedback includes both the obtained and forgone payoffs of players), and in Condition Strategic, also the actual choices P2 made in each round. REALS prediction was then the average behavior of these 1000 agents. The best fit parameters and the out-of-sample predictions of the fitted model are shown in Table 2. It shows REALS captures the results of all conditions in both experiments (2 & 3) very well. We now turn to discuss each component of REALS separately with respect to the data.
Observed and predicted in-rates in Experiments 2 and 3

Note: REALS is the Reciprocal Altruistic Sampler model presented in Section 4. Estimated parameters are the median (for κ) or average (for φ and θ) of the best fit values in the training sets of a 5-fold cross validation procedure. REALS predictions the aggregate out-of-sample predictions on the validation sets of that procedure.
The first component of REALS, Upayoff, assumes reliance on the outcomes obtained in a sample of  $K_t^i \le \kappa $ past experiences. When κ is small, Upayoff will reflect behavior that is consistent with underweighting of rare events. Indeed, κ here is estimated to be only 10 in both experiments, implying that the average sample size is less than six. In particular, REALS correctly predicts the large observed difference in behavior between Game Rare Disasters and Game Rare Treasures, with higher IN-rates in the former (where underweighting of rare events implies choice of IN) than in the latter (where underweighting of rare events implies choice of OUT). This is particularly true for Condition Individual where REALS assumes Upayoff determines choice.
The second component of REALS, Usocial, implies a tendency to play altruistically when decisions impact another player. Here, this is formulated as an added utility  $0 \le {\varphi _i} \le \phi $ from choosing IN. Hence, this component predicts higher IN-rates in Condition Dictator than in Condition Individual (for positive
  $\phi $). Furthermore, REALS implies that this effect would be stronger in games like Game Rare Treasures than in games like Game Rare Disasters. To see why, consider the following. First, note that the addition of Usocial will only impact the choice behavior of the agent when
  ${U_{payoff}}\left( {IN} \right) \le 0$ (otherwise, the agent selects IN regardless of Usocial). Second, in the Dictator and Individual conditions of Game Rare Disasters,
  ${U_{payoff}}\left( {IN} \right) \le 0$ only happens when the sample of past experiences that is selected includes the rare and very bad event (−100), which would almost always result in
  ${U_{payoff}}\left( {IN} \right)$that is negative and large in absolute value. In contrast, in the Dictator and Individual conditions of Game Rare Treasures,
  ${U_{payoff}}\left( {IN} \right) \le 0$ occurs frequently (many past experiences’ payoffs are −10), but this component of utility is often small in absolute value. Hence, for a given
  ${\varphi _i} \gt 0$, the addition of Usocial will change behavior (prescribe choice of IN although
  ${U_{payoff}}\left( {IN} \right) \le 0$) in many cases in Game Rare Treasures but in only few cases in Game Rare Disasters. Interestingly, this asymmetric prediction of the model is confirmed by the data of Experiment 2 (see Section 5.2.1.). In Experiment 3, there is very little difference between Condition Individual and Condition Dictator in both games. Congruently, the estimate of
  $\phi $ in this case is near zero.
The third component of REALS implies reciprocation for the actions of the other player, formulated here as decreased utility  $0 \le \theta _i^t \le \vartheta $ from playing the “friendly” or pro-social action IN after the other player plays its “unfriendly” or selfish action RIGHT. Notably, since in Condition Strategic the payoffs P1 gets from playing IN strongly depend on the choices made by P2, our experimental design does not allow distinguishing between P1’s choices that are a result of a process of reciprocation of P1 to the actions of P2 and P1’s choices that are a result of P1 replying to the different payoffs she obtains. Specifically, P1s behavior in Condition Strategic can be very different than their behavior in Condition Dictator even if P1s do not try to reciprocate at all, but only try to respond to the payoffs they get. The model REALS, however, does allow accounting for both processes. Because we fit the model on the payoffs that P1s observe and because we perform the fitting procedure sequentially (as explained above), the model already accounts for the payoff-based utility in Condition Strategic when it aims to estimate the strategic-based utility (i.e., reciprocation). Indeed, in Experiment 3, we get best fit with
  $\vartheta = 0.2$ implying virtually no process of reciprocation. This is despite the very different behavior observed in Condition Strategic and the other conditions in this experiment, a difference which is apparently due to the different payoffs P1s get in this condition. In contrast, in Experiment 2, REALS’ assumption of reciprocation appears to be of significant value. Specifically, because of the relatively high estimated value of
  $\phi $, which implies high levels of altruism, a model without reciprocation would predict high IN rates even when P2 chooses RIGHT in every round: In such cases, the payoff-based utility of P1 would be equal to −5 (all past experiences from IN imply this payoff), and the social-based utility will likely be sufficient to make the total utility positive.Footnote 13 Thus, if we assume P1 prefers P2 to choose LEFT over RIGHT, the model must explicitly account for it.
In the SM, we present the results of a sensitivity analysis for the model’s assumptions. Specifically, we implemented three reduced and simplified versions of REALS. Each reduced model captures two of the three main assumptions embedded in REALS, and includes only two of the full model’s three free parameters. Note that we compare the models based on their out-of-sample predictive accuracy, so the removal of a parameter may lead to more accurate models. The results of this sensitivity analysis show that the removal of either parameter greatly reduces both the qualitative and the quantitative accuracy of the model. This suggests that all components of REALS are useful for both explaining and predicting behavior in our experiments.
5.4. Discussion
The results of both experiments (2 & 3) and the modelling exercise are consistent with the hypothesis that players in these games behave as if they underweight rare events. Specifically, we find consistent experimental evidence that players play IN more frequently in Game Rare Disasters than in Game Rare Treasures, where the only difference is the lottery they can obtain when playing IN. This difference is qualitatively predicted by a tendency to underweight rare events, but is hard to explain with classical models of choice. Furthermore, the model REALS that implies reliance on small samples (and underweighting of rare events) quantitatively captures well all the experimental results.
The IN-rates in Experiment 3 could probably all be predicted very well using a one-parameter model that assumes reliance on small samples and implies underweighting of rare events: The best fit parameters for the social-based and the strategic-based utilities are near zero (and see sensitivity analysis in the SM). Congruently, the experimental results in that experiment do not suggest participants in Condition Individual and those in Condition Dictator behave differently. The difference of these conditions from Condition Strategic can thus be attributed to the different payoffs P1s observe from playing IN that are due to their co-dependency in P2s’ choices. Note this also helps explain why the fact that the IN-rate in the Strategic condition of Game Rare Disasters in this experiment is below 50% does not imply that participants do not behave as if they underweight rare events.
Our results seem to imply that in Experiment 3 participants are not too concerned with the fact that their actions impact another person. Experiment 2 is different. In that experiment, we get a higher IN-rate in Condition Dictator than in Condition Individual, at least in Game Rare Treasures, and the model REALS implies strong social-based utility. This difference between the two experiments surprised us. If anything, we expected the opposite result based on the ideas that higher social distance (Bohnet & Frey, Reference Bohnet and Frey1999) and higher levels of anonymity (Bolton & Zwick, Reference Bolton and Zwick1995) decrease prosocial behavior. Indeed, a recent study showed higher levels of prosocial behavior in a physical vs. a virtual lab (Prissé & Jorrat, Reference Prissé and Jorrat2022). One possible explanation for this result is a difference in populations. In Experiment 3, all participants were students and generally younger than the non-student sample used in Experiment 2. Congruently with our results, recent studies suggest that young student participants are generally more selfish than older non-student participants (Belot et al., Reference Belot, Duch and Miller2015; Kettner & Waichman, Reference Kettner and Waichman2016).
6. General discussion
To successfully implement interventions and policies in various domains, it is imperative we have a good understanding of the major factors that influence decisions whose outcomes depend both on chance and on decisions of other people. Yet, basic research on these types of decisions is uncommon. In this study, we aim to start filling this gap by focusing on the impact of rare events in repeated games with probabilistic payoffs. This focus on rare events stems from the fact that a similar approach led to significant theoretical and empirical advances in individual decision making. Specifically, that approach has highlighted that human learning diverges from that assumed in many classical learning models that converge toward maximization. Rather, it has uncovered a highly robust tendency to choose as if rare events are underweighted and given rise to a class of surprisingly accurate learning models that assume reliance on small samples of past experiences. Our results demonstrate that a tendency to behave as if rare events are underweighted extends to 2-player asymmetric games and that a model that assumes reliance on small samples can capture successfully choice behavior in these games.
In Experiments 2 and 3, we manipulated the level of social/strategic uncertainty involved in the decisions of P1s. The level of environmental uncertainty P1s face is mainly manipulated between the two games that the participants play. The results highlight the strong impact of the latter: much higher IN-rates in the Rare Disasters than in the Rare Treasures game. In line with previous claims that compare the two forms of uncertainty (Rapoport et al., Reference Rapoport, Budescu, Suleiman, Weg, Liebrand, Messick and Wilke1992), the effects we find for manipulating the social uncertainty across the Strategic, Dictator, and Individual conditions are far more modest. This observation highlights the importance of considering the environmental uncertainty involved when analyzing strategic situations that very rarely do not involve any form of risk or chance.
Our results also reveal interesting interaction effects between environmental and social uncertainties, challenging the common practice of studying these factors in isolation. For instance, in Experiment 2, we observed an asymmetric effect when increasing the level of social influence: adding a social element to an individual choice setting significantly impacted behavior in the Rare Treasures game, but not in the Rare Disasters game, while making a social game strategic was significant in the Rare Disasters game, but not in Rare Treasures. This suggests that examining environmental and social uncertainties independently may limit our understanding and ability to predict behavior in such contexts. Interestingly, the model REALS assumes independence of the impact of the two forms of uncertainty; yet, its predictions concerning choice capture well these non-trivial interaction effects.
While REALS can capture the aggregate choice rates across experiments and conditions well, it is clearly too simplistic to provide a full valid account of players’ behavior in these settings. For example, it assumes payoff-based behavior is only a function of the realized outcomes although participants have full access to the payoff structure of the game before they ever see any outcomes realized. Similarly, the level of altruism participants are assumed to exhibit does not change throughout the game, although participants probably change it as a function of the payoffs and of their partners’ behavior. REALS also cannot capture the intriguing conditional choice rates showing higher IN rates immediately after a small loss than immediately after a large win in Game Rare Treasure (see Table 1 and SM). Further, the analysis of the conditional choice rates in Experiments 2 and 3 (see SM) shows that this pattern differs across experimental conditions, suggesting additional interaction effects between the forms of uncertainty that REALS cannot capture. Nevertheless, REALS is useful for interpreting the main impacts of environmental and social uncertainties.
Previous studies that combine social and environmental uncertainty have commonly demonstrated that the addition of environmental uncertainty to a strategic context diminishes cooperation (e.g., Aoyagi & Fréchette, Reference Aoyagi and Fréchette2009; Bereby-Meyer & Roth, Reference Bereby-Meyer and Roth2006; Levati et al., Reference Levati, Morone and Fiore2009; Rapoport et al., Reference Rapoport, Budescu, Suleiman, Weg, Liebrand, Messick and Wilke1992). In the current study, we do not directly compare behavior in our games to equivalent games without environmental uncertainty. However, this comparison can be made using a simple thought experiment. Assume that we replace the lottery options of P1 with their expected values. In Game Rare Disasters (Figure 1), this implies P1 would have to choose between an outside option of zero and playing IN that pays either −5.5 or −5 (depending on the choice of P2). It is hard to imagine that the IN-rates in such a game would be anywhere near the IN-rates we see in the probabilistic payoff version of the game that we run. Lower IN-rates in a deterministic version of this game would then provide a counterexample for the common finding that adding environmental uncertainty reduces cooperation.
Our demonstration of the relevance of the phenomenon of underweighting of rare events in strategic games is limited to the games and the design we used. Future research should aim to investigate the robustness and generality of the phenomenon in more games and using different designs. For one, in our design, pairs were fixed throughout the entire sequence of each game. This design has the advantage of allowing players to learn and respond to the preferences of their partners. For example, in a typical pair, P2 could learn that P1 behaves as if she underweights rare events and adjust his choices accordingly. In turn, this allows us to directly examine the reaction of P2s to such behavior. Yet, a design in which players change partners in each round also has advantages. Specifically, it more carefully examines the one-shot interaction between the players who do not need to worry about their actions impacting future partner behavior. This may lead P2s to play LEFT in lower rates, and the IN rates would thus also be reduced. We plan to extend the current research to this setting in future research.
Another design choice worthy of further examination concerns our use of potential losses in the games, which is somewhat uncommon in experimental strategic games. This design choice allowed us to use zero payoff as P1’s outside option, thus maintaining a neutral reference point with respect to this outside option. Future studies can examine the impact of adding a constant to all payoffs so that all payoffs are positive. Such a change would on one hand increase the attractiveness of P1s’ outside option and thus can decrease the tendency to behave as if underweighting rare events. On the other hand, it is possible that in our games, P1s were actually more hesitant to play IN because they were averse of the potential losses. Moreover, adding a constant to the payoffs of P2s may decrease the perceived attractiveness of P2s’ dominant action (RIGHT) relative to the dominated one. In turn, this may increase the attractiveness of P1s playing IN. Hence, there are contradictory predictions regarding the potential impact of the addition of a constant to all payoffs, and it is unclear how such a change would impact the apparent tendency of P1s to behave as if they underweight rare events.
Finally, in our experiments, stakes were relatively low, with choice-contingent bonus payments averaging no more than $5.50. Future studies should examine if the results replicate when stakes are higher. Notably, however, studies suggest that stake size has limited impact on behavior in choice experiments (Amir et al., Reference Amir, Rand and Gal2012; Brañas-Garza et al., Reference Brañas-Garza, Estepa-Mohedano, Jorrat, Orozco and Rascón-Ramírez2021). We thus expect that an increase in stakes will not impact our results considerably.
The importance of studying strategic games with rare events is not purely theoretical. Although our games are abstract, they can be used to explain certain patterns of real-world interactions. For example, Game Rare Disasters can be thought of as an abstraction of an interaction between service providers and potential clients like patients and physicians. In every round, the patient (P1), who has a minor illness that will pass without treatment, decides whether to go to the physician (IN) or to stay at home (OUT). If she goes, the physician (P2), who correctly diagnoses that treatment is unnecessary, decides whether to tell that to the patient and ask her to go home (RIGHT) or to give her unnecessary treatment or unnecessary further testing (LEFT). The game payoffs reflect the ideas that (a) the patient is happier if the physician acknowledges her pain by providing treatment, (b) most of the time, unnecessary treatment does no harm, but it might lead to a disaster, and (c) the physician prefers not to give any unnecessary treatments but prefers to prescribe such treatments over not getting clientele. Seen within this framework, the dynamics of the abstract game provide a sufficient explanation for the emergence of medical overtreatment: a tendency of patients to underweight the rare adverse effects of unnecessary tests and treatments, and (some) physicians’ response to this tendency. Similarly, the game may also abstract interactions between clients and other service providers like financial advisors, private tutors, or auto mechanics.
In conclusion, the study of the joint impact of both environmental and social uncertainty can lead to important insights and improve our understanding of many real-world situations. Our study adds to this rather small literature by directly considering the role of rare events in such interactions. We find significant evidence that, as in individual choice settings, rare events are underweighted in repeated strategic choice, but also that the transition from individual to social and strategic settings changes behavior even in the presence of rare events. Our study thus highlights the importance of continued efforts to explore the under-explored world of games with both types of uncertainty.
Supplementary material
The supplementary material for this article can be found at https://doi.org/10.1017/eec.2025.3.
Replication material
The replication material for the study is available at https://doi.org/10.17605/OSF.IO/HWZ6G.
Acknowledgements
The authors thank Lior Bakalo, Ido Erev, Todd Kaplan, and Ro’i Zultan for valuable discussions.
Funding statement
Ori Plonsky acknowledges support from the Israel Science Foundation (grant no. 2390/22).
Competing interests
The authors have no conflict of interests to report.


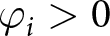
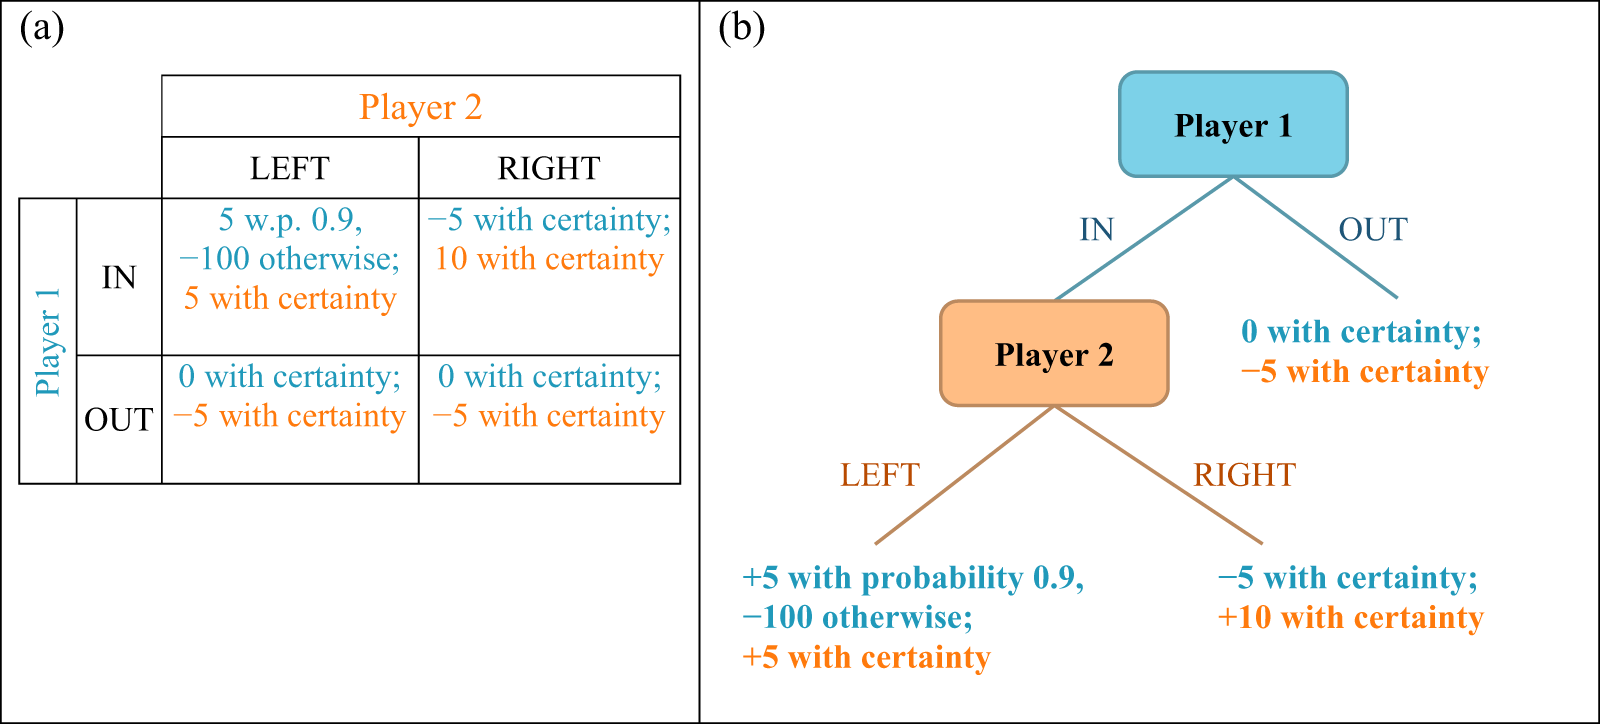
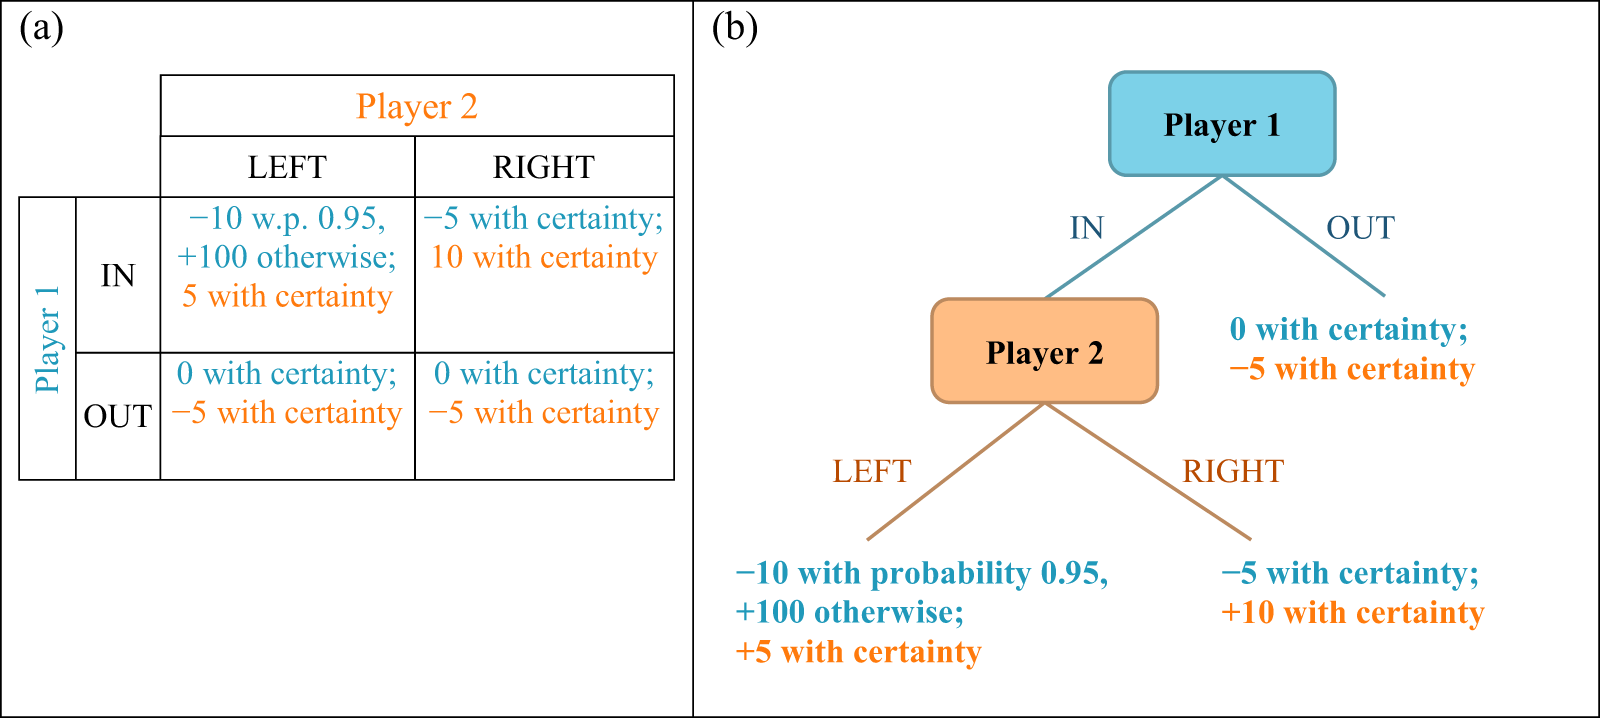
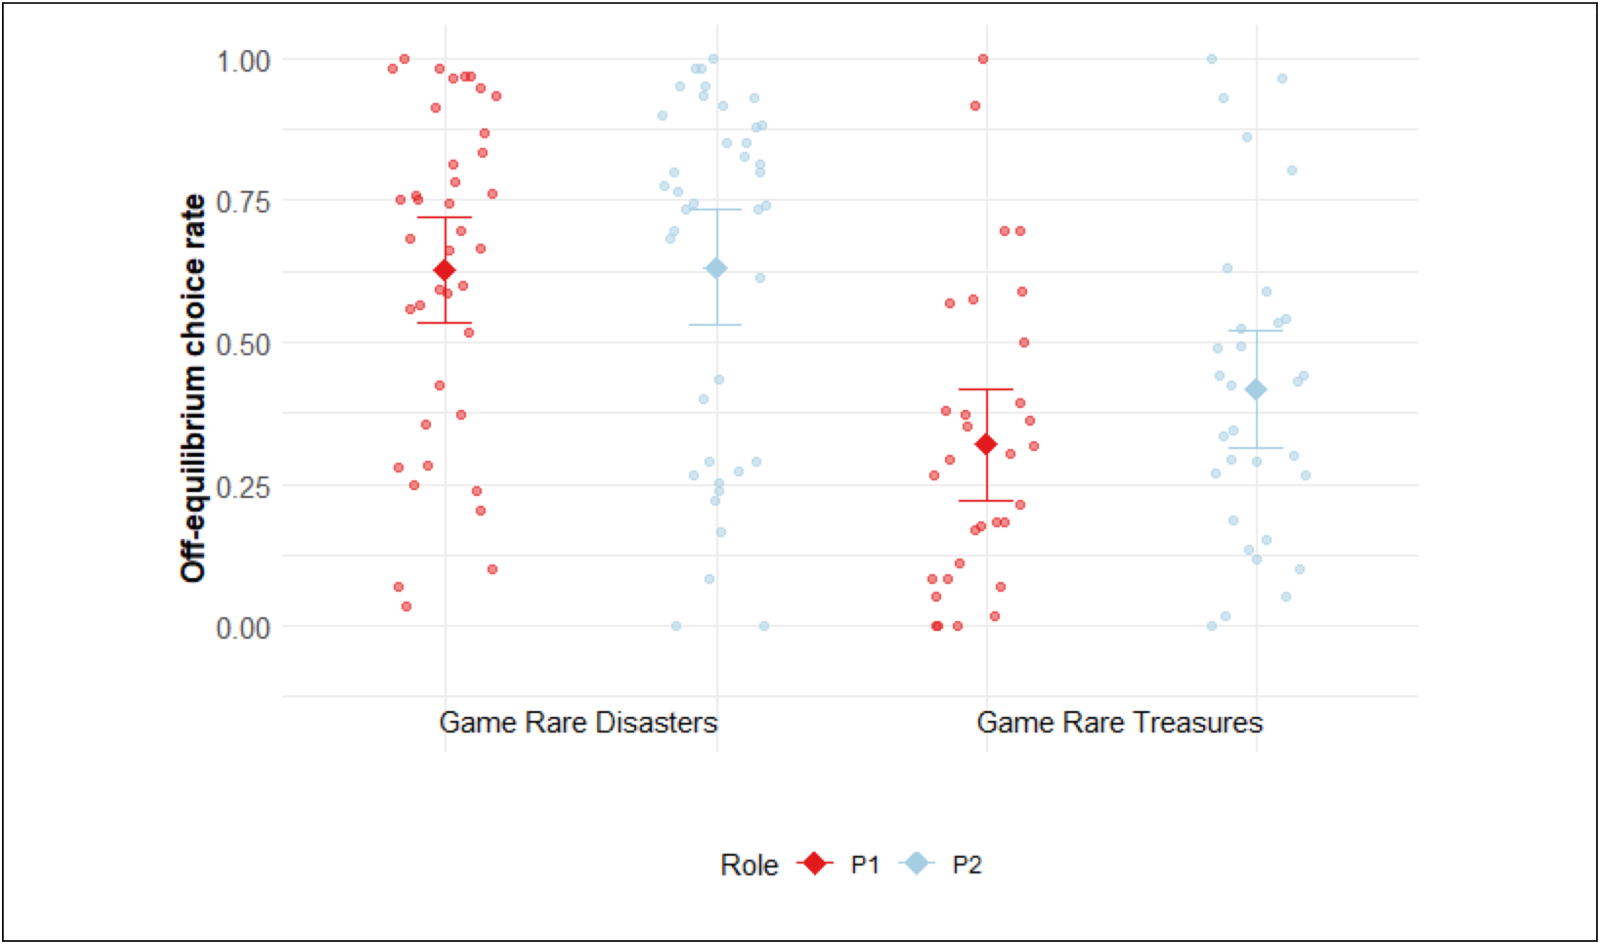
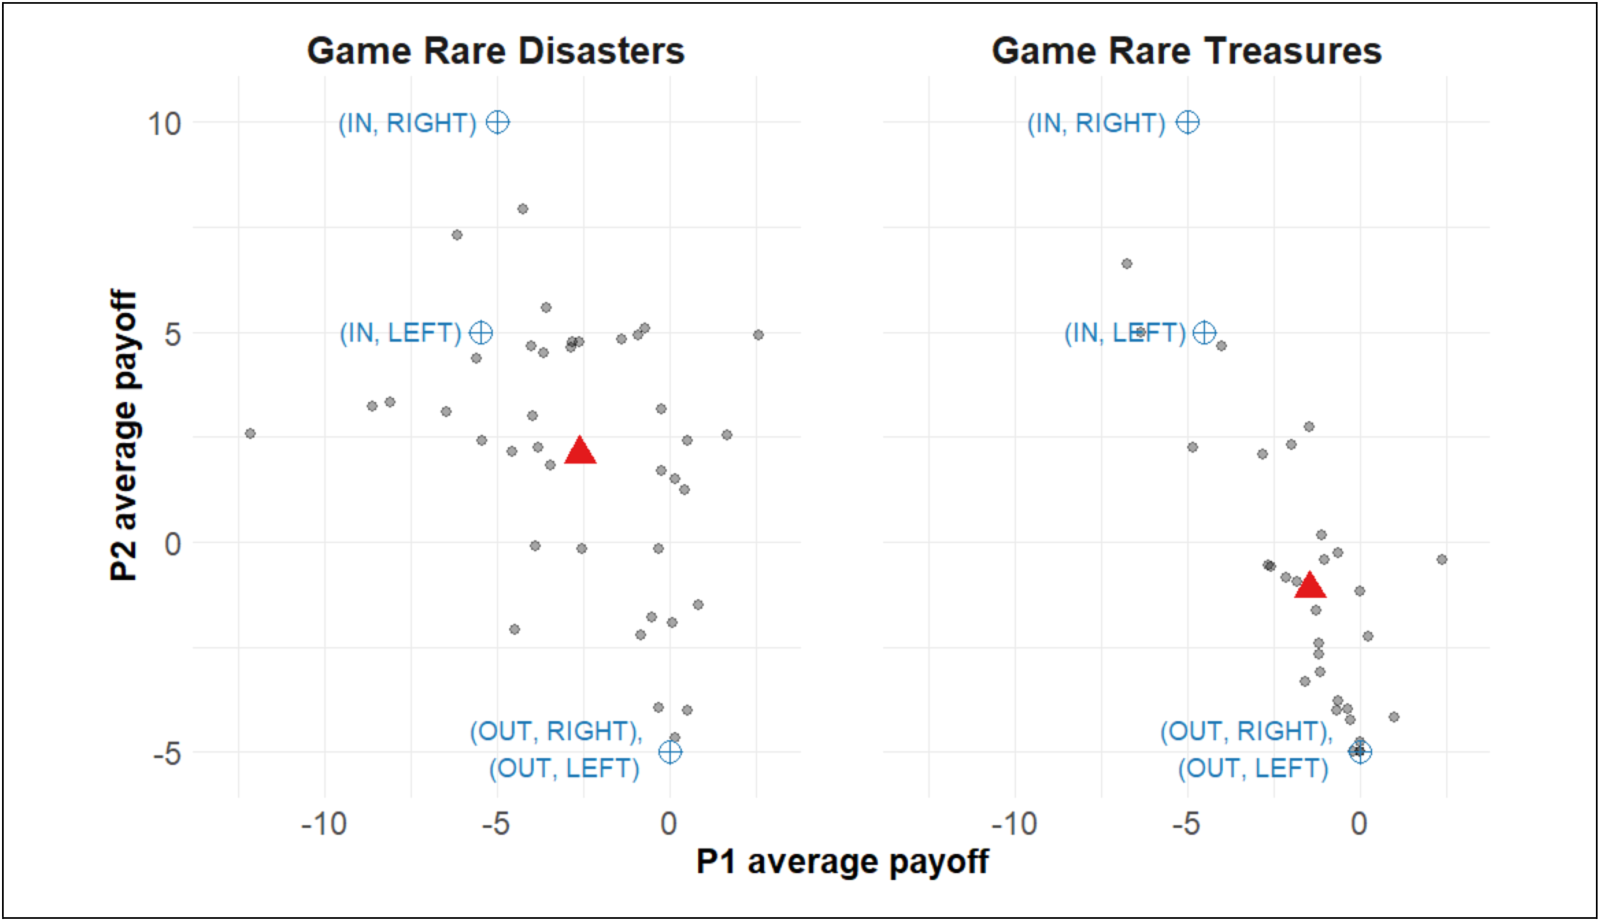
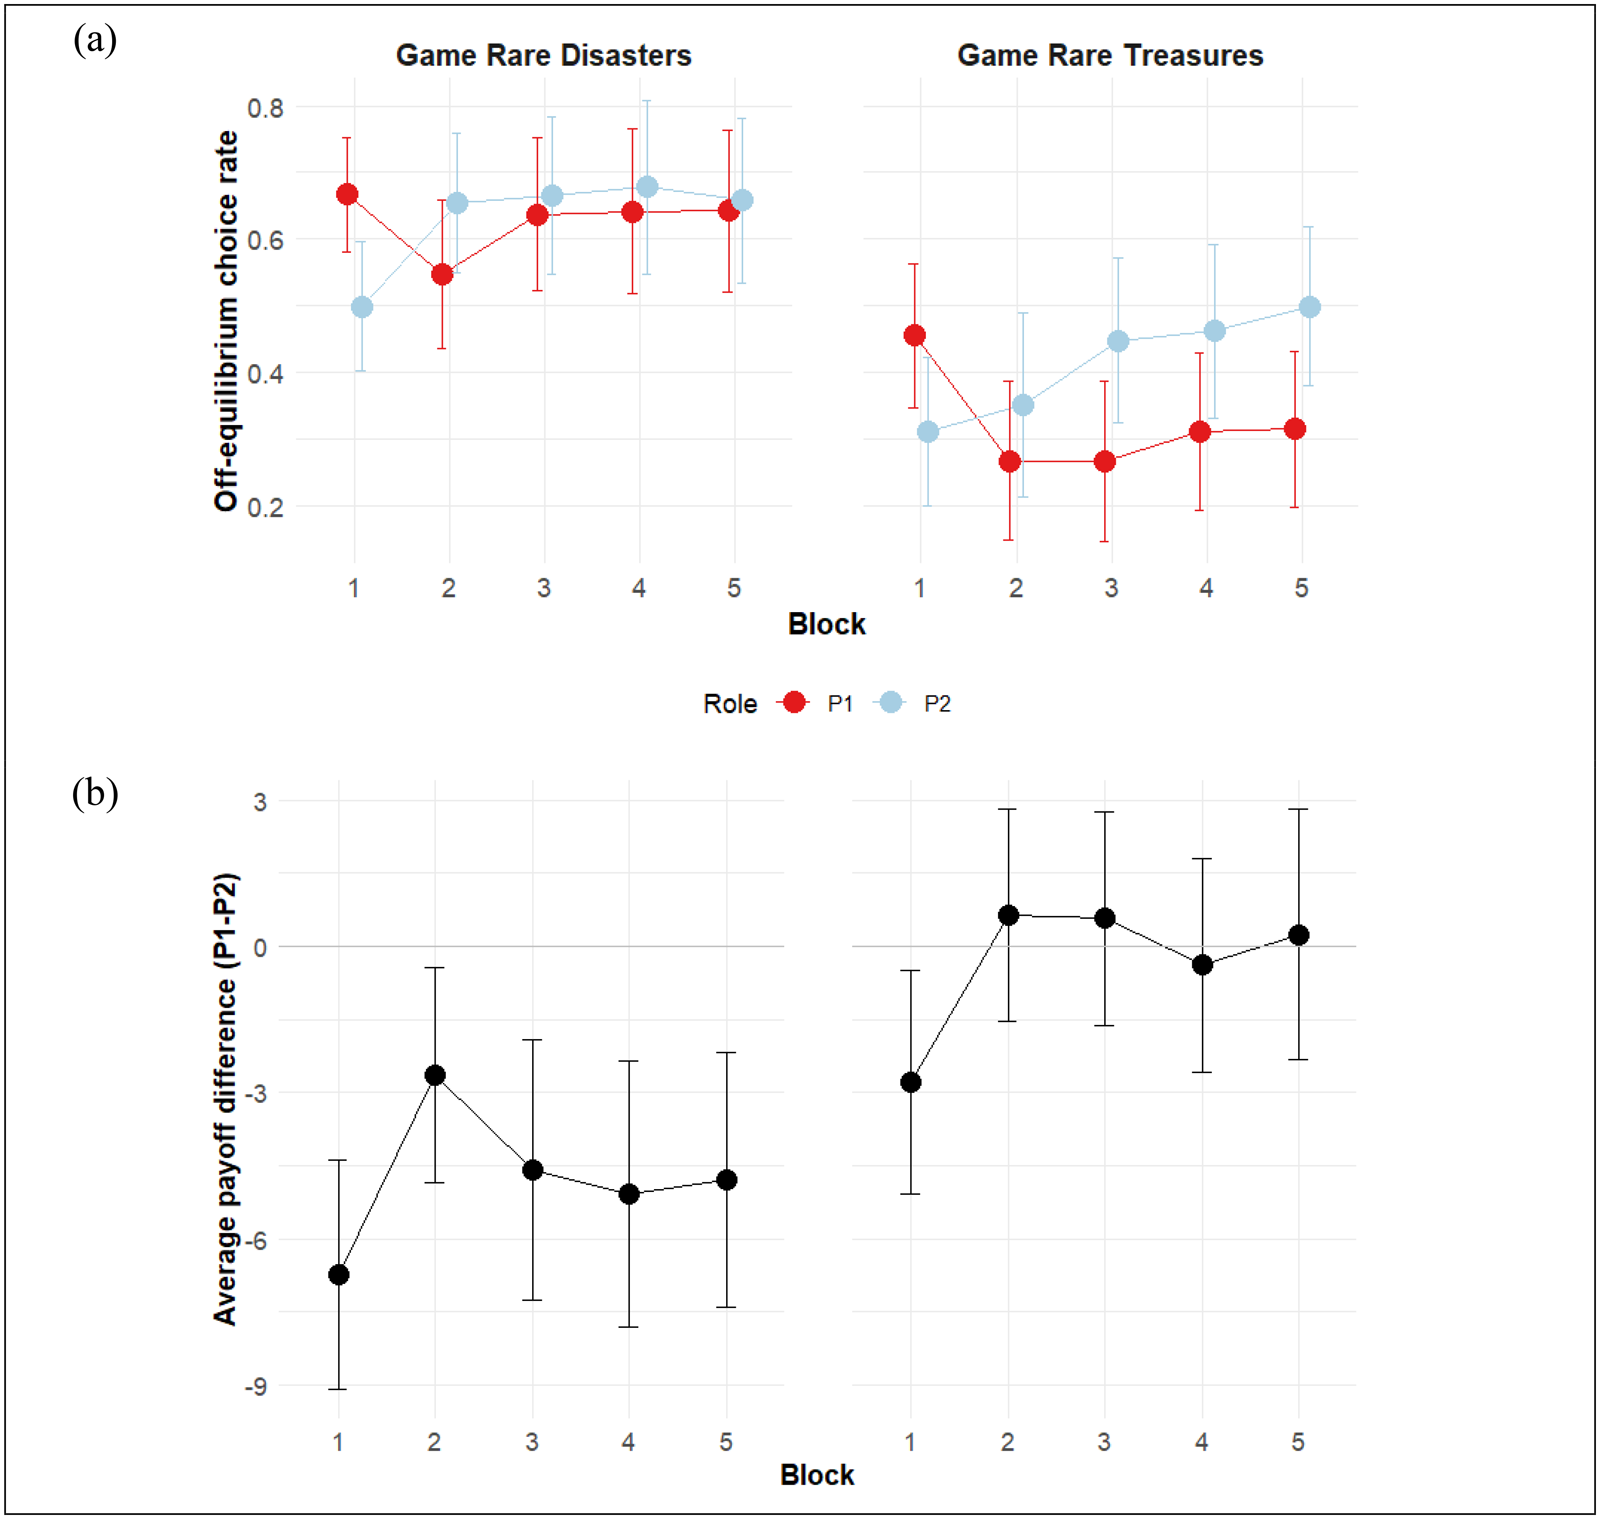
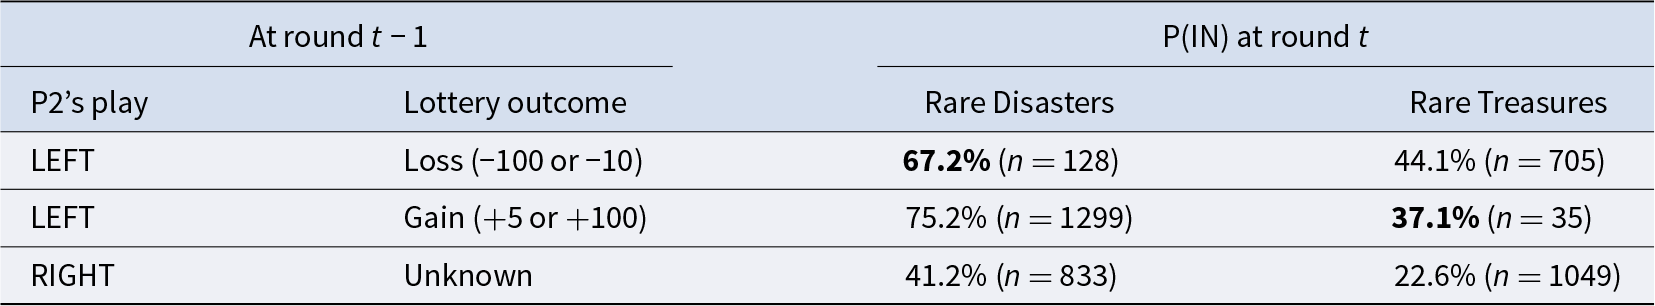
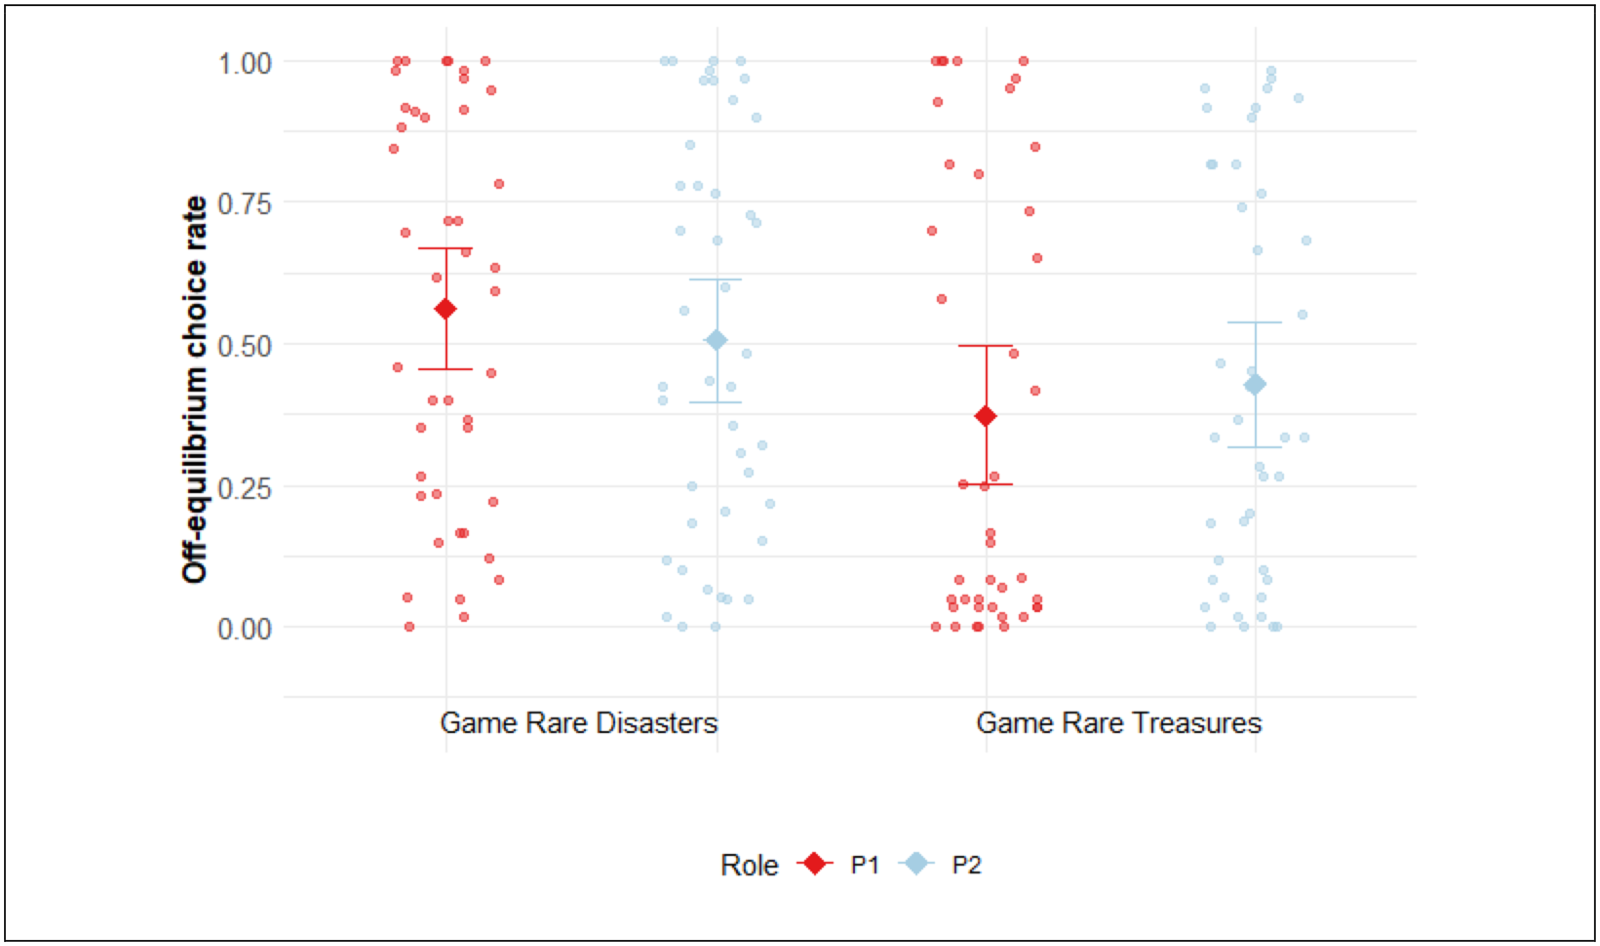
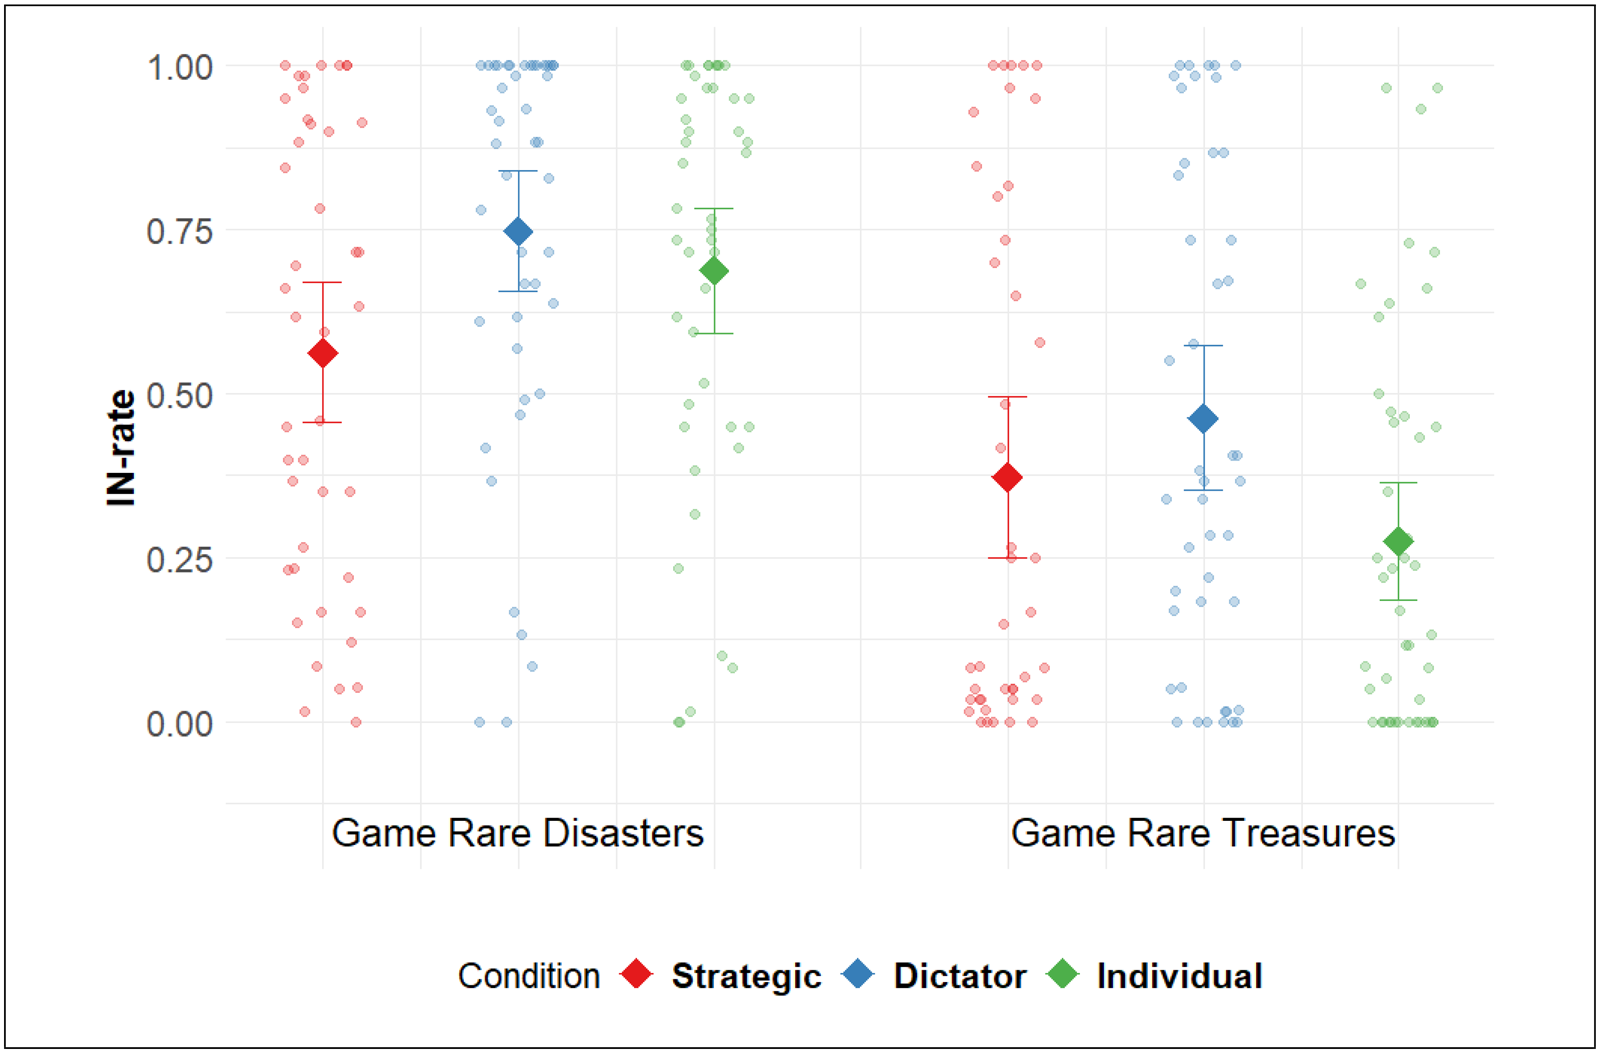
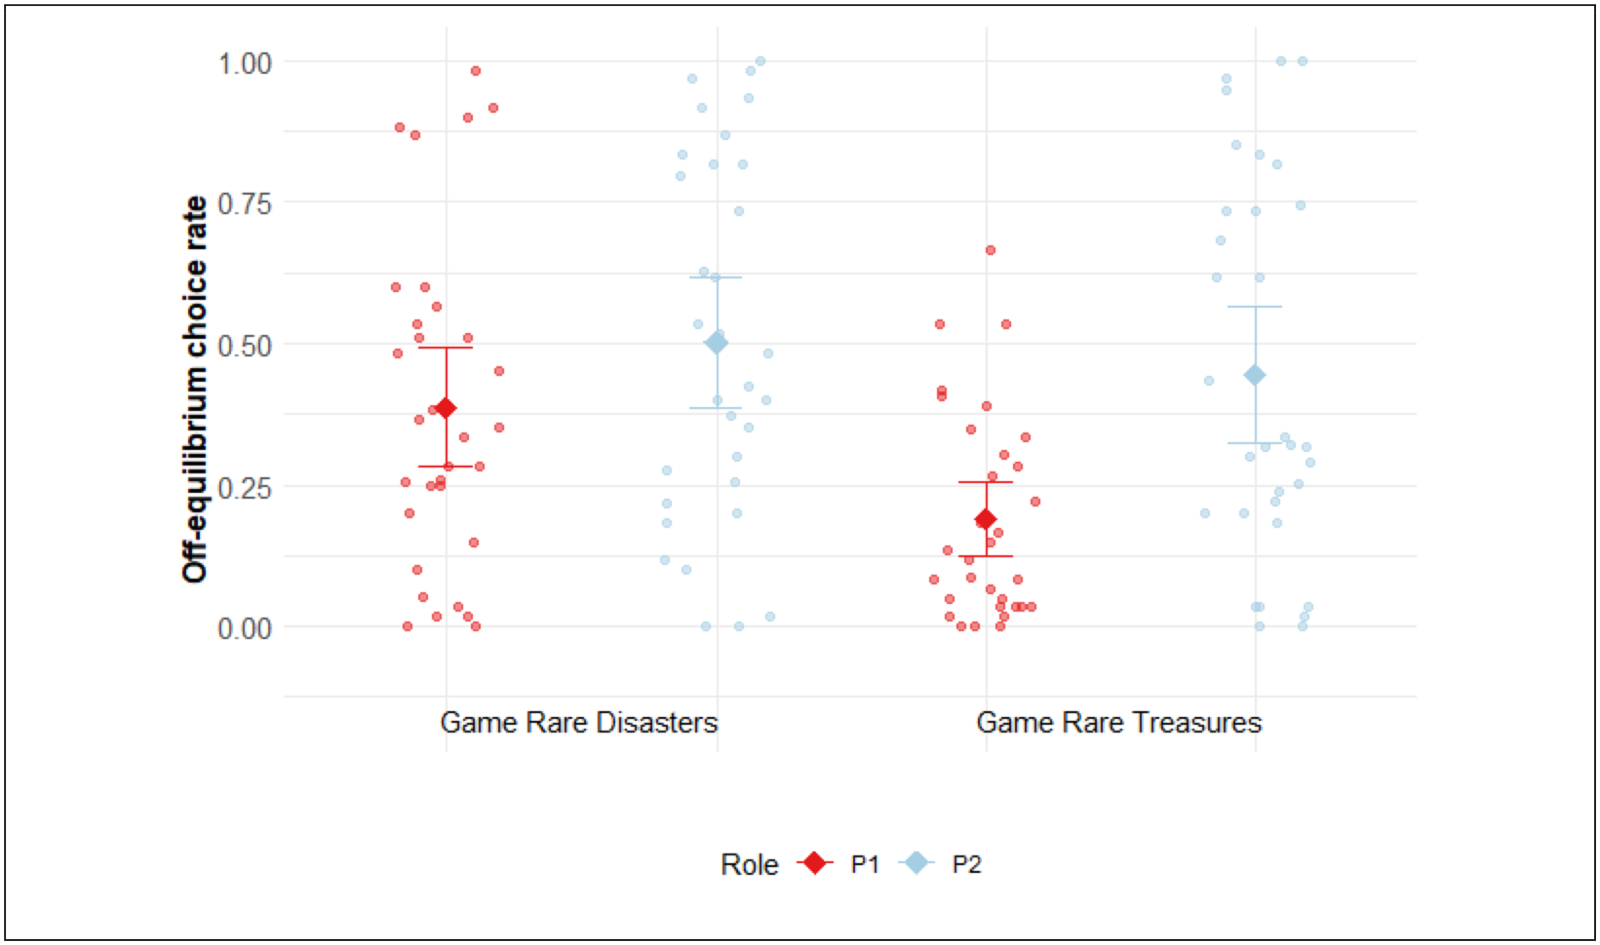
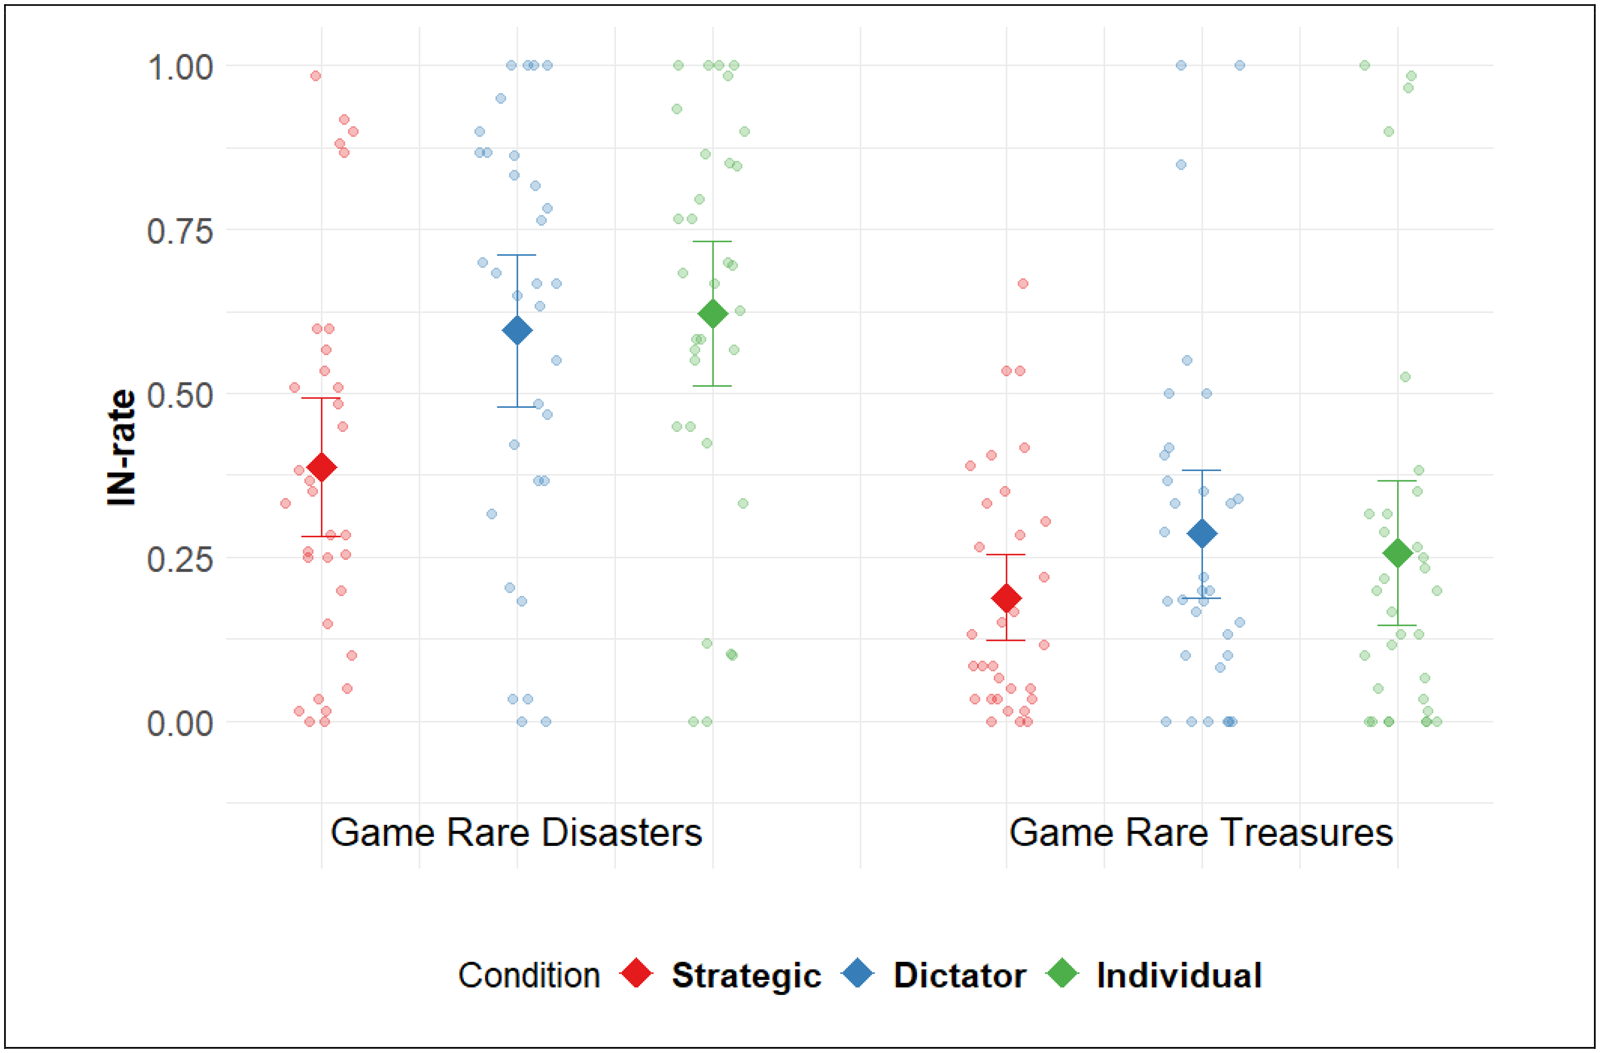
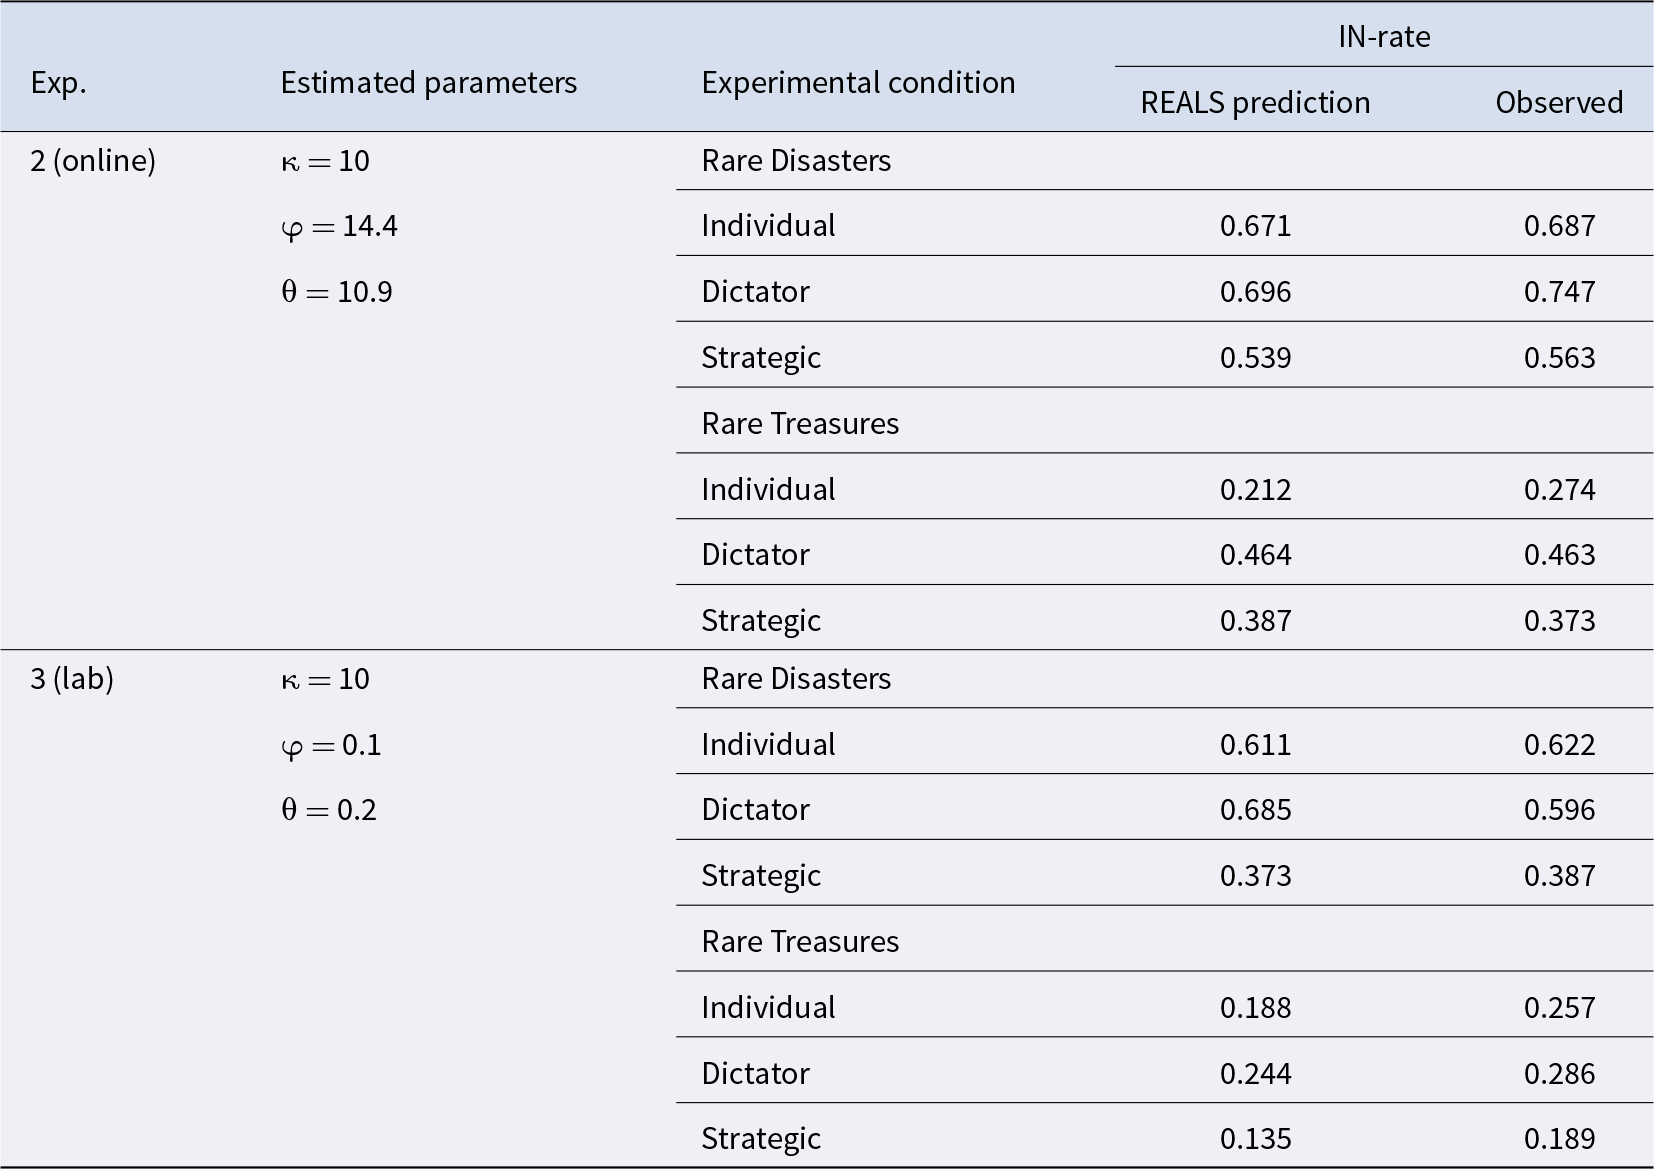


 Open access