


1. Introduction
Livestock and animal-asset auctions provide a valuable empirical setting for studying price formation under uncertainty, information asymmetry, and heterogeneous quality. Prior studies on livestock and animal auctions show that animal traits, pedigree signals, auction management, and seller reputation are all associated with auction prices (Calil et al., Reference Calil, Ribera, Anderson and Koury-Filho2022; Maynard and Stoeppel, Reference Maynard and Stoeppel2007; Rogers et al., Reference Rogers, Schroeder, Tonsor and Coffey2023; Schroeder et al., Reference Schroeder, Mintert, Brazle and Grunewald1988; Schulz et al., Reference Schulz, Dhuyvetter and Doran2015; Zimmerman et al., Reference Zimmerman, Schroeder, Dhuyvetter, Olson, Stokka, Seeger and Grotelueschen2012). Within this animal-asset pricing market, Thoroughbred yearling auctions represent a market with substantial transaction volume. Major sales such as the Keeneland September Yearling Sale generated over $405 million in 2024 (Keeneland Association, 2024). More broadly, the US equine industry contributes an estimated $177 billion in total economic impact and involves over 6.5 million horses nationwide (American Horse Council, 2023).
Unlike older racehorses, yearlings are sold before they have any racing record, so buyers face substantial uncertainty and asymmetric information in the auction market (Chezum and Wimmer, Reference Chezum and Wimmer1997). Yearling prices largely reflect expectations about future potential rather than demonstrated performance. Prior studies have examined this pricing mechanism using hedonic price models. Studies have shown that sire stud fees, dam performance, and session placement are all associated with price variation in Thoroughbred yearling auctions (Buzby and Jessup, Reference Buzby and Jessup1994; Chezum and Wimmer, Reference Chezum and Wimmer1997; Plant and Stowe, Reference Plant and Stowe2013). However, to the best of our knowledge, the use of modern data science techniques such as supervised machine learning remains rare in this area. The high dimensionality of pedigree signals and the potential for nonlinearity among reputational signals make this setting well suited for machine learning approaches (Athey and Imbens, Reference Athey and Imbens2019; Varian, Reference Varian2014). Moreover, machine learning framework emphasizes out-of-sample prediction, which can provide a more credible prediction for new auction prices (Hastie et al., Reference Hastie, Tibshirani and Friedman2009; Mullainathan and Spiess, Reference Mullainathan and Spiess2017). To date, few studies have systematically applied machine learning methods to yearling price prediction.
This study uses auction data from the Keeneland September Yearling Sale, combined with pedigree information, to predict the prices of Thoroughbred yearlings using a machine learning framework. Using data from 2020 to 2024, our main analytical sample includes 5,788 yearling auction prices and pedigree information such as sire and broodmare sire’s progeny records, sire–broodmare sire cross performance, dosage profiles, and sire and dam reputation metrics. We use a set of linear models (OLS, Ridge, Lasso, Elastic Net, and Huber) and tree-based models (Random Forest, XGBoost, LightGBM, and CatBoost), along with a weighted ensemble of the top-performing tree models, to predict log auction prices. Among these models, we use Ridge regression for the session-level analysis because it offers greater stability and interpretability.
Our analysis reveals three key findings. First, the Ridge model (α ≈ 1.451) explains approximately 54% of the out-of-sample variation in auction prices (R 2 ≈ 0.5403). Second, reputation signals are among the strongest predictors, with Sire Reputation emerging as the dominant predictor. Dam Reputation is also economically important, even though its estimated coefficient is smaller. This difference likely reflects measurement precision rather than true economic importance. Sires produce many more progeny, so their market reputation can be estimated more precisely. Dams have far fewer progeny, making the coefficients of Dam Reputation noisier. Third, model performance varies across session segments, with earlier sessions (Sessions 2 and 3) showing session-level R 2 up to 0.3725, while later sessions (Sessions 7 and 11) exhibit weaker fit, with R 2 near 0.21.
Several limitations should be noted. First, the Sire and Dam Reputation indices are constructed from historical auction outcomes, raising concerns about circularity and endogeneity. Coefficient estimates should be interpreted as predictive associations rather than causal effects. Second, our analysis uses data from a single auction and might have limited external validity. Our results may not fully generalize to other yearling auctions such as Fasig-Tipton or Ocala Breeders’ Sales Company (OBS). Third, some session-level analyses are based on small sample sizes, which may reduce statistical precision. Overall, our findings are best viewed as documenting robust predictions for yearling auction prices rather than establishing causal mechanisms.
The remainder of the paper is organized as follows. Section 2 provides background on auction theory and prior research. Section 3 details our data and methodology. Section 4 presents model results and interpretation. Section 5 discusses the implications of our findings, and Section 6 concludes.
2. Background
A substantial literature in livestock and animal auctions examines how observable characteristics, such as management practices, genetic merit, and reputation signals are associated with prices. In cattle markets, hedonic models show that physical traits, health protocols, seller reputation, and market conditions significantly influence auction prices (G. F. Schroeder et al., Reference Schroeder, Mintert, Brazle and Grunewald1988; Schulz et al., Reference Schulz, Dhuyvetter and Doran2015). More recent work highlights the role of genetic indicators and value-added attributes in seedstock and breeding markets, showing that pedigree signals, expected progeny differences, and farm reputation are reflected in prices under conditions of uncertainty (Calil et al., Reference Calil, Ribera, Anderson and Koury-Filho2022). Research on market transparency further emphasizes how information structure shapes price discovery and the extent to which observed attributes explain transaction-level variation (Rogers et al., Reference Rogers, Schroeder, Tonsor and Coffey2023; Schroeder et al., Reference Schroeder, Coffey and Tonsor2023).
Predicting Thoroughbred yearling prices is uniquely challenging. Because these one-year-old horses have no race performance history, buyers make auction decisions under asymmetric information, relying mainly on pedigree, physical conformation, sale timing, and cataloged information to assess future potential (Chezum and Wimmer, Reference Chezum and Wimmer1997). Theoretical frameworks from auction economics further suggest that buyers’ valuations are shaped not only by private signals but also by expectations about competitor behavior, creating room for winner’s curse and adverse selection (Chezum and Wimmer, Reference Chezum and Wimmer1997; Maynard and Stoeppel, Reference Maynard and Stoeppel2007; Milgrom and Weber, Reference Milgrom and Weber1982). Prior studies also explore disclosure effects within yearling auctions, suggesting that voluntary catalog disclosure and strategic withholding of information may meaningfully affect price signals (Plant and Stowe, Reference Plant and Stowe2013).
Other studies identify factors such as sire stud fee, dam racing record, foaling date, sex, and catalog placement as important drivers of auction price variation (Buzby and Jessup, Reference Buzby and Jessup1994; Chezum and Wimmer, Reference Chezum and Wimmer1997; Plant and Stowe, Reference Plant and Stowe2013). Maynard and Stoeppel (Reference Maynard and Stoeppel2007) examine pricing for Thoroughbred broodmares and find that the performance of the mare’s existing foals is a stronger price determinant than her own racing record. Vickner and Koch (Reference Vickner and Koch2001) examine yearling prices using a hedonic model to estimate the marginal value of pedigree and auction characteristics. Their results show that sire quality, stud fees, and dam-related traits are significant determinants of price. Parsons and Smith (Reference Parsons and Smith2007) extend this approach to the British yearling market by examining how catalog placement and eligibility for owners’ premium programs affect auction prices. These premium programs provide additional payments to owners of qualifying horses, thereby increasing the expected value of eligible yearlings. More recently, Mouncey et al. (Reference Mouncey, Alarcon and Verheyen2024) analyze UK yearling sales data and find that sire covering fee, dam performance, consignment size, and catalog session all play significant roles in pricing. Kim et al. (Reference Kim, Mitchell and Wang2019) apply hedonic models to Australian yearling auctions and highlight the predictive value of stud fees, sibling race performance, and sales history in explaining auction prices. Kibler and Thompson (Reference Kibler and Thompson2020) examine stock-type horses sold online and find that digital presentation strategies, particularly videos, boost sale prices by around 11%, reflecting changing buyer behavior in tech-mediated auctions.
Prior bloodstock auction studies provide useful insights, but they have several limitations. First, most rely on linear regression models, which are interpretable but may be too restrictive for modeling yearling auction prices. Second, much of the prior work focuses on in-sample explanation rather than out-of-sample prediction, which lacks assessments on how well the models perform on new auction data. Third, many studies use older data, while recent changes in auction dynamics, richer catalog information, and advances in predictive modeling call for updated research.
Recent studies have applied machine learning methods to other livestock auctions. Haque et al. (Reference Haque, Talukder, Saha and Uddin2021) use supervised learning methods to predict prices of cows, finding that ensemble models significantly outperform linear regressions. Zapata and Anderson (Reference Zapata and Anderson2025) introduce an approach based on Data Envelopment Analysis (DEA) to quantify prices in cattle auctions and recommend cost-effective improvements to animal traits. Wang et al. (Reference Wang, Kim and Tejeda2025) apply decision trees and random forests to fed-cattle cash prices and reveal weight range as a primary determinant of price variability. Prior studies show that machine learning methods can complement traditional models by capturing nonlinear pricing patterns and improving price prediction in livestock auctions. This suggests that similar approaches may also be useful for predicting Thoroughbred yearling prices.
3. Methodology
3.1. Data collection and processing
The dataset used in this analysis combines publicly available sale records from the Keeneland September Yearling Sale (2020–2024) with pedigree data obtained from Equineline.com, a service operated by The Jockey Club Information Systems (TJCIS). Keeneland sales provide transaction-level data for each horse offered at auction, including sale price, hip number, sex, color, session placement, and consignor information. These data are collected directly from Keeneland’s official website archives. Pedigree data from Equineline’s Free 5-Cross Pedigree reports include lineage information for the sire, dam, and broodmare sire, along with relevant performance metrics including number of foals, starters, winners, black-type winnersFootnote 1 , and total progeny earnings. Horses are matched across datasets using registered name and year of sale.
Data preprocessing involves several standardization steps. Column names are cleaned by removing extra whitespace, currency strings are converted to numeric values, and invalid entries are converted to missing values and imputed using robust statistics. Seller, sire, and dam names are standardized by converting them to lowercase and removing organizational suffixes, agent qualifiers, and country codes to ensure consistent entity identification across sources. Following initial preprocessing, we filter high-influence observations using Cook’s distance as a diagnostic measure for outlier detection (Cook, Reference Cook1977). For predictors with highly skewed distributions, we apply monotone power transformations from the Yeo–Johnson or Box–Cox families (Box and Cox, Reference Box and Cox1964; Yeo and Johnson, Reference Yeo and Johnson2000). These transformations are used when they help make the data more symmetric while keeping the results easy to interpret. Using these approaches, we identify and remove 272 outliers, resulting in a final analytical sample of 5,788 observations.
3.2. Outcome variable and predictors
The outcome variable in this study is the natural logarithm of the yearling’s final sale price. This transformation addresses the substantial right skewness in raw prices and helps stabilize variance across the price range. Our predictors fall into four broad categories: reputation measures, progeny-performance measures, dosage-profile variables, and additional control variables.
We first construct Sire and Dam Reputation indices from four measures of offspring sale performance, following Alani (Reference Alani and Brewster2006). The first measure is the 90th percentile of a sire’s or dam’s offspring log sale prices (weight 0.40), which captures the high end of their sale performance. The second is the share of offspring selling above the market-wide 90th-percentile price (weight 0.30), capturing the frequency of top-tier sales. The third is a sire’s or dam’s median offspring log sale price, expressed as a percentile rank among all sires or dams (weight 0.20), representing typical market standing. The fourth is the 25th percentile of offspring log sale prices (weight 0.10), which reflects the lower end of the sale distribution. The declining weights place greater emphasis on elite sale outcomes and still account for consistency across the full distribution of offspring sales. Each measure is min–max scaled prior to aggregation, producing an index ranging from zero to one, where higher values indicate stronger market reputation.
We include several progeny-performance variables to measure pedigree quality. For the sire, we use the sire’s total number of foals and the sire’s black-type winner rate, defined as the share of the sire’s offspring that became elite winners. For the broodmare sire, we use the broodmare sire’s total number of foals and the broodmare sire’s black-type winner rate, defined in the same way. We also measure the performance of the specific sire–broodmare sire cross using Average Earning Index (AEI) and total earnings. AEI captures the earnings performance of offspring from that specific cross relative to the typical racehorse, while total earnings measure the cumulative earnings of offspring from that cross.
The dosage profile includes five indices (Brilliant, Intermediate, Classic, Solid, and Professional) that summarize the pedigree’s balance between speed and stamina. Additional control variables include year fixed effects (2021–2024, with 2020 as the reference year), sex, and first-crop status, which indicates whether the yearling is from a sire’s first crop of offspring.
We evaluate each candidate predictor using four criteria and combine the resulting scores to select variables most strongly associated with price. The F-test captures the strength of each variable’s linear relationship with price, while mutual information measures the reduction in uncertainty about price associated with each variable. Lasso regression estimates the model using all candidate predictors and shrinks weaker coefficients toward zero. Elastic Net regression combines shrinkage with grouped selection, allowing correlated predictors to be retained together. Predictors that perform well across these four criteria are included in the final predictor set. This selection process reduces our initial 29 variables to a final set of 20 features.
3.3. Model selection and estimation strategy
We estimate two classes of models – linear models and tree-based models – to evaluate predictive performance, stability, and interpretability. We use linear models to provide transparent coefficient estimates and use tree-based models to capture potential nonlinear relationships and higher-order interactions.
We estimate five linear models. Ordinary least squares (OLS) serves as the baseline model without regularization. Ridge regression applies an L2 penalty to shrink coefficients toward zero. Lasso regression uses an L1 penalty to both shrink coefficients and perform automatic variable selection. Elastic Net combines L1 and L2 penalties to balance sparsity and shrinkage. Huber regression provides a robust alternative by down-weighting the influence of outliers, thereby reducing sensitivity to extreme observations. For models requiring hyperparameter tuning, we use cross-validation to identify optimal values. We divide the training data into five folds and repeat this process three times with different random splits, creating 15 total validation runs. For Ridge and Lasso models, we test penalty parameters (α) ranging from 10−5 to 103 on a logarithmic scale. For Elastic Net, we also test mixing parameters from 0.10 to 0.99 to determine the balance between L1 and L2 penalties. Before model estimation, we standardize all continuous variables using robust scaling followed by standard scaling to ensure comparable coefficient magnitudes.
For tree-based models, we estimate Random Forest, XGBoost, LightGBM, and CatBoost and additionally construct a weighted ensemble. We tune both structural and regularization parameters to control model complexity and reduce overfitting. For Random Forest, we tune the maximum tree depth, the minimum number of observations required in a terminal leaf, the minimum number of observations required to split an internal node, and the number of predictors randomly considered at each split. These parameters are searched over bounded grids to limit excessive tree growth while preserving the model’s ability to capture nonlinear relationships and interactions. For XGBoost, which includes explicit regularization, we tune both L1 and L2 penalties on logarithmic scales. The L1 penalty is searched from 10-8 up to 102 on a logarithmic scale, and the L2 penalty from about 10-3 up to 102 on a logarithmic scale. In addition, we tune structural complexity parameters such as the minimum loss reduction required to make a split, maximum tree depth, and the minimum child weight. For LightGBM, we similarly tune L1 regularization over a log scale from roughly 10-8 to 102 on a logarithmic scale and L2 regularization from approximately 10-3 to 102 on a logarithmic scale. We also tune the number of leaves, the minimum number of observations required in each leaf, and subsampling parameters controlling the proportion of features and observations used in each iteration. For CatBoost, we tune the L2 leaf regularization parameter over a range from about 1 to 50 depending on the grid, along with tree depth, learning rate, and iteration settings.
3.4. Model evaluation
We split the dataset into three parts: 60% for training, 20% for validation, and 20% for prediction evaluation. To maintain representativeness across all splits, we stratify the data by session, ensuring that each split contains similar proportions of yearlings from different sale sessions. We evaluate model performance using four metrics. R 2 measures the proportion of variance in log prices explained by the model. Adjusted R 2 modifies regular R 2 by accounting for the number of predictors relative to sample size, providing a more conservative estimate of model fit when comparing models with different numbers of variables. Root mean squared error (RMSE) measures the magnitude of prediction errors in outcome variables, giving greater weight to larger errors. Mean absolute error (MAE) represents the average absolute prediction error, treating all deviations equally and making it less sensitive to outliers than RMSE. For each metric, we also report the standard error to assess model stability.
For coefficient estimates of linear models, we use bootstrap resampling as the primary inferential framework. We draw 1,000 samples with replacement from the training data, each maintaining the original sample size. For each sample, we re-estimate the model and record the coefficients. This process generates distributions for each coefficient, from which we calculate 95% confidence intervals and determine statistical significance.
Among all models, we select Ridge regression for coefficient interpretation and session-level analysis for its predictive performance stability and coefficient interpretability. To verify that the Ridge specification meets statistical assumptions, we conduct several diagnostic tests. We test residual normality using the Jarque–Bera, Shapiro–Wilk, and Kolmogorov–Smirnov tests (Jarque, Reference Jarque and Anil1980; Shapiro, Reference Shapiro and Wilk1965). We check for autocorrelation using the Durbin–Watson statistic (Durbin and Watson, Reference Durbin and Watson1950; Godfrey, Reference Godfrey1978). We assess constant variance assumptions using the Breusch–Pagan and White tests (Breusch and Pagan, Reference Breusch and Pagan1979; White, Reference White1980). We present the cross-validated α tuning curve and corresponding coefficient shrinkage (regularization) path for the Ridge specification in the Appendix (Figure A2 and Figure A3). We also show the correlation matrix in Figure A1.
To examine heterogeneity across auction sessions, we evaluate model performance separately by session. For each session, predictive accuracy is summarized using R 2, and sessions are ranked by R 2 to assess whether model performance differs across market segments. We also estimate separate Ridge regressions by session to examine whether the associations between key predictors and yearling prices vary across different sessions of the auction.
In addition, we conduct several robustness checks. Because the 2020 sale occurred during the COVID-19 pandemic, we first test whether the 2020 price distribution differs materially from those of subsequent years using a Kruskal–Wallis test with pairwise comparisons. We then evaluate temporal prediction stability through a leave-one-year-out cross-validation (LOYO-CV) procedure, in which the model is iteratively trained on four years of data and evaluated on the held-out year. Finally, we re-estimate the Ridge model after excluding all 2020 observations and assess its predictive performance separately. Together, these procedures allow us to determine whether the main findings are sensitive to the inclusion of the pandemic-year observations or to temporal instability across sale years.
4. Results
4.1. Descriptive analysis
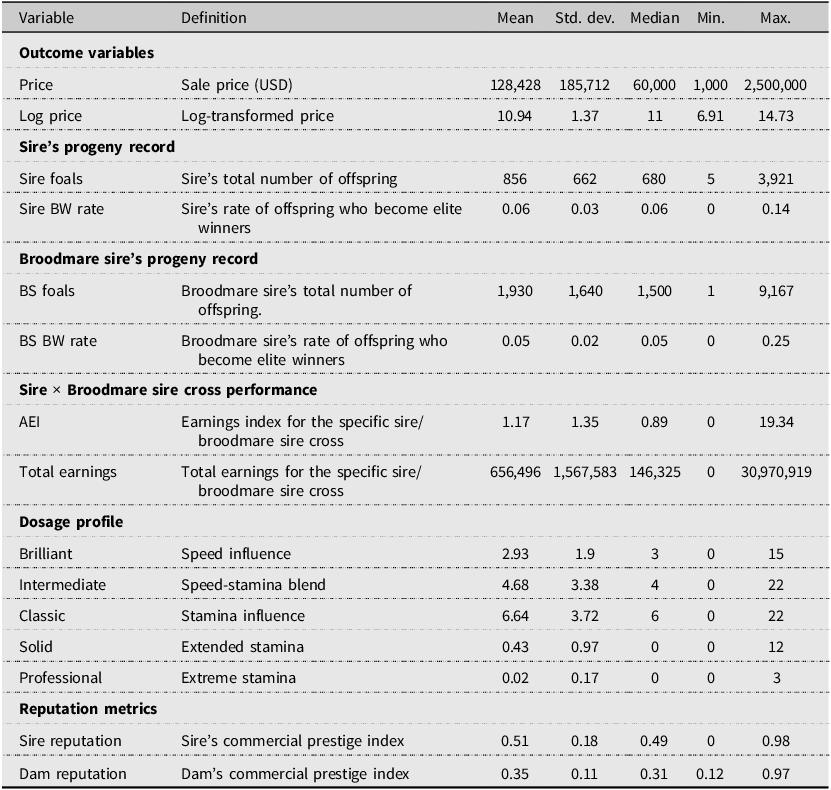
Table 1 presents descriptive statistics for the outcome variables and predictors in this study. Sale prices exhibit substantial right skewness characteristic of auction markets. The mean price of $128,428 exceeds the median of $60,000, with individual transactions ranging from $1,000 to $2.5 million. After transformation, log prices show improved symmetry with a mean of 10.94 and standard deviation 1.37.
Summary statistics for auction prices, pedigree performance, dosage profile, and reputation metrics

Table 1. Long description
The table presents descriptive statistics for various variables related to auction prices, pedigree performance, dosage profile, and reputation metrics. It includes 18 rows and 6 columns. The columns are labeled Variable, Definition, Mean, Std. dev., Median, Min., and Max. The table is divided into several sections: Outcome variables, Sire’s progeny record, Broodmare sire’s progeny record, Sire x Broodmare sire cross performance, Dosage profile, and Reputation metrics. Each section contains specific variables with their definitions and statistical measures. For example, under Outcome variables, the Price variable has a mean of 128,428, a standard deviation of 185,712, a median of 60,000, a minimum of 1,000, and a maximum of 2,500,000. The table provides a comprehensive overview of the data distribution and key statistics for each variable.
The average number of offspring per sire is 856 (SD = 662), indicating substantial variation, with some sires producing many offspring and others relatively few. The Sire’s Black-type Winner rate is 6%. The average number of offspring per broodmare sire is 1,930 (SD = 1,640). The Broodmare Sire’s Black-type Winner rate is 5%. The AEI for sire-broodmare sire cross has a mean of 1.17, suggesting that, on average, the combinations in this sample produce offspring earning 17% more than the typical racehorse. However, the high standard deviation (SD = 1.35) and a median value of 0.89 suggest that the mean is likely elevated by a small number of exceptionally successful sire–broodmare sire pairings. This skewness is also evident in the total earnings for these crosses, which average $656,496 but have a median of only $146,325.
The dosage profile for yearlings serves as a pedigree signal, indicating a market preference for horses with a balanced combination of speed and stamina traits. The Classic category shows the highest average scores. In contrast, the average of Professional, which shows the extreme stamina, is the smallest. The reputation metrics, which serve as proxies for commercial prestige, show that Sire Reputation averages 0.51 on a 0-1 scale while Dam Reputation averages 0.35.
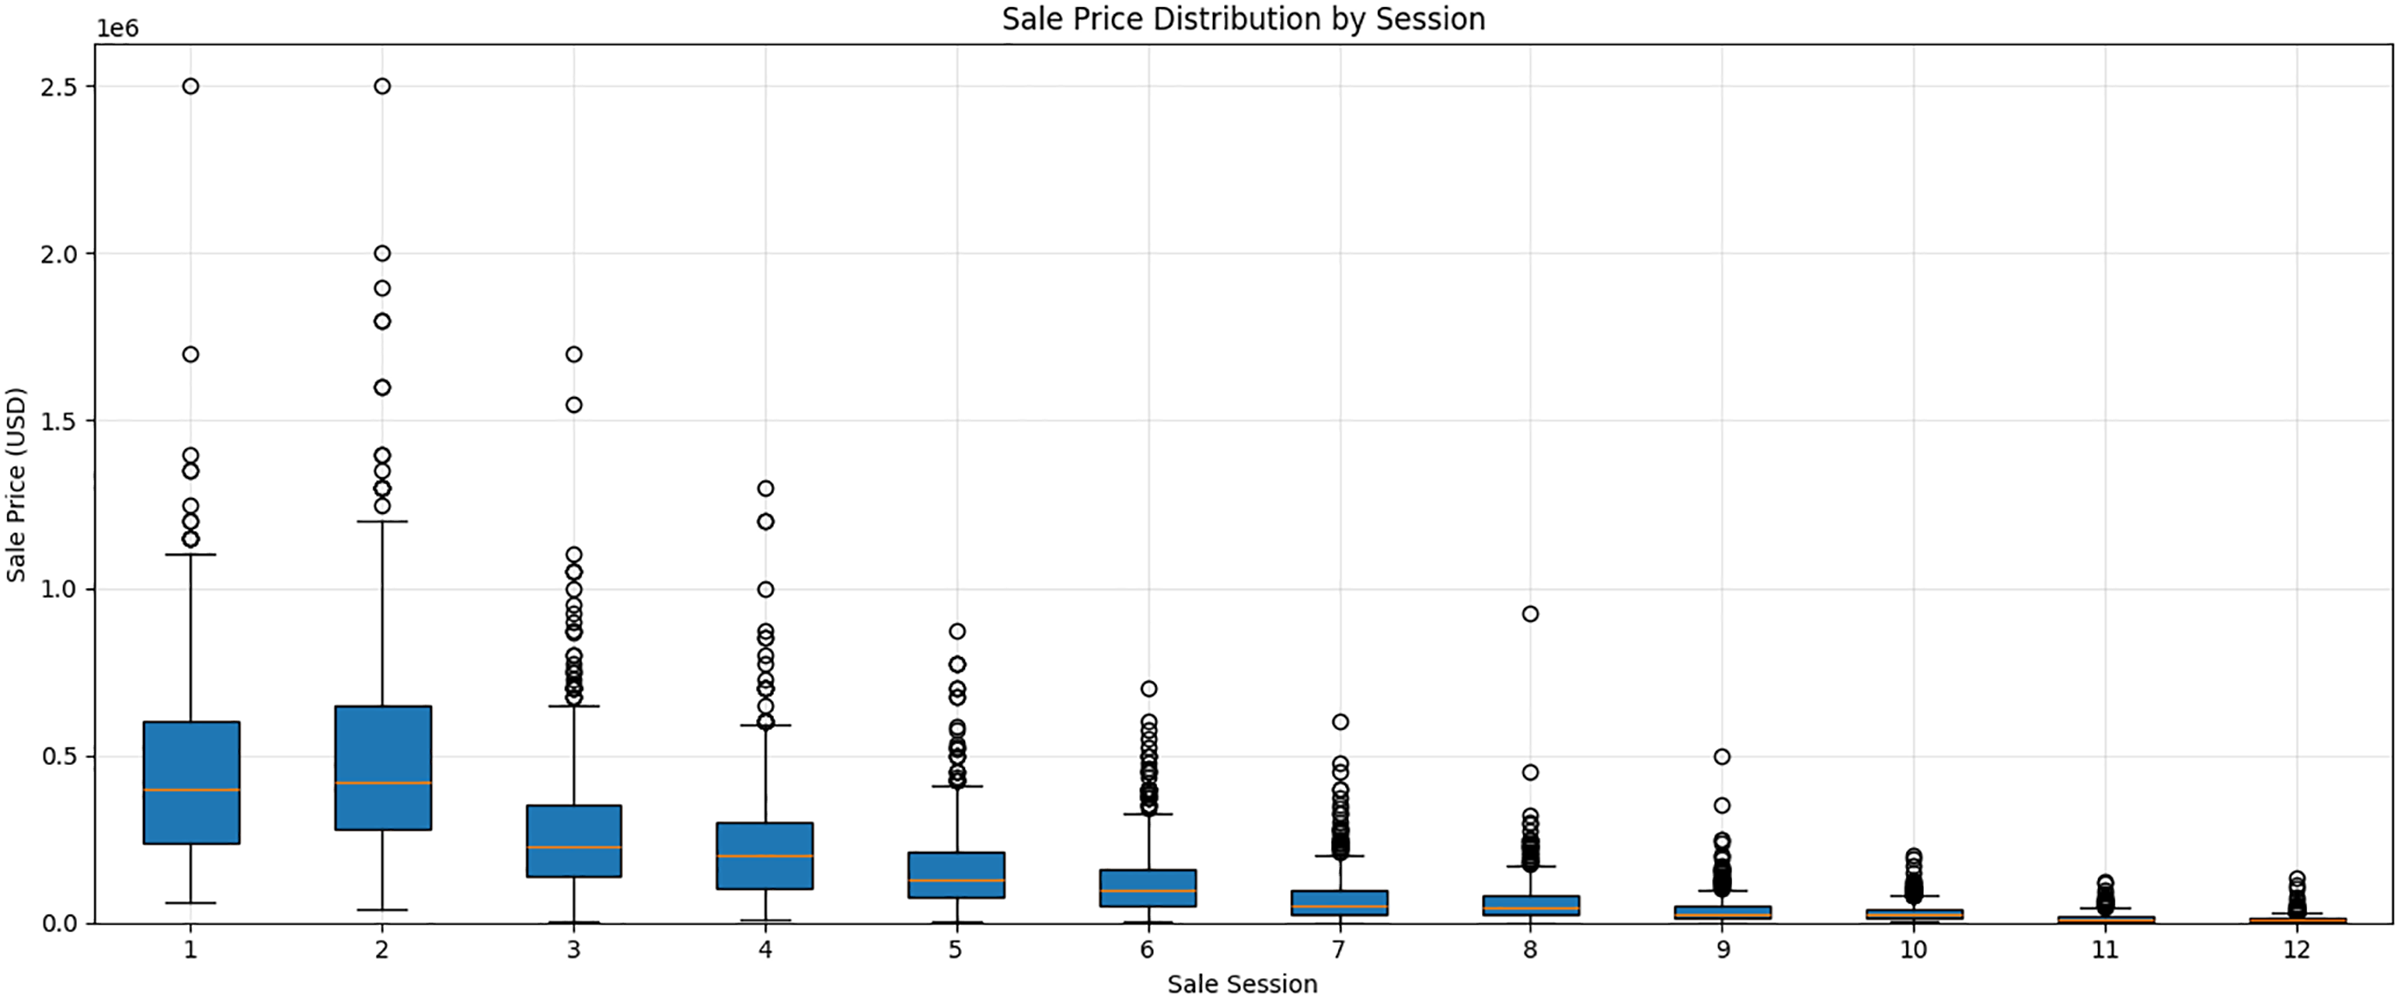
Figure 1 plots the distribution of sale prices across the 12 sale sessions and reveals a clear pattern of market stratification. A downward trend is evident in both the median price and overall price dispersion as the sale progresses from the earliest to the later sessions. Sessions 1 and 2, which represent the most selected segments of the auction, exhibit the highest median prices – approximately $400,000 or more – and the widest interquartile ranges. These early sessions also contain many high-value outliers, with several yearlings selling for over $1.5 million. Conversely, beginning around Session 5, there is a decline in both price levels and dispersion. The median price in the final sessions falls below $50,000, and the price distribution becomes much more compressed. This tiered market structure highlights the role of sale session as a key determinant of price and underscores the importance of examining session-level predictive performance and the relationships between predictors and auction prices.
Sale price distribution by session.

Appendix Table A3 reports the number of unique sires and dams by year and session. Our analytical sample includes 279 unique sires and 4,807 unique dams. Each dam contributes exactly one yearling per year, so the number of dams equals the annual sample size. In contrast, a single sire can produce multiple yearlings each year, which leads to fewer unique sires across years. These patterns reflect that sires have many more progenies than individual dams. Each sire’s reputation is estimated from multiple progenies, which reduces sampling variability and increases precision. In contrast, each dam typically contributes only one progeny per year, limiting the variation used to estimate Dam Reputation and making these estimates less precise relative to Sire Reputation.
4.2. Machine learning results
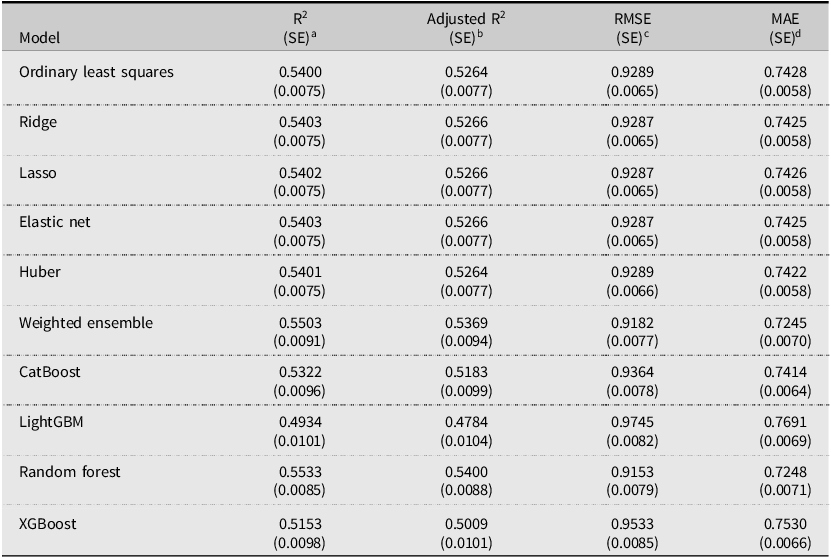
Table 2 shows that linear models – OLS, Ridge, Lasso, Elastic Net, and Huber – deliver very similar predictive performance, with test R 2 values ranging between 0.5400 and 0.5403. Tree-based and ensemble methods perform somewhat differently: the Weighted Ensemble and Random Forest achieve the highest predictive accuracy, with test R 2 values of 0.5503 and 0.5533, respectively, while CatBoost, XGBoost, and LightGBM perform less strongly in this setting. These results indicate that the predictive gains from more complex nonlinear models are modest. Given this pattern, model selection requires consideration of other criteria beyond predictive accuracy. Therefore, we select Ridge regression (α = 1.451) based on three criteria. First, Ridge effectively shrinks correlated coefficients while retaining all predictors, which is critical for preserving economically meaningful variables that Lasso might eliminate when handling multicollinearity (Dormann et al., Reference Dormann, Elith, Bacher, Buchmann, Carl, Carré and García Marquéz2013). Second, Ridge regression provides transparent coefficient estimates that are better suited for economic interpretation than tree-based or ensemble methods. Third, Ridge has smaller standard errors for R 2, Adjusted R 2, RMSE, and MAE, indicating more stable out-of-sample performance. Therefore, Ridge is adopted as the baseline model for inference, interpretation and session-level analysis. Other models are best viewed as robustness checks on predictive performance.
Model performance comparison

a Out-of-sample R 2across cross-validation folds; the standard error reflects variability across folds.
b Adjusted R 2accounting for the number of predictors; the standard error reflects variability across folds.
c Root mean squared error averaged across cross-validation folds; measures the typical magnitude of prediction errors in the outcome’s units. The standard error reflects variability across folds.
d Mean absolute error averaged across cross-validation folds; captures the average absolute prediction error. The standard error reflects variability across folds.
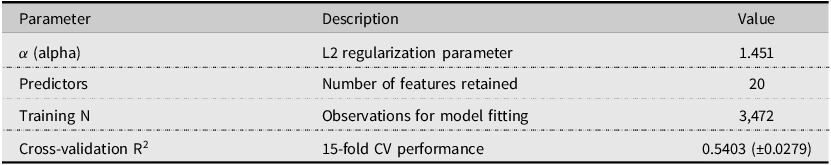
Table 3 provides the technical specifications for Ridge model. The regularization parameter α = 1.451 represents the optimal penalty strength identified through cross-validation, balancing prediction accuracy against coefficient stability. This moderate regularization level indicates sufficient shrinkage to handle multicollinearity without over-penalizing coefficients. The training sample of 3,472 observations (60% of the analytical sample) provides adequate statistical power for reliable coefficient estimation. The cross-validation R2 of 0.5403 (± 0.0279) demonstrates consistent performance across different data folds.
Ridge model specification

4.3. Estimated coefficients and market implications
Figure 2 reports on the Ridge regression coefficients and their statistical significance levels. Sire Reputation dominates all other predictors, with a coefficient of 1.001 (significant at the 1% level). This dominance of paternal lineage confirms findings by Hansen and Stowe (Reference Hansen and Stowe2018) that sire-related variables explain more price variation than dam characteristics in Thoroughbred markets. The magnitude of this effect supports Neibergs’ (Reference Neibergs2001) argument that buyers use sire reputation as a primary quality signal to reduce information asymmetries, particularly when physical inspection opportunities are limited. Dam Reputation is also positive and statistically significant, with a coefficient of 0.062. We interpret the relative magnitudes of the Sire Reputation and Dam Reputation coefficients with caution. Although the estimated coefficient on Sire Reputation is larger, this should not be construed as evidence that maternal lineage is less economically important in the marketplace. Rather, the difference likely reflects disparities in measurement precision. Stallions sire substantially have more offspring, allowing their market performance to be estimated with lower variance and greater statistical stability. In contrast, individual mares produce far fewer foals over longer time horizons, limiting the observable sample size and increasing estimation noise for Dam Reputation. The smaller Dam coefficient may thus reflect attenuation due to measurement constraints rather than weaker economic relevance.
Coefficients from the Ridge model.

The estimated coefficient of First-Crop Status (0.373, significant at the 1% level) is also substantial in size. The share of first-crop yearlings is lower in the earliest sessions – 24.20% in Session 1 and 28.57% in Session 2 – than in several later sessions, where it rises above 35% and reaches 41.01% in Session 8. Combined with the greater concentration of sires and dams in Sessions 1 and 2 (Appendix Table A3), this pattern suggests that pricing in the earliest sessions is driven more strongly by established pedigree signals, which may attenuate the observable role of first-crop status in those segments.
Year fixed effects relative to the 2020 baseline are all positive and statistically significant at the 1% level, with 2021 showing the largest coefficient at 0.622, followed by 2022 (0.600), 2024 (0.543), and 2023 (0.500). These coefficients indicate that market conditions throughout the post-2020 period were stronger than in the baseline year. These temporal patterns align with Plant and Stowe’s (Reference Plant and Stowe2013) documentation of cyclical bloodstock markets responding to broader economic conditions. The larger post-2020 coefficients also likely reflect changes in the bloodstock market following the COVID-19 pandemic, including stronger demand and broader shifts in investment conditions.
Among the remaining pedigree and cross-performance variables, Total Earnings for the Sire–Broodmare Sire Cross (0.254), Male Indicator (0.177), Sire Black-type Winner Rate (0.161), and Sire Foals (0.147) all exert positive and statistically significant effects, indicating that both pedigree depth and demonstrated elite performance remain important correlates of auction price. Intermediate Dosage (0.093) is also positive and significant, while Broodmare Sire Foals (0.080) is positive and significant at the 5% level. Starters for the Sire–Broodmare Sire Cross have a relatively large negative coefficient (-0.334, significant at the 1% level). This estimate should be interpreted cautiously, however, because the cross-performance variables are closely related and may capture overlapping dimensions of pedigree history.
Among the other covariates, AEI for the Sire–Broodmare Sire Cross (0.036) and Broodmare Sire Black-type Winner Rate (0.030) are positive but not statistically significant. Several dosage variables have small negative coefficients. Solid Dosage shows a modest negative coefficient (−0.069) and is only marginally significant at the 10% level, whereas Brilliant Dosage (−0.036), Classic Dosage (−0.039), and Professional Dosage (−0.005) are not statistically significant. Overall, these patterns suggest that dosage composition plays a much smaller role in price formation when conditioning on commercial pedigree reputation, year fixed effects, and first-crop status.
4.4. Robustness check and diagnostic analysis
Because the 2020 sale occurred during the COVID-19 pandemic, we examine whether the inclusion of this unusually disrupted year affects our predictive results. Specifically, we test whether the 2020 price distribution differs from other sale years. The Kruskal–Wallis test results indicate that the 2020 price distribution is statistically different from each subsequent sale year (Table A1). This evidence suggests that 2020 represents a distinct pricing environment. Appendix Table A7 reports a robustness check that excludes 2020 observations and re-estimates the Ridge model on the 2021–2024. The sample results achieve an out-of-sample R2 of 0.5257, with a test RMSE of 0.9947 and a test MAE of 0.8088. These results remain broadly comparable to the full-sample specification, indicating that the paper’s main findings are not driven solely by the unusual pricing conditions of the COVID-year sales environment.
We further evaluate temporal stability using a leave-one-year-out cross-validation (LOYO-CV) procedure, in which models are iteratively trained on four years of data and evaluated on the held-out year (Table A2). The LOYO-CV results reveal meaningful variation across folds. In particular, predictive performance declines substantially when 2021 is held out, with out-of-sample R2 falling from 0.37 in the strongest fold to 0.17 in that case. This pattern suggests that part of the model’s explanatory power reflects macroeconomic shifts in addition to cross-sectional pricing relationships. Because year fixed effects are included, these temporal shocks are partially absorbed in estimation. Still, the sensitivity of out-of-sample performance to specific years underscores the importance of caution when interpreting pooled predictive accuracy.
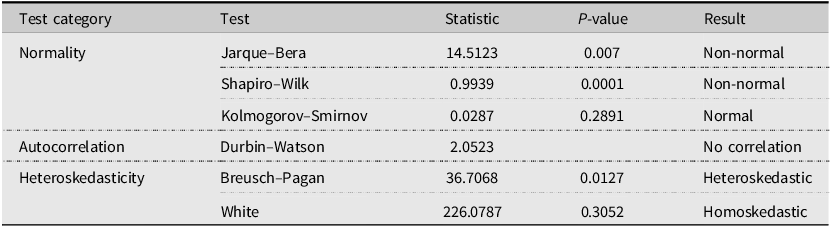
For Ridge model diagnostics, we find that the Ridge model satisfies some, but not all, of the standard regression diagnostics. Normality tests provide mixed evidence. The Jarque–Bera test (statistic = 14.5123, p = 0.007) and the Shapiro–Wilk test (statistic = 0.9939, p = 0.0001) both reject the null of normally distributed residuals, whereas the Kolmogorov–Smirnov test (statistic = 0.0287, p = 0.2891) fails to reject normality. These departures from normality are common in price regressions and are less concerning in a large sample such as ours (n = 5,788), where asymptotic inference remains reliable, particularly when combined with heteroskedasticity-robust standard errors (White, Reference White1980). The Durbin–Watson statistic of 2.0523 is very close to the benchmark value of 2, indicating no meaningful serial correlation in the residuals. Heteroskedasticity tests yield mixed evidence. The Breusch–Pagan test (statistic = 36.7068, p = 0.0127) rejects homoskedasticity at conventional significance levels, whereas the White test (statistic = 226.0787, p = 0.3052) does not reject constant variance. This discrepancy likely reflects differences in test sensitivity: the Breusch–Pagan test is more responsive to linear forms of heteroskedasticity, whereas the White test is designed to detect more general nonlinear variance patterns.
4.5. Market segmentation analysis
The Keeneland September Yearling Sale is a multi-session auction in which yearlings are strategically placed across sessions based on conformation, pedigree strength, sire power, and recent family sales history. In most years, the sale includes twelve sessions organized across Books 1–5, although the 2021 sale included only eleven sessions. Early sessions feature yearlings with stronger expected commercial appeal, while later sessions include a broader mix of yearlings with more variation in pedigree quality and expected market value (Keeneland Association, 2024). This structured placement reflects meaningful market segmentation. Consistent with this institutional design, Table A3 shows that Sessions 1 and 2 contain fewer unique sires and dams, indicating more concentrated pedigree representation in early sessions. Motivated by this institutional structure, we evaluate model performance at the session level to assess whether predictive accuracy varies systematically across market segments within the sale.
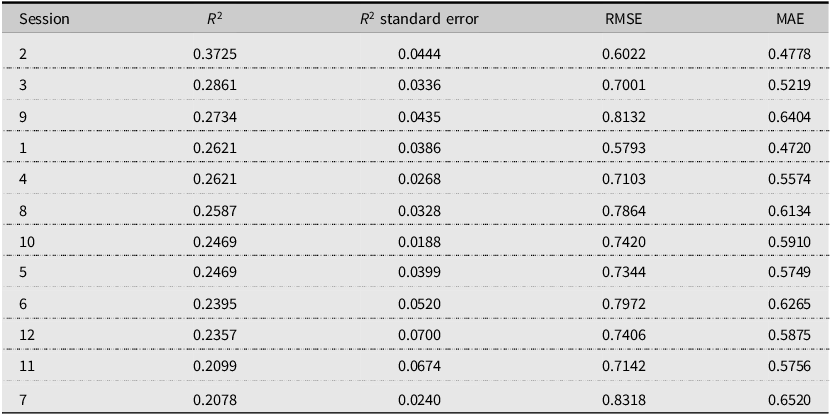
Table 5 shows that model performance varies substantially across Keeneland’s 12 sessions, with R2 ranging from 0.2078 to 0.3725. Session 2 achieves the highest predictive accuracy, followed by Sessions 3 and 9, whereas Sessions 7 and 11 exhibit the weakest fit. The average session-level R 2 of 0.258 (SD = 0.043) indicates moderate predictive power overall but also substantial heterogeneity across sessions. Only one session exceeds an R2 of 0.30, while six sessions fall below 0.25. This performance gradient does not align neatly with session order. Although several early sessions perform relatively well, predictive accuracy does not decline monotonically as the sale progresses; notably, Session 9 ranks third overall, while Session 7 records the weakest performance despite occurring in the middle of the sale. This pattern suggests that predictability depends less on simple temporal ordering than on the underlying composition of horses within each session.
Session-level model performance (ranked by R2)

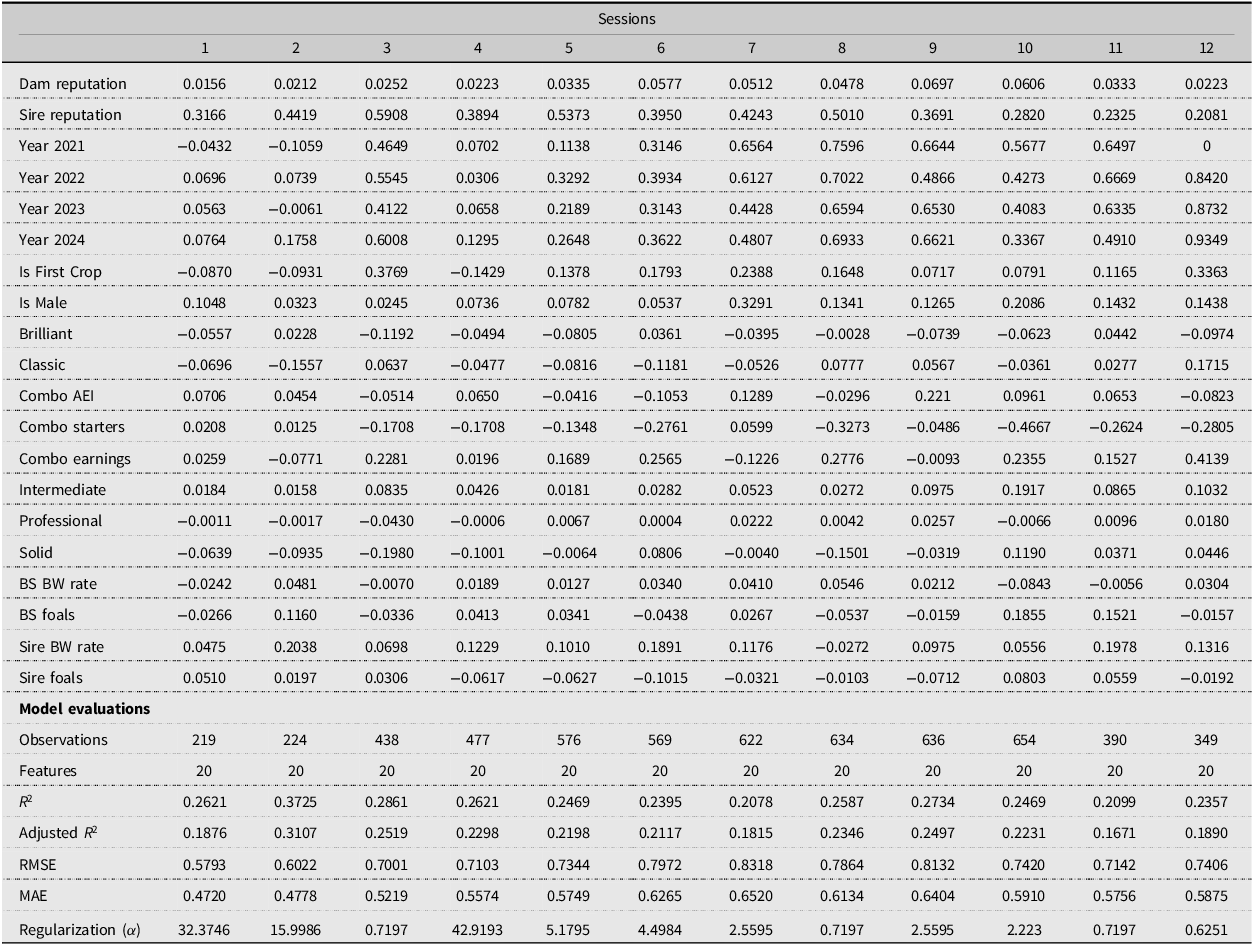
Table 6 shows that session-level coefficients vary, but most are not statistically significant, likely due to small sample sizes. As a result, these estimates should be interpreted cautiously and not overemphasized. The estimated coefficient on Sire Reputation ranges from 0.5908 in Session 3 to 0.2081 in Session 12, a nearly threefold difference. This pattern suggests that buyers in earlier sessions incorporate stallion quality more systematically into their valuations. Regarding the first-crop status, the estimated coefficient is strongly positive in Session 3 (0.3769) and remains sizable in Session 12 (0.3363), but it is negative in Sessions 1, 2, and 4. This variation indicates that the speculative value associated with unproven sires is not uniform across market segments.
Session-level ridge regression coefficients

Significance levels: *** p < 0.01, ** p < 0.05, * p < 0.10. Standard errors computed using 1,000 bootstrap samples.
Table 6 also reinforces the segmentation evident in Table 5. Our model appears to provide its greatest practical value in Sessions 2 and 3, where predictive fit is strongest and pedigree signals are more systematically related to price. By contrast, in Sessions 7 and 11, where R2 is 0.2078 and 0.2099, respectively, pedigree-based valuation appears to offer less information. Buyers in these sessions may therefore need to rely more heavily on physical inspection and subjective assessment. More broadly, these patterns are consistent with differences in price-discovery efficiency across market segments. Higher-quality sessions exhibit stronger alignment between observable pedigree signals and prices, creating more efficient price discovery (Chezum and Wimmer, Reference Chezum and Wimmer1997). Lower-quality sessions feature more casual participants and greater information asymmetries, leading to noisier pricing. This aligns with findings from other agricultural markets where product heterogeneity reduces pricing efficiency (Wang et al., Reference Wang, Kim and Tejeda2025).
5. Discussion
Our findings show that machine learning models can capture a meaningful proportion of variation in Thoroughbred yearling auction prices (out-of-sample R 2 around 0.54). This level of explanatory power indicates that pedigree information, while incomplete, remains important for yearling auction pricing. Model performance varies substantially across Keeneland’s session structure. Predictive accuracy peaks in Sessions 2 and 3 (R 2 ≈ 0.3725 and 0.2861, respectively), where observable pedigree signals appear to align more closely with prices. Session 9 also performs relatively well (R 2= 0.2734), indicating that strong model fit is not confined exclusively to the earliest books of the sale. Predictive performance declines to approximately 0.21 in Sessions 7 and 11, suggesting that in weaker-fit sessions, pedigree information captures a smaller share of price variation.
The dominance of reputation-based variables provides important insight into market information under asymmetric conditions. Sire Reputation emerges as the most influential predictor, with the largest positive coefficient in the Ridge model. This finding echoes Hansen and Stowe (Reference Hansen and Stowe2018) and Neibergs (Reference Neibergs2001), who emphasize the centrality of sire-related signals in reducing buyer uncertainty. However, Dam Reputation remains economically meaningful despite its smaller estimated coefficient. This smaller magnitude likely reflects greater measurement noise, as dams have far fewer observable offspring than sires. Notably, first-crop status also remains economically important, confirming that novelty and speculation drive buyers’ willingness to pay for unproven sires.
Several limitations warrant consideration. First, the Sire Reputation index is constructed from historical auction outcomes, which raises potential concerns regarding circularity and endogeneity. Because past prices may embed persistent market perceptions and unobserved quality signals, the estimated coefficients should not be interpreted as causal effects. Rather, the model identifies predictive associations conditional on observed information. Second, the analysis is based on a single major auction venue and a specific time window, which limits external validity. Pricing dynamics may differ across sales formats (e.g., select vs. open sales), geographic regions, buyer composition, or broader macroeconomic conditions. While the Keeneland September Sale represents the largest and most influential yearling market, results may not fully generalize to other platforms such as Fasig-Tipton or Ocala Breeders’ Sales Company (OBS), where market structure, buyer compositions, and information environments differ. Future research should extend the framework to multiple auction venues and longer time horizons to assess cross-market robustness. Comparative analysis across sales formats and macroeconomic regimes would help disentangle venue-specific effects from broader structural pricing mechanisms. Such multi-market validation would strengthen external generalizability and provide a more comprehensive understanding of Thoroughbred price formation. Third, some session-level comparisons are based on relatively small subsamples, which may increase estimation variance and reduce precision. Fourth, approximately 46% of the variation in Thoroughbred yearling auction prices remains unexplained. This reflects the limits of catalog data in capturing key determinants of value, particularly physical conformation, soundness, and subjective assessments. The weak and inconsistent predictive power in later and weaker-fit sessions reinforces the conclusion that pedigree-based models provide less guidance where quality converges and idiosyncratic factors dominate. Future research could expand predictive accuracy by integrating multimodal data sources, such as computer vision analysis of yearling conformation, natural language processing of catalog narratives, and veterinary or behavioral records.
Our findings have several practical and policy implications for market participants. For sellers, these models can inform reserve pricing and consignment strategy, especially in elite sessions where pedigree signals are most predictive. For buyers, our models provide data-driven benchmarks to complement subjective judgments, reducing uncertainty in a market characterized by information asymmetries. For breeders, the strong role of sire and reputation-based signals underscores the economic value of long-term investment in pedigree quality and performance visibility, as reputation appears to function as a central valuation anchor in the yearling market. For consignors, the variation in predictability across sessions suggests that sale placement strategy may materially influence pricing outcomes, particularly in higher-tier sessions where observable information is more systematically capitalized into bids. For auction organizers, the results highlight the importance of transparent and standardized information disclosure, as clearer pedigree and performance metrics may enhance price discovery and reduce uncertainty. More broadly, strengthening reporting practices and facilitating consistent access to reputational data may improve market efficiency by allowing buyers to more effectively process available signals when forming bids.
6. Conclusion
Our study demonstrates that machine learning methods, particularly Ridge regression, can effectively model Thoroughbred yearling prices at the Keeneland September Sale. Our final specification explains approximately 54% of out-of-sample log-price variance across 5,788 yearlings sold between 2020 and 2024, placing our results well within the range of prior hedonic studies of bloodstock markets (Plant and Stowe, Reference Plant and Stowe2013; Robert and Stowe, Reference Robert and Stowe2016).
While our analysis focuses on Thoroughbred yearling sales, the methodological framework has broader relevance. Many agricultural markets use auctions to allocate heterogeneous assets under uncertainty. Markets for cattle, timber, fish, and online livestock, for example, all involve variation in product quality and substantial information asymmetry between buyers and sellers. The framework we develop offers a replicable template for future studies on asset valuation under uncertainty, where both predictive performance and economic interpretability are essential.
Future research should integrate multimodal and non-traditional data sources. Computer vision applied to conformation images, natural language processing of catalog descriptions or veterinary records, and real-time bidding dynamics represent promising extensions. Incorporating such features may improve predictive accuracy and yield a more comprehensive understanding of how both observable and latent signals shape price formation. As institutional investors and professional buyers become more active in bloodstock markets, reliable data-driven valuation tools will become increasingly important. These tools can help buyers evaluate yearlings more systematically and allocate capital more efficiently.
Model diagnostic test results

Supplementary material
The supplementary material for this article can be found at https://doi.org/10.1017/aae.2026.10050.
Data availability statement
The data used in this study was compiled from two primary sources. Sale transaction records (2020–2024) were collected from publicly available archives on Keeneland’s official website (www.keeneland.com), including sale prices, hip numbers, sex, color, and session placementFootnote 2 . Pedigree and performance metrics were obtained from Equineline.com Free 5-Cross Pedigree reports, operated by The Jockey Club Information Systems (TJCIS)Footnote 3 . The compiled dataset integrating these sources is available from the corresponding author upon reasonable request. Researchers seeking to replicate this study should note that while Keeneland sale results are publicly accessible, Equineline data usage may be subject to TJCIS terms of service. The analysis code and processed dataset are available upon request to the corresponding author.
Author contribution
Conceptualization, J.C. and Y.Y.; Methodology, T.N., T.P., and Y.Y.; Formal Analysis, T.N., T.P. and Y.Y.; Data Curation, T.N. and T.P.; Literature Review, T.M.; Writing – Original Draft Preparation, Y.Y.; Writing – Review and Editing, T.N. and Y.Y.; Supervision, J.C. and Y.Y.; Project Administration, J.C. and Y.Y.
Financial support
This study was conducted without external funding from public, commercial, or not-for-profit sources.
Competing interests
The authors have no conflicts of interest
Declaration of AI use
Artificial intelligence tools (e.g., ChatGPT) were used for minor editorial assistance, such as checking grammar, spelling, and typographical errors. No AI tools were employed in the design of the study, data analysis, interpretation of results, or drafting of substantive content. The authors take full responsibility for the content of the manuscript.


 Open access