


1. Introduction
Many international institutions such as the European Space Agency or the World Meteorological Organization, recognize glacier mass balance as one of the essential climate variables (Dolman and others, Reference Dolman2016) required for climate system monitoring because it has a direct and undelayed response to atmospheric climate change (e.g., Oerlemans, Reference Oerlemans2001). Long-term in situ glacier monitoring is thus crucial in the present context of global warming. Of the 41 glaciers worldwide listed as ‘reference glaciers’ by the World Glacier Monitoring Service (WGMS), none are located in the Hindu Kush–Karakoram–Himalaya (HKH) region (Bolch and others, Reference Bolch, Wester, Mishra, Mukherji and Shrestha2019; Zemp and others, Reference Zemp2019). The HKH, however, hosts the largest glacierized area outside the polar regions (Pfeffer and others, Reference Pfeffer2014; Bolch and others, Reference Bolch, Wester, Mishra, Mukherji and Shrestha2019), with large and rapidly growing populations living downstream and partly relying on glacier meltwater for their hydro-economy (e.g., Immerzeel and others, Reference Immerzeel2019; Pritchard, Reference Pritchard2019). In HKH, mass-balance series are short (often <1 decade), often discontinuous, and lack validation and calibration using decadal geodetic surveys (Azam and others, Reference Azam2018).
There are ~15 glaciers presently surveyed in HKH using the classical glaciological method (Azam and others, Reference Azam2018). Only two series have been validated using geodetic surveys so far: Chhota Shigri Glacier in Northern India in the western Himalaya initiated in 2002, the longest mass-balance record in HKH (Azam and others, Reference Azam2016) and West Changri Nup Glacier in eastern Nepal, in the central Himalaya, initiated in 2010 (Sherpa and others, Reference Sherpa2017). In Nepal, the longest series initiated in 2007 comes from Mera Glacier but its calibration or validation using a geodetic survey is needed, as recommended by Zemp and others (Reference Zemp2013).
The objectives of this contribution are to update the on-going mass-balance series of Mera Glacier, to compare it with the geodetic mass balance assessed between 2012 and 2018 using DEM differencing, to identify potential biases and to track the sources of such biases using a combination of in situ and remotely sensed measurements.
2. Study site
Mera Glacier (27.7°N, 86.9°E, 5.06 km2 in 2012) is a debris-free summer-accumulation glacier located in the upper Dudh Koshi basin, in the Everest region (Central Himalaya) (Fig. 1). From the summit at 6390 m a.s.l., the glacier flows north and divides into two main branches at 5780 m a.s.l., the Mera branch oriented north and then west down to 4910 m a.s.l. and the Naulek branch oriented north-east until its lowest elevation at 5220 m a.s.l. Details regarding the characteristics of Mera Glacier as well as the climate conditions in which it is located can be found in Wagnon and others (Reference Wagnon2013).
Map of 2012–18 elevation change (in m a−1) of Mera Glacier showing the network of ablation stakes (black dots), the accumulation sites (blue squares), the transverse and longitudinal profiles surveyed by differential global navigation satellite system (GNSS) to measure elevation changes (purple lines) and the glacier outlines in 2012 (black line – total glacier area of 5.06 km2) and 2018 (yellow line – total glacier area of 4.84 km2). Black zones are steep areas with no data. Elevation lines are extracted from the 2012 Pléiades DEM. The inset map gives the location of Mera Glacier and the Dudh Koshi catchment in Nepal.

3. Data and methodology
3.1. Glacier-wide mass balance from the glaciological profile method
The annual glacier-wide mass balance Ba is calculated according to:

where bz is the point surface mass balance (m w.e. a−1 of a given elevation band, z, of area sz (m2) and S is the total glacier area (m2). Point mass-balance measurements have been performed every year in November since 2007 (early December in 2014 and 2015). They are obtained from temporal emergence differences of bamboo stakes and/or manual drillings in the accumulation area using an artificially coloured snow layer to undoubtedly localize the previous year horizon (Fig. 1). Ice density is taken as 900 kg m−3 and snow densities are measured in the field, ranging from 370 ± 30 kg m−3 in the ablation area to 400 ± 40 kg m−3 in the uppermost accumulation area. More details regarding the methodology are provided in Wagnon and others (Reference Wagnon2013) and Sherpa and others (Reference Sherpa2017). Contrary to those two studies in which glacier hypsometry (and consequently total area) was considered unchanged, here it is assumed to vary linearly with time over the measurement period (2007–19). The rate of area changes for each altitude band is derived from the glacier hypsometries in 2012 and 2018, extracted from Pléiades DEMs where glacier outlines are manually delineated (see Section 3.2. and the 2012 and 2018 glacier outlines in Fig. 1). Mass balance is obtained for every 10 m altitudinal range using linear fits to all available in situ point mass-balance measurements versus elevation, considering separately the accumulation area and both branches of the ablation area, i.e. Mera and Naulek branches (Fig. 1). The number of point mass-balance measurements varies from seven in 2012/13 to a maximum of 33 in 2017/18, depending on how many stakes are broken or buried by snow (Table 1). Every 10 m altitudinal range area is then multiplied by its corresponding mass balance, summed over the entire glacier and finally divided by the total glacier area S to get the glacier-wide mass balance (Eqn (1)). Averaging the errors related to the measurements themselves and the distribution of sampling sites, we obtain a mean overall accuracy of ± 0.28 m w.e. a−1 for Ba (Wagnon and others, Reference Wagnon2013).
Ba, number of ablation (negative bz) or accumulation measurements (positive bz), total glacier area, equilibrium line altitude (ELA), accumulation area ratio (AAR) and mass-balance gradients db/dz for Mera Glacier
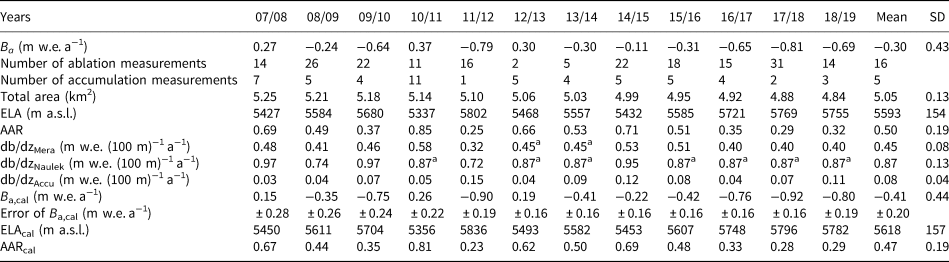
Mass-balance gradients are distinguished between Mera, Naulek branches and the accumulation area (referred as Mera, Naulek and Accu subscripts, respectively) (Wagnon and others, Reference Wagnon2013). The mean and standard deviation (SD) for each variable are also shown. Measurements are performed in November except early December in 2014 and 2015. Ba,cal, the annual glacier-wide mass balances calibrated with the 2012-18 geodetic mass balance are also shown, with their respective annual random errors (see section S3 in supplementary information for the calculation of this error), calibrated equilibrium line altitude (ELAcal) and calibrated accumulation area ratio (AARcal).
a Applying a 2007–19 mean gradient because not enough stakes were available to derive a linear fit.
The supplementary text (section S3) presents an alternative method to estimate the annual glacier-wide mass balance from point measurements using the nonlinear model of Vincent and others (Reference Vincent2018). This model is applied not only for comparison purposes but above all to carry out a rigorous evaluation of uncertainties (see Section 4.3. and supplementary section S3.2).
3.2. Glacier-wide mass balance from the geodetic method
3.2.1. 2012–18 mass balance using DEM differencing
Two 4 m DEMs are generated using the Ames Stereo Pipelines (Berthier and others, Reference Berthier2014; Shean and others, Reference Shean2016) from Pléiades stereo pairs acquired on 25 November 2012 and 28 October 2018. The October 2018 DEM is co-registered to 478 global navigation satellite system (GNSS) points collected on-glacier between 20 and 25 November 2018 using the Nuth and Kääb (Reference Nuth and Kääb2011) methods (Fig. S1 of the supplementary information). The mean elevation difference between the GNSS points and DEM is 0.03 m (the median is set to 0 m in the co-registration procedure) and the standard deviation of the differences is 0.48 m. The November 2012 DEM is then co-registered to the October 2018 DEM (Nuth and Kääb, Reference Nuth and Kääb2011) using nearly 4 megapixels over the stable terrain and DEMs are differentiated. The map of elevation change is almost gap-free on Mera Glacier (<1% of voids). We calculate the mean elevation change using the local mean hypsometric method (McNabb and others, Reference McNabb, Nuth, Kääb and Girod2019) on bins of 10 m after filtering out pixels whose value differ by more than five normalized median absolute deviation (NMAD) from the mean (Höhle and Höhle, Reference Höhle and Höhle2009), which represent 4% of the pixels. The total volume change (ΔV) is defined as $\Delta V = \mathop {dh}\limits^{\prime} \times\, S_{2012}$ where $\mathop {dh}\limits^{\prime}$
 is the glacier mean elevation change (m) and S 2012 (m2) is the glacier area in 2012.
The geodetic mass balance (B g) is then calculated as:

where f ΔV = 850 kg m−3 is the volume to mass conversion factor i.e. the assumed density of the lost volume averaged over the entire glacier (Huss, Reference Huss2013) and S 2018 the glacier area in 2018. The factor 10−3 is needed to convert the geodetic mass balance from kg m−2 (i.e. mm w.e.) to m w.e.
The uncertainty on the volume change (σ ΔV), is calculated as a quadratic sum:
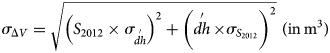
where the uncertainty on the mean elevation change ($\sigma _{\mathop {dh}\limits^{\prime} }$ in m) is assessed using the so-called patch method, which consists in sampling patches of the stable terrain that have various areas, in order to constrain empirically the decay of the error with the averaging area (Miles and others, Reference Miles2018 and section S2 of the supplementary information). The uncertainty on the area ($\sigma _{S_{2012}}$
 in m2) is calculated as the product of the outline perimeter and twice the ground sampling distance of the Pléiades panchromatic images (1.5 m). The uncertainty on the geodetic mass balance $\sigma _{B_g}$
 is calculated as:

where $\sigma _{f_{\Delta V}}$ = 60 kg m−3 is the uncertainty on the volume to mass conversion factor (Huss, Reference Huss2013). The factor 10−3 is needed to obtain the uncertainty of the geodetic mass balance in m w.e. We assume no uncertainty on the area in this calculation, as the uncertainty on the area is taken into account in the uncertainty on the volume change.
3.2.2. Validation of satellite-derived elevation change using differential GNSS data
Fourteen transverse and longitudinal profiles located at different elevations over adequate areas of the glacier (preferentially smooth and flat areas; Fig. 1) are regularly surveyed using dual frequency differential GNSS Topcon units in stop-and-go mode, with an occupation time of five to 10 s and a minimum of seven visible satellites (GPS and GLONAS). From these repeated surveys, we measure the glacier thickness changes exactly along these profiles with an accuracy of ± 0.10 m (Vincent and others, Reference Vincent2016). Each profile is split into 25 m long individual sections over which the differential GNSS and DEM-derived elevation changes are compared. Such differential GNSS surveys are time-consuming in the field and sometimes prone to some differential GNSS failure, and therefore they are not conducted every year for each profile. Figure 2 shows the comparison between annual rates of elevation changes of the profiles surveyed in the field using differential GNSS over different periods and the corresponding annual elevation change rate assessed by DEM differencing between 25 November 2012 and 28 October 2018. For each 25 m long section, we average the Pléiades DEM difference on a 20 m diameter circle centred on the middle of the section. Averaging over a 20 m circle instead of taking pixel-based values reduce potential biases originating from (i) the co-registration of the 2018 DEM on the GNSS points, and (ii) the nonperfectly smooth surface at and around the profiles. The Pléiades stereo-images were acquired exactly at the same time as the field measurements in 2012 (Berthier and others, Reference Berthier2014), but 4 weeks earlier in 2018. No snowfall was recorded during these 4 weeks and ablation was assumed to be negligible during this period of the year (November 2018). Thus, no correction is applied to compare elevation changes from differential GNSS field measurements and DEM differencing. The remarkable agreement between field and satellite data (Fig. 2 – green diamonds) gives confidence in the relative accuracy of the DEMs and in turn in the geodetic mass balance of Mera Glacier. The limited bias (−0.24 m) and the standard deviation (0.52 m) when the same time period is considered (Fig. 2) are in line with previous assessments of Pléiades DEMs over snow and glaciers (e.g., Marti and others, Reference Marti2016; Belart and others, Reference Belart2017; Rieg and others, Reference Rieg, Klug, Nicholson and Sailer2018).
Comparison between annual rates of elevation changes (in m a−1) of 25 m long sections (dots and diamonds) obtained from differential GNSS field measurements along transverse or longitudinal profiles over different periods (from November 2009, 2010, 2012, 2014 or December 2015 to November 2018) and derived by Pléiades DEMs differencing between 25 November 2012 and 28 October 2018. The 1:1 line is shown as a dashed line.

3.3. Calibration of the glaciological mass balance
In case of a systematic bias in the glaciological mass balance, the standard and optimal procedure is to calibrate the glaciological mass balances with the geodetic results, in order to maintain the relative annual variability of the glaciological method while adjusting to the absolute multi-annual values of the geodetic method (e.g., Zemp and others, Reference Zemp2013). The glaciological mass balance, Ba, is calibrated by fitting it to the multi-annual geodetic mass balance, Bg, as follows:

where Ba,cal is the annual calibrated specific mass balance and N is the number of years in the period during which the geodetic mass balance has been obtained. It is noteworthy to mention that the glaciological mass balance covers only the surface mass balance whereas the geodetic mass balance includes also the internal and basal balances, usually assumed small compared to the surface mass balance (Zemp and others, Reference Zemp2013).
3.4. Detection of potential biases from the in situ measurement network
To test potential sources of systematic error of the glaciological mass balance, we compare the mass balance obtained on the one hand with the glaciological profile method and on the other with the flux method (Reynaud and others, Reference Reynaud, Vallon and Letreguilly1986). The surface-specific mass balance B Z of a certain zone of a glacier (referred with the subscript Z) can be described using the mass conservation equation (Cuffey and Paterson, Reference Cuffey and Paterson2010; Nuimura and others, Reference Nuimura2011):

where ρ is the ice density (kg m−3), h is the ice thickness (m), t is time (year), Φin,Z (respectively Φout,Z, in m3 of ice a−1) is the ice flux entering (respectively leaving) the zone of interest and sZ (m2) is the area of interest.
We apply Eqn (6) to two areas of the glacier, the upper zone (subscript UZ) delineated by a 1246 m long cross section at ~5520 m a.s.l. (referred as CS_5520) and the lower zone (subscript LZ) delineated by an 813 m long cross section at ~5350 m a.s.l. (referred as CS_5350) (Fig. 3). Both zones are delineated manually according to the flow lines derived from the ITS_LIVE composite velocity field (Gardner and others, Reference Gardner, Fahnestock and Scambos2019) and the 2018 DEM lines, given that the upper zone contributes to the flow crossing CS_5520 and the lower zone is fed by the flow originating from CS_5350.
Visualization of the upper zone (shaded blue area) contributing to the ice flux Φout,UZ through the highest cross section at ~5520 m a.s.l. (CS_5520, green thick line) and the lower zone (shaded purple area) fed by the ice flux Φin,LZ coming through the lowest cross section at ~5350 m a.s.l. (CS_5350, orange thick line). Also shown are the field velocity measurements (yellow arrows) used to assess the ice flow through both cross sections. The background is a Pléiades ortho-image of 28 October 2018 (copyright CNES 2018, distribution Airbus D&S). The 2012 glacier outline is shown in red.
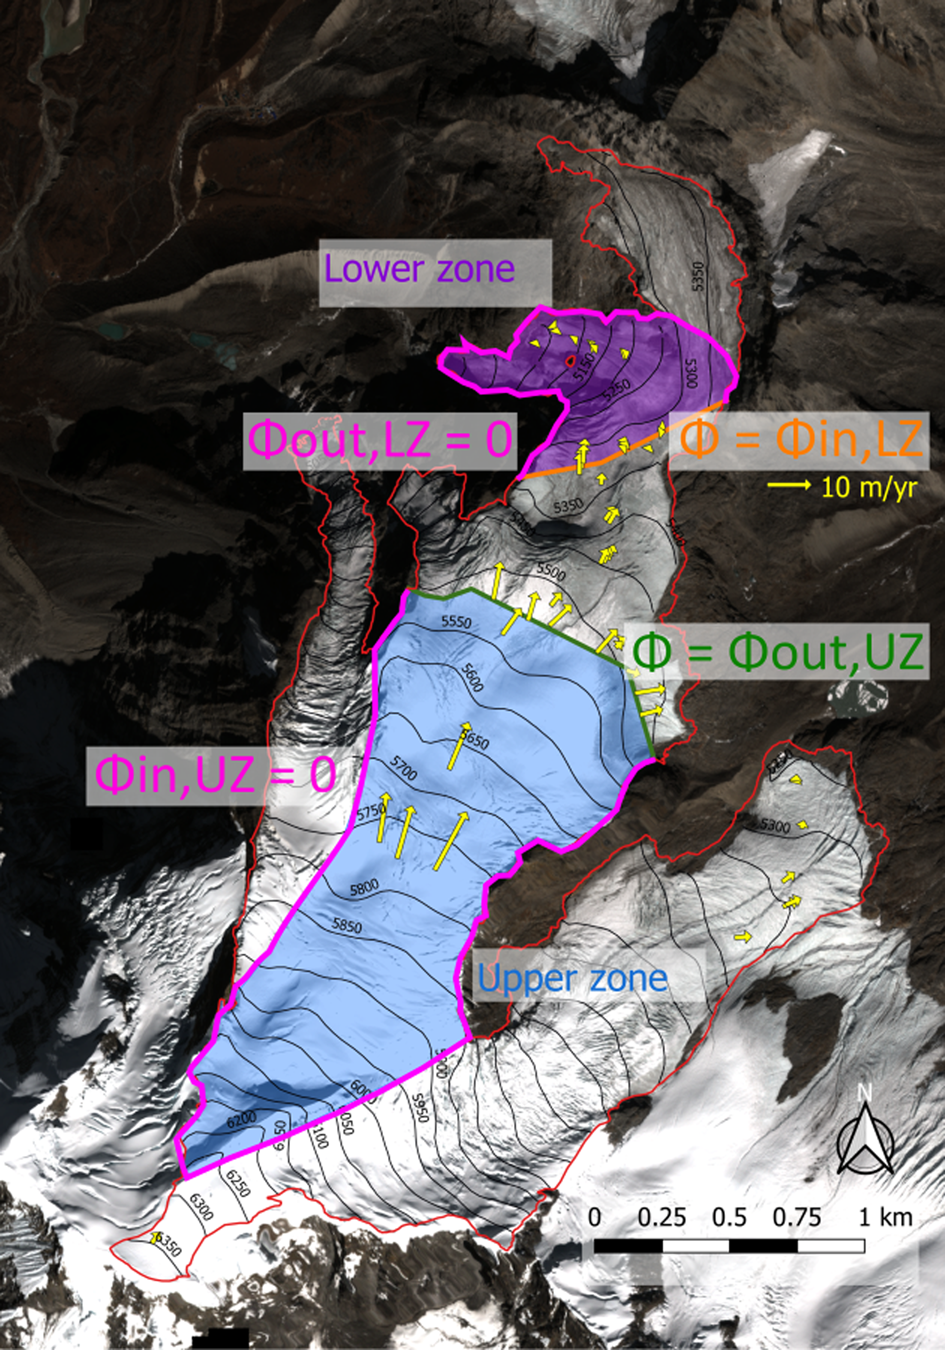
In the upper zone, Φin,UZ = 0 so Eqn (6) gives B UZ = ρ[δh/δt + (Φout,UZ)/s UZ] and in the lower zone, Φout,LZ = 0 so B LZ = ρ[δh/δt − (Φin,LZ)/s LZ] (Fig. 3). The thinning rates δh/δt averaged over the upper and the lower zones are assessed through DEM differencing between 25 November 2012 and 28 October 2018 (5.93 years) and are −0.05 ± 0.07 and −1.42 ± 0.11 m a−1, respectively (Figs 1, 4). We take an ice density of 850 kg m−3 (Huss, Reference Huss2013) and 900 kg m−3 in the upper and lower zones, respectively. Ice fluxes through CS_5520 or CS_5350 (Φout,UZ and Φin,LZ, respectively) are obtained by multiplying the cross-section area and the depth-averaged horizontal ice velocity of the corresponding area (see Wagnon and others, Reference Wagnon2013 for details). Ground penetrating radar measurements performed in November 2009 provided an area of 61 600 ± 9200 m2 (mean thickness of 49 ± 7 m) and 42 400 ± 6400 m2 (mean thickness of 52 ± 8 m) for CS_5520 and CS_5350, respectively (Wagnon and others, Reference Wagnon2013). Based on the −0.62 and −1.08 m a−1 thinning rates calculated by DEM differencing between 2012 and 2018, along CS_5520 and CS_5350, respectively (Fig. 1 and Fig. 4), and taking into account that the thinning rates assessed by differential GNSS along both profiles between 2009 and 2018 are similar to those of 2012–18 (Fig. 2), we revise both section areas averaged over the period 2012–18 to 56 900 ± 9200 and 37 100 ± 6400 m2, respectively, corresponding to a mean thickness of 45 ± 8 m for both sections. The depth-averaged horizontal ice velocity is derived from the mean surface ice velocity obtained by averaging the surface velocities available along each cross section and coming from the stake displacement measured by differential GNSS (Fig. 3). Based on our stake network, we do not detect surface velocity changes along CS_5520 or CS_5350 over the measurement period and velocities are considered unchanged compared with those of the period 2007–12 (Wagnon and others, Reference Wagnon2013). Nye (Reference Nye1965) gives ratios of depth-averaged horizontal ice velocity to mean surface ice velocity varying from 0.8 (no sliding) to 1 (maximum sliding). Without information on the sliding of Mera Glacier, the depth-averaged horizontal ice velocity is assumed to be (0.9 ± 0.1) × mean surface ice velocity along each cross section. The error range of the ice fluxes obtained with this method combines the error range for the cross-section areas and for the depth-averaged horizontal velocity. The ice fluxes at CS_5520 and CS_5350 are 0.35 ± 0.10 and 0.16 ± 0.05 106 m3 of ice a−1.
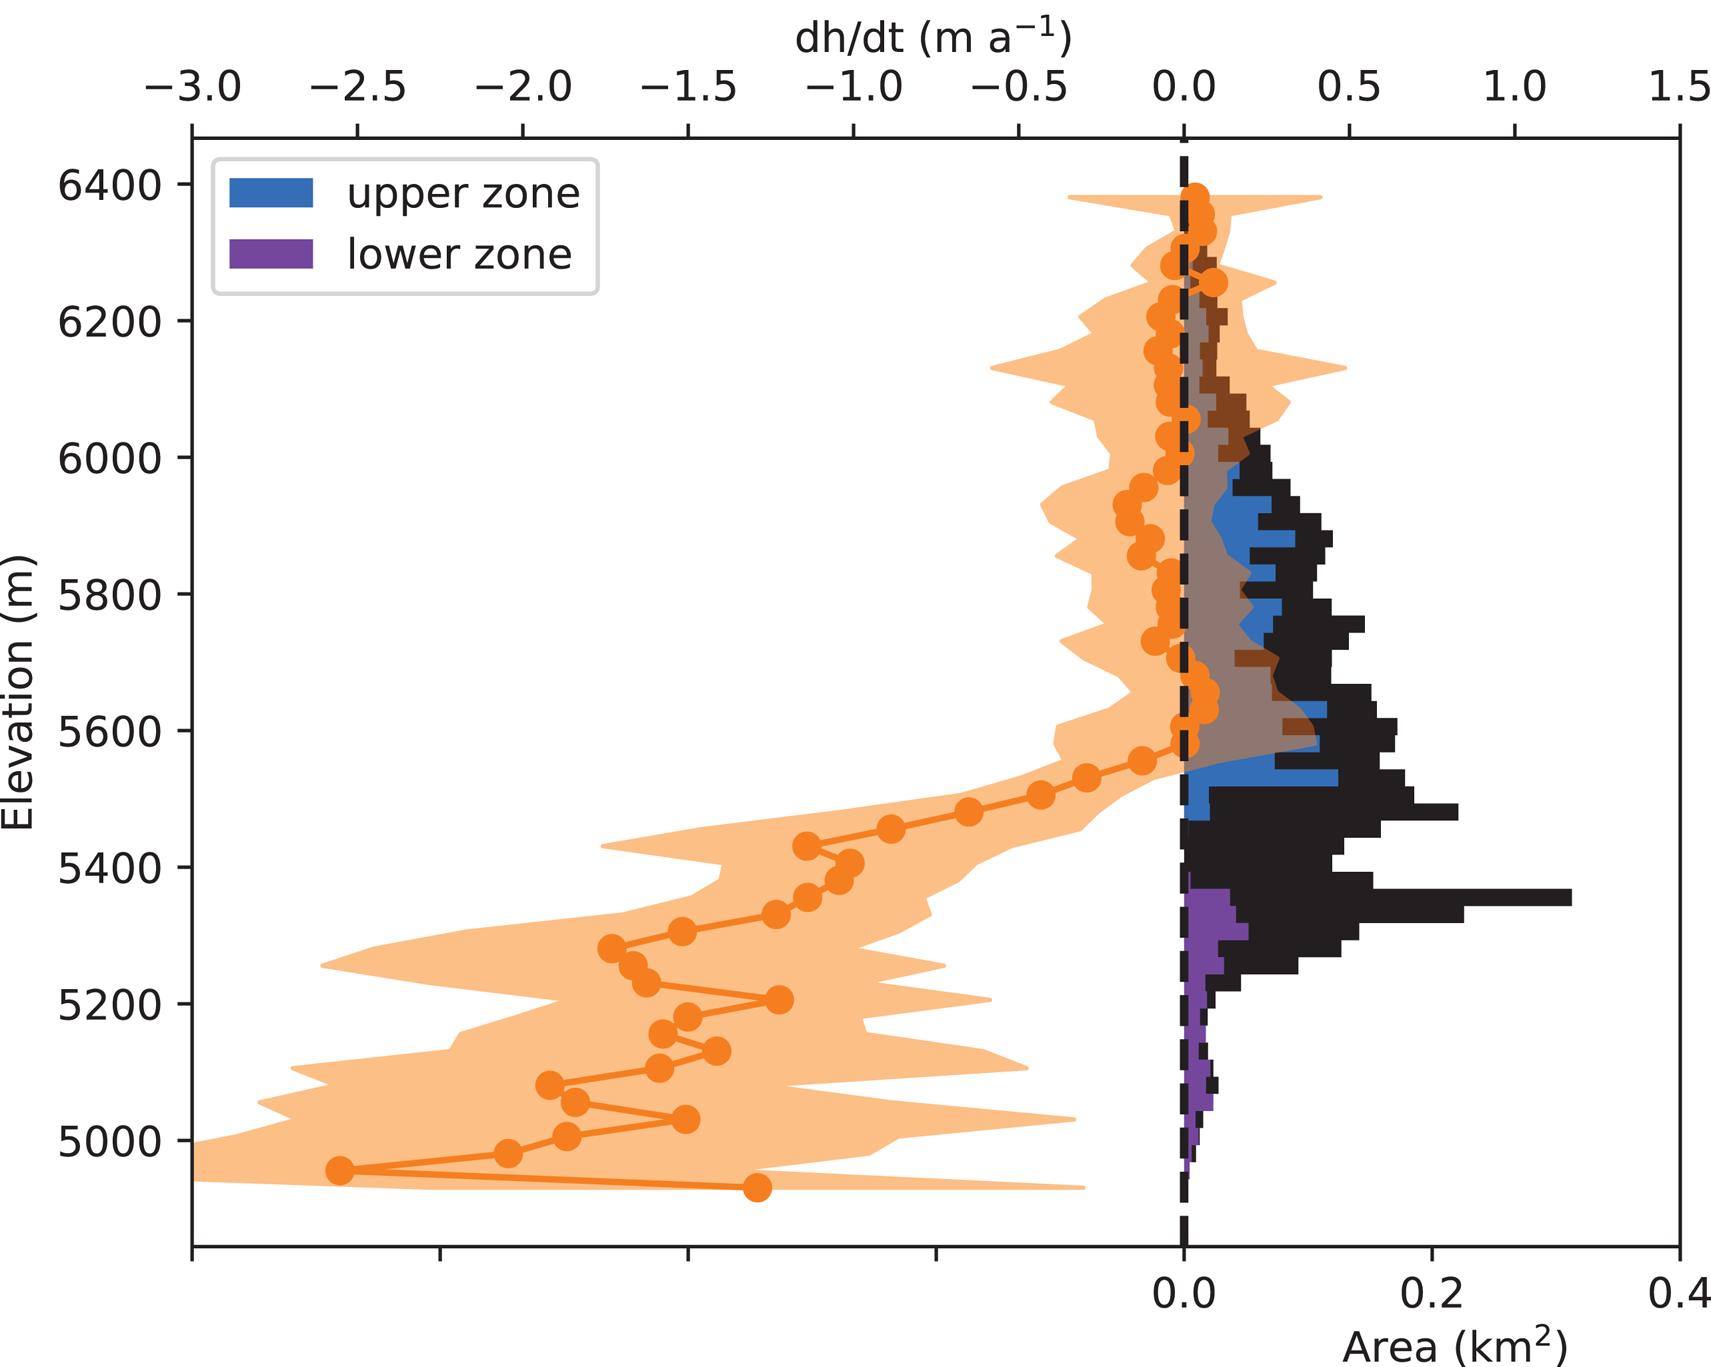
2012 hypsometry of the total glacier area (black histograms), including the upper zone (blue histograms) and the lower zone (purple histograms). The rate of elevation change as a function of elevation of Mera Glacier between 25 November 2012 and 28 October 2018 is shown by orange dots, and the orange shaded area corresponds to one standard deviation.
4. Results
4.1. Annual and cumulative glacier-wide glaciological mass balances between 2007 and 2019
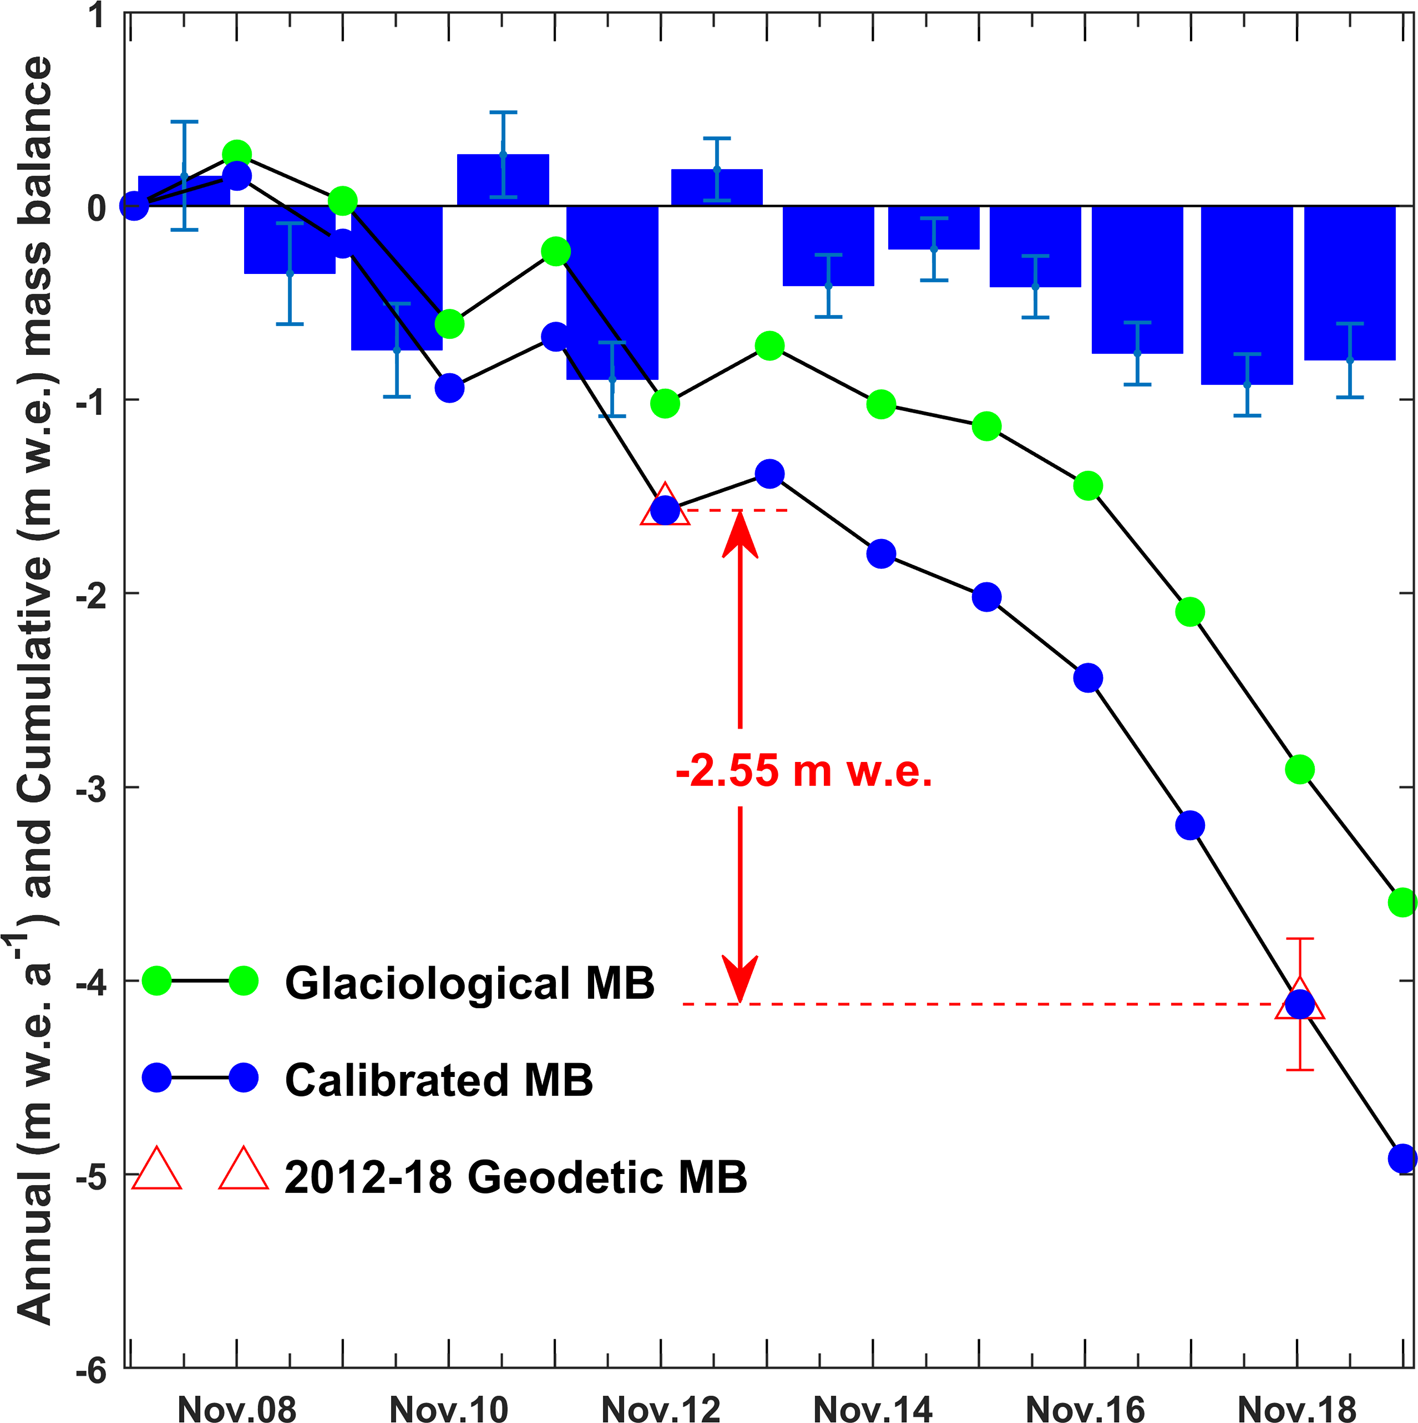
Table 1 gives the annual glacier-wide mass balances of Mera Glacier since 2007, as well as some classical glaciological variables such as glacier area, mass-balance gradients, equilibrium line altitude (ELA) and accumulation area ratio (AAR). Figure 5 displays the annual and cumulative mass balances of Mera Glacier assessed with the glaciological profile method between 2007 and 2019. Over this 12-year period, the mean glacier-wide mass balance Ba is equal to −0.30 ± 0.28 m w.e. a−1, and almost similar over the period 2012–18, with Ba equal to −0.31 ± 0.28 m w.e. a−1.
Cumulative mass balance (MB) of Mera Glacier obtained with the glaciological profile method (black line with green dots) between November 2007 and November 2019, and calibrated (black line with blue dots) to match the 2012–18 geodetic mass balance (red triangles). The annual calibrated mass balances are shown as blue histograms.
4.2. 2012–18 Geodetic mass balance
Mera glacier area was 5.06 ± 0.34 km2 in 2012 and 4.84 ± 0.34 km2 in 2018. Higher thinning rates are observed in the lower part of the glacier. There is almost no thinning and area change above 5600 m a.s.l. (Fig. 1 and Fig. 4). The mean surface elevation change of Mera Glacier between 2012 and 2018 is −3.00 ± 0.27 m, corresponding to cumulative and annual glacier-wide mass balances of −2.55 ± 0.34 m w.e. and −0.42 ± 0.06 m w.e. a−1, respectively.
4.3. Calibration of the glaciological mass balance
Even though the error ranges overlap, the difference between the glaciological and the geodetic annual glacier-wide mass balance between 2012 and 2018 reaches 0.11 m w.e. a−1 suggesting that there is a systematic bias in the glaciological glacier-wide mass balance of Mera Glacier (Huss and others, Reference Huss, Dhulst and Bauder2015). Assuming that the bias is constant with time, and following Eqn (5), the annual glaciological mass balance is thus systematically decreased by 0.11 m w.e. a−1 for each year of the measurement period from 2007 to 2019, resulting in a cumulative mass balance of −4.92 m w.e. and a mean calibrated glacier-wide mass balance Ba,cal of −0.41 ± 0.20 m w.e. a−1. This decrease of mass balance results in an upward shift of the ELA of 25 m with a mean ELAcal of 5618 m a.s.l. between 2007 and 2019 (Table 1). The random error, $\sigma _{B_{a\comma cal}}$ , of the calibrated annual glacier-wide mass balance over the period 2012–18 is calculated using Eqn (12) of Thibert and Vincent (Reference Thibert and Vincent2009). $\sigma _{B_{a\comma cal}}$
 is calculated as a quadratic sum of the error of the geodetic method i.e. $\sigma _{B_g}$
 = 0.34 m w.e. and the residuals of the nonlinear model of Vincent and others (Reference Vincent2018) weighted over the total area of the glacier (see section S3 of supplementary information for the details of the calculations). Inside the 2012–18 calibration period, $\sigma _{B_{a\comma cal}}$
 is equal to 0.16 m w.e. a−1. Outside this period, $\sigma _{B_{a\comma cal}}$
 is larger than 0.16 m w.e. a−1 and is assumed to increase as a function of the time difference to the calibration period (Table 1 and section S3.2 of supplementary information).
The bias-corrected annual and cumulative mass balances are shown in Table 1 and Figure 5, together with the geodetic 2012–18 cumulative mass balance. Since 2013, we observe a succession of negative annual mass balances (mean Ba,cal = −0.59 ± 0.17 m w.e. a−1 between 2013 and 2019), in agreement with the larger thinning rates observed along the profiles surveyed by differential GNSS between 2014 or 2015 and 2018 than those observed between 2009, 2010 or 2012 and 2018 (Fig. 2).
4.4. Tracking the sources of bias
Systematic errors may come from the natural spatial variability of point mass balance which is potentially not assessed properly due to insufficient field data or inaccurate spatial weighting relationship (Thibert and others, Reference Thibert, Blanc, Vincent and Eckert2008). Comparing the mass balances of the upper and the lower zones of the glacier obtained by the glaciological method and the flux method (Fig. 3) allows to detect potential sources of biases. All data used to assess the specific mass balance of both zones are summarized in Table 2, together with their specific mass balance averaged over the period 2012–18, using the glaciological profile method described in Section 3.1.
Specific annual mass balance BZ obtained over the period 2012–18 using the flux method and the glaciological method over two distinct zones of the glacier, the upper zone contributing to the ice flow through CS_5520 and the lower zone fed by the ice flow through CS_5350
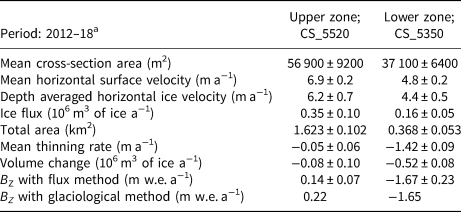
a All values below are calculated over the period 25 November 2012–28 October 2018, and converted into annual values dividing by 5.93 years.
In the lower zone, the mean annual specific mass balances over the period 2012–18 obtained by both methods are in very good agreement. Conversely, in the upper zone, the glaciological mass balance is more positive than the mass balance obtained by the flux method (Table 2). This over-estimation of the mass balance affects about one-third of the glacier i.e. most of the accumulation area.
5. Discussion
The mean annual specific mass balances over the period 2012–18, assessed on the one hand with the flux method and on the other with the glaciological method, are in good agreement in the lower zone of the glacier, but reveal an over-estimation of the mass balance obtained with the latter method in the upper zone (Table 2). This means that the measurement network installed on Mera Glacier is suitable to properly assess the mass balance in its ablation area, but tends to over-estimate the accumulation in the upper part. This is somehow expected as the number of measurement sites decreases with elevation, due to long and difficult access at high altitude. Moreover, snowdrift, sublimation and other wind-driven ablation processes are notoriously large at high elevation and likely responsible for an important spatial variability of mass balance (Wagnon and others, Reference Wagnon2013; Litt and others, Reference Litt2019), making the measurement network potentially poorly representative of the whole accumulation area. This large spatial variability of mass balance is driven by local topography and aspect variable over a few meters, as well as wind direction. However, the measurement network on Mera Glacier is not dense enough to capture this variability. As a consequence, the systematic over-estimation of the glaciological glacier-wide mass balance revealed by the comparison with the geodetic 2012–18 mass balance is likely mainly due to an over-estimation of accumulation by our limited measurement network in the upper part of the glacier. Nevertheless, the difference between the annual specific mass balance in the upper zone obtained by the flux method and the glaciological method (Table 2) is not large enough to explain completely this systematic over-estimation, suggesting that there are potentially other sources of bias not identified yet.
Our study corroborates the tendency for glaciological mass-balance estimates world-wide to have a positive bias with roughly two-thirds of reanalyses producing more negative geodetic mass balances (e.g., Huss and others, Reference Huss, Bauder and Funk2009; Andreassen and others, Reference Andreassen, Elvehøy, Kjøllmoen and Engeset2016; Klug and others, Reference Klug2018; O'Neel and others, Reference O'Neel2019). The reasons for this bias remain often speculative and are mainly attributed to insufficient or erroneous accumulation measurements and a nonrepresentative spatial distribution of the point mass-balance measurements (Huss and others, Reference Huss, Bauder and Funk2009; Andreassen and others, Reference Andreassen, Elvehøy, Kjøllmoen and Engeset2016; Kapitsa and others, Reference Kapitsa2020). This bias is therefore expected to be smallest when the density and the spatial coverage of the measurement sites are highest and when the accumulation is lowest, such as for small to medium, easily accessible glaciers with limited turnover and during a period of considerable mass loss (Andreassen and others, Reference Andreassen, Elvehøy, Kjøllmoen and Engeset2016). For Mera Glacier, the origin of the bias is likely related to the spatial distribution of point mass-balance measurements, especially in the accumulation zone where measurements are scarce.
Over the period 2007–19, the calibrated cumulative mass balance of Mera Glacier is equal to −4.92 m w.e. (vs −3.60 m w.e. before calibration) corresponding to a mean glacier-wide mass balance of −0.41 ± 0.20 m w.e. a−1. Even though the periods do not match, this calibrated mass balance seems in agreement with the region-wide mass balance of −0.33 ± 0.20 m w.e. a−1 between 2000 and 2016 (Brun and others, Reference Brun, Berthier, Wagnon, Kääb and Treichlert2017) and −0.36 ± 0.09 m w.e. a−1 between 2000 and 2018 (Shean and others, Reference Shean2020) for the central Himalaya, suggesting that Mera Glacier is representative of this region. A comparison between Mera mass balance and region-wide mass balance over a common period is still required to confirm this fact.
Mera Glacier is thus far from being in balance and is losing more mass than originally assessed (Wagnon and others, Reference Wagnon2013; Sherpa and others, Reference Sherpa2017). Nevertheless and in agreement with Sherpa and others (Reference Sherpa2017), we still observe a contrasted pattern of surface mass balances of glaciers monitored in the Everest region, with mean 2010–19 glacier-wide mass balances of debris-free Mera, Pokalde (0.09 km2 in 2011, elevation range 5330–5690 m a.s.l.) and West Changri Nup (0.92 km2 in 2013; elevation range 5430–5690 m a.s.l.) glaciers of −0.44 ± 0.17 m w.e. a−1, −0.77 ± 0.28 m w.e. a−1 and −1.48 ± 0.27 m w.e. a−1, respectively (see Table S2 in section S4 of supplementary information for annual mass balances of these three glaciers). In May 2016 in the nearby Rolwaling region, immediately west of the Everest region, Sunako and others (Reference Sunako, Fujita, Sakai and Kayastha2019) started to monitor the debris-free Trambau Glacier (23.34 km2, elevation range 5060–6690 m a.s.l., ~40 km from Mera Glacier) which is more than 4 times larger than Mera and located at similar elevations. They found a mean glacier-wide mass balance of −0.61 ± 0.39 m w.e. a−1 between May 2016 and October 2018, slightly less negative than the calibrated mass balance of Mera Glacier from April 2016 to November 2018 (−0.74 ± 0.16 m w.e. a−1). Farther west, in the Langtang valley, the debris-free Yala Glacier (1.37 km2, elevation range 5143–5681 m a.s.l., ~125 km from Mera Glacier) had a mean glacier-wide mass balance of −0.81 ± 0.27 m w.e. a−1 between November 2011 and November 2017 (Acharya and Kayastha, Reference Acharya and Kayastha2019), compared to −0.42 ± 0.17 m w.e. a−1 for Mera Glacier over the same period. Glaciers located at high elevations such as Mera or Trambau glaciers are losing mass less rapidly than those located at low elevations such as Yala, West Changri Nup and Pokalde glaciers, as already found at the scale of the High Mountain Asia (Brun and others, Reference Brun2019). It seems also that since 2013, glaciers in the Everest region have been losing mass at an accelerated rate compared with the first part of the observation period, as revealed by glacier-wide mass balances (Table 1 and Fig. 4) and also by increased thinning rates since 2014 or 2015 (Fig. 2).
6. Conclusion
We use two DEMs derived from Pléiades stereo-images acquired on 25 November 2012 and 28 October 2018 to assess the geodetic mass balance of Mera Glacier. Thickness changes obtained by DEM differencing are validated in the field using differential GNSS surveys. The herewith validated geodetic mass balance is used as a reference to calibrate the glaciological mass balance which was on average too high by 0.11 m w.e. a−1 before calibration. The comparison between the specific mass balances assessed over two distinct zones of the glacier, delineated by cross sections whose thicknesses are known by GPR measurements, reveals that this over-estimation of the glacier-wide glaciological mass balance at least partly originates from an over-estimation of the mass balance in the accumulation area (Table 2). This is likely due to low spatial representativeness of the sparse measurement sites in this high-altitude area, prone to snowdrift and wind-driven ablation processes responsible for a large spatial variability of mass balance.
Between 2007 and 2019, Mera Glacier is in imbalance with a mean annual calibrated glacier-wide mass balance of −0.41 ± 0.20 m w.e. a−1, in general agreement with region-wide mass balances in the central Himalaya. Since 2013, we observe a succession of negative annual mass-balance years, with a mean annual 2013–19 glacier-wide mass balance of −0.59 ± 0.17 m w.e. a−1, although still less negative than that of glaciers located at lower altitude in the Everest region.
We are planning to maintain this monitoring programme on Mera Glacier in the coming years and hopefully over the long term, with repeated satellite image acquisitions to regularly validate and, if necessary, calibrate the glaciological mass balance, typically every 5–10 years. An effort will also be made to better assess accumulation at high elevation, with a focus on snow redistribution and wind-driven ablation processes. Multiplying measurement sites in the accumulation area is challenging but we are planning to combine different approaches (observation, remote sensing and modelling) to better assess local vertical gradients of precipitation and processes controlling the mass balance at high elevations such as accumulation, sublimation, or snowdrift.
Supplementary material
The supplementary material for this article can be found at https://doi.org/10.1017/jog.2020.88
Acknowledgements
This work has been supported by the French Service d'Observation GLACIOCLIM, now called CRYOBS-CLIM and part of IR OZCAR, the French National Research Agency (ANR) through ANR-13-SENV-0005-04/05-PRESHINE, and has been supported by a grant from Labex OSUG@2020 (Investissements d'avenir – ANR10 LABX56). This work would not have been possible without the support of the JEAI HIMALICE (PIs: D. Shrestha, and Y. Arnaud) and all the efforts from people in the field: porters, students, helpers who are greatly acknowledged here. This study was carried out within the framework of the Ev-K2-CNR Project in collaboration with the Nepal Academy of Science and Technology and Tribhuvan University. EB acknowledges support from the French Space Agency (CNES). Pléiades images were obtained thanks to the ISIS program at CNES. We are also grateful to Prof. Koji Fujita and two anonymous referees and the Scientific Editor Christoph Schneider, whose detailed comments and suggestions have significantly improved the original manuscript.
Data availability
All mass-balance data are available in the Glacioclim database at https://glacioclim.osug.fr/ and through the World Glacier Monitoring Service (WGMS) database.
Author contribution
PW and YA initiated the monitoring program on Mera, Pokalde and Changri Nup glaciers. PW and FB performed the analysis. CV and PW performed the error calculations. All authors participated in some field campaigns, contributed to the analysis and to the paper writing.


 Open access