

Whiteflies are important agricultural pests with a global distribution (Anderson et al., Reference Anderson, Cunningham, Patel, Morales, Epstein and Daszak2004; Lapidot et al., Reference Lapidot, Legg, Wintermantel and Polston2014). Their agricultural importance is associated with damage caused during feeding on the plant phloem and in the production of honeydew (Colvin et al., Reference Colvin, Omongo, Govindappa, Stevenson, Maruthi, Gibson, Seal and Muniyappa2006; Prijović et al., Reference Prijović, Marčić, Drobnjaković, Međo and Perić2013). Honeydew serves both to reduce transpiration and as an inoculation point for saprophytic fungi, which grow over the leaf surface reducing photosynthesis (Colvin et al., Reference Colvin, Omongo, Govindappa, Stevenson, Maruthi, Gibson, Seal and Muniyappa2006). Among the most economically important whiteflies is the greenhouse whitefly, Trialeurodes vaporariorum (Westwood, 1856), which transmits a number of plant viruses of the genera Crinivirus and Torradovirus (Navas-Castillo et al., Reference Navas-Castillo, Fiallo-Olivé and Sánchez-Campos2011, Reference Navas-Castillo, Lopez and Aranda2014). Of these, the Criniviruses, Tomato chlorosis virus (ToCV) and Tomato infectious chlorosis virus (TICV), are of major economic importance in tomato production globally (Wisler, Reference Wisler, Li, Liu, Lowry and Duffus1998; Wintermantel et al., Reference Wintermantel, Hladky, Gulati-Sakhuja, Li, Liu and Tzanetakis2009). In Africa, ToCV and TICV have been reported from Morocco and South Africa (EPPO, 2005) and more recently from greenhouses in Sudan (Fiallo-Olivé et al., Reference Fiallo-Olivé, Hamed, Moriones and Navas-Castillo2011). The viruses are able to infect a wide host range beyond tomato (Fortes et al., Reference Fortes, Moriones and Navas-Castillo2012). Production losses attributed to T. vaporariorum transmitted viruses such as the sweet potato chlorotic stunt virus are a major constraint on sweet potato production in Kenya, with uninfected sweet potatoes yielding 50% more production than infected plants (Ateka et al., Reference Ateka, Njeru, Kibaru, Kimenju, Barg, Gibson and Vetten2004; Miano et al., Reference Miano, LaBonte and Clark2008).
Phylogeographical structure of T. vaporariorum in Sub-Saharan Africa (SSA)
Though T. vaporarioum is globally distributed, few studies have explored the phylogeographical structuring and genetic diversity of T. vaporariorum populations from sub-Saharan Africa (SSA) and in particular Kenya (Mound & Halsey, Reference Mound and Halsey1978; Njaramb, Reference Njaramb2000; Kapantaidaki et al., Reference Kapantaidaki, Ovčarenko, Fytrou, Knott, Bourtzis and Tsagkarakou2015). The majority of phylogeographical studies of T. vaporariorum have been confined to temperate regions (Roopa et al., Reference Roopa, Kumar, Asokan, Rebijith, Mahmood and Verghese2012; Prijović et al., Reference Prijović, Skaljac, Drobnjaković, Zanić, Perić, Marčić and Puizina2014; Kapantaidaki et al., Reference Kapantaidaki, Ovčarenko, Fytrou, Knott, Bourtzis and Tsagkarakou2015). Most of these studies showed a lack of distinct phylogeographical structuring coupled with low genetic diversity.
Roopa et al. (Reference Roopa, Kumar, Asokan, Rebijith, Mahmood and Verghese2012) used both mitochondrial cytochrome c oxidase I (mtCOI) and a nuclear marker (ITS-1) to assess the genetic diversity and phylogeographical structuring of T. vaporariorum within populations in India. They reported no significant differences among T. vaporarioum populations. Kapantaidaki et al. (Reference Kapantaidaki, Ovčarenko, Fytrou, Knott, Bourtzis and Tsagkarakou2015) supported these findings using a combination of mtCOI and secondary endosymbionts. In addition, Prijović et al. (Reference Prijović, Marčić, Drobnjaković, Međo and Perić2013) reported a similar lack of phylogeographical structuring across populations in Serbia and surrounding countries. However, some studies have reported population structuring in different regions, with several drivers implicated as influencing population structure. In particular, Ovčarenko et al. (Reference Ovčarenko, Kapantaidaki, Lindström, Gauthier, Tsagkarakou, Knott and Vänninen2014) reported population structuring in Finland and attributed this to habitat, specifically to field vs. greenhouses populations. Gao et al. (Reference Gao, Zhang, Wu, Zhang, Zhou, Pan, Zhang, Brown and Chu2014) reported population structuring across the different regions of China and suggested the primary driver was multiple introduction points into China. There have been no similar studies in SSA.
Assessment of global population structure
On the basis of these studies we posed the following question: what is the phylogenetic relationship of T. vaporarioum samples from SSA, and in particular Kenya, compared with global populations?
To help answer this question, we carried out a field survey in 2014 across smallholder farms located in the Kenyan highlands, which produce primarily common bean (Phaseolus vulgaris, var humilis Alef). Using T. vaporarioum mtCOI sequences of both the Kenyan T. vaporarioum sequences and global GenBank records, we assessed the following: haplotype distribution and phylogenetic and population structuring within T. vaporarioum sequences. In addition, we estimated the rate of gene flow using Bayesian estimation. We report for the first time global T. vaporarioum population, phylogenetic and haplotype distributions and gene flow estimates in this invasive pest.
Materials and methods
Sample collection
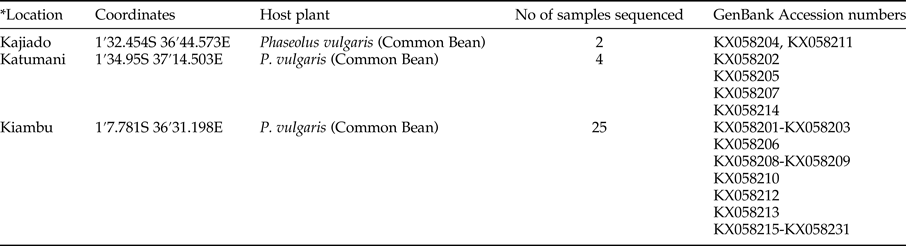
Sample collection of whiteflies was carried out on private property, following informed consent from the landowners. Adult whiteflies were collected on common beans (Phaseoulus vulgaris) growing within smallholder farms in Kenya. Sampling was done in the short rain season of November 2014, across three counties in Katumani/Machakos, Kiambu and Kajiado (table 1). In each farm, common bean plants were examined for the presence of whiteflies across a ‘z’ transect. Whiteflies were collected using a mouth aspirator and aspirated directly into a falcon tube (BD, Biosciences, USA) with RNAlater (Sigma, USA; cat no. R0901). Whiteflies were then shipped to the University of Western Australia and stored at room temperature.
Trialeurodes vaporariorum location and host plants collected in this study.
Genomic DNA isolation
Genomic DNA was extracted from individual whiteflies collected from each of the three sites using the Zymo Insect and Tissue extraction kit (Zymo, USA) as described by the manufacturer. Individual whiteflies were added into a ZR Bashing bead lysis tube containing 750 µl lysis solution. Bashing beads were then mounted on a Fast Prep®-24 MP bead beater and ground at 6 M/S for 40 s. Bashing beads were centrifuged at 10,000 × g for 1 min. Subsequent steps were as described by the manufacturer, with the only modification being the elution of genomic DNA with 30 µl of nuclease-free water followed by a centrifugation step at 10,000 × g for 30 s. Genomic DNA was stored at −20°C until analysis was carried out.
Polymerase chain reaction (PCR) and sequencing
Mitochondria COI T. vaporariorum-specific primers CO1-F:
5′-GCCTGGTTTTGGCATTA-3′ and the reverse primer CO1-R:
5′-GCTTATTTAGCACCCACTCTA-3′ were used to amplify a ~750 bp of mtCOI gene (Gao, et al., Reference Gao, Zhang, Wu, Zhang, Zhou, Pan, Zhang, Brown and Chu2014). PCR was carried out in a total reaction mix of 20 µl with 5 µl of whitefly DNA as template, 10 µl Bulk AccuPower(R) PCR Premix containing 1 U of Top DNA polymerase, 250 µM of dNTP (dATP, dCTP, dGTP, dTTP), 10 mM Tris–HCl (pH9.0), 30 mM KCl, 1.5 mM MgCl2, 1 µl of 5 µM forward and 5 µM reverse primers and 3 µl of nuclease free water. The PCR reaction was run on an eppendorf thermocycler (Eppendorf, Hamburg, Germany) under the following conditions; initial denaturation for 2 min at 94°C followed by 35 cycles of 94°C for 20 s, annealing for 30 s at 52°C, elongation for 1 min at 72°C, final elongation for 30 min at 72°C. PCR amplicons were separated in a 2% agarose gel pre-stained with gel red (Biotium, CA, USA) and run in 0.5× Tris-Boric EDTA (TBE) electrophoresis buffer for 35 min at 100 V and detected under UV light (Biorad, CA, USA). PCR products were purified using Qiaquick PCR purification kit (Qiagen Inc.) as described by the manufacturer. Purified PCR products were sent for bi-directional Sanger sequencing at Macrogen Korea.
Sequence alignment and GenBank data retrieval
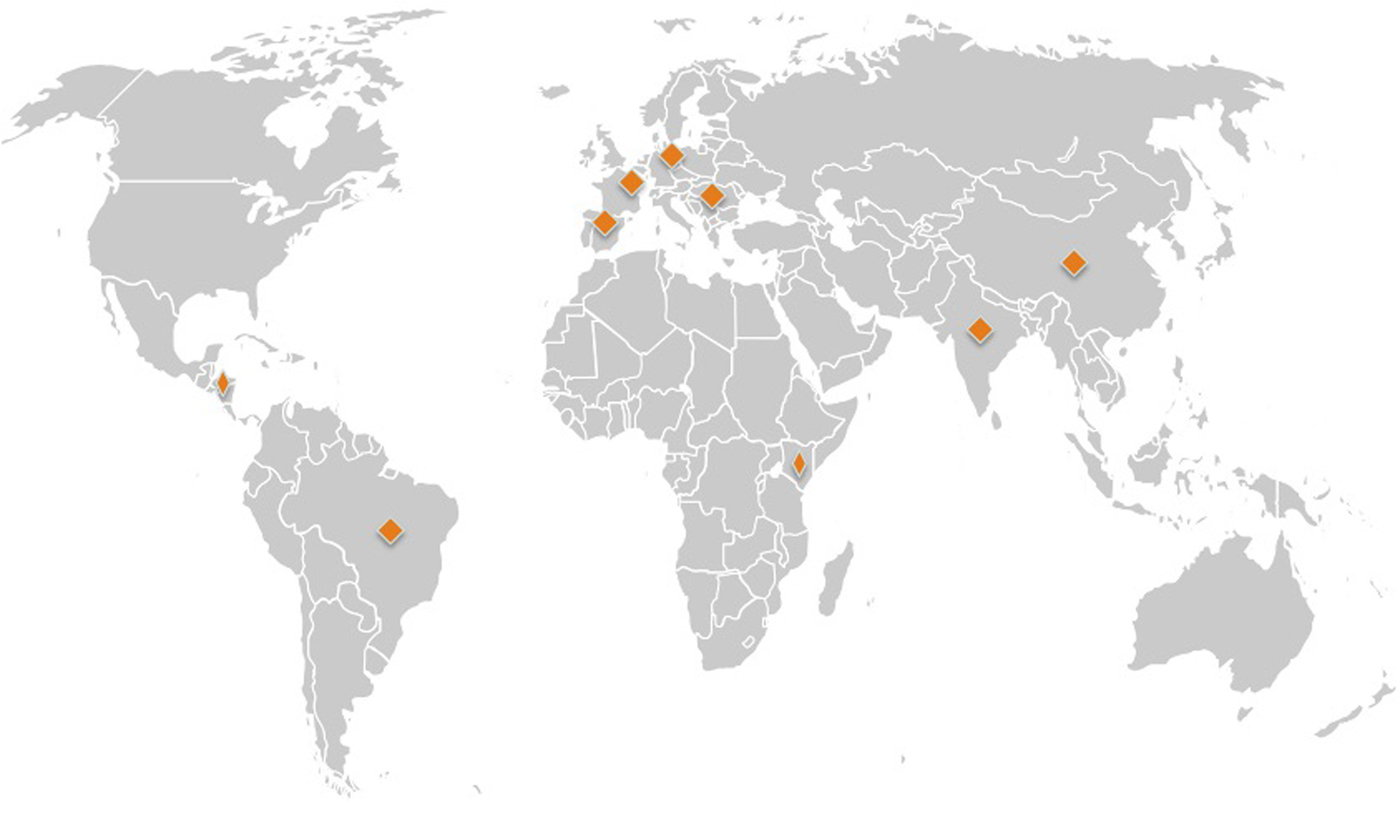
A total of 31 forward and reverse sequences of the 3′ end of mtCOI were obtained. Raw chromatograms were visually inspected using Geneious version 8 (http://www.geneious.com, Kearse et al., Reference Kearse, Moir, Wilson, Stones-Havas, Cheung, Sturrock, Simon Buxton, Cooper, Markowitz, Duran, Thierer, Ashton, Meintjes and Drummond2012) across all the bases, with ambiguities corrected. Consensus sequences were generated for each whitefly, and used for subsequent analysis. Basic local alignment search (BLAST) was carried out to confirm that all sequences were T. vaporariorum. In addition, 227 T. vaporariorum mtCOI sequences were retrieved from GenBank and assigned to geographical location based on GenBank metadata file records and supporting information in publication. We filtered these sequences and excluded sequences where geographical location was missing and those that where representative haplotypes rather than individual sequences leaving a total of (n = 217) sequences for analysis. T. vaporariorum from each country were mapped on a global map (fig. 1). mtCOI sequences retrieved from GenBank were combined with sequences from this study (Supplementary table 1). The combined sequences were aligned using MAFFT in Geneious version 8 with default parameters (Kearse et al., Reference Kearse, Moir, Wilson, Stones-Havas, Cheung, Sturrock, Simon Buxton, Cooper, Markowitz, Duran, Thierer, Ashton, Meintjes and Drummond2012). Manual inspection, adjustment of gaps and trimming of overhangs was carried out.
Global map showing source of Trialeurodes vaporariorum sequences from GenBank and collected in this study. Source: www.premiumslides.com/powerpoint/world-map-kit.html
Haplotypes networks based on mtCOI sequences of T. vaporariorum
Associations between global haplotypes were determined using median joining algorithms implemented in NETWORK version 5.0 (Bandelt et al., Reference Bandelt, Forster and Rohl1999) with two outgroups, T. ricin and T. lauri, included under default parameters.
Phylogenetic analysis
Selection of the optimal model for phylogenetic analysis was determined using jModeltest 2 (Darriba et al., Reference Darriba, Taboada, Doallo and Posada2012), using 11 substitution schemes. The optimal model selected based on the Akaike information criterion was TPM2uf + G, while the optimal model using the Bayesian information criterion was HKY + I. The HKY + I model was used for subsequent analysis incorporates variable base frequencies and separate transition and transversion rates. MrBayes was run on the Magnus Supercomputer at the Pawsey Supercomputer Centre at the University of Western Australia using 76 core/h (274230s). Bayesian analysis was carried out for two independent runs using the command ‘lset nst = 2 rates = gamma’ for 50 million generations, with trees sampled every 1000 generations. In each of the runs, the first 25% (2500) trees were discarded as burn-in. Convergence and mixing of the chains were evaluated using Tracer v1.6 (Rambaut et al., Reference Rambaut, Suchard, Xie and Drummond2014). LnL had an effective sample size (ESS) of greater than 2000 a mean of –1509.4812, and stdev 11.0176. Maximum-likelihood (ML) phylogenetic trees were estimated under the HKY + I model in PAUP* 4.0a147 (Swofford, Reference Swofford2003), with bootstrap support based on 100 replicates.
Estimates of evolutionary divergence between sequences across clades
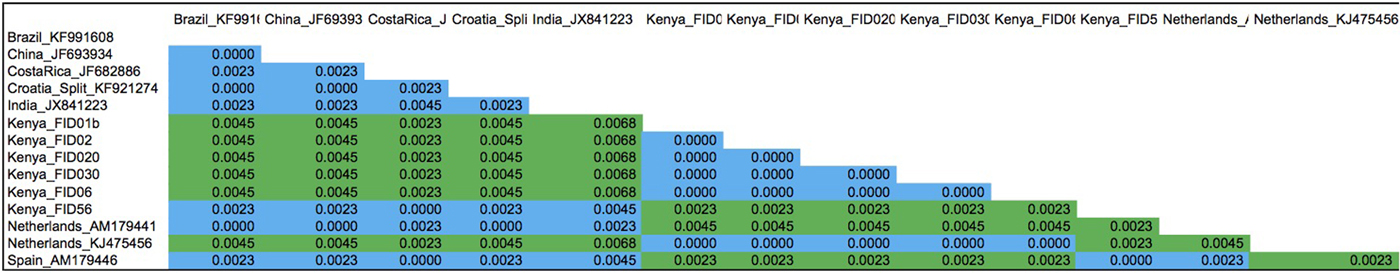
To assess the extent of divergence between the main group (1) and a nested group (1a), we computed the proportion of base difference between representative sequences in the two groups using p distances implemented in MEGA 5 (Tamura et al., Reference Tamura, Peterson, Peterson, Stecher, Nei and Kumar2011) (fig. 4).
Evaluation of T. vaporariorum population structure using Bayesian analysis
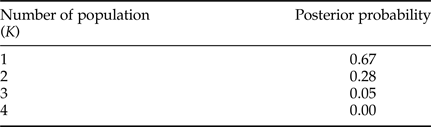
To determine the population structure of T. vaporariorum mtCOI sequences across different geographical locations we used Structurama 2.0 (Huelsenbeck et al., Reference Huelsenbeck, Andolfatto and Huelsenbeck2011), which implements a Dirichlet process prior for the number of populations. The default parameters of Gamma (0.100, 10.000) were run, and the model without admixture was used. MCMC was run for one million generations and samples were collected every 1000 generations. Two independent runs were carried out to assess whether the MCMC algorithm converged to the same values (table 2).
Posterior probabilities on the number of populations (K) within Trialeurodes vaporariorum for the COI sequences across all geographical locations using Structurama 2.0.
Bayesian estimation of the rate gene flow between phylogenetic groups
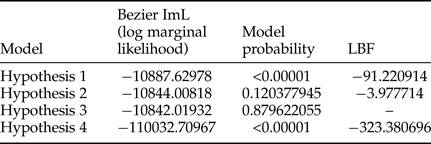
To evaluate gene flow between T. vaporariorum found in clades 1 and 1a, we carried out Bayesian estimation of migration rates using migrate-n v 3. 6. 11 (Beerli & Palczewski, Reference Beerli and Palczewski2010). We evaluated four models: (a) model one assumed T. vaporariorum sequences were from a single population (b) model two assumed T. vaporariorum migration from clades 1a to 1 (c) model three assumed T. vaporariorum migration from clade 1 to the nested clade 1a, and (d) model four assumed migration from clades 1 to 1a and the reverse. To test our models, we used the following search parameters: short chains 10, (10,000 genealogies) long chains = 4, genealogies (100,000) with a burn-in of 10,000. Evaluation of the most suitable models was based on the highest model probabilities and the natural log of Bayes factor (LBF).
Results
Distribution of T. vaporariorum haplotypes across global collections
In this study, 31 T. vaporariorum sequences were generated and deposited in GenBank under accession numbers KX058201–KX058231 (table 1). An additional 217 sequences from GenBank (after the filtering step) were combined with our sequences for subsequent analysis. All sequences and accession numbers from GenBank and generated from this study are provided in Supplementary table 1. Analysis across the combined global dataset based on the 248 sequences, including two outgroups revealed 18 haplotypes, with 16 unique haplotypes within T. vaporariorum and two haplotypes from the outgroups T. lauri and T. ricini (fig. 2).
Median joining network generated using the program NETWORK version 5.0 for 16 mtCOI haplotypes of Trialeurodes including two outgroup sequences. (Trialeurodes ricin, Trialeurodes lauri). *Haplotypes in circulation across global location are highlighted in yellow, those present in Kenya are highlighted in green and the outgroups are in red. *Number of individual sequences within the two dominant haplotypes were Haplotype 2 (n = 26), Haplotype 3 (n = 201).

Median joining networks based on mtCOI sequences of T. vaporariorum
Assessments of genetic relationships among the 18 haplotypes identified were based on a median joining network of the mtCOI sequences (fig. 2), showing two outgroup haplotypes (red circles), while the T. vapararioum samples are shown by green and yellow circles. Haplotypes 2 (HAP_2) and 3 (HAP_3) were the dominant haplotypes across all geographical locations, while within Kenya haplotype HAP_2, HAP_7 and HAP_8 were present (fig. 2).
Phylogenetic analysis of T. vaporariorum and assessment of sequence divergence
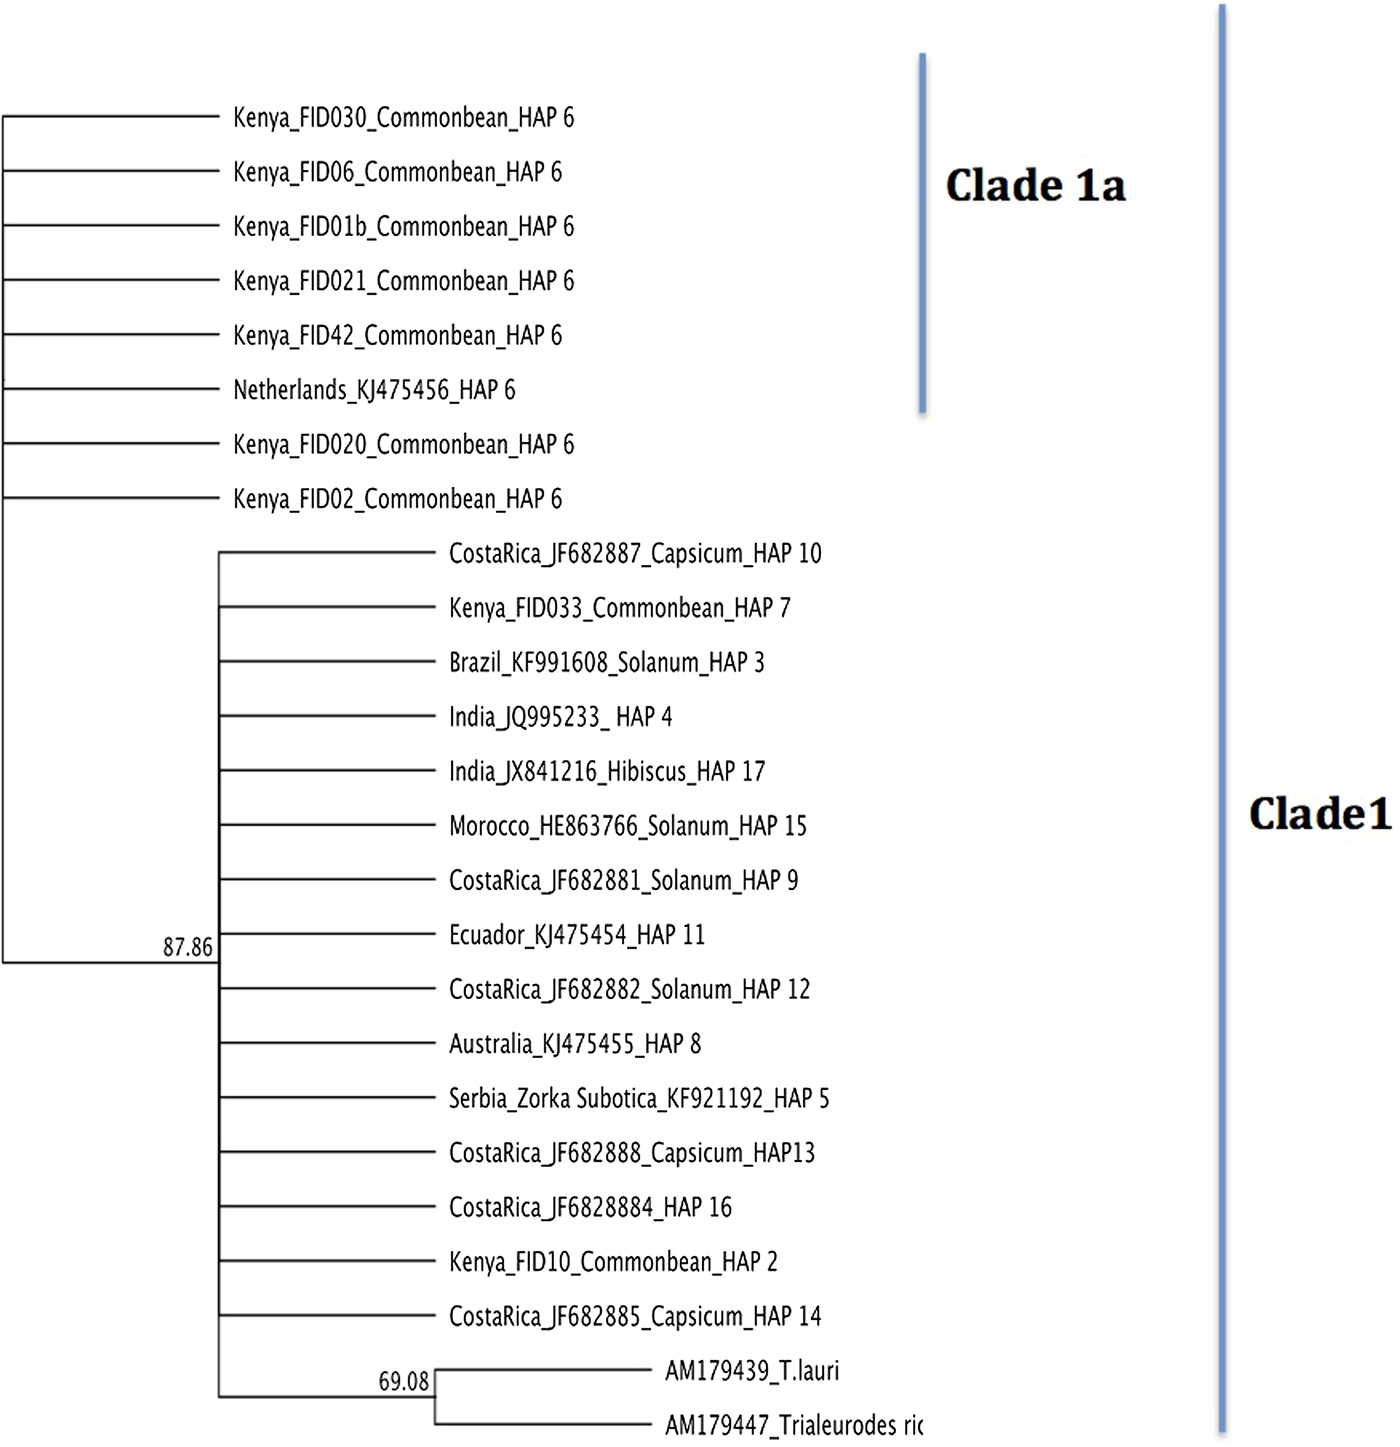
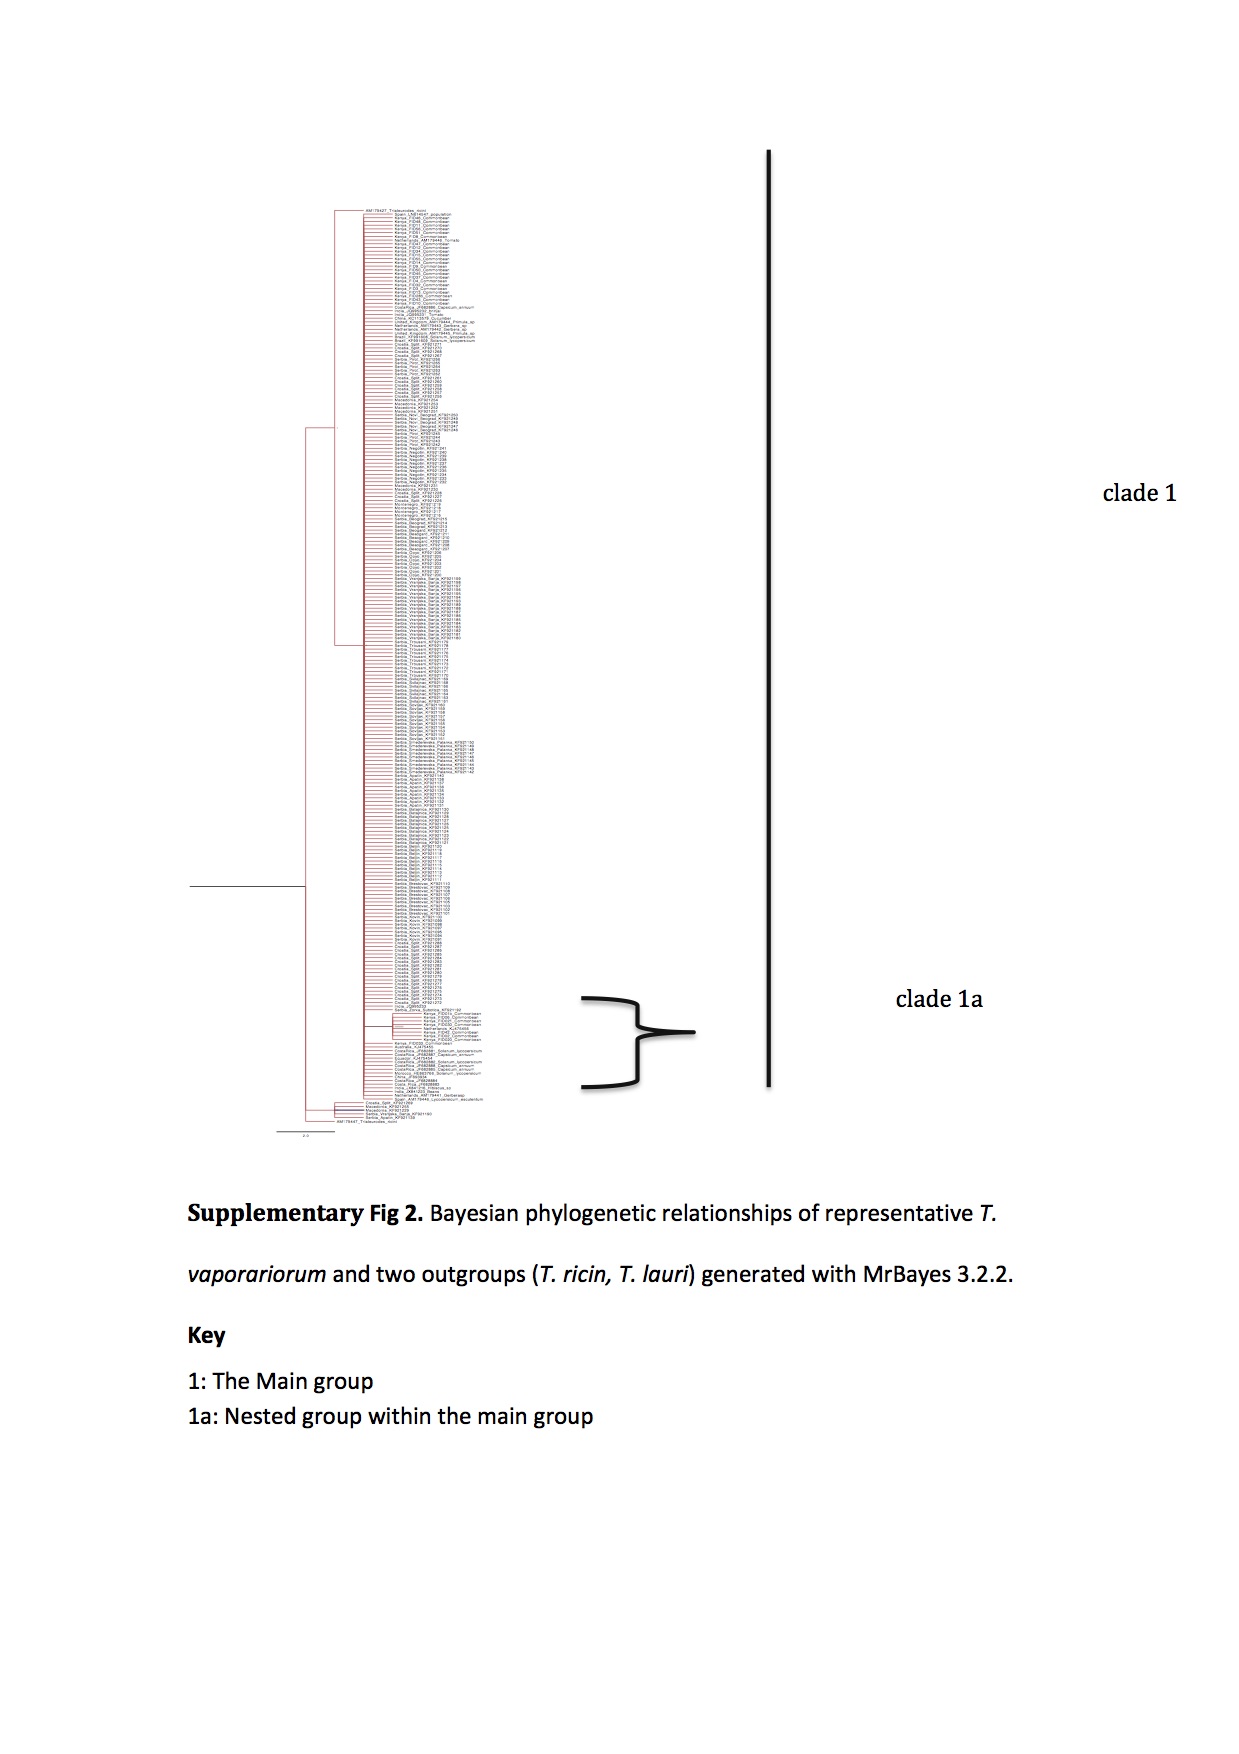
Phylogenetic relationships of T. vaporariorum across geographical locations were assessed using Bayesian phylogenetic inference as implemented in MrBayes 3.2.2 (Huelsenbeck et al., Reference Huelsenbeck, Andolfatto and Huelsenbeck2011) and maximum-likelihood implemented in PAUP* (Swofford, Reference Swofford2003). Phylogenetic trees from both methods (fig. 3 and Supplementary figs 1 and 2) yielded one main clade (denoted clade 1) and a nested clade (denoted clade 1a) containing a subset of Kenyan and one sequence from the Netherlands that was supported with >0.9 posterior probability and 50% bootstrap support, respectively. T. ricin and T. lauri were used as the outgroup for rooting the tree (Kinene et al., Reference Kinene, Wainaina, Maina and Boykin2016). The two outgroups selected were the closest recent relatives of T. vaporariorum based on the NCBI taxonomic classification database. To evaluate evolutionary divergence of sequences between clades 1 and 1a, we assessed pairwise nucleotide sequence comparisons using p distance (fig. 4). Pairwise comparison showed differences ranging between 0.023 and 0.0068 between clades, while distances within clades were <0.00001 (fig. 4).
Bayesian phylogenetic relationships of representative haplotype sequences of T. vaporariorum and two outgroups (T. ricin, T. lauri) generated with MrBayes 3.2.2. HAP: Haplotype numbers assigned for each tip.
P distances calculated between Trialeurodes vaporariorum nucleotide sequences clustering on clade 1 and nested clade la on the phylogenetic tree using MEGA 5.1. The proportion of base differences per site between sequences is shown. The analysis involved 14 nucleotide sequences. All ambiguous positions were removed for each sequence pair. There were a total of 443 positions in the final dataset. Evolutionary analyses were conducted in MEGA5 (Tamura et al., Reference Tamura, Peterson, Peterson, Stecher, Nei and Kumar2011).
Bayesian analysis of T. vaporariorum population structure
Population structure of T. vaporariorum was evaluated using Structurama 2.0, with default parameter settings and no admixture. All of the T. vaporariorum sequences clustered as one population (K = 1), supported by a posterior probability of 0.67 (table 2), with posterior probability of 0.28 for K = 2 populations and 0.05 for K = 3 populations. All other numbers of populations received posterior probability of <0.01.
Estimation of the rate of gene flow
Estimation of the rate of gene flow between T. vaporarioum from the two groups on the phylogenetic tree was assessed using four hypotheses. Assessment of the most probable models was based on model probability and the natural LBF (table 3). The optimal model was three that had the highest model probability of 0.879622055 and log marginal likelihood −10842.01932. It hypothesised gene flow from individuals found in clade 1 to those found within the nested clade 1a of the phylogenetic tree (table 3).
Bayesian estimation of migration rates across all Trialeurodes vaporariorum sequences using Migrate 3.6.
Discussion
In this study, we assessed the phylogeographical structuring and genetic diversity of T. vaporariorum globally. Phylogeographical structuring resulted in one main clade (1) with global sequences and a nested clade (1a) containing a subset of Kenyan and one sequence from the Netherlands. Population structure analysis identified a single population (K = 1) across all T. vaporariorum sequences. Sequence pairwise distance (fig. 4) shows signs of sequence divergence between groups and minimal divergence within groups. This was further assessed through the estimation of gene flow between T. vaporariorum sequences clustering within the two groups on the phylogenetic tree. Bayesian estimation using migration showed evidence for gene flow from clade 1 to the nested clade 1a on the phylogenetic tree.
Haplotype networks
The relationship among the T. vaporariorum haplotypes (fig. 2) across different global geographical location was based on the median joining network (fig. 2). The two main nodes (HAP_2, HAP_3) (fig. 2) were present across all geographical locations. Within Kenyan T. vaporariorum sequences three haplotypes were identified in circulation (HAP_2, HAP_7, HAP_8) (fig. 2), while Haplotype_8 was found as a unique haplotype within Kenya. Kenyan and Netherlands sequences found within the nested clade 1a were from haplotype HAP_7.
Our findings report fewer haplotypes than previously reported among T. vaporariorum (Prijović et al., Reference Prijović, Skaljac, Drobnjaković, Zanić, Perić, Marčić and Puizina2014). This is likely due to the selection criteria used in this study. However a majority of the haplotypes identified overlap across geographical locations and could indicate a single source of a T. vaporariorum lineage that is easily adapted to different niche habitats (Kapantaidaki et al., Reference Kapantaidaki, Ovčarenko, Fytrou, Knott, Bourtzis and Tsagkarakou2015). It is probable that continuous expansion of T. vaporariorum haplotypes across global locations and specifically from this study could be two-fold. First, there has been an increase in global trade on horticultural products, such as cut flowers from Kenya (Ulrich, Reference Ulrich2014). This has resulted in increased importation of flower cuttings as propagation material from temperate ecoregions. Flower cuttings are potential carriers of T. vaporariorum because the eggs are difficult to detect, especially when handling large consignments, but readily hatch under ideal climatic conditions. This mode of T. vaporariorum movement has been implicated as one of the main modes of distribution within invasive pests globally (Grapputo et al., Reference Grapputo, Boman, Lindström, Lyytinen and Mappes2005). Secondly, proliferation of polyhouses for horticulture production potentially provides appropriate microclimatic conditions sufficient for the emergence of T. vaporariorum and subsequent release into the open field. The importance of the polyhouse in building up T. vaporariorum populations and controlling gene flow has previously been reported (Roopa et al., Reference Roopa, Kumar, Asokan, Rebijith, Mahmood and Verghese2012). However, distinct haplotypes present within Kenya (HAP_7), Costa Rica (HAP_12, HAP_13, HAP_14), and India (HAP_17) could be indications of local adaptations of T. vaporariorum within these regions.
Phylogeographical structuring and evolutionary divergence of T. vaporariorum sequences
The evolutionary relationships among the T. vaporariorum sequences across geographical locations were reconstructed using both maximum-likelihood and Bayesian phylogenetic analysis. Both phylogenetic trees resulted in one main clade 1 and a nested clade 1a (fig. 3 and Supplementary fig. 1). Clade 1 was composed of T. vaporariorum samples from all the geographical locations, while the nested clade 1a was composed of a subset of T. vaporariorum sequences from Kenya and one Netherlands sample. This is contrary to previous phylogenetic relationships of T. vaporariorum, where a single group was observed across T. vaporariorum sequences collected (Roopa et al., Reference Roopa, Kumar, Asokan, Rebijith, Mahmood and Verghese2012; Prijović et al., Reference Prijović, Skaljac, Drobnjaković, Zanić, Perić, Marčić and Puizina2014; Kapantaidaki et al., Reference Kapantaidaki, Ovčarenko, Fytrou, Knott, Bourtzis and Tsagkarakou2015). In this study, we report the existence of one main clade (1) and a well-supported nested clade 1a within T. vaporariorum. We further assessed the pairwise differences between representative sequences from clade 1 and nested clade 1a, with nucleotide pairwise differences ranging between 0.0023 and 0.0068 between clades, while distances within clades were <0.00001 (fig. 4).
We postulate, based on the nucleotide pairwise differences between clade 1 and the nested clade 1a within the phylogenetic tree, that this divergence could be an early indicator of segregation leading to an early differentiating species within the nested clade. Further information may be obtained through the additional sequencing of nuclear genes within T. vaporariorum from SSA. Thus over time, with more sampling, and an increased number of genetic markers, this might result in the identification of distinct T. vaporariorum populations.
Population structure based on Bayesian analysis
Population structure analysis of T. vaporariorum using Structurama showed the strongest support for one population (posterior probability 0.67; table 3). Population structure results of one population differed with the phylogenetic tree of one main group (clade 1), and subclade 1a within T. vaporariorum (fig. 3 and Supplementary fig. 1). Our findings concur with (Gao et al., Reference Gao, Zhang, Wu, Zhang, Zhou, Pan, Zhang, Brown and Chu2014) where they report lack of geographical structuring within the T. vaporariorum populations though several populations were reported. This further supports our hypothesis of a single source of T. vaporariorum introduced into SSA and other non-native T. vaporariorum range areas.
Gene flow estimation and population subdivision
To further evaluate phylogenetic and population structure results of T. vaporariorum globally, we used isolation by migration models. We used the Bayesian estimation method implemented in migrate-n to estimate migration rates and evaluated the models based on model probabilities and LBF. Our findings indicate there was gene flow (table 3) between sequences in clade 1 and those in clade 1a (Kenyan and Netherlands samples). Unrestricted gene flow between clades is an indication that sequences on clades 1 and 1a were not sufficiently distinct to be considered as distinct species, but also rejected the hypothesis that they all belonged to the same panmitic population. However, LBF comparisons between models were low. These findings were in agreement with the phylogenetic analysis but contrary to Structurama output (K = 1) that considered all sequences to belong to one panmitic population. The difficulty in resolving the actual population by Structurama could be due to the few loci used in the study coupled with low sequence variation across mtCOI sequences, as has been previously observed in other studies (Wilkinson et al., Reference Wilkinson, Haley, Alderson and Wiener2011).
Our findings highlight differences in geneflow between populations in T. vaporariorum vs. B. tabaci. B. tabaci is recognized as a species complex of 34 species that are morphologically indistinguishable (Boykin et al., Reference Boykin, Shatters, Rosell, McKenzie, Bagnall, De Barro and Frohlich2007; De Barro & Ahmed, Reference De Barro and Ahmed2011; Boykin & De Barro, Reference Boykin and De Barro2014). B. tabaci putative species exhibit differences in host range, phylogeographical clustering and potential to transmit viruses (Abdullahi et al., Reference Abdullahi, Winter, Atiri and Thottappilly2003; Sseruwagi et al., Reference Sseruwagi, Maruthi, Colvin, Rey, Brown and Legg2006, De Barro & Ahmed, Reference De Barro and Ahmed2011; Ashfaq et al., Reference Ashfaq, Hebert, Mirza, Khan, Mansoor, Shah and Zafar2014; Legg et al., Reference Legg, Sseruwagi, Boniface, Okao-Okuja, Shirima, Bigirimana, Gashakae, Herrmannf, Jeremiahg, Obieroh, Ndyetabulai, Tata-Hangyj, Masembe and Brown2014). These differences are yet to be reported within T. vaporariorum, and our findings indicate the need for further investigation of T. vaporariorum within new geographic locations.
Future studies should include more expansive sampling outside native T. vaporariorum range areas of Europe and into new geographical locations coupled with a multilocus approach to improve our understanding of this highly invasive pest. This will provide for more robust and stringent phylogenetic, population and gene flow estimates to examine the possible existence of species divergence within T. vaporariorum. However, it is probable that the existence of a differentiating nested clade 1a is an early indicator of divergence within T. vaporariorum potentially driven by phylogeographical factors as observed within B. tabaci and T. vaporariorum in Europe (Boykin et al., Reference Boykin, Bell, Evans, Small and De Barro2013; Ovčarenko et al., Reference Ovčarenko, Kapantaidaki, Lindström, Gauthier, Tsagkarakou, Knott and Vänninen2014). In addition, differences in the bacterial endosymbionts among T. vaporariorum haplotypes might induce genetic sweeps within the mitochondria and thus drive the diversification of T. vaporariorum (Kapantaidaki et al., Reference Kapantaidaki, Ovčarenko, Fytrou, Knott, Bourtzis and Tsagkarakou2015).
Conclusion
This study provides the first comprehensive analysis of the genetic diversity, phylogenetic and population structure of T. vaporariorum coupled with gene flow estimation globally. Our findings provide some evidence of T. vaporariorum genetic divergence across geographical regions, but this is not sufficient to suggest species complex status and does not demonstrate sufficient isolation to indicate distinct populations. Our findings indicate the need for future research on understanding the drivers of genetic divergences within T. vaporariorum across different geographical regions.
Supplementary Material
The supplementary material for this article can be found at https://doi.org/10.1017/S0007485317000360
Acknowledgements
J.M.W is supported by an Australian Award scholarship by the Department of Foreign Affairs and Trade (DFAT), this work forms part of his PhD research. Fieldwork was supported by the kind consideration of Dr John Carr through a BBSRC GRANT: BBSRC GRANT: BB/J011762/1 and the Bioscience eastern and central Africa (BecA-ILRI Hub). Laboratory work was performed at the Australian Research Council Centre of Excellence Plant Energy Biology (PEB), The University of Western Australia. We thank Dr Charles Kariuki Director Kenya Agricultural and Livestock Research Organization (Katumani) for facilitating sample collection in Eastern Kenya and insightful discussions. Supercomputer analysis was supported by resources provided by the Pawsey Supercomputing Centre with funding from the Australian Government and the Government of Western Australia. We acknowledge the contribution of the anonymous reviewers who greatly improved this manuscript.


 Open access