

Introduction
When attempting to identify the mechanisms responsible for population declines, conservation biologists often employ modelling approaches to first identify the relative importance of different vital rates (fecundity and survival) to declines (Ryan et al. Reference Ryan, Root and Mayer1993, Wisdom et al. Reference Wisdom, Mills and Doak2000, Fieberg and Ellner Reference Fieberg and Ellner2001, Camfield et al. Reference Camfield, Pearson and Martin2011) and then attempt to identify the mechanisms responsible for the depressed vital rate(s). With this approach, managers can employ management actions most likely to reverse negative trends (Table 1). For birds, adult and juvenile survival is often difficult to influence through management (Porneluzi and Faaborg Reference Porneluzi and Faaborg1999, Anders and Marshall Reference Anders and Marshall2005, Knutson et al. Reference Knutson, Powell, Hines, Friberg and Niemi2006, Camfield et al. Reference Camfield, Pearson and Martin2011) and annual fecundity is relatively easy (Camfield et al. Reference Camfield, Pearson and Martin2011). As a result, it is often the target of conservation actions.
Examples of management targets and activities intended to improve plover/shorebird fecundity and/or survival in situ (not including translocations, introductions or conspecific attractions).

Low fecundity is often a source of population declines in birds (Nagy and Holmes Reference Nagy and Holmes2004) and predation of eggs and nestlings is the major cause of nest failure (Ricklefs Reference Ricklefs1969, Martin Reference Martin1992). To reduce predation rates, managers can use techniques that change predator behaviour, reduce their numbers, or prevent them from accessing nests, chicks and/or adults (Table 1). Alternatively, managers can manipulate habitat to create conditions that have lower predation rates. For some species there is an apparent relationship between habitat characteristics and nest success (e.g. Newton Reference Newton1998, Willson et al. Reference Willson, Morrison, Sieving, de Santo, Santisteban and Diaz2001). When this relationship exists, an understanding of those factors can provide critical information for conservation efforts such as habitat restoration (e.g. Catlin et al. Reference Catlin, Fraser, Felio and Cohen2011).
Genetic research indicates that the Snowy Plover Charadrius nivosus is a separate species from the Kentish Plover Charadrius alexandrinus (Küpper et al. Reference Küpper, Augustin, Kosztolányi, Figuerola, Burke and Székely2009) and now both the International Ornithologists’ Union (Gill and Donsker Reference Gill and Donsker2014) and American Ornithologists’ Union (Chesser et al. Reference Chesser, Banks, Barker, Cicero, Dunn, Kratter, Lovette, Rasmussen, Remsen, Rising, Stotz and Winker2011) recognise them as separate species. The IUCN Red List of Threatened Species has not separated these two species and considers the Kentish Plover Charadrius alexandrinus to be a species of “Least Concern” with a “decreasing population” (IUCN 2014). The United States Pacific coastal population of the Snowy Plover is listed as Threatened under the U.S. Endangered Species Act, and is listed as endangered, threatened, or a species of special concern by several states, including the states of Washington, Oregon, and California (see USFWS 1993, Page et al. Reference Page, Stenzel, Page, Warriner, Warriner, Paton and Poole2009). This coastal population extends from Midway Beach, Washington, to Bahia Magdalena, Baja California, Mexico. According to the U.S. Fish and Wildlife Service (USFWS 2007), “Habitat degradation caused by human disturbance, urban development, introduced beachgrass Ammophila spp. and expanding predator populations have resulted in a decline in active nesting areas and in the size of the breeding and wintering populations”. Population modelling indicates that intensive management is needed to prevent continued population declines and suggests the goal of fledging 1.2 chicks per adult male per year to achieve a growing population (Nur et al. Reference Nur, Page and Stenzel1999). This goal can be accomplished through management activities that improve both hatching success and early chick survival (fledging is defined as surviving 28 days post-hatching).
Because most Snowy Plover nest failures are a result of predation (Wilson-Jacobs and Meslow Reference Wilson-Jacobs and Meslow1984, Wilson-Jacobs and Dorsey Reference Wilson-Jacobs and Dorsey1985, Powell Reference Powell2001, Page et al. Reference Page, Stenzel, Page, Warriner, Warriner, Paton and Poole2009, Colwell et al. Reference Colwell, Millett, Meyer, Hall, Hurley, McAllister, Transou and Levalley2005, Reference Colwell, Burrell, Hardy, Kayano, Muir, Pearson, Peterson and Sesser2010, Saalfeld et al. Reference Saalfeld, Conway, Haukos and Johnson2011), we would expect plovers to select nest sites with characteristics that mitigate predation risks. For example, nests can be placed adjacent to objects (Page et al. Reference Page, Stenzel and Ribic1985) or vegetation (Amat and Masero Reference Amat and Masero2004) that helps conceal nests or by selecting substrates that are naturally concealing (Page et al. Reference Page, Stenzel and Ribic1985, Colwell et al. Reference Colwell, Millett, Meyer, Hall, Hurley, McAllister, Transou and Levalley2005, Reference Colwell, Meyer, Hardy, McAllister, Transou, Levalley and Dinsmore2011). Alternatively, birds can adjust spacing patterns between conspecifics (Page et al. Reference Page, Stenzel, Winkler and Swarth1983) to reduce nest predation. Colonial or semi-colonial nesting results in more eyes detecting predators and moving away from nests early thereby making it difficult for the predator to locate nests or it may result in more birds responding to a potential nest predator with distraction flight and vocal displays.
In an attempt to identify habitat conditions that might affect Snowy Plover egg hatching success, we examine the influence of nest spacing and habitat characteristics on hatching success in coastal Washington, USA using variables measured over a seven-year period in two study areas. Unlike most studies to date, we include nest exposure (number of days nests were exposed to potential nest failure), season date, and vegetation structure (but see Hardy and Colwell Reference Hardy and Colwell2012). We also evaluate the effects of vegetation structure at three spatial scales, perpendicular distance from each nest to the high tide (wrack) line, distance to the nearest active nest, and whether or not the nest was in the habitat restoration area (area cleared of vegetation and where oyster shells were added to the surface) on nest success. This statistical approach allows us to evaluate the relative influence of site, season, and various habitat characteristics at different spatial scales on overall nest success and on predation rates specifically. Finally, we evaluate the influence of an ongoing conservation activity, mesh wire cages (predator exclosures), placed around nests to exclude potential mammal and bird nest-predators, on egg hatching success.
Methods
Study species
In Washington, Snowy Plover clutch initiation may occur as early as late-March and as late as late July, but most nests are initiated from mid-April through mid-July. Complete confirmed clutch sizes ranged from one to four eggs. The two one-egg clutches that we observed in this study are apparently unusual (Warriner et al. Reference Warriner, Warriner, Page and Stenzel1986, Page et al. Reference Page, Stenzel, Page, Warriner, Warriner, Paton and Poole2009) but the nest scrapes were discovered prior to egg-laying and both consistently contained one egg that ultimately hatched. Snowy Plover young are precocial and leave the nest within hours of hatching. Snowy Plovers will re-nest after loss of their eggs.
Study sites
We monitored Snowy Plover nests from 2006 to 2012 at three study areas along the Pacific coast of Washington, USA: (1) Midway Beach (near Grayland; 46°45’60”N, 124°06’10”W), (2) Graveyard Spit (North Cove; 46°42’57”, 124°01’25”), and (3) Leadbetter Point (Long Beach Peninsula; 46°38’00”, 124°04’10”). We combined Graveyard Spit with Midway Beach for our analyses below and collectively refer to them as “Midway Beach” because these areas are: 1) very close to each other (approximately 4 km), 2) birds fly back and forth throughout a given nesting season, and 3) because of small sample sizes and irregular nesting at Graveyard Spit. The resulting two study sites, Leadbetter Point and Midway Beach, are dune backed beaches that have an exceptionally wide area between the mean high tide and the foredune that is unvegetated or sparsely vegetated relative to the adjacent linear sandy beaches of the Washington coast. The Snowy Plover habitat at Midway Beach located on the outer coast and north shore of Willapa Bay consists of hummocks and swales, sparsely vegetated foredunes, and a large deflation plain with ephemeral dune ponds (dune feature terminology follows Wiedemann Reference Wiedemann1984). Leadbetter Point along the outer coast of Washington is part of a very long sand spit or peninsula. The habitat at Leadbetter Point consists of unvegetated beach above the summer high tide line, sparsely vegetated foredunes, blowouts, and a 49 ha “habitat restoration area”. The habitat restoration area is located landward of the primary foredune and was restored to improve Snowy Plover habitat but also conditions for other native plants and animals. The restoration area was: (1) re-contoured with large machinery to knock down the steep foredune and to create an relatively flat open site dominated by sand, (2) non-native American and European beach grasses A. arenaria and A. breviligulata were sprayed with herbicide to reduce their cover on a nearly annual basis, and (3) oyster shell was spread across much of the site to help hold the sand in place and presumably to provide crypsis for Plover eggs, brooding adults, and young of the year.
Nest searching and monitoring
We visited all active study sites 3–6 times a week from late-March/early-April until mid-September to search for and monitor Snowy Plover nests. In most cases, we located nests by following Plover tracks to nests. We also located nests by observing males creating conical depressions in the sand known as “scrapes”, by locating adults incubating eggs, or by flushing incubating adults. We recorded date and status (presence of adults and eggs) of each nest approximately every 3–5 days to assess outcome. Unless observed directly, we calculated clutch initiation date by: backdating from known laying or hatching dates (Weston and Elgar Reference Weston and Elgar2005) or by using the egg floating technique (Hays and LeCroy Reference Hays and LeCroy1971, Dunn et al. Reference Dunn, Hussell and Ricklefs1979, Rizzolo and Schmutz Reference Rizzolo and Schmutz2007) in the cases of nests discovered with completed clutches. Backdating using hatch dates requires information on the time intervals associated with the egg laying and incubation stages. We used the following time intervals from California and reported in Page et al. (Reference Page, Stenzel, Page, Warriner, Warriner, Paton and Poole2009) to calculate clutch initiation dates: egg laying = 2.5 days between laying egg 1 and 2 and 2.3 days between laying eggs 2 and 3, incubation = 27 days or 32 days from the first egg laid until hatching. We defined a “successful nest” as a nest with at least one chick leaving the nest cup after hatching. For unsuccessful nests, we attempted to determine the source of failure and reported the nest as lost to predation (and predator species if possible), abandoned, covered by drifting sand, lost to human activities (crushed by vehicles, walking, horseback riding, or eggs removed), or unknown source of failure. In nearly all cases, we identified suspected predators by tracks left in the sand. In only a couple of cases we observed the predation event. Not all adult plovers were banded and, as a result, we cannot control for multiple nests by the same individuals within or between seasons in the analyses that follow. Even if one or more individuals are associated with more than one nest, it is very unlikely that the nest would be placed in the exact location as the previous nest and they are therefore making a new decision on where to nest.
Exclosures
We placed open-bottom cuboid shaped (1.2 m long x 1.2 m wide x 0.9 m high) wire-mesh (5 x 10-cm) cages around some nests to exclude larger bird and mammal nest-predators. We used the “mini-exclosure” design commonly used for Snowy Plovers (Lauten et al. Reference Lauten, Castelein, Gaines and Stern2004, Hardy and Colwell Reference Hardy and Colwell2008) because the wire mesh size excludes most bird nest-predators while still allowing ingress and egress by Snowy Plovers and because nest cages have a greater effect on hatching success than exclusion fences (Smith et al. Reference Smith, Pullin, Stewart and Sutherland2011). These predator exclosures are portable and can be set up rapidly (10–15 min) with minimal disturbance to the birds. We placed stakes (∼17 cm in length) at each corner and at the margins of exclosures to hold them in place. No clutches were exclosed until they were complete and being incubated (average = day 7 of incubation, range = day 2–12). Exclosures were placed as a management action and did not include all of the factors one would like to see in a rigorous experimental design testing their effectiveness (e.g. Pearson et al. Reference Pearson, Moore and Knapp2012). However, our modelling approach accounts for potential site, date, exposure, and habitat restoration area effects, as described below. Predator exclosures were placed around nests after shorebird migration (falcon abundance is higher during migration and falcons use exclosures as perches and to help them locate adult plovers) in areas with particularly high predation rates and areas where they would not attract people to the nests.
Habitat assessment
We visually estimated the percentage cover of the following habitat variables within 1 m2, 5 m2, and 25 m2 plots centred on the nest: bare ground (primarily sand), shell, wood, grass (primarily non-native beachgrass and native American dune grass Leymus mollis), all other vegetation, and dead vegetation (primarily grass thatch). For each cover variable measured, we assigned it one of the following cover categories at each spatial scale: 0 = < 1 % cover; 1 = 1–5%; 2 = 6–25%; 3 = 26–50%; 4 = 51–75%; 5 = 76–95%; 6 = 96–100%. In addition, we measured the perpendicular distance from the nest to the wrack line in meters (a measure of how far inland the nest was from the high tide line) and distance to the nearest active nest in meters (an indication of proximity to other nests). We also included a large-scale modified habitat variable – inside or outside the habitat restoration area.
Statistical analyses
To examine the effects of habitat variables on nest survival, we used the logistic exposure method (Stephens Reference Stephens2003, Shaffer Reference Shaffer2004, Rotella et al. Reference Rotella, Dinsmore and Shaffer2004, Stephens et al. Reference Stephens, Rotella, Lindberg, Taper and Ringelman2005). We ran analyses in SAS PROC NLMIXED (SAS 2007). The SAS code used follows Rotella et al. (2004, appendix 4). We used the effective sample size (“ness”; Rotella et al. Reference Rotella, Dinsmore and Shaffer2004) when computing AICc (ness equals the sum, over all nests, of the number of days each nest was under observation and survived, plus the number of observed failures).
Before testing for habitat and exclosure effects on nest survival, we first established a baseline model. For this analysis, we used only observations without exclosures. In addition to a null (intercept-only) model we tested the following variables for our candidate baseline model: nest age (linear and quadratic functions), season date (linear and quadratic functions, where 1 April was considered season date 0 for each year), a fixed effect of site (Leadbetter = 1; Midway Beach = 0), and a random year effect. Nest age is the age of the nest in days with 1 = the day the first egg was laid and 32 = hatch date. We never included nest age and season date in the same model as these would be highly correlated. Because we were including quadratic effects of season date and nest age, we also tested models where nest age and season date were centred. Nest age was centred by subtracting 15.5 (making 0 the midpoint the incubation period). Season date was centred using two methods: by subtracting the median season date over all years from observed values, 77 (“Median Date”) and also by subtracting the median clutch initiation date for the observation year plus the 15.5 (“Median Initiation”). Because nest age was not available for all nests, we could not compare models with and without nest age for all data. Therefore we created two subsets of data for the purpose of choosing a baseline model: We compared all models without nest age using the full set of non-exclosed nests (ness = 1,832). We also compared all models using the subset of non-exclosed nests that included nest age (ness = 1,731).
Once we had selected our baseline model (site + a quadratic function of season-date), we tested models with the baseline plus each of the following: (1) all cover variables at 1 m2, (2) all cover variables at 5 m2, (3) all cover variables at 25 m2, (4) distance to wrack line (high tide; meters), (5) whether or not the nest was in the habitat restoration area (HRA), (6) distance to the nearest active nest (DNN; meters), and (7) distance to the nearest active nest plus an interaction effect of distance to nearest active nest and nest site. For these analyses, we used only observations without exclosures and only nests for which we had all the habitat variables (ness = 1039). Because there were a few outliers with distance to nearest nest (see Results), we also ran the models excluding distance to nearest nest >1,000 m (ness = 993).
We examined the effects of habitat on whether a nest survived or failed specifically due to depredation and whether exclosures were effective. For the depredation analysis, we used the same approach as when examining habitat effects on overall nest survival. However, here we subset the data to only nests that survived to hatching or failed due to depredation (ness = 818). We removed nests that failed due to abandonment, human-related causes, sand, or unknown causes from this analysis. Finally, to assess the effectiveness of exclosures, we compared the baseline model to the baseline model + exclosure effect + an exclosure-by-site interaction effect. For this analysis we included all observations (ness = 4,483).
Results
Across the two sites and seven years (2006–2012), we discovered 307 nests that were monitored for more than one day: 154 nests at Midway Beach and 153 nests at Leadbetter. Number of nests ranged from 10 to 29 per site per year with similar numbers per year. Of the 307 total nests, 142 were exclosed and we measured habitat variables at 251 nests (no habitat variables were measured in 2006). Of the nests where we measured habitat variables, we also measured distance to the nearest active conspecific nest at 165 nests. Because of these sample size differences, the number of nests included in each analysis below varies.
When looking at outcomes of unexclosed nests only, there was a higher percentage of unknown failures at Leadbetter (Table 2), there were more abandonments and human caused failures at Midway Beach and the only identified predators (based primarily on tracks) were crows (American Crow Corvus brachyrhynchos or Northwestern Crow C. caurinus), Common Raven Corvus corax, and coyote Canis latrans; Table 2. For the predation events where the predator was indirectly identified, corvids comprised approximately 90% of those events (Table 2). We only observed depredation by crows and coyotes at Midway Beach and we observed depredation by Common Ravens at both sites (Table 2).
Counts by nest outcome category (percent within column) of all unexclosed nests at Leadbetter and Midway Beach, WA, USA (2006–2012). In addition, we also provide counts (percent within column) by predator of all unexclosed, depredated nests. In nearly all cases, the predator was identified by tracks left at the nest. Note: “Sand” = nest buried by sand; “Human” = human caused failure including stepped on, crushed by horseback riders, and crushed by a vehicle; “Unknown failure” indicates that the nest failed (eggs disappeared) but could not have hatched based on date and the cause of the failure was undetermined; “Corvid” = tracks in the sand were consistent with corvid but we could not determine the species.

Selecting the baseline model: Using the subset of data that included only observations with nest-age, the top models included Site and quadratic season-date (there was no difference between the model with centred age date (Median Date) and non-centred date) (Table 3). The next highest ranked models included Site and quadratic nest-age (delta-AICc = 1.678; there was no difference between the model with centred age and non-centred age). All other models we examined had delta-AICc > 2.
AICc table for choosing baseline model using only nests with nest age data and observations without exclosures (n ess = 1,731). The two models with site and season date centered and non-centered were equally supported.

Using the subset of data that included observations with and without nest-age, the top models included Site and quadratic season-date (there was no difference between the model with centred date, Median Date and non-centred date; Table 4). The next highest ranked model (delta AICc = 1.068) had site and centred (Median Initiation) quadratic season-date. All other models had delta AICc > 2. None of these comparisons included models with nest-age. Because the models with season-date were highly competitive to the models with nest-age and because using season-date instead of nest-age would allow the inclusion of more data, we chose to include quadratic season-date (non-centred) and site in our baseline model. In general, early season nests and nests on Leadbetter Point survive poorly relative to late season nests and nests at Midway Beach (Figure 1).
AICc table for choosing baseline model using only observations without exclosures and including nests with and without Nest Age (n ess =1,832). Because we include nests both with and without Nest Age, there are no models with Nest Age in this table. The best supported models include Quadratic Centered (and non-Centered) Season Date and Site.

Relationship between nesting season date and daily survival rate for nests on Midway Beach (Black) and Leadbetter (Gray) for nests with (solid) and without exclosures (dashed) (2006–2012). For nests without exclosures (dashed), we used the baseline model and for nests with exclosures we used baseline + exclosure.

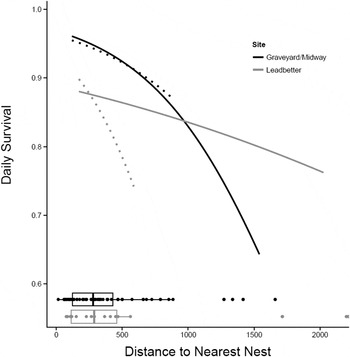
Habitat effects on nest survival: Of the models with habitat variables, none performed better than the baseline model except for the models with distance-to-nearest-nest (Table 5). The model with distance-to-nearest-nest and a distance-to-nearest-nest × site interaction effect ranked highest, followed by the model with distance-to-nearest-nest without the interaction effect (delta AICc = 1.630). The baseline model followed with delta AICc = 4.239. The remaining models all had delta AICc > 6. Whether or not we include the outliers, nests with close neighbours are more successful than nests more distant from their nearest neighbour and nests located on Midway Beach are more successful than those located on Leadbetter (Figure 2). This analysis includes all successful (hatched) and unsuccessful nests regardless of the cause of failure (depredated, abandoned, buried by drifting sand, crushed by horses, etc.) but does not include exclosed nests.
AICc Table for comparing models with habitat variables for all nest success vs. failure (ness = 1039). Includes only nests without exclosures and without missing habitat variables or distance to nearest nest values. Includes distance to nearest nest outliers (see text). DNN = Distance to Nearest Active Nest, HRA = Habitat Restoration Area.

Relationship between distance to nearest active nest (DNN) and daily survival rate at Midway Beach/Graveyard Spit and Leadbetter (2007–2012) for the model: baseline + DNN + DNN-by-site interaction. Daily survival rate was calculated for day = 68.5 (the midpoint of the season). Solid lines include outliers and dotted lines do not. Boxplots below the curves show the distribution of DNN for each site.
Even though we found no effect of habitat variables on nest success, plovers appear to use nest sites with specific characteristics. Looking at natural sites outside the habitat restoration area (Midway and Graveyard) there was very little cover of any type near nests (Figure 3). For example, at the 1 m2 scale 90% of the nests had < 5% shell cover, and 80% had < 5% wood and live vegetation cover (Figure 3). Oyster shell was added at Leadbetter to improve nest crypsis and to help hold sand in place, thus percent shell cover was considerably higher at Leadbetter than at Midway Beach (Figure 3) yet there was no effect on nest success. At the 25 m2 scale, the percent vegetation cover increases considerably relative to the 1m2 but it remains generally < 25% cover (Figure 3).
Proportion of nests that fell into each cover type-scale-site combination. Sites = Leadbetter, Midway Beach, and Graveyard Spit; scales = 1 m2, 5 m2, and 25 m2 rectangular plots centered on the nest; cover classes = dead vegetation, grass and other live vegetation, wood, shell, and unvegetated ground (sand); and cover classes: 0 = < 1 % cover, 1 = 1-5%, 2 = 6-25%, 3 = 26-50%; 4 = 51-75%; 5 = 76-95%; 6 = 96-100%. Within a box (scale), the proportions will sum to one across a row. Note that Leadbetter includes a habitat restoration area where oyster shell was added and non-native beach grasses Ammophila spp. were killed to improve nest crypsis and site suitability respectively.

Habitat effects on nest depredation: For the analysis examining habitat effects on nest depredation (including successful and depredated nests only), only models with distance-to-nearest-nest ranked higher than the baseline model (Table 6). Here the model with distance-to-nearest-nest and the distance-to-nearest-nest × site interaction ranked second (delta AICc = 0.503) behind the model without the distance-to-nearest-nest × site interaction. Again, the baseline model ranked third (delta AICc = 1.364) and the models with all other habitat variables had delta AICc > 2.
AICc table for Hatch vs. Depredated. ness = 818 (Data subset = 7; does not exclude nests with outlier DNN). DNN = Distance to Nearest Neighbour, and HRA = Habitat Restoration Area

Predator exclosures: Exclosures had a substantial positive influence on nest survival (Figure 1). The model that included the baseline variables plus exclosures was far superior to the baseline model (delta AICc = 78.510).
Discussion
A number of studies have found Snowy Plover nesting success to vary greatly depending on location and year (Page et al. Reference Page, Stenzel, Winkler and Swarth1983, Reference Page, Stenzel and Ribic1985, Reference Page, Stenzel, Page, Warriner, Warriner, Paton and Poole2009, Wilson-Jacobs and Meslow Reference Wilson-Jacobs and Meslow1984, Powell Reference Powell2001, Colwell et al. Reference Colwell, Millett, Meyer, Hall, Hurley, McAllister, Transou and Levalley2005, Reference Colwell, Burrell, Hardy, Kayano, Muir, Pearson, Peterson and Sesser2010). Similarly, we found site differences in nest survival but little evidence for a year effect despite seven years of nest monitoring; nest success at Leadbetter was consistently lower than Midway Beach. Differences in nest success among sites can be influenced by a variety of factors including predator abundance and composition, food availability, natural events (e.g. drifting sand and high tides), and nest disturbance and destruction by human activities (Dowling and Weston Reference Dowling and Weston1999). Throughout much of coastal California, Oregon and Washington, egg predation is the primary source of Snowy Plover nest failure and ravens and crows are the primary predators (Wilson-Jacobs and Meslow Reference Wilson-Jacobs and Meslow1984, Wilson-Jacobs and Dorsey Reference Wilson-Jacobs and Dorsey1985, Powell Reference Powell2001, Colwell et al. Reference Colwell, Millett, Meyer, Hall, Hurley, McAllister, Transou and Levalley2005, Reference Colwell, Burrell, Hardy, Kayano, Muir, Pearson, Peterson and Sesser2010, Burrell and Colwell Reference Burrell and Colwell2012). In addition, Plover nest and fledging success negatively correlates with raven activity (Burrell and Colwell Reference Burrell and Colwell2012). In our study, we also found predators to be the primary source of egg loss and indirect evidence (primarily tracks left at depredated nests) identified ravens and crows as the primary egg predators (Table 2). As indicated by Burrell and Colwell’s (Reference Burrell and Colwell2012) nest camera study, the rate of predation by corvids may be much higher than suggested by our data because some of the predation events, where we could not attribute the event to a specific predator, may be the result of raven or crow predation.
Regardless of site, nest success improved as the season progressed. Seasonal variation in nest success is not uncommon in birds. Some studies have reported increases in predation rates as the nesting season date increases (Wiebe Reference Wiebe2003, Grant et al. Reference Grant, Shaffer, Madden and Pietz2005, Muller et al. Reference Muller, Pasinelli, Schiegg, Spaar and Jenni2005, Kroll and Haufler Reference Kroll and Haufler2009), while others have reported seasonal decreases (Davis Reference Davis2005, Brown and Roth Reference Brown and Roth2002, Winter et al. Reference Winter, Johnson and Shaffer2005). These patterns can be driven by seasonal changes in vegetation structure resulting in better nest concealment (Hartley and Shepherd Reference Hartley and Shepherd1994, Winter et al. Reference Winter, Johnson and Shaffer2005, Borgmann et al. Reference Borgmann, Conway and Morrison2013), or by seasonal changes in the diet, abundance or behaviour of nest predators (Nolan Reference Nolan1963, Roseberry and Klimstra Reference Roseberry and Klimstra1970, Wilson et al. Reference Wilson, Martin and Hannon2007, Grant et al. Reference Grant, Shaffer, Madden and Pietz2005, Hardy and Colwell Reference Hardy and Colwell2012, Borgmann et al. Reference Borgmann, Conway and Morrison2013). Given that the percentage cover of vegetation adjacent to the nest is extremely sparse at our study sites (generally 0–5%; Figure 3) and what little vegetation that exists is dominated by perennial grasses that have year-round foliage, it is unlikely that seasonal changes we observed are due to better concealment later in the season. Instead, these changes may be due, in part, to changes in predator behaviour (alternative food resources) and/or better weather conditions later in the nesting season.
Distance to nearest active nest had a positive effect on nest success in our study and the slope of this relationship is quite steep even after removing the outliers (Figure 2). Some have suggested that Snowy Plovers nest semi-colonially (territorial birds aggregating at low densities) to reduce predation rates (Powell Reference Powell2001, Saalfeld et al. Reference Saalfeld, Conway, Haukos and Johnson2012, Patrick Reference Patrick2013). Increased vigilance driven by higher plover densities (more eyes looking) is thought to increase nest survival in semi-colonial nesting birds (Brown and Brown Reference Brown, Brown, Nolan and Thompson2001, Varela et al. Reference Varela, Danchin and Wagner2007). Alternatively, apparent semi-colonial nest clustering may be driven by patchy habitat (Brown and Brown Reference Brown, Brown, Nolan and Thompson2001) and it is difficult to separate these two potential mechanisms for nest clustering. Suitable Snowy Plover nesting habitat – large expanses of sparsely vegetated, relatively flat sandy landscapes adjacent or very close to marine waters – is very limited in coastal Washington (Cooper Reference Cooper1958, Seabloom and Wiedemann Reference Seabloom and Wiedemann1994, Wiedemann and Pickart Reference Wiedemann, Pickart, Martinez and Psuty2004; Zarnetske et al. Reference Zarnetske, Seabloom and Hacker2010) and throughout much of its range due to the expansion of non-native grasses. However, within our two coastal patches or colonies, we found that nests that were closer to other nests survived better and that low nest success was driven by nest predation suggesting an anti-predator advantage to nesting semi-colonially.
Studies have found a similar relationship between nest success and distance to nearest neighbour for Snowy Plovers (Powell Reference Powell2001) and for congenerics (C. melodus; Burger Reference Burger1987) but others have found no relationship (Saalfeld et al. Reference Saalfeld, Conway, Haukos and Johnson2012, Patrick Reference Patrick2013). These differences among studies may be driven by an interaction between nest density and predator assemblages (Saalfeld et al. Reference Saalfeld, Conway, Haukos and Johnson2012). Page et al. (Reference Page, Stenzel, Winkler and Swarth1983) suggested that extremely low Snowy Plover nest density (densities 20 times less than coastal environments) was an important anti-predator adaptation at Mono Lake, California where low nest densities made it difficult for the primary nest predator, the California Gull Larus californicus to locate the nests. Similarly, the lack of a nearest neighbour effect for Snowy Plovers nesting in the southern high plains of Texas (Saalfeld et al. Reference Saalfeld, Conway, Haukos and Johnson2012), might also be the result of the local predator community (coyote Canis latrans, domestic dog C. familiaris, raven Corvus spp. and Black-crowned Night Heron Nycticorax nycticorax; Saalfeld et al. Reference Saalfeld, Conway, Haukos and Johnson2011). Herons for example, appear to be attracted to higher nest densities of their prey and anti-predator defence is rarely directed toward herons because of their large size and the potential risks they pose to responding birds (Brunton Reference Brunton1999). In contrast to these two studies, ravens and crows are the primary nest predators of coastal Snowy Plovers in Washington, Oregon and northern California and there appears to be a negative relationship between nest density and levels of crow predation for some bird species (Brunton Reference Brunton1999) suggesting a potential advantage to close neighbours when corvids are the primary nest predator.
Patrick (Reference Patrick2013) measured coloniality and nearest neighbour distances in the Snowy Plover and found evidence that coloniality occurred when the population was large but not when the population was small. This was a small population (19–64 breeding adults depending upon the year) spread across a very large area (95 km of beach and gravel bars) and the average nearest neighbour distance was considerable (1,284 m, SD = 4,019 m). In contrast, each of our two study sites had an annual population of about 18–35 birds (depending upon the year and site) distributed along only 10 km of coastline (nearly 10 times less) with mean nearest neighbour distances of only 288 m (median = 274 m). It may be difficult to assess the effect of nearest neighbour distance on nest survival when Snowy Plover density is very low because distance to nearest neighbour is in a narrow range of large values. Conversely, there may be a disadvantage of too many close neighbours; especially at densities greater than those observed at our study sites if higher densities make it easier for predators to locate and exploit Snowy Plover eggs (Brunton Reference Brunton1999).
Differences in nest success can be driven by the composition and structure of the habitat surrounding nests that influence crypsis of eggs and incubating adults. For example, Colwell et al. (Reference Colwell, Millett, Meyer, Hall, Hurley, McAllister, Transou and Levalley2005) suggest that Snowy Plover eggs and chicks are more cryptic in river substrates (large, heterogeneous substrates, with more egg-sized stones) compared to homogeneous substrates such as beaches. This conclusion was reached because nests are difficult for a naïve human observer to locate when searching gravel bars with more egg sized cobbles (Colwell et al. Reference Colwell, Meyer, Hardy, McAllister, Transou, Levalley and Dinsmore2011). They also found higher nest success on gravel bars than nearby coastal beaches thereby providing additional evidence for the crypsis hypothesis (Colwell et al. Reference Colwell, Millett, Meyer, Hall, Hurley, McAllister, Transou and Levalley2005, Reference Colwell, Burrell, Hardy, Kayano, Muir, Pearson, Peterson and Sesser2010) or suggesting differences in nest predator assemblages between sites (Burrell and Colwell Reference Burrell and Colwell2012). Similarly to the observation by Colwell et al. (Reference Colwell, Meyer, Hardy, McAllister, Transou, Levalley and Dinsmore2011), we found it very difficult to locate nests in the habitat restoration area at Leadbetter where oyster shells had been liberally spread across the beach, but we found no effect of shell cover on nest success in our models. In fact, we found no effect of any habitat variables on nest success even when assessing them at three different spatial scales. In a similar modelling approach that included the effect of site and year, Hardy and Colwell (Reference Hardy and Colwell2012) found little evidence that habitat variables in the vicinity of the nest influenced overall nest success. Instead, there was a strong site effect as we observed and a weaker effect of corvid abundance on nest success.
Despite the lack of a relationship between nest predation rates and habitat variables, coastal Snowy Plovers appear to select very specific habitat types. At the coastal landscape scale, Snowy Plovers use sites adjacent to or very close to the ocean or marine waters including coastal streams, estuaries, but they nest primarily on sandy coastal beaches (both bluff-backed and dune conditions) and occasionally they nest on gravel or former salt ponds (Page et al. 1995, USFWS 2007). Within these habitats, site occupancy and colonisation is negatively influenced by inter-dune vegetation and they tend to use relatively large open and relatively flat sites (MacDonald et al. Reference MacDonald, Longcore and Dark2010, Webber et al. Reference Webber, Heath and Fischer2013). Snowy Plovers are less likely to use areas with high percentage cover of dense vegetation among dunes (Webber et al. Reference Webber, Heath and Fischer2013). Also, beach debris and access to nearby foraging areas influence site occupancy, colonisation, and extinction (Webber et al. Reference Webber, Heath and Fischer2013).
Even though long-distance breeding dispersal occurs in western North America Snowy Plovers (Stenzel et al. Reference Stenzel, Warriner, Warriner, Wilson, Bidstrup and Page1994), dispersal distances between nest attempts are relatively short and do not move many individuals beyond the local “site” (Pearson and Colwell Reference Pearson and Colwell2014). This dispersal pattern supports the need to manage for higher breeding productivity at occupied sites, specifically activities targeted at reducing predation on chicks and eggs, rather than relying on dispersal after nest failure to move birds away from sites with high predation pressure and toward sites with lower pressure (Pearson and Colwell Reference Pearson and Colwell2014). Within occupied sites, Snowy Plovers use sparsely vegetated areas for nesting (0–12% cover; Wilson-Jacobs and Meslow Reference Wilson-Jacobs and Meslow1984, Page and Stenzel Reference Page and Stenzel.1981, Powell Reference Powell2001, this study) which may facilitate early predator detection (Martin Reference Martin1988, Cresswell Reference Cresswell1997). These results in combination with the importance of relatively close nest spacing suggest the importance of protecting large expanses of suitable habitat where Plovers can nest semi-colonially in our study area. When considering the transferability of our results to other regions, we recommend additional research to examine the relationship between nest success and site/landscape features, predator assemblages and nest spacing to better inform management strategies. For example, is there an adult survival advantage to early detection as suggested by Amat and Masero (Reference Amat and Masero2004) and if so, under what conditions?
Snowy Plover nest predation rates can be reduced through various management activities (Table 1) including wire mesh cages placed around nests (exclosures) designed to exclude large mammals and birds intent on depredating eggs. Predator exclosures are used widely by managers because they are easy to install, they are inexpensive, and they appear to have a positive effect on nest success. For some species and under some ecological conditions, predator exclosures can increase reproductive success without increasing adult mortality (e.g. Pauliny et al. Reference Pauliny, Larsson and Blomqvist2008) and can have positive population effects (e.g. Larson et al. Reference Larson, Ryan and Murphy2002, Smith et al. Reference Smith, Pullin, Stewart and Sutherland2011). For other species, exclosures either have no effect on nest success (e.g. Nol and Brooks Reference Nol and Brooks1982, Mabee and Estelle Reference Mabee and Estelle2000, Pearson et al. Reference Pearson, Moore and Knapp2012) or have detrimental effects on adult survival (e.g. Murphy et al. Reference Murphy, Michaud, Prescott, Ivan, Anderson and French-Pombier2003). Generally, exclosures significantly increase hatching success (Smith et al. Reference Smith, Pullin, Stewart and Sutherland2011) as we observed in this study.
Even though we observed a consistent positive effect of exclosures on nest success, we recommend that they be used with caution without additional research on their influence on overall population growth. Some studies have found that predators appear to use exclosures to locate and kill adult ground nesting birds in or near the exclosure cage (Smith et al. Reference Smith, Pullin, Stewart and Sutherland2011, Pearson et al. Reference Pearson, Moore and Knapp2012). Avoiding negative effects on adult survival is particularly important for species like the Snowy Plover because of its disproportionate effect on population growth (Nur et al. Reference Nur, Page and Stenzel1999). We observed two cases where it appears that an adult Snowy Plover was killed in association with an exclosure (adult feathers and blood found on the exclosure or adjacent to it) yet we never observed similar evidence of adult mortality at unexclosed nests. In response to these incidents, we discontinued the use of exclosures immediately for the season. Similarly, in northern California, managers discontinued the use of exclosures after an episode of high adult mortality associated with predator exclosures (Hardy and Colwell Reference Hardy and Colwell2008, Mullin et al. Reference Mullin, Colwell, McAllister and Dinsmore2010).
When reviewing the literature and considering the adult Snowy Plover mortality associated with exclosures in California, Oregon and Washington, we recommend: (1) exclosures not be used at sites with resident or migrating falcons or with other species that may use exclosures to detect and kill adult birds (Murphy et al. Reference Murphy, Michaud, Prescott, Ivan, Anderson and French-Pombier2003, Neuman et al. Reference Neuman, Page, Stenzel, Warriner and Warriner2004, Niehaus et al. Reference Niehaus, Ruthrauff and McCaffery2004, Isaakson et al. 2007, Hardy and Colwell Reference Hardy and Colwell2008, Pearson et al. Reference Pearson, Moore and Knapp2012); (2) their use should be accompanied by close monitoring to evaluate their effectiveness (Hardy and Colwell Reference Hardy and Colwell2008); (3) if they are found to be ineffective or detrimental (e.g. causing adult mortality or nest abandonment), their use be discontinued (Pauliny et al. Reference Pauliny, Larsson and Blomqvist2008) or managed to address the shortcomings of the equipment design (Pearson et al. Reference Pearson, Moore and Knapp2012). In addition, management activities other than exclosures should also be considered, especially if they benefit plover fecundity without the negative effects on adult survival. For example, preliminary data suggests that once predator management (including removal) was initiated on Oregon’s coastal beaches, the need to use exclosures, and the associated risk of adult plover mortality, was reduced (Dinsmore et al. Reference Dinsmore, Lauten, Castelein, Gaines and Stern2014).
Acknowledgements
We thank the Lacey, Washington office of the U.S. Fish and Wildlife Service for providing both Section 6 funding under the Endangered Species Act and recovery dollars to fund the nest monitoring, habitat measurements and this analysis and synthesis (Grant # F12AP00628). We thank Washington State Parks and Lisa Lance in particular for their logistical support. For assistance with nest monitoring, and nest habitat measurements we thank Kathy Gunther, Kirsten Brennan, William Ritchie, Wendy Pearson, Sarah Peterson, and Deborah Jaques. We thank Mike Weston and an anonymous reviewer for helpful comments on an earlier version of this manuscript.


