

Introduction
As our understanding of global climate change improves, it becomes increasingly clear that regional changes in glacial mass balance, precipitation and sea-level rise will cause the greatest societal impacts in the future (Reference SolomonSolomon and others, 2007; NRC, 2010). In Alaska, abrupt 20th-century warming (1.0-2.2°C since 1949; Reference Stafford, Wendler and CurtisStafford and others, 2000) has contributed to the rapid retreat of mountain glaciers, accounting for ~10% of modern sea-level rise (Reference Arendt, Echelmeyer, Harrison, Lingle and ValentineArendt and others, 2002, Reference Arendt2006; Reference Berthier, Schiefer, Clarke, Menounos and RemyBerthier and others, 2010). Therefore, quantifying current melt and changes in melt-regime elevations is a significant concern for the mass-balance community, particularly as temperatures continue to rise. Results from this study provide a baseline for melt-regime elevation estimates relative to future glaciological mass-balance studies in Alaska and the Arctic.
The use of higher-frequency ground-penetrating radar (GPR) systems on temperate glaciers is a challenging endeavor primarily because of the significant signal attenuation via signal scattering from melt or fractured and englacial debris-rich ice. Low-frequency radar systems are often used on valley glaciers;however, they are generally limited to delineating bottom reflections and provide poor strata resolution (Reference Jacobel and AndersonJacobel and Anderson, 1987; Reference Nolan, Motyka, Echelmeyer and TrabantNolan and others, 1995; Reference Welch, Pfeffer, Harper and HumphreyWelch and others, 1998; Reference Arcone and YankielunArcone and others, 2000). For example, Reference Arcone and YankielunArcone and others (2000) reached 190 m depth on the Muir Glacier (Alaska) ablation zone at 100MHz but failed to image strata because they profiled in wet conditions.
Here we provide data collected with a range of midfrequencies and at various elevations to image both bedrock depth and internal strata at three study sites in Alaska. We hypothesized that conformable strata would exist within the dry snow and upper reaches of the percolation zone and that, based on the previous success of Reference Arcone and YankielunArcone and others (2000), we could use high-frequency radar to image these strata as well as the depth to bedrock.
Using the same radar dataset, we also roughly delineate boundaries between the wet, percolation and dry snow zones and provide examples that either support or preclude the use of mid-frequency antennas for studying strata and flow dynamics of valley glaciers. Results from this study represent a significant advance on previous studies because we reach ice depths greater than 300 m with a 100 MHz antenna, while simultaneously acquiring high-resolution strata signals to 75 m depth, in the percolation zone. We supplement and compare these data with 40 and 80 MHz GPR profiles which are also significant radar advancements because we successfully penetrate ice depths upward of 480 m and are able to image strata as deep as 180 m with these antennas. To our knowledge, no other temperate or arctic valley glacier study has imaged this depth of ice or successfully imaged strata at such great depths with a continuous recording middle- to high-frequency ground-operated GPR system.
Ice-core site selection can play a significant role in the consistency and value of ice-core paleoclimate records and associated climate models. A poor site can result in ambiguous data that have been altered spatially or temporally, resulting thereafter in poor input into climate models. Likewise, the application of these paleoclimate models to future climate scenarios can significantly alter future climate predictions. It is important for climate modelers to understand the strengths, weaknesses and uncertainty from ice-core records, and this paper provides a case study of variables that can alter an ice-core record from its initially deposited state.
Holocene ice-core records from coastal locations in Alaska, USA, and Yukon, Canada, such as the Eclipse Icefield, Mount Logan and Mount Bona-Churchill suite, provide significant contributions to our understanding of millennial or shorter-term climate variability and pollution transport in the Pacific Northwest (Reference Yalcin and WakeYalcin and others, 2001, Reference Yalcin, Wake and Germani2002, Reference Yalcin, Wake, Kreutz and Whitlow2006a, Reference Yalcin, Wake, Kreutz, Germani and Whitlowb; Reference FisherFisher and others, 2004; Reference OsterbergOsterberg and others, 2008). However, several questions remain regarding the progression of pollution inland (i.e. into interior Alaska) and the spatial patterns of coastal Pacific versus Arctic Holocene temperature and precipitation variability.
To address these questions, a millennial- or Holocene- scale ice core recovered from the Alaska Range would be an ideal addition to the existing coastal ice-core suite. Criteria for an appropriate drill site include:
-
Location within the dry zone or upper reaches of the percolation zone to minimize chemical diffusion through melt.
-
Surface-conformable stratigraphy (SCS) showing minimal signs of deformation (e.g. folding or unconformities) to minimize ambiguities in ice-core data.
-
Depth and accumulation rate that provide an age of ice greater than 1000 years which would extend the instrumental record by >900 years in this region.
-
Well-preserved seasonal isotope and ion chemistry.
-
Limited localized anthropogenic chemical influence, such as those potentially caused by climbers or aircraft.
-
Logistically feasible site that is safe and accessible.
Glacial basins located in the dry snow zone present potentially ideal sites because of minimal post-depositional alteration to original physical strata and chemical signals. This requirement precludes much of the Pacific Northwest and Alaska because there are few places that sustain dry snow conditions. For example, dry snow zone average temperatures are less than -20°C (Reference Benson, Bingham and WhartonBenson and others, 1975) and occur at elevations greater than ~3500 m a.s.l. (Reference Trabant and MarchTrabant and March, 1999) in Alaska. Regions high in the percolation zone that exhibit a small amount of melt are also strong candidates as long as the melt does not wash out chemical signals of interest. Under certain circumstances, ice-layer stratigraphy has been correlated with annual summer warming (i.e. melt) events (Reference Koerner and FisherKoerner and Fisher, 1990) and coincides with seasonal isotope and ion fluxes (Reference Kelsey, Wake, Kreutz and OsterbergKelsey and others, 2010). Unfortunately, the steep valley walls and varied subsurface topography of most valley glaciers can alter ice stratigraphy during flow. Surface ice-flow velocity measurements from GPS and internal strata imaged from GPR are valuable data for determining whether stratigraphy has been significantly altered and, if so, to what degree and by what mechanisms.
A previous attempt using radar to locate a suitable drill site in the dry snow zone near Denali Pass (5180 m a.s.l.) on Mount McKinley (Reference Kanamori, Ohkura, Shiraiwa and YoshikawaKanamori and others, 2005) revealed only 50 m of ice, unsuitable for a long-term climate record. We conducted air reconnaissance flights in 2008 over the Alaska Range at lower elevations likely to have thicker ice yet still be located in the accumulation zone, and identified three other potential core sites: Upper Yentna Glacier (MR; 2652 m a.s.l.) on Mount Russell; the Kahiltna Pass Basin (KPB; 3048 m a.s.l.) on Mount McKinley (Denali); and an ice divide (3910 m a.s.l.) between the north and south peaks of Mount Hunter (MH) (Fig. 1).
Map of study locations, with elevations, Kahiltna base camp (KBC), summit of Denali and major glaciers labeled, in the Alaska Range. The inset map shows the Alaska Range location, with red and blue representing high and low elevations, respectively.

The primary objective of this paper is to define ice depths and melt regimes of three study locations while simultaneously estimating boundary elevations between different melt regimes in the Alaska Range. We use GPR, glacio- chemical and GPS evidence for this objective. Our secondary objective is to address strengths and weaknesses associated with each study location as a potential ice-core drill site. For our secondary objective, we use GPR to profile strata and ice depths;GPS rapid static surveys to determine elevation, velocity and surface strain to infer internal deformation; and glaciochemical data to determine accumulation rates and spatial variability in glaciochemical signals across the Alaska Range. To our knowledge, this is the first multi-site and multi-parameter assessment of melt regimes, ice depths and potential valley glacier ice-core drill locations in the Alaska Range.
Equipment and Methods
We collected GPR profiles with a Geophysical Survey Systems Inc. (GSSI) SIR-3000 control unit coupled with a variety of antennas. A model 3107 100 MHz monostatic transceiver was used at MR. We used a model 3101 900 MHz bistatic antenna unit and a model 5103 400 MHz bistatic antenna unit for high-resolution imaging of the upper ~14-40m of firn at KPB, and model 3107 100 MHz and model 3200 MLF 15-80 MHz bistatic antennas to image deeper stratigraphy and bedrock depth at KPB, the latter of which we also used at MH with a frequency centered near 80 MHz. All antennas were hand- towed at an approximate speed of 0.3-0.5ms-1 and polarized orthogonally to the profile direction. Profile traces lasted 100-400 ns or 4000-6300 ns for shallow or deep applications, respectively, with 2048-4096 16-bit samples per trace. We recorded using range gain and post-processed data with bandpass filtering to reduce noise. We applied elevation and distance corrections to the profiles using regularly spaced GPS readings. Post-processing also included stacking to increase the signal-to-noise ratio, and a Hilbert transformation (magnitude only) to amplify the complex returns from many horizons. Table 1 outlines the radar profiles collected and antennas used at each site.
Summary of GPR frequencies used and total GPR profile distances at Upper Yentna Glacier (MR), Kahiltna Pass Basin (KPB) and ice divide on Mount Hunter (MH). Data for this project were collected in 2008, 2009 and 2010

We performed a rapid static survey of KPB to quantify surface ice velocities. We used a Trimble 5700 receiver in conjunction with a Zephyr Geodetic antenna for base station corrections. We placed a grid of 25 stakes within the flat region of KPB and another 12 stakes down-glacier between 8 and 11 May 2009. Each stake remained in place following the initial GPS measurement for another 4-9 days and was relocated by the receiver to create a network of surface ice-flow velocity vectors. We collected another 16 velocity measurements within and upstream of our study region between 12 and 26 May 2010 to compare with data collected in 2009. Error estimates range between 2.0 and 3.6 m a-1 based on the associated known errors of ±0.05 m per GPS measurement. Velocity surveys were not conducted at MR or MH due to the less complex terrain associated with these two locations and time constraints in the field.
We measured accumulation rate and chemical variability within shallow firn cores extracted from Kahiltna base camp (KBC; 10m in 2010), MR (18.77 m in 2008), KPB (23.13 m in 2008, 14m in 2010) and MH (10m in 2010) (Fig. 1), using ultra-clean techniques (Reference Kelsey, Wake, Kreutz and OsterbergKelsey and others, 2010). We analyzed shallow ice-core and snow-pit samples for major ions, stable isotopes, trace metals and rare earth elements using established laboratory methods for low-level ice-core samples (Reference Osterberg, Handley, Sneed, Mayewski and KreutzOsterberg and others, 2006). Annual accumulation rates were determined at all sites using annual-layer counting from chemistry records (Reference Holdsworth, Pourchet, Prantl and MeyerhofHoldsworth and others, 1984; Reference Grumet, Wake, Zielinski, Fisher, Koerner and JacobsGrumet and others, 1998; Reference Moore, Holdsworth and AlversonMoore and others, 2001) and chemical spikes from known volcanic eruptions in coastal Alaska. We calculated depth-age models based on equations from Reference NyeNye (1953) and Reference HaefeliHaefeli (1961) using accumulation rates established from the shallow cores and maximum ice depths determined from GPR profiles. We used a density-depth profile from the KPB firn core to adjust firn density to ice equivalency for each of the depth-age models (Fig. 2). The KPB core was used for this adjustment because it represented the deepest and most local record available for establishing a reliable density profile.
Depth–density curve from KPB shallow core. The bubble close-off density of ice was used to estimate depth to the firn/ice transition, and the profile was used to adjust ice equivalent depths for the depth–age and flow models.

Results and Interpretations
Upper Yentna Glacier, Mount Russell
Upper Yentna Glacier on Mount Russell is located at 62°48′50.29′′ N, 151 °49′43.56′′ W in the central-southwest corner of the Alaska Range (Fig. 3). The site is far from potential local (i.e. Alaska Range) anthropogenic pollution sources and is a flat 1 km wide basin providing easy ski- plane access. The uppermost cirque of the basin (2652 m a.s.l.) is characterized by relatively flat terrain surrounded by a steep headwall and bergschrund to the west and gradual slopes originating from the south. The glacier flows north for 1.5 km from the potential core site, and then bends to the east for another 3 km, prior to reaching the Yentna Icefall.
IKONOS 1m resolution satellite image of the potential drill site on Upper Yentna Glacier (UYG), Mount Russell, showing the approximate ice-flow direction (arrows), 100MHz GPR profiles and shallow firn core.

Within the basin, surface-conformable strata occur in the upper ~40m of GPR profiles (Fig. 4). However, a strong horizon commonly occurs at 50 m depth, likely at the firn/ ice transition, and stratification is discontinuous, weakly reflecting or non-existent at greater depths (Fig. 4). Significant ice layers from previous melt and refreezing occur in the snow pit and shallow ice core to 18.77 m depth (Fig. 5c). Thus, we interpret the strong GPR horizon at ~50 m depth as a response from a water table resting on the firn/ice transition zone, originating from meltwater percolating down through the firn pack. Some hyperbolic diffractions appear below the firn/ice transition, which we interpret as localized pockets of melt (Reference Arcone and YankielunArcone and Yankielun, 2000). They are not visible in Figure 4. We were unable to image bedrock depth with the radar system used in 2008 but it did penetrate ice up to 200m deep. We estimate a maximum depth of 250m based on the slightly smaller basin dimensions of the Upper Yentna Glacier basin, relative to basin dimensions and ice depths measured at the two other sites (MH and KPB) in this study. Chemical analysis of the ice core collected in 2008 revealed seasonal chemistry signals, but an estimated accumulation rate of 1.8 m iceeq. a-1 is too high for extracting a millennial-scale ice core. Ice-flow velocities were not obtained in the basin, but due to its location near the upper limits of the glacier, it is likely that center-line velocities are less than 20-30 m a-1, based on velocities measured at KPB.
100MHz GPR profile from Upper Yentna Glacier. The strong horizon is interpreted as a water table (WT) perched on the impermeable firn/ice transition.

Deuterium isotope ratios and ice layers of shallow firn cores collected from Mount Hunter (a), KPB (b), Upper Yentna Glacier (c) and KBC (d; see Fig. 1 for location) showing the increase in signal amplitude with elevation. SMOW is Standard Mean Ocean Water. Cores from KPB and MR were collected in May 2008, and cores from MH and KBC were collected in May 2010. The blue lines above KPB and MR represent the depth/location of ice layers within each core. There was only one thin ice layer in the MH firn core, and the KBC core consisted primarily of large facets, suggesting melting throughout.

Kahiltna Pass Basin, Mount McKinley
The Kahiltna is an alpine valley glacier that originates from the southwestern flank of Mount McKinley and flows primarily south out of the Alaska Range. It is the largest glacier in central Alaska, currently 71 km in length, 475 km2 in area, and has almost 3660m of relief, varying in elevation from 300 to 3960 m a.s.l. (Reference Meier, Tangborn, Mayo and PostMeier, 1971). KPB is located at 63°4′32.96″ N, 151 °10′27.36″ W and 3100 m a.s.l. where it is ~3 km from the glacier bergschrund, up- glacier to the east. The basin is bordered to the west and north by a ridgeline, and is 800 m wide (east-west) by 800m long (north-south). The basin has easy access because it is close to the heavily traveled West Buttress mountaineering route on Mount McKinley, and the Denali National Park Service maintains a nearby ski-plane airstrip during the summer.
Ice-core and snow-pit samples collected in KPB show that ice layers represent 9% of the annual-layer thickness from 2003 to 2008 (Fig. 5b). A 40MHz axial GPR (Fig. 6) profile collected in May 2010 between the bergschrund to the north of KPB (3100ma.s.l.) and Camp 1 (2340ma.s.l.) resolves strata as deep as ~180m between KPB and 2800 m a.s.l. (Fig. 6c, black arrow), and only ~50 m deep at ~2800-2600 m a.s.l. Down-glacier from ~2600 m a.s.l., a complete lack of stratigraphy and a pronounced increase in radar signal attenuation and noise occurs. It appears that below ~2800 m a.s.l., enough melting occurs to destroy most density or chemistry contrasts, typically resolvable with radar.
Center-line 40MHz GPR profile of Kahiltna Glacier from KPB (3100ma.s.l.) to Camp 1 (2340ma.s.l.) collected in May 2010 showing (a) a zoom of the upper 80m depth, (b) the entire depth profile, (c) a zoom of strata visible as deep as 180m in the percolation zone (black arrow) and (d) the transect over a 0.5m resolution QuickBird satellite image (red line). The profile shows an apparent transition (TZ) between the wet (WZ) and percolation zones (PZ) at ~2600–2800ma.s.l. The lower boundary of this zone likely migrates up-glacier during summer (STZ; due to increased summer solar radiation) and down-glacier during winter (WTZ). Labeled velocities are from GPS surveys in 2009–10. The significant velocity increase below the transition zone may indicate a thawed bed down-glacier.

The GPR profile segment between 2600 and 2800 m a.s.l. on Kahiltna Glacier appears similar to radar profiles collected on MR (2652 ma.s.l.) where strata were lacking below the firn/ice transition zone (Fig. 4) near 50 m depth. Hence, we suggest that elevations of 2600-2800 m a.s.l. in the Alaska Range represent a transition between the percolation (Fig. 6; PZ) and wet snow zones (Fig. 6; WZ). We hypothesize that the lower boundary of this zone (2600 m a.s.l.) migrates up-glacier during late summer (Fig. 6; STZ) and down-glacier during the winter (Fig. 6; WTZ), because of increased and decreased solar insolation at higher elevations, respectively. We also suggest that the lack of strata in radar profiles at 2600-2800ma.s.l. is an indicator of this seasonal migration pattern. This characteristic transition is well documented on other glaciers using similar geophysical techniques (Reference Murray, Booth and RippinMurray and others, 2007; Reference Woodward and BurkeWoodward and Burke, 2007).
A comparison of trace-metal crustal enrichment factors (EFs) measured from snow-pit samples from Upper Yentna Glacier and KPB reveals that several elements are enriched by noncrustal sources including sea salt, volcanic aerosols and atmospheric pollution (Fig. 7). EFs above 10 for Cd, Pb, Bi, Cu, Zn and As are interpreted as representing dominant contributions from anthropogenic pollution, but the similarity of the EFs from MR (rarely visited by recreational climbers and aircraft) and KPB (heavily visited by recreational climbers) suggests that the pollution source(s) are regional (Alaskan) or trans-Pacific (Asian), as has been previously documented on Mount Logan (Reference OsterbergOsterberg and others, 2008) and Eclipse (Reference Yalcin and WakeYalcin and Wake, 2001). EF >10 for Na is due to the dominant sea-salt source, while the elevated EF for S is likely due to volcanic sources with a possible anthropogenic contribution. Thus, KPB preserves a record of atmospheric aerosols unaffected by local mountaineering activities and air support, despite being near the highly traveled (>1000 climbers per year) West Buttress mountaineering route. During our three field seasons, we noted that climbers generally travel within a 3m wide trail located on the east side and >250 m from the sample site in KPB; therefore we suggest that any local contamination is likely confined, proximal to the trail.
Crustal EFs from snow-pit samples collected at Kahiltna base camp, Kahiltna Pass Basin (Kahiltna Pass) and Upper Yentna Glacier (Mt Russell). The similar signals between each site suggest minimal local influence from mountaineering activities at KPB or KBC, where climbing use is far higher than at MR.

The average accumulation rate at KPB is 0.8 ± 0.2 m ice eq. a-1. This rate is revised from previous, higher estimates that were based solely on glaciochemistry data from a shallow ice core collected in 2008 (Reference Kelsey, Wake, Kreutz and OsterbergKelsey and others, 2010). The new estimate is constrained by the 2009 Mount Redoubt volcanic eruption, observed in a 2010 shallow core and 2009 snow-pit samples, and a strong correlation between glaciochemical signals of the 2008 and 2010 cores. High-frequency (900MHz) radar profiles show minimal isochrone thickness variability throughout the basin, which suggests that the accumulation rate is spatially consistent (Campbell and others, in press).
GPR profiles (Fig. 8) and surface ice velocity measurements obtained in 2009-10 reveal complex flow dynamics and associated internal structures that may limit the depth of a useful core to ~-150-170m (Campbell and others, in press). The profile in Figure 8 shows significantly deformed ice below this depth, which we interpret as including heavily fractured ice, buried crevasses and relic avalanche debris. The basin is located at the base of a steep, narrow valley from which most of the ice flow originates. These buried features were formed or deposited up-glacier, as ice flowed through a steep, crevassed and avalanche-prone region known as Motorcycle Hill, located 1-2 km to the east. As ice exited the crevasse- and avalanche-prone regions, surface-conformable strata were deposited creating an apparent discontinuity between the complex and surface- conformable stratigraphy visible in GPR profiles.
Zoom of 100MHz GPR profile between A and A0 (Fig. 12) from KPB. Image shows interpreted transition zone (TZ) between surface-conformable strata (SCS) and complex strata (CS). Thickening strata (TS) from compression, and relic avalanche debris or crevasses in the form of hyperbolic events (H) are also visible.

Mount Hunter ice divide
The ice divide on Mount Hunter (3912 m a.s.l.) is a flat area 1000 m wide (north-south) and 1200 m long (east-west), situated at 62°56′20.81″ N, 151°5′12.36″ W, between the north and south peaks of the mountain. The site is accessible via aircraft, and the only major safety hazards are crevasses and icefalls situated well to the northeast and southwest of the ice divide (Figs 9 and 10).
(a) Panoramic photo of the MH ice divide looking north, showing approximate ice-divide location (dotted line), ice-flow directions (arrows), location of GPR profile imaged in (b) (EW1) and the GPR profiles in Figure 11 (SN1, SN2, SN3). (b) SCS in a zoom of the top 100m (B1) and ice depths reaching >250m depth (B2) of radar profile EW1. (c) A US Geological Survey 1 : 24 000 scale topographic map showing surrounding topography and ice-depth contours (color fill) interpolated from radar profiles. Icefalls and crevasses are situated approximately at the end of the arrows pointing to the southwest and northeast.

Series of transverse 80MHz GPR profiles from MH with locations of each profile shown in Figure 9 (SN1, SN2, SN3). Surface distance markers for all three profiles are 100 m. Each profile shows complex strata (CS) to the north and SCS towards the middle. A strong bed horizon from the north dips under false bottom (FB) events toward the south, and projects to depths greater than 250 m. Cross-cutting events (CC) occur in SN1 and SN3, and a small region that lacks internal strata occurs within the SCS on SN3 (dashed box).

The high elevation results in minimal melting. A 10 m deep firn core extracted in 2010 identified one thin melt horizon, ≤2 cm thick, suggesting that the ice divide is presently located in the uppermost percolation zone, and was likely in the dry snow zone during periods cooler than present. A strong seasonal isotope signal is present in the 10m ice core, and the seasonal amplitude is greater than that of the KPB and MR ice cores, indicative of less chemical diffusion associated with the minimal melt (Fig. 5). Although we did not obtain surface ice velocities, they are likely low and deformation is minor because the site is flat and strata appear minimally deformed in GPR profiles (Fig. 10). Chemistry profiles (Al, Ca, La, Mg, Na, Pb, Sr) show a strong seasonal signal, and volcanic eruption spikes from Mount Redoubt (March 2009) and Mount Cleveland (2001) are visible as absolute dating indicators. Based on these records, we estimate an accumulation rate of 0.3 ±0.1 m ice eq. a-1 at Mount Hunter. The saddle is also far from anthropogenic activities that may cause contamination.
Surface-conformable strata to 85 m depth are visible in all GPR profiles collected throughout the basin (Fig. 10). Radar profiles close to the North and South Peaks show some cross-cutting horizons, but they were recorded far from the flat and deep regions characterized by conformable strata in the center of the basin. We believe that signal attenuation causes our inability to image strata at depths greater than 85 m (Reference Arcone and KreutzArcone and Kreutz, 2009), and that strata are surface-conformable to the bed because the ice divide precludes significant deformation. A small region that lacks internal strata occurs within the SCS of SN3 (Fig. 10;dashed box). The cause and origin of this feature is unknown. Ice depths appear to reach 250 ± 30 m towards the center of the basin, but complex bed topography causes multiple events near the bottom of most GPR profiles (Fig. 10), making it difficult to obtain a more precise estimate of maximum depth.
Depth-Age Models
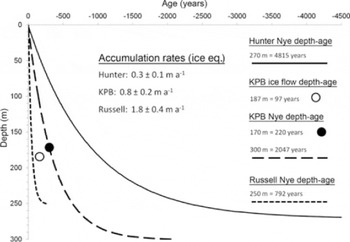
We calculate depth-age models to estimate the maximum age of ice at each study location (Fig. 11). We use the Nye model (Reference NyeNye, 1953; Reference HaefeliHaefeli, 1961) which assumes a frozen bed, incorporates a linear thinning parameter with depth, and was designed for ice flow at or very near a divide, accounting for vertical strain only. Hence, it is an appropriate conservative depth-age calculation at the Mount Hunter saddle. The model does not account for accumulated longitudinal and transverse strain which occurs within and up-glacier of KPB. Likewise, the significant distance KPB is located from the origin of flow limits the ability of the Nye model to calculate a reasonable depth-age relationship in the basin near the bed. KPB has an accumulation rate of 0.8 ± 0.2 m ice eq. a-1 and maximum depth of 287 m ice eq., resulting in ~2047 years of ice based on the Nye model. Mount Hunter has an estimated accumulation rate of 0.3 ± 0.1 m ice eq. a-1 and maximum depth of 258 m ice eq., resulting in ~4815 years of ice. Only ~792 years of ice is estimated via the Nye model on Upper Yentna Glacier, based on a depth estimate of 250 m and accumulation rate of 1.8 ± 0.4 m ice eq. a-1.
Depth–age estimates for MH, KPB and MR, calculated from models developed by Reference NyeNye (1953) and Reference HaefeliHaefeli (1961). The black dot at 170m depth represents the depth of SCS overlying complex strata imaged with GPR in KPB. The open circle represents depth and age of SCS calculated from our flow model.
Geodetic data allow for a different approach to depth-age modeling at KPB because they can be used to estimate transport time and accumulated strain of ice as it flows from one location to another. For example, the distance between Motorcycle Hill and the middle of KPB where the deepest SCS exists is ~2000m. An approximation of longitudinal extension (or compression) on the glacier surface can be calculated between the two sites using

where ![]() is strain rate with respect to x, u is the ice velocity (ma-1) and x is the distance (m) along the flowline. In this way it is possible to quantify areas of extension and compression near the surface depending on the net positive or negative change in velocity between center-line GPS measurements.
is strain rate with respect to x, u is the ice velocity (ma-1) and x is the distance (m) along the flowline. In this way it is possible to quantify areas of extension and compression near the surface depending on the net positive or negative change in velocity between center-line GPS measurements.
Instead of the Nye model, we use a series of surface velocity measurements (Fig. 12), a densification model (Fig. 2) and the average accumulation rate (0.8 m iceeq.a-1) to estimate the number of years represented by the deepest SCS in KPB, and the deformation this SCS has experienced. We interpolate GPS surface ice-flow velocities from the base of Motorcycle Hill to KPB to create velocity contours (Fig. 13a). We establish a flowline perpendicular to these contours (Fig. 12) from Motorcycle Hill to the deepest SCS in KPB and calculate the distance each annual layer traveled along the flowline by plotting average velocity versus time and time versus distance. We calculate volumetric strain rates (Fig. 13b) for each annual layer along the flowline (Reference Koons and HendersonKoons and Henderson, 1995), to account for longitudinal and transverse strain. We use the 23.13 m KPB core to estimate yearly accumulation rates and adjust yearly depths based on densification (vertical strain) to the depth of the firn/ice transition (Fig. 2).
QuickBird 0.5 m resolution image of KPB showing velocity vectors collected in 2009-10, an approximate center-line path (black dotted line) used for the KPB depth-age model, firn-core location, general location of the glacier bergschrund (black dashed line), GPR profiles used for ice depth interpolation, the GPR profile imaged in Figure 7 (A-A′), a region experiencing vertical thickening of strata (TS) caused by compression as ice flows into KPB, and approximate locations of avalanche- and crevasse-prone regions.

Map showing (a) surface velocity contours from Motorcycle Hill (MH) to KPB interpolated from GPS velocity measurements and (b) volumetric strain rate calculated from velocity vectors. Scale bars for velocity and strain rate are to the left and right, respectively.

From these calculations we estimate that ~97 years and 187 ± 33 m of SCS should exist above the CS (Fig. 11). This model is validated by the reasonable comparison of SCS depth (150-170 m) in KPB imaged with GPR. Only 111 m of SCS thickness is estimated from the flow model using a constant accumulation rate and vertical strain only. This suggests that a significant portion of the SCS thickness (~76 m) likely results from longitudinal and transverse strain causing vertical thickening as ice flows into KPB. Although we assume spatially and temporally constant accumulation rates and velocities for this model, the consistency between GPR profiles and model calculations suggests that our hypotheses regarding strain, structure formation, flow dynamics and depth-age approximations in KPB are valid. The gap between our model depth and GPR depth of SCS is likely even smaller because we use a constant radar wave speed of ice (dielectric constant ~3.15) to calculate depth of SCS from radar profiles, whereas snow and firn has a lower dielectric constant (~1.7-2.4) which results in faster wave propagation.
Discussion
Table 2 summarizes results from each of the potential deep ice-core locations relative to our criteria for an appropriate drill site. The MR site has easy access via ski plane, and minimal local anthropogenic pollution due to its remote location. The site experiences significant melt that appears to destroy the stratigraphy in GPR profiles and likely the chemistry record of primary interest. The accumulation rate, >1.8 m iceeq. a-1, and depth estimate, 250 m, also suggest a maximum age short of the desired 1000 years.
Comparison of potential drill sites in the Alaska Range: Upper Yentna Glacier (MR), Kahiltna Pass Basin (KPB) and ice divide on Mount Hunter (MH)
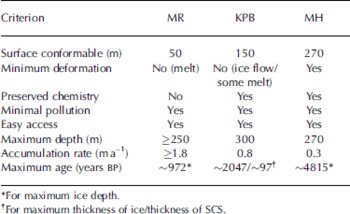
KPB has easy access and a minimal amount of melt or local pollution but it is located in the wilderness zone of Denali National Park, which may limit drilling activities, equipment usage or logistical support. The flow dynamics are particularly complex, and surface-conformable strata exist only in the upper ~170m in the northwest corner of the basin. Although the maximum depth of 300 m might span several thousand years, only the upper ~170 m appears useful for paleoclimate research, and the age at this depth is likely to be ≤ 100 years.
The high elevation and cold temperatures of the potential drill site on Mount Hunter assure minimal melt and preserved chemistry. Surface-conformable strata are present throughout the saddle, and the likelihood of significant deformation is small considering that the site is an ice divide. The saddle is located well away from any normal anthropogenic activities, so localized pollution is insignificant. Likewise, a maximum depth of 270 m and low accumulation rate shows promise in obtaining a millennial-scale core. The apparently uncomplicated flow at Hunter also suggests that useful chemical signals will be preserved to greater depths than at KPB. Ice-flow velocities are unknown at Hunter, but velocities are assumed to be low based on the relatively flat surface topography and ice likely being frozen to the bed. We plan to address these questions in the future with the extension of GPR profiles and collection of surface velocity measurements.
Conclusions
In the Alaska Range, elevations of ~2800-3900ma.s.l. appear to be located in the percolation zone; locations below and above these elevations appear to be within the wet and dry zones, respectively. Hence, future melt volume estimates in the Alaska Range should be based on most melt occurring below ~3900 m a.s.l. Results from this study suggest that the application of mid-frequency (40-100 MHz) GPR to profile ice depths and stratigraphy of temperate glaciers is worthy of future efforts. We suggest profiling temperate glaciers earlier in the melt season to minimize signal attenuation via melt, and using high stacking rates to increase signal-to-noise ratios. The strong bedrock reflectors visible deeper than 400m depth in the percolation zone with the 40 MHz antenna suggest that far greater depths can be profiled with mid-frequency GPR systems, particularly when scattering from melt is reduced during early-season data collection.
We also suggest that future ice-core efforts in this region of Alaska should focus on ≥3000 m elevations to assure minimal chemical diffusion through melt. The presence of SCS deeper than the firn/ice transition in GPR profiles also appears to indicate that melt has not destroyed glacio- chemical signals of interest to ice-core studies. KPB and Mount Hunter are potential ice-core sites based on their SCS, preserved chemistry, limited local pollution, ease of access, and location within the middle and upper reaches of the percolation zone, respectively. However, the complexities associated with KPB (relic avalanche debris, filled crevasses, and complex deformation deeper than 170 m) may limit this site to short-term paleoclimate studies. More reconnaissance is required to further constrain dynamics at Mount Hunter where ≥250 m depths with SCS are likely present. We suggest 40 MHz GPR and a GPS survey to determine if flow is as simple and desirable as it appears. However, these preliminary results suggest that Mount Hunter is at the elevation boundary of the dry snow zone and may represent one of the best high-elevation drill sites in the Alaska Range.
Acknowledgements
We thank the US National Science Foundation’s Office of Polar Programs (awards 0713974 to K. Kreutz and 0714004 to C. Wake), the Denali National Park Service, the US Army Cold Regions Research and Engineering Laboratory, the University Navstar Consortium (UNAVCO), the Dan and Betty Churchill Exploration Fund, the University of Maine Graduate Student Government, and Talkeetna Air Taxi, for funding, equipment and logistical support. We thank Ron Lisnet and the University of Maine Department of Public Relations. We appreciate significant field and data-processing help from Mike Waszkiewicz, Eric Kelsey, Ben Gross, Tom Callahan, Max Lurie, Loren Rausch, Austin Johnson, Noah Kreutz, Sharon Sneed and Mike Handley. Lastly, we appreciate input and editing efforts from Peter Koons, Roger Hooke, Bernd Kulessa and two anonymous reviewers.


