


Introduction
Sustainable development requires effective environmental conservation, with protected areas (PAs) as its foundation (Pimm et al. Reference Pimm, Jenkins, Abell, Brooks, Gittleman and Joppa2014, Maxwell et al. Reference Maxwell, Cazalis, Dudley, Hoffmann, Rodrigues and Stolton2020). PAs safeguard biodiversity and provide ecosystem services essential to human well-being (Díaz et al. Reference Díaz, Demissew, Carabias, Joly, Lonsdale and Ash2015, Silva & Topf Reference Silva and Topf2020), yet they face persistent funding shortfalls that undermine their effectiveness (Cumming et al. Reference Cumming, Seidl, Emerton, Spencely, Golden Kroner, Uwineza and van Zyl2021, Silva et al. Reference Silva, Dias, Cunha and Cunha2021, Robson et al. Reference Robson, Trimble, Bauer, Loveridge, Thomson, Western and Lindsey2022, Walls, Reference Walls2022, Lessmann et al. Reference Lessmann, Geldmann, Fajardo and Marquet2024). Coad et al. (Reference Coad, Watson, Geldmann, Burgess, Leverington and Hockings2019) found that only 22.4% of 2167 PAs worldwide reported sufficient staffing and budgets.
Research on PA funding patterns faces two constraints. First, most governmental and non-governmental organizations (NGOs) do not disclose PA investment data, limiting the analysis of funding allocation patterns (Emerton et al. Reference Emerton, Bishop and Thomas2006, Iacona et al. Reference Iacona, Sutherland, Mappin, Adams, Di Marco and Ficetola2018, Devkota et al. Reference Devkota, Miller, Wang and Brooks2023). Second, when data exist, they typically cover short periods, limiting temporal analysis (Medeiros et al. Reference Medeiros, Young, Pavese and Araújo2011, Silva et al. Reference Silva, Castro Dias, Cunha and Cunha2019, Reference Silva, Dias, Cunha and Cunha2021, Lessmann et al. Reference Lessmann, Geldmann, Fajardo and Marquet2024). Because most PAs rely on government funding (Hein et al. Reference Hein, Miller and de Groot2013, Deutz et al. Reference Deutz, Heal, Niu, Swanson, Townshend and Zhu2020, Khmara et al. Reference Khmara, Touchton and Silva2025), their chronic underfunding reflects the political nature of public budgeting, in which PA funds compete with other priorities through microbudgeting processes driven by interest groups (Hallerberg et al. Reference Hallerberg, Scartascini and Stein2009, Rubin Reference Rubin2019, Silva et al. Reference Silva, Dias, Cunha and Cunha2021).
Funding deficits stem from internal (PA characteristics) and external (place characteristics) factors. Among internal factors, evidence shows that funding deficits are negatively associated with age (older PAs have stronger support networks) and positively associated with size (operational demands grow disproportionately with area) and are potentially greater in sustainable-use PAs that attract broader institutional partnerships than in full-protection PAs (Bruner et al. Reference Bruner, Gullison and Balmford2004, Armsworth et al. Reference Armsworth, Jackson, Cho, Clark, Fargione and Iacona2018, Silva et al. Reference Silva, Dias, Cunha and Cunha2021, Lessmann et al. Reference Lessmann, Geldmann, Fajardo and Marquet2024). Among external factors, higher human population density may increase management costs and, consequently, funding deficits (Mammides Reference Mammides2020), while wealthier regions may have stronger environmental constituencies and therefore smaller funding deficits (Jacobsen & Hanley Reference Jacobsen and Hanley2009, Vincent et al. Reference Vincent, Goh, Rozali and bin Ahmad Sah2014).
Three research gaps persist. First, prior studies rely on cross-sectional data, offering no insight into whether deficits are stable, widening or narrowing over time (Silva et al. Reference Silva, Dias, Cunha and Cunha2021, Lessmann et al. Reference Lessmann, Geldmann, Fajardo and Marquet2024). Second, the spatial spillover effect (where socioeconomic conditions around one PA influence funding for neighbouring PAs) has not been examined and, if ignored, may bias coefficient estimates. Third, although global conservation budgets have increased (Seidl et al. Reference Seidl, Mulungu, Arlaud, van den Heuvel and Riva2020, Bosma et al. Reference Bosma, Bitzer, Grijpstra, Meijer, van der Valk, van der Wilk and Verburg2025), the PA numbers and coverage have expanded simultaneously (Jenkins & Joppa Reference Jenkins and Joppa2009, Lewis et al. Reference Lewis, MacSharry, Juffe-Bignoli, Harris, Burrows, Kingston and Burgess2019), potentially widening funding gaps, particularly in countries experiencing recurring fiscal and political crises (Medeiros et al. Reference Medeiros, Young, Pavese and Araújo2011, Abbott & Jones Reference Abbott and Jones2023).
Brazil offers an ideal context for addressing these gaps. First, thanks to federal transparency initiatives (Michener et al. Reference Michener, Contreras and Niskier2018), long-term allocation data are available for a large set of PAs, enabling the longitudinal analysis needed to assess whether funding deficits are stable, widening or narrowing over time. Second, the country has one of the largest PA systems in the world (3.4 million km2), spanning ecological regions that vary widely in conservation challenges, socioeconomic conditions and political contexts (Théry & Mello-Théry Reference Théry and Mello-Théry2014, Lapola et al. Reference Lapola, Silva, Braga, Carpigiani, Ogawa and Torres2020, UNEP-WCMC & IUCN 2024), providing the spatial diversity and scale required to detect spillover effects across neighbouring areas. Third, Brazil continues to expand its PA lands (UNEP-WCMC & IUCN 2024), allowing tests of whether public funds are also increasing to cover the costs of new areas. Finally, Brazil experienced pronounced political and economic turbulence from 2014 to 2023 – including a severe recession, a presidential impeachment and major environmental policy shifts across administrations – which created conditions for examining how funding responds to external shocks.
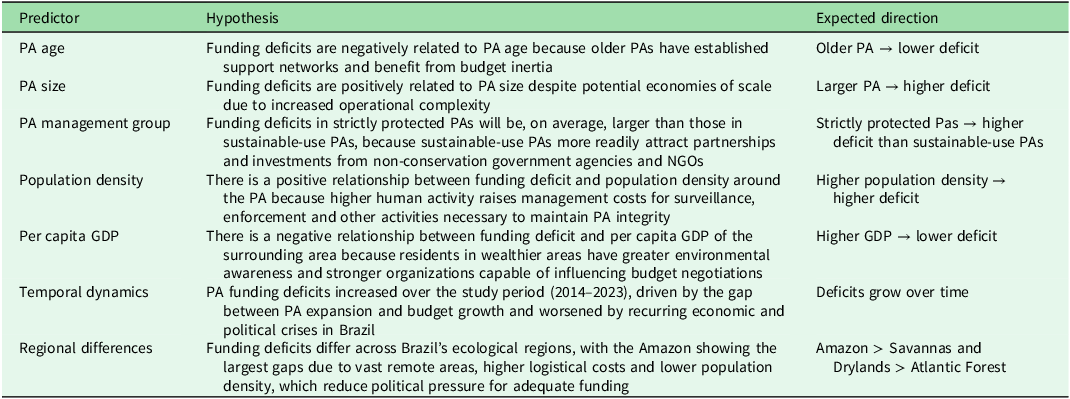
We examine spatial and temporal variations in funding deficits across 300 Brazilian federal PAs from 2014 to 2023 using spatial panel regression models. Our correlational analysis addresses three questions: (1) Which internal PA characteristics and external socioeconomic factors predict funding deficits and do population density and per capita GDP exhibit spatial spillovers? (2) How have deficits varied across Brazil’s three main ecological regions? And (3) how have deficit levels changed from 2014 to 2023, and how did these temporal trends relate to political and economic events? We test seven hypotheses (Table 1): (1) deficits are negatively related to PA age; (2) deficits are positively related to size; (3) strictly protected PAs have larger deficits than sustainable-use PAs; (4) deficits are positively related to population density; (5) deficits are negatively related to per capita GDP; (6) deficits increased over the study period; and (7) deficits differ across ecological regions, with the Amazon showing the largest gaps. This study provides three main contributions: (1) this is the first decade-long empirical assessment of how PA funding deficits evolve over time and respond to macroeconomic and political shocks; (2) we quantify spatial spillover effects that reveal whether regional socioeconomic conditions influence funding beyond individual PA boundaries; and (3) we offer policy-relevant findings for countries aiming to meet international conservation targets amid resource constraints.
Hypotheses tested in this study with expected directions of effect.

NGO = non-governmental organization; PA = protected area.
Methods
Protected areas
In Brazil, PAs can be established at the municipal, state and federal levels and are organized into two main management groups, each with different categories. The first type is the strictly protected group, which includes national parks, biological reserves, ecological stations, wildlife refuges and natural monuments. The second type is sustainable use, which includes national forests, sustainable development reserves, extractive reserves, environmental protection areas, areas of relevant ecological interest and private natural heritage reserves. At the federal level, PAs are managed by the Instituto Chico Mendes de Conservação da Biodiversidade (ICMBio; Chico Mendes Institute for Biodiversity Conservation), which oversees the core of Brazil’s national conservation network.
For this study, we examined the funding deficits of 300 federal terrestrial PAs, covering 749 873 km2. These sites represent 94.7% of ICMBio-managed PAs and 46.2% of Brazil’s terrestrial PA coverage (Fig. 1). We focused on federal PAs because they form the core of Brazil’s national conservation strategy, account for most of the PA coverage and, importantly, are the only part of the system with reliable, multi-year financial data publicly available due to federal transparency requirements.
Distribution of federal protected areas (n = 300) across Brazil’s three main ecological regions: Amazon, Savannas and Drylands and Atlantic Forest.

Funding deficits
Since we focused on evaluating funding adequacy rather than overall budget changes, we measured each PA’s relative funding deficit using Equation 1: ${\rm\small{Relative\;funding\;deficit}} = \;{\small{{{\rm{minimum\;management\;costs\;}} - {\rm{\;actual\;funding}}}}\over{\small{{\rm{minimum\;management\;costs}}}}\; \times 100}$
All cases in which funding equalled or exceeded the minimum cost were set to 0. This created a bounded measure ranging from 0 (adequate funding) to 100 (complete lack of funding), directly addressing our policy-relevant question about conservation funding deficits.
Protected area investments
Annual investments were collected from three sources: salary data were from Brazil’s Portal of Transparency for all personnel assigned to individual PAs or their Integrated Management Centres (IMCs; Núcleos de Gestão Integrada); financial reports from ICMBio covering non-salary expenditures; and Amazon Protected Areas Program (ARPA) reports. IMC-level investments were evenly distributed among the constituent PAs, which is a suitable approach because IMCs provide shared services that, by design, benefit all PAs within their jurisdiction equally. After allocating at the IMC level, the resulting per-PA IMC funding was combined with any funding directly traceable to individual PAs, resulting in comprehensive annual investment totals at the PA level. All financial estimates were adjusted to 2023 Brazilian reais using the Extended National Consumer Price Index (Instituto Brasileiro de Geografia e Estatística, or IBGE) and converted to international dollars using the 2023 Purchasing Power Parity conversion rate (Int$1 = R$2.44).
Minimum management costs
We estimated minimum costs using the method of Silva et al. (Reference Silva, Barbosa, Topf, Vieira and Scarano2022). Staffing requirements were calculated based on five employees per PA (Muanis et al. Reference Muanis, Serrão and Geluda2009), plus three additional employees per 100 km2, based on the median staff density among the 15 most effective tropical parks studied by Bruner et al. (Reference Bruner, Gullison, Rice and da Fonseca2001). The annual employment cost per staff member was R$58 073 (Int$23 800), which was derived from Brazil’s 2023 average monthly salary, including mandatory benefits (Carvalho Reference Carvalho2024). Non-staff costs – including infrastructure, equipment, fuel and operations – were estimated by doubling total staff costs, which was consistent with empirical evidence indicating that staff costs account for c. 50% of total recurrent management costs in Brazilian federal PAs (Dias et al. Reference Dias, Cunha and Silva2016).
Internal and external factors
PA attributes included their management group, age (years since establishment) and size (km2). Brazil’s six biomes were combined into three ecological regions: Amazon, Savannas and Drylands (Caatinga, Cerrado, Pantanal, Pampas) and Atlantic Forest. Each PA was assigned to the region it overlaps with most. Population density and per capita GDP were measured for each PA’s zone of influence – the polygon covering all municipalities intersecting the PA boundary, identified in ArcGIS 10.3 (SIRGAS 2000 projection). Municipal population and GDP data were obtained from IBGE’s SIDRA database; missing values for 2022–2023 (population) and 2022 (GDP) were extrapolated using linear trend functions in Microsoft Excel. The full dataset used in the statistical analyses is provided in Supplementary Data S1.
Statistical analysis
The outcome variable was the PA funding deficit; the predictors were the six factors mentioned earlier: management group, PA age, PA size, ecological region, population density and per capita GDP. Including PA size as a predictor along with size-based minimum costs does not create circular reasoning because the analysis tests whether political budget allocations scale appropriately with evidence-based management needs, which are two independent processes. All continuous predictors were standardised using the z-transformation.
We used a spatial Durbin error model with random effects (SDEM) and specified an inverse-distance weight matrix based on PA centroid coordinates. The SDEM accounts for unobserved spatial correlation in the error term and estimates spatial spillover effects for population density and per capita GDP (Rüttenauer Reference Rüttenauer2022). Inverse-distance weighting is suitable for Brazil’s non-contiguous PA network: contiguity-based matrices generate many zeros, whereas k-nearest-neighbour approaches force connections across unrealistically large distances. Before fitting the model, we confirmed that all variance inflation factor (VIF) values were below 5. The ‘estat impact’ command in Stata 17 (StataCorp 2023) decomposed the effects of population density and per capita GDP into direct (within-unit) and indirect (spillover to neighbours) components. Standard errors were calculated using the delta method. Model fit was evaluated using pseudo-R2 and Wald tests.
We interpreted results using the evidence-based framework of Muff et al. (Reference Muff, Nilsen, O’Hara and Nater2022), with graduated language: very strong evidence (p < 0.001), strong evidence (p = 0.001–0.01), moderate evidence (p = 0.01–0.05), weak evidence (p = 0.05–0.1) and little or no evidence (p > 0.1).
To evaluate robustness to cost assumptions, we varied minimum management costs by ±10%, ±20% and ±30% relative to the baseline, creating seven different cost scenarios. Each scenario was analysed using the same SDEM specification.
Results
Protected area funding trends
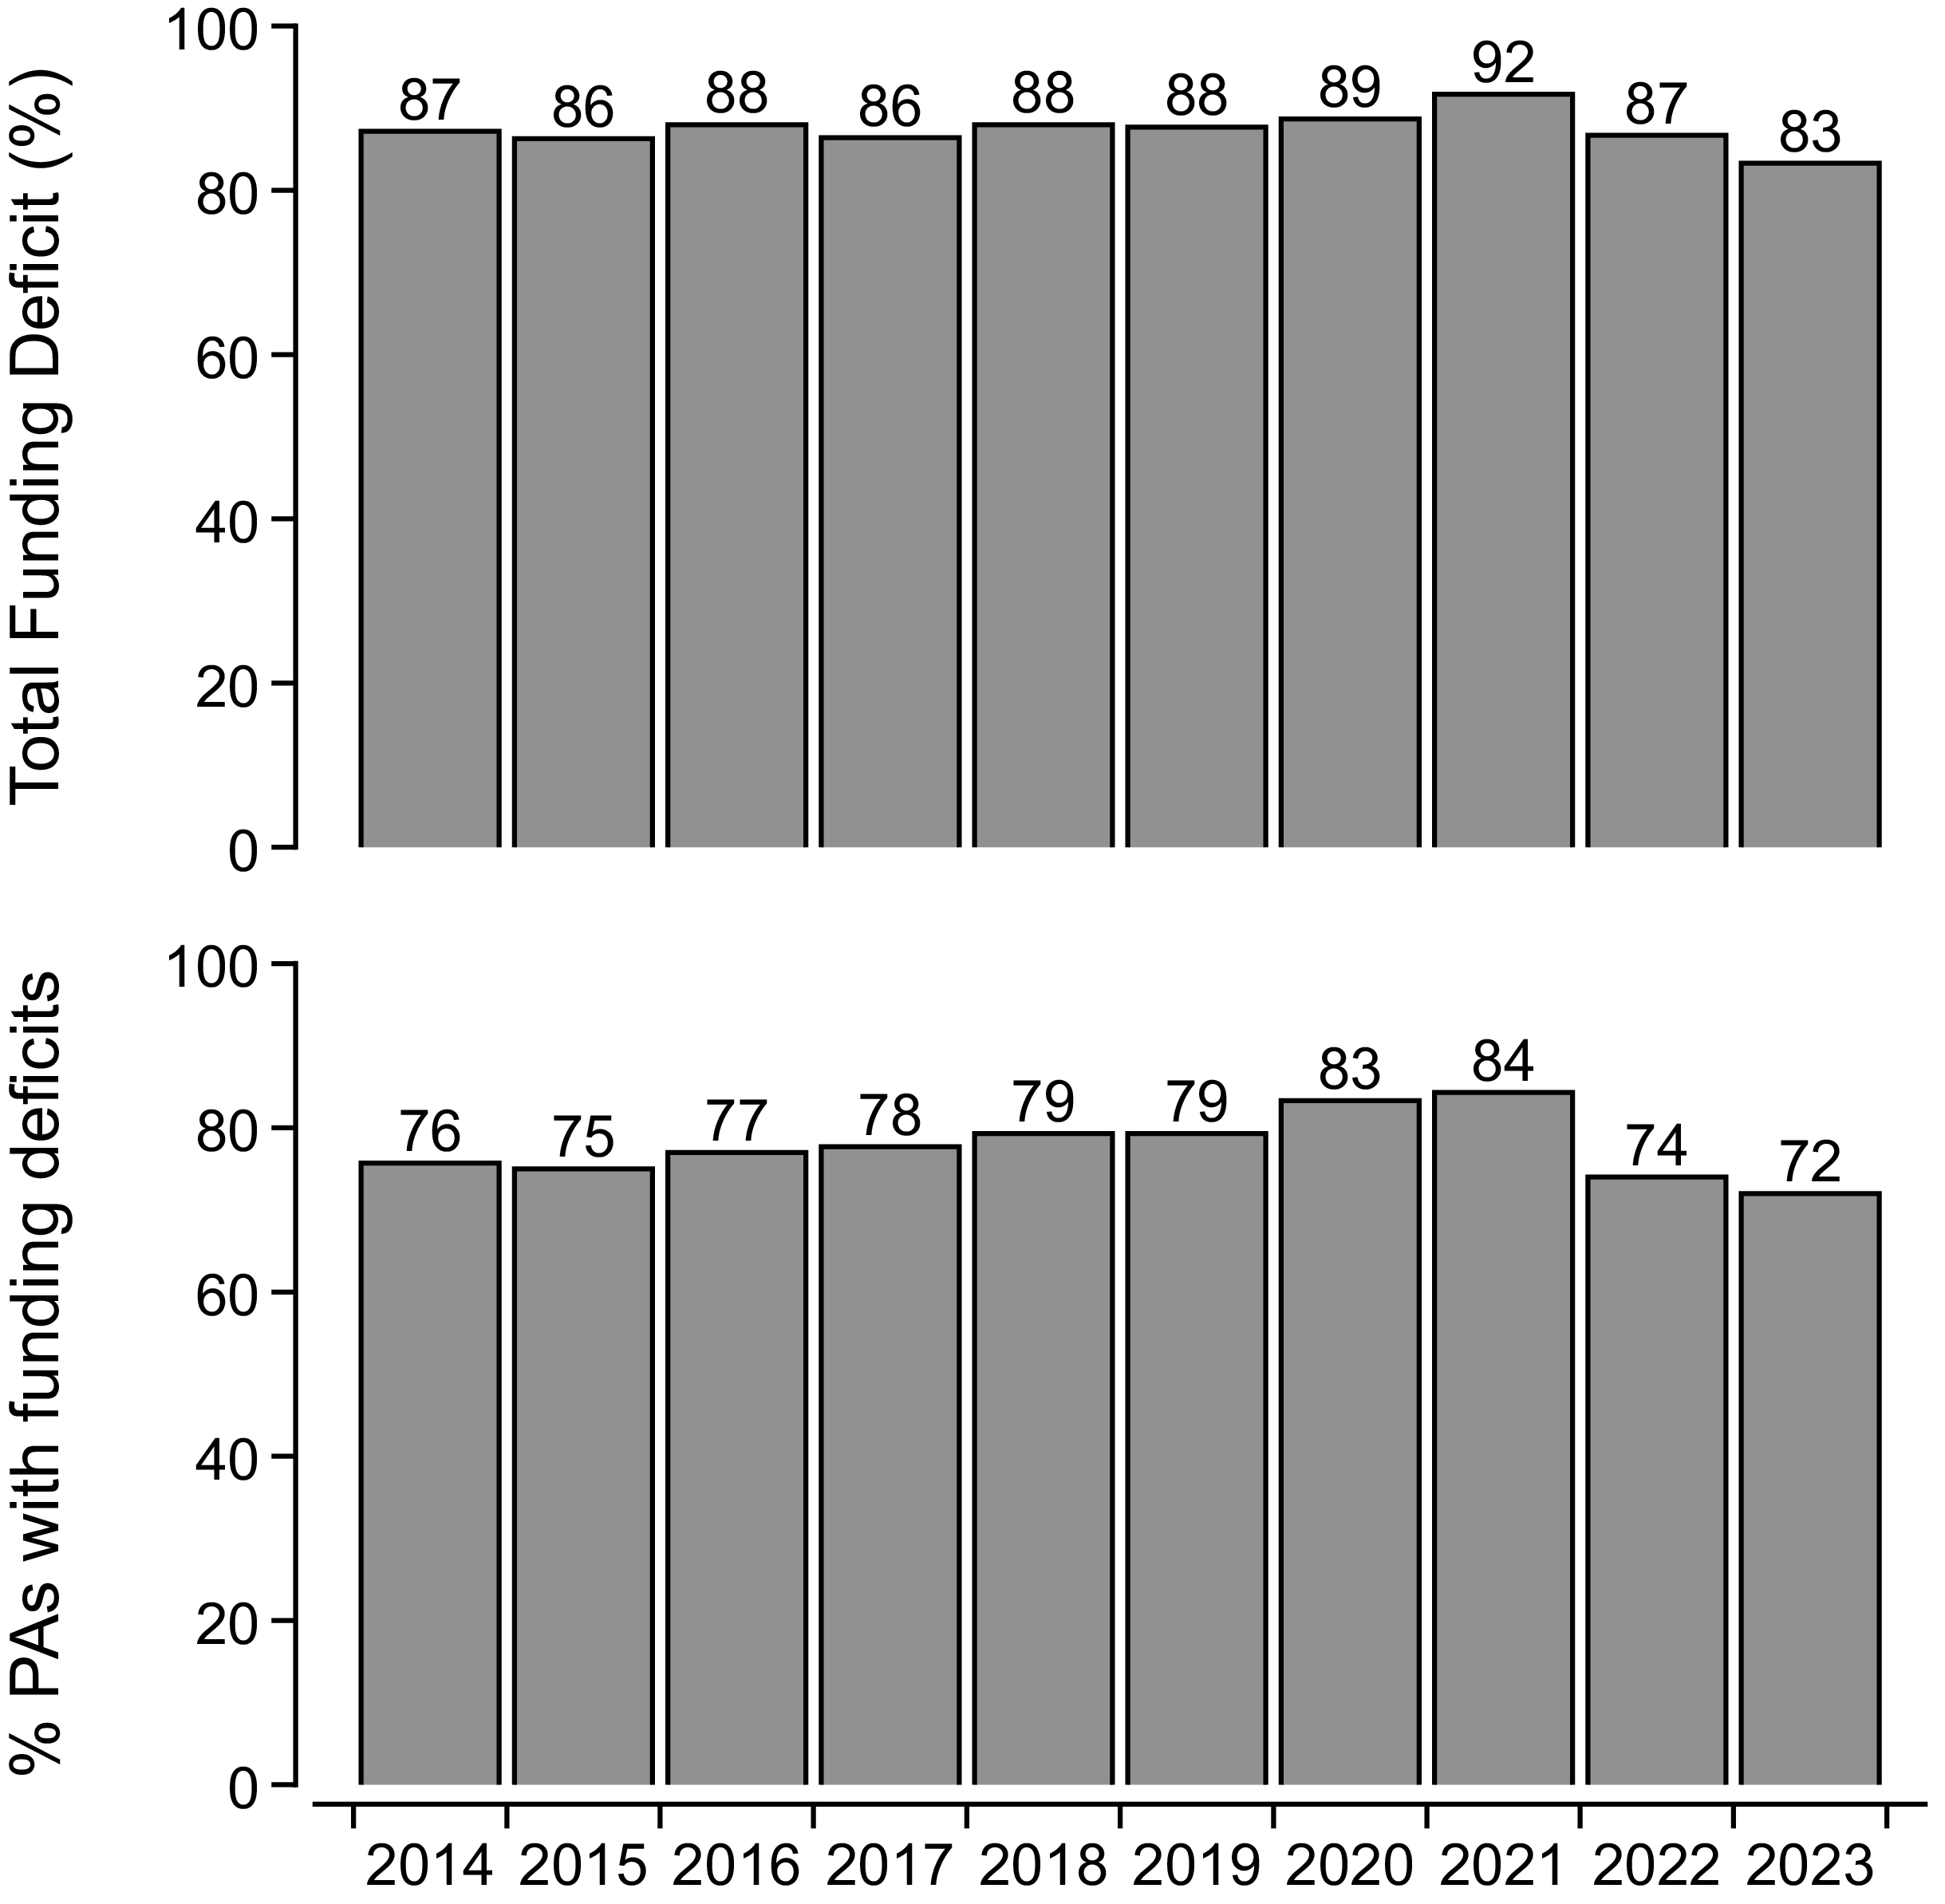
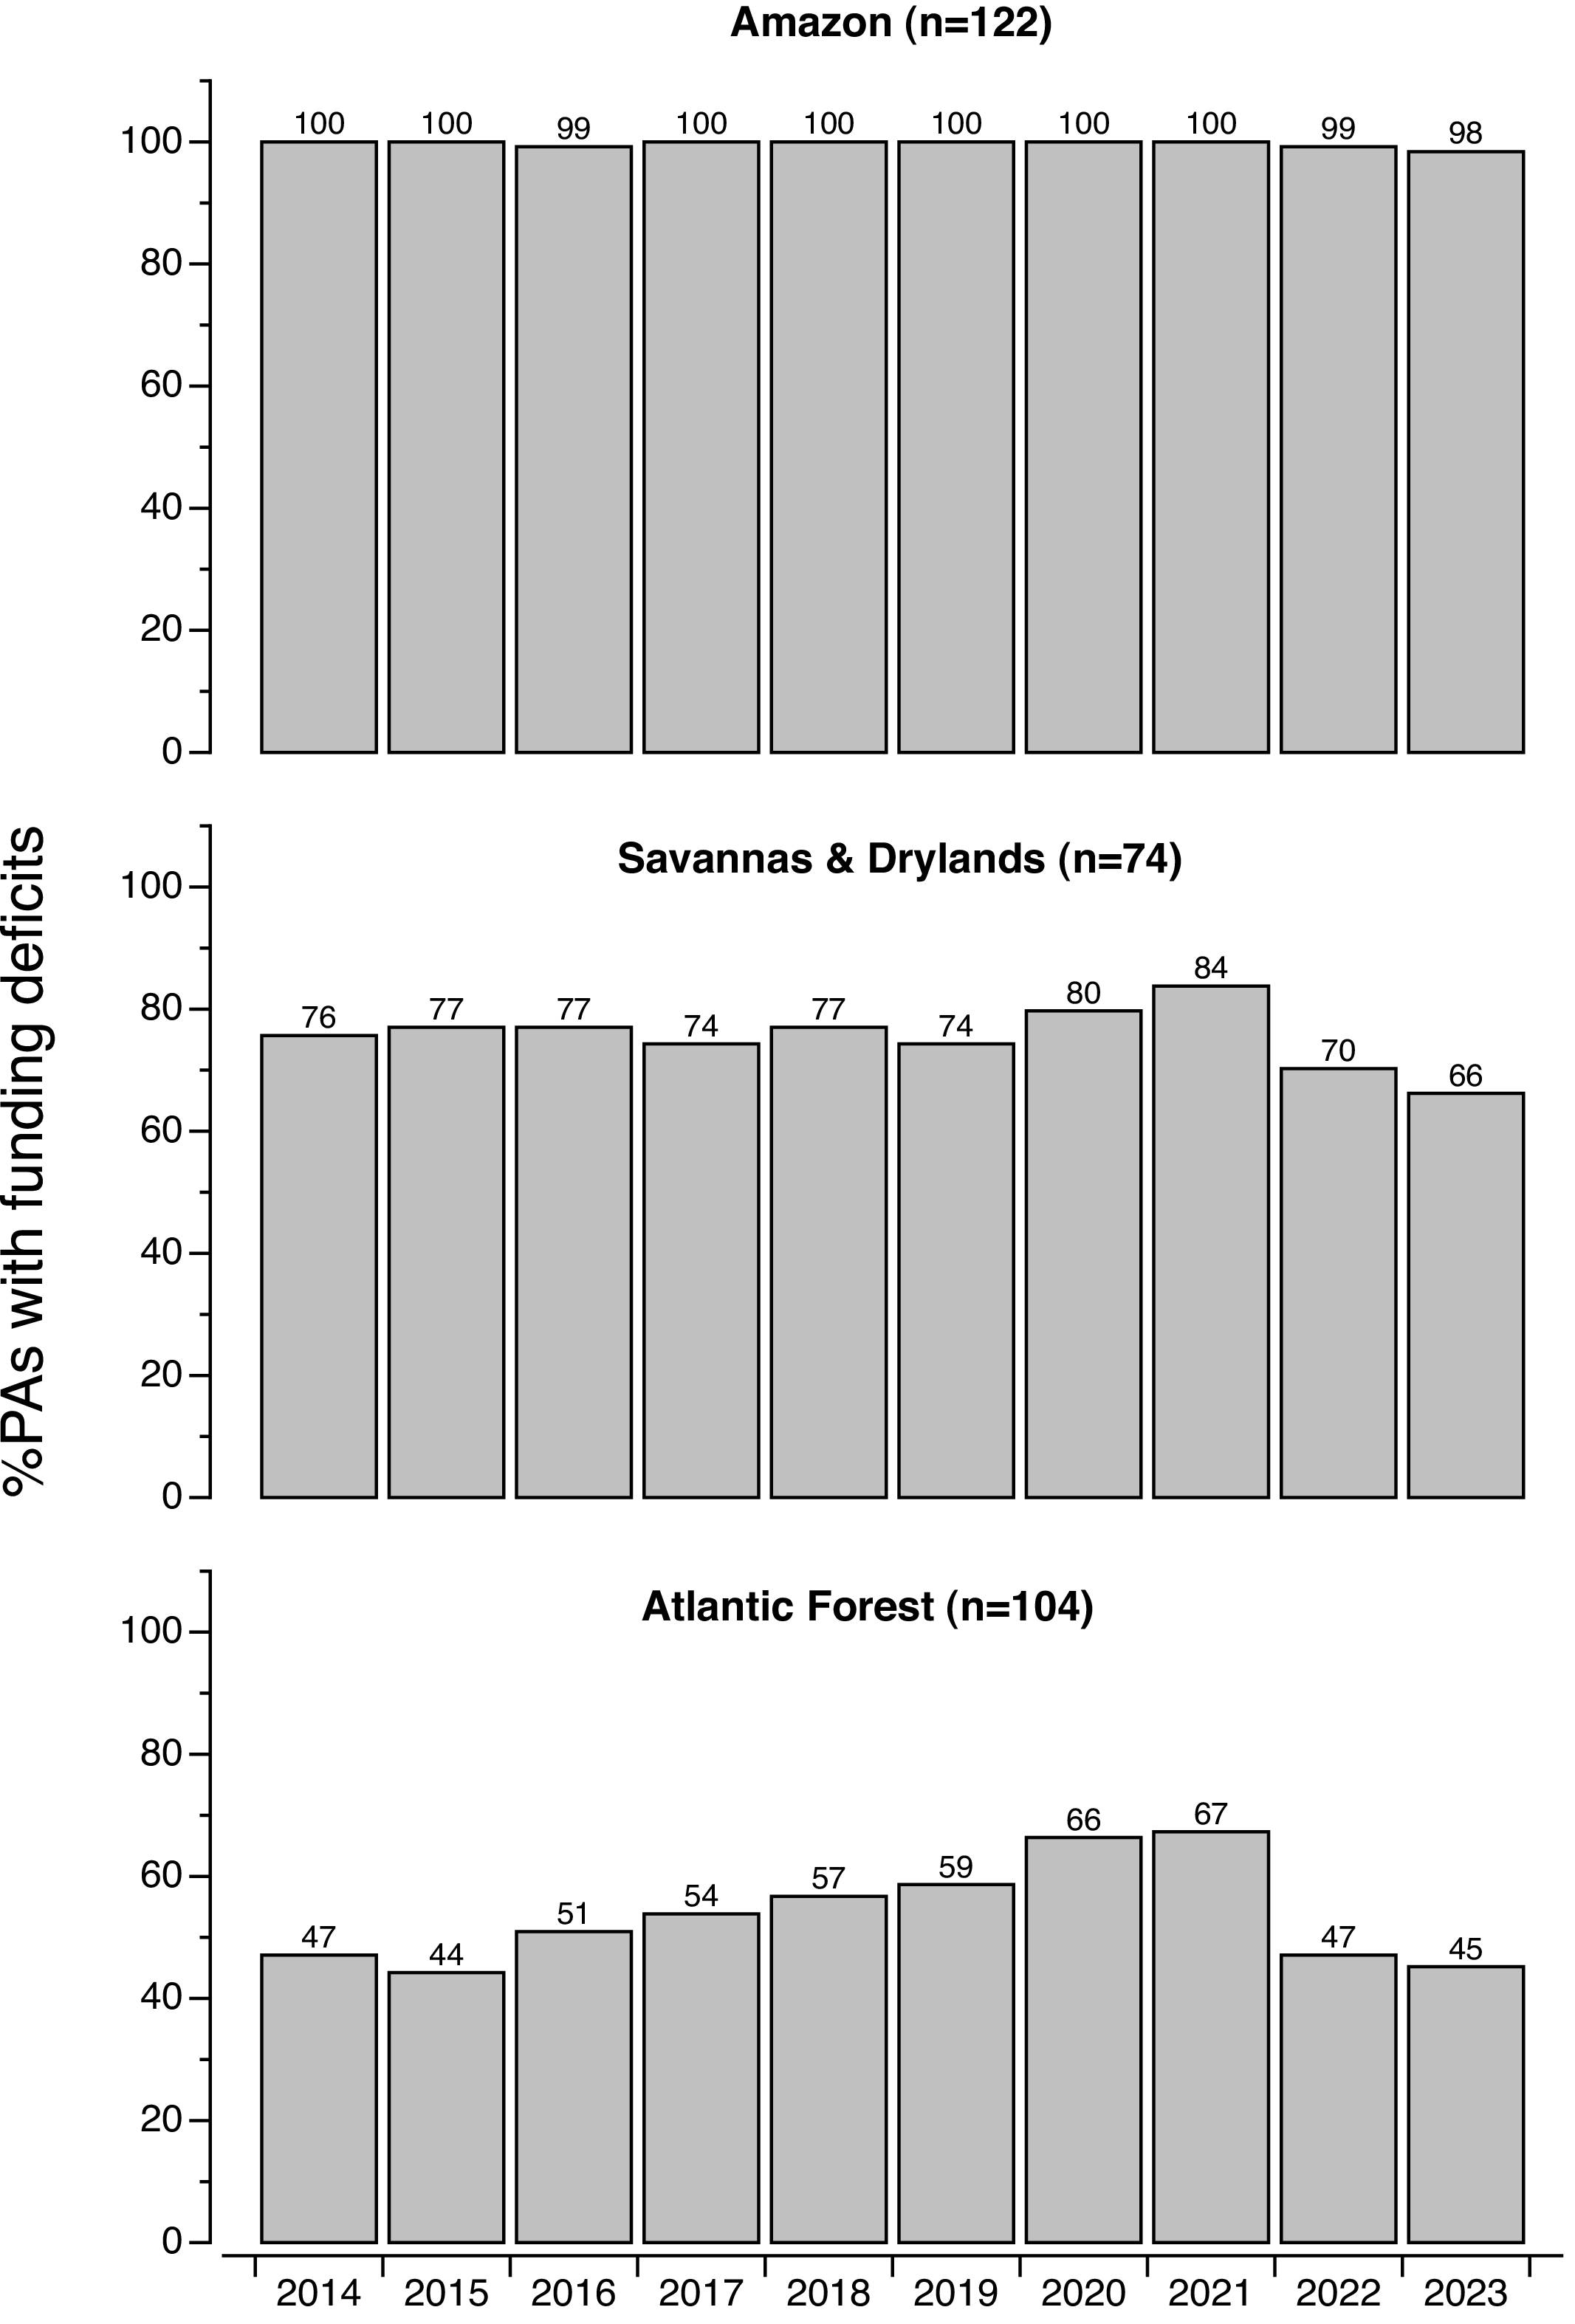
Funding deficits consistently exceeded 83% of the total estimated costs (Int$1.15 billion annually; Fig. 2). Annual investments ranged from 8% (2021) to 17% (2023) of the total estimated cost. Deficits peaked in 2021 and decreased to their lowest level in 2023. Amazon PAs faced significant funding challenges: no Amazon PA met funding requirements in 7 of 10 years, and only 2 of 122 (1.6%) did so in 2023. Atlantic Forest PAs were the most consistently funded, with 35–58 (34–56%) of 104 PAs meeting requirements each year (Fig. 3). Savannas and Drylands held an intermediate position, with 12–25 (16–34%) of 74 PAs meeting requirements. Average funding deficits in 2023 ranged from 79.2% in the Amazon to 45.5% in Savannas and Drylands and 27.6% in the Atlantic Forest (Table S2).
Total funding deficit (in %) and percentage of protected areas (PAs) with funding deficits for Brazilian federal PAs during 2014–2023.

Percentage of federal protected areas (PAs) with funding deficits across three major ecological regions in Brazil between 2014 and 2023.

Spatial model results
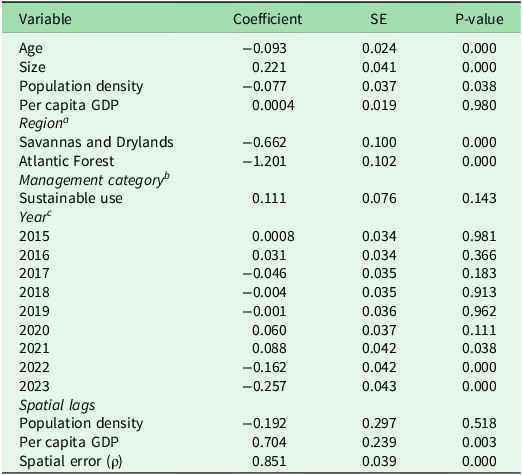
The SDEM explained 48.5% of the variation in funding deficits (Wald χ2 = 517.4, p < 0.001) and showed very strong spatial error autocorrelation (ρ = 0.851, p < 0.001; Table 2). There was very strong evidence that deficits are negatively related to PA age (β = −0.093, p < 0.001) and positively related to PA size (β = 0.221, p < 0.001). There was little evidence of systematic differences between sustainable-use and strictly protected groups (β = 0.111, p = 0.143).
Spatial panel autoregressive model predicting funding deficits in Brazilian federal protected areas (PAs) during 2014−2023. All continuous variables were standardized: age (years), size (km2), population density (inhabitants/km2) and per capita GDP (BRL 1000).

a Compared to Amazon.
b Compared to strictly protected PAs.
c Compared to 2014.
SE = standard error.
Moderate evidence suggested that deficits were negatively associated with population density within the PA zone of influence (β = −0.077, p = 0.038). There was no evidence of a direct effect of local per capita GDP (β = 0.0004, p = 0.980). There was very strong evidence of regional differences: Savannas and Drylands PAs (β = −1.201, p < 0.001) and Atlantic Forest PAs (β = −0.663, p < 0.001) had significantly lower deficits than Amazon PAs. Additionally, pairwise comparisons confirmed that Atlantic Forest PAs had notably lower deficits than Savannas and Drylands PAs (β = −0.538, p < 0.001).
Regarding temporal patterns, there was weak evidence of increased deficits in 2020 (β = 0.060, p = 0.111) and moderate evidence of such in 2021 (β = 0.088, p = 0.038). There was very strong evidence of improved funding adequacy in 2022 (β = −0.162, p < 0.001) and 2023 (β = −0.257, p < 0.001). Our initial hypothesis was not supported in its simple form because deficits did not rise monotonically but instead displayed prolonged stability interrupted by two sharp episodes.
Spatial effects decomposition
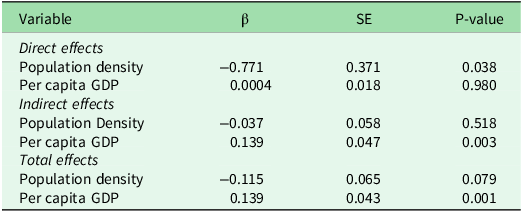
There was no evidence of a direct per capita GDP effect (β = 0.0004, p = 0.980), but there was strong evidence of positive spillovers from neighbouring areas (β = 0.139, p = 0.003), resulting in strong total effects (β = 0.140, p = 0.001; Table 3). Regarding population density, there was moderate evidence of a negative direct effect (β = −0.077, p = 0.038) but no evidence of spillovers (β = −0.038, p = 0.518); total effects were weak (β = −0.115, p = 0.079).
Direct, indirect and total marginal effects of population density and per capita GDP on funding deficits across Brazilian protected areas during 2014−2023. Effects were derived from spatial panel autoregressive models. Variables were standardized: population density (inhabitants/km2) and per capita GDP (BRL 1000).

SE = standard error.
Sensitivity analysis
Core findings remained consistent across all cost scenarios (pseudo-R2 = 0.460–0.503; Wald χ2 = 500.4–533.4, all p < 0.001; ρ = 0.800–0.888, all p < 0.001; Tables S3 & S4). Effects of age and size remained steady (all p < 0.001). Regional patterns were highly stable: the funding deficit hierarchy (Amazon > Savannas and Drylands > Atlantic Forest) was significant across all seven scenarios. The 2022–2023 improvements did not vary across scenarios. Two findings showed sensitivity: the direct effect of population density was significant only at baseline and in higher-cost scenarios, and GDP spillover magnitudes increased with assumed costs (β = 0.481 at −30% to β = 0.978 at +30%).
Discussion
Our decade-long analysis reveals that the chronic underfunding of Brazil’s federal PA system is structural, spatially patterned and influenced by political and economic shocks. Funding gaps have been consistently shaped by PA age, size, ecological region and socioeconomic context, and they have varied in ways aligned with political economy theory. Since this study is correlational, we view these associations as strong patterns that warrant further research to identify the possible processes underlying them.
Protected area age and budget inertia
Older PAs have evidently benefitted from institutional memory, stable administrative routines and support from staff, partners and local communities, all of which may have enhanced their resilience to budget cuts. This has important implications: newer PAs need to build administrative capacity and compete for limited funding without established support networks. Brazil continues to designate new PAs, especially in the Amazon (UNEP-WCMC & IUCN 2024), which constantly adds units that are at a structural disadvantage during budget negotiations. Providing dedicated transition funding for recently created PAs might help to prevent early underfunding from becoming entrenched.
Protected area size and operational complexity
The positive relationship between PA size and deficits aligns with prior work in Brazil and Latin America (Bruner et al. Reference Bruner, Gullison and Balmford2004, Silva et al. Reference Silva, Dias, Cunha and Cunha2021, Lessmann et al. Reference Lessmann, Geldmann, Fajardo and Marquet2024). Larger PAs require significant infrastructure and personnel across vast territories, complex logistics for patrol and enforcement and diverse management expertise across multiple ecosystems. These operational demands increase disproportionately with area, yet current budget allocation mechanisms do not seem to account for this scaling. This is especially important for Amazonian PAs, which are by far the largest in the federal system and have the least infrastructure and the weakest local economic base (Table S2). Adjusting budget formulae to include explicit size-scaling, similar to how road maintenance budgets are scaled by network length, could help to address this structural inequity.
Management group differences
The lack of a significant difference between strictly protected and sustainable-use PAs suggests that management designation alone does not determine funding adequacy, possibly because both groups share similar baseline operational requirements (patrol, monitoring, administration and boundary maintenance). However, revenues from sustainable use activities (timber concessions, ecotourism, extractive activities) may not flow entirely through the ICMBio budget; therefore, they are not captured in this analysis. Future research that integrates off-budget revenue streams would better assess whether sustainable-use PAs achieve greater overall financial self-sufficiency.
Population density, urban proximity and conservation funding are interconnected
Our study shows that higher population density and proximity to urban areas are linked to increased conservation funding. The inverse relationship between population density and funding gaps suggests that being near an urban centre offers financial benefits. PAs close to population hubs enjoy shorter distances to decision-making centres, better infrastructure and easier recruitment of staff. Being near larger constituencies also enhances media visibility and civil society involvement, creating political pressure for continued investment (Kauano et al. Reference Kauano, Silva and Michalski2017). These factors may create a self-reinforcing cycle of institutional support, especially in southern and south-eastern Brazil, where dense populations, high regional GDP and active environmental advocacy often overlap. Importantly, this dynamic is not driven only by wealth; social and political proximity to conservation decision-makers can be just as crucial as economic resources for determining funding levels for PAs.
Economic activity and spatial spillovers
The absence of a direct local GDP effect combined with positive spillovers from neighbouring wealthy regions indicates that regional economic activity influences PA funding through spatial networks rather than local mechanisms. Well-organized environmental movements in major urban centres may effectively advocate for investment in PAs in nearby areas. These advocacy efforts extend beyond individual administrative units. The spillover pattern also aligns with cross-national evidence that public demand for conservation grows with economic development (Vincent et al. Reference Vincent, Goh, Rozali and bin Ahmad Sah2014), a relationship that also functions at subnational levels. Importantly, the lack of a local GDP effect means conservation funding for Brazil’s most economically marginalized regions, especially the Amazon, cannot depend on local economic growth as a driver. This underscores the importance of centralized federal funding commitments insulated from local economic conditions.
Temporal trends and budgetary fluctuations
Instead of a steady rise in deficits, we observed long periods of relative stability interrupted by two periods of sharp change, aligning with punctuated equilibrium theory (Baumgartner et al. Reference Baumgartner, Jones, Mortensen and CM2023). Deficits remained stable from 2015 to 2019, despite a severe recession (2015–2016) and a presidential impeachment (2016), indicating institutional resilience in ICMBio budget allocations. The first disruption (2020–2021) was driven by COVID-19 fiscal contractions (Cumming et al. Reference Cumming, Seidl, Emerton, Spencely, Golden Kroner, Uwineza and van Zyl2021) and the systematic dismantling of environmental policy infrastructure (Barbosa et al. Reference Barbosa, Alves and Grelle2021, Milhorance Reference Milhorance2022). These two factors should be distinguished: the pandemic caused a general fiscal shock, while anti-environmental policy changes specifically targeted ICMBio and related programmes. The second disruption (2022–2023) reflected significant improvements in funding. Budget recovery began in 2022 (still during the Bolsonaro administration, suggesting pandemic-related fiscal recovery played a role) and was amplified by the incoming Lula administration’s pro-environmental policy shift in January 2023. The timing across administrations highlights that funding trends are shaped by multi-year budget cycles, macroeconomic conditions and political transitions, and that single-year improvements cannot be attributed solely to political change.
Regional inequalities
The hierarchy of regional deficit funding (Amazon > Savannas and Drylands > Atlantic Forest) remained stable across all sensitivity scenarios and reflects fundamental structural differences in socioeconomic context, institutional capacity and political visibility. Atlantic Forest PAs are in Brazil’s most economically vibrant and densely populated region, are more accessible and receive greater attention from civil society and the media (Silva et al. Reference Silva, Pinto, Hirota, Bedê, Tabarelli, Cabral and Bustamante2016). Conversely, Amazon PAs are some of the largest in the world, highly remote, severely understaffed and surrounded by municipalities with limited economic activity and institutional capacity. Our finding that Amazon deficits averaged 79.2% in 2023, with 120 of 122 PAs falling below minimum cost thresholds, indicates almost complete resource shortfalls relative to evidence-based needs. Any national effort to close Brazil’s conservation funding gap must prioritize Amazonian PA funding. Current initiatives, such as ARPA and Fundo Amazônia, are valuable but not enough to address regional inequalities.
Limitations
Although this study advances our understanding of the patterns and determinants of PA funding deficits in Brazil, several limitations point to promising directions for future research. First, the analysis focuses only on recurring management costs, excluding establishment costs such as boundary demarcation and infrastructure development; future studies including these expenses would offer a more comprehensive view of minimum funding needs. Second, international funding directly managed through NGO conservation programmes is outside the scope of our data, a gap that is increasingly relevant as major donor governments reduce international conservation aid (Bosma et al. Reference Bosma, Bitzer, Grijpstra, Meijer, van der Valk, van der Wilk and Verburg2025). Third, the lack of explicit governance and political variables is a known constraint, as these factors are consistently identified as key determinants of budget outcomes (Miller et al. Reference Miller, Agrawal and Roberts2013, Pailler Reference Pailler2018, Mangonnet et al. Reference Mangonnet, Kopecky and Urpelainen2022, Lessmann et al. Reference Lessmann, Geldmann, Fajardo and Marquet2024). The strong residual spatial autocorrelation observed suggests that unmeasured geographical and political dynamics play an important role, and explicitly incorporating these factors would be a valuable direction for future research. Fourth, the study is limited to federal PAs because data for state, municipal and private reserves are currently unavailable; as transparency initiatives expand, broader comparative analyses will become possible. Finally, while spatial spillovers in per capita GDP were evident, the model treated spatial structure mainly as a control; future research with more detailed spatial units could uncover deeper mechanistic insights into how regional economic and political conditions influence conservation funding across PA networks.
Towards a national protected area financing information system
This study was possible only because of Brazil’s federal transparency legislation (Michener et al. Reference Michener, Contreras and Niskier2018), a reminder that nearly two decades after Emerton et al. (Reference Emerton, Bishop and Thomas2006) identified an open global PA financing information system as a critical priority, no such system exists. As the world’s 11th-largest economy, and with export competitiveness increasingly linked to environmental stewardship, Brazil has both the institutional capacity and the strategic incentive to lead in this area. We propose creating a comprehensive, open-access national PA financing platform that tracks public and private investments across all PA categories and governance levels. Besides enabling multi-year, cross-sector analyses to assess whether Brazil’s conservation system is headed towards financial sustainability, such a platform would also strengthen the evidence base for budget negotiations and international reporting under the Convention on Biological Diversity.
Conclusions
The chronic underfunding of Brazil’s federal PA system is structural, spatially patterned and responds to political and economic shocks. A stark regional hierarchy puts Amazonian PAs at a significant, ecologically important disadvantage that the current budget system alone cannot fix. The surprising finding that urban proximity is linked to lower, not higher, funding deficits challenges common ideas about human pressure and conservation funding, highlighting the potential of urban environmental activism and local conservation groups as forces for change. Addressing these issues requires building institutional capacity in remote and newly established PAs, increasing financial transparency across all levels of governance and including political and governance factors in future studies. Above all, it calls for a fundamental shift: Brazil’s PA system should not be seen as a fiscal burden but rather as a strategic national infrastructure that supports biodiversity, climate resilience and long-term economic growth. It deserves the multi-year, stable funding commitments that strategic assets require (Silva & Wheeler Reference Silva and Wheeler2017).
Acknowledgements
We thank Kym Keive Machado dos Santos (NTI and LFTHSAM/UNIFAP) for developing tools to explore the salary database on the Transparency Portal, and Cinobelino Lemos de Andrade, Felipe Gustavo Sousa Silva Oliveira and Gustavo Costa Rodrigues (ICMBio) for providing detailed financial reports.
Supplementary material
To view supplementary material for this article, please visit https://doi.org/10.1017/S037689292610040X.
Financial support
JMCdS is supported by the University of Miami and the Mycorrhizal Fund. ACdC is supported by the Conselho Nacional de Pesquisas Científicas e Tecnológicas (CNPq) under Project PQ No. 308302/2025-7.
Competing interests
The authors declare none.
Ethical standards
Not applicable.


 Open access