

1. INTRODUCTION
There are more than 5000 glacial lakes (larger than 0.003 km2) in the Third Pole (a colloquial name given to the glaciated region of the Tibetan Plateau (TP) and surroundings), with the majority of these located in the Himalaya (Zhang and others, Reference Zhang, Yao, Xie, Wang and Yang2015; Nie and others, Reference Nie2017). The glacial-lake area expanded by ~14% between 1990 and 2015 in the whole Himalaya (Nie and others, Reference Nie2017). Within the Himalaya located in Chinese territory, glacial-lake area increased by ~30% between the 1970s and the 2000s (Wang and others, Reference Wang2012a). These increases were due to the formation and development of glacial lakes, especially proglacial lakes, emerging and expanding as glaciers retreated (Benn and others, Reference Benn2012; Zhang and others, Reference Zhang, Yao, Xie, Wang and Yang2015; Nie and others, Reference Nie2017).
As climate changes, glacier-related hazards are likely to increase, although incomplete records and lag-times in glacier–lake interactions mean that no clear trend in response to anthropogenic warming is evident (Harrison and others, Reference Harrison2018). The sudden release of water from lakes impounded by moraines or ice dams can result in glacial lake outburst floods (GLOFs), while more rarely, impact waves from large mass movement can cause overtopping from bedrock dammed lakes. GLOFs are closely linked with glacier retreat in terms of the expansion of existing lakes and triggering of lake outbursts (Emmer, Reference Emmer and Cutter2017). The Himalayas are one of the mountain regions of the world where GLOFs occur most frequently (Carrivick and Tweed, Reference Carrivick and Tweed2016). A GLOF risk assessment has been coordinated for the entire Hindu-Kush-Himalayan region (Ives and others, Reference Ives, Shrestha and Mool2010), while national-scale assessments of critical glacial lakes have been conducted for the Indian Himalaya (Worni and others, Reference Worni, Huggel and Stoffel2013), the Nepal Himalaya (Rounce and others, Reference Rounce, Watson and McKinney2017) and the Chinese Himalaya (Wang and others, Reference Wang2012b, Reference Wang and Jiao2015). Moraine-dammed lakes are more common in the central and eastern Himalayas, while ice-dammed lakes predominate in the western regions (Richardson and Reynolds, Reference Richardson and Reynolds2000). The failure of moraine-dammed lakes in particular can produce devastating GLOFs, owing to their tendency to mobilise large amounts of debris (e.g. Allen and others, Reference Allen, Rastner, Arora, Huggel and Stoffel2015). Many GLOFs have been reported in the Himalaya, including 14 in Nepal, 30 in Tibet and 21 in Bhutan (ICIMOD, 2011; Komori and others, Reference Komori, Koike, Yamanokuchi and Tshering2012; Liu and others, Reference Liu, Cheng and Li2013; Khanal and others, Reference Khanal, Hu and Mool2015). Ten previously unreported GLOFs were detected recently using the full seasonal archive of Landsat images (Veh and others, Reference Veh, Korup, Roessner and Walz2018). GLOFs are considered the most serious glacial-related hazard, threatening ecosystems, livelihoods and infrastructure in the Himalaya, with well-documented historical disasters dating back to 1935 (Nie and others, Reference Nie2018). Approximately 80% of GLOFs in the Himalaya were initiated by displacement waves from ice avalanches (Awal and others, Reference Awal2010).
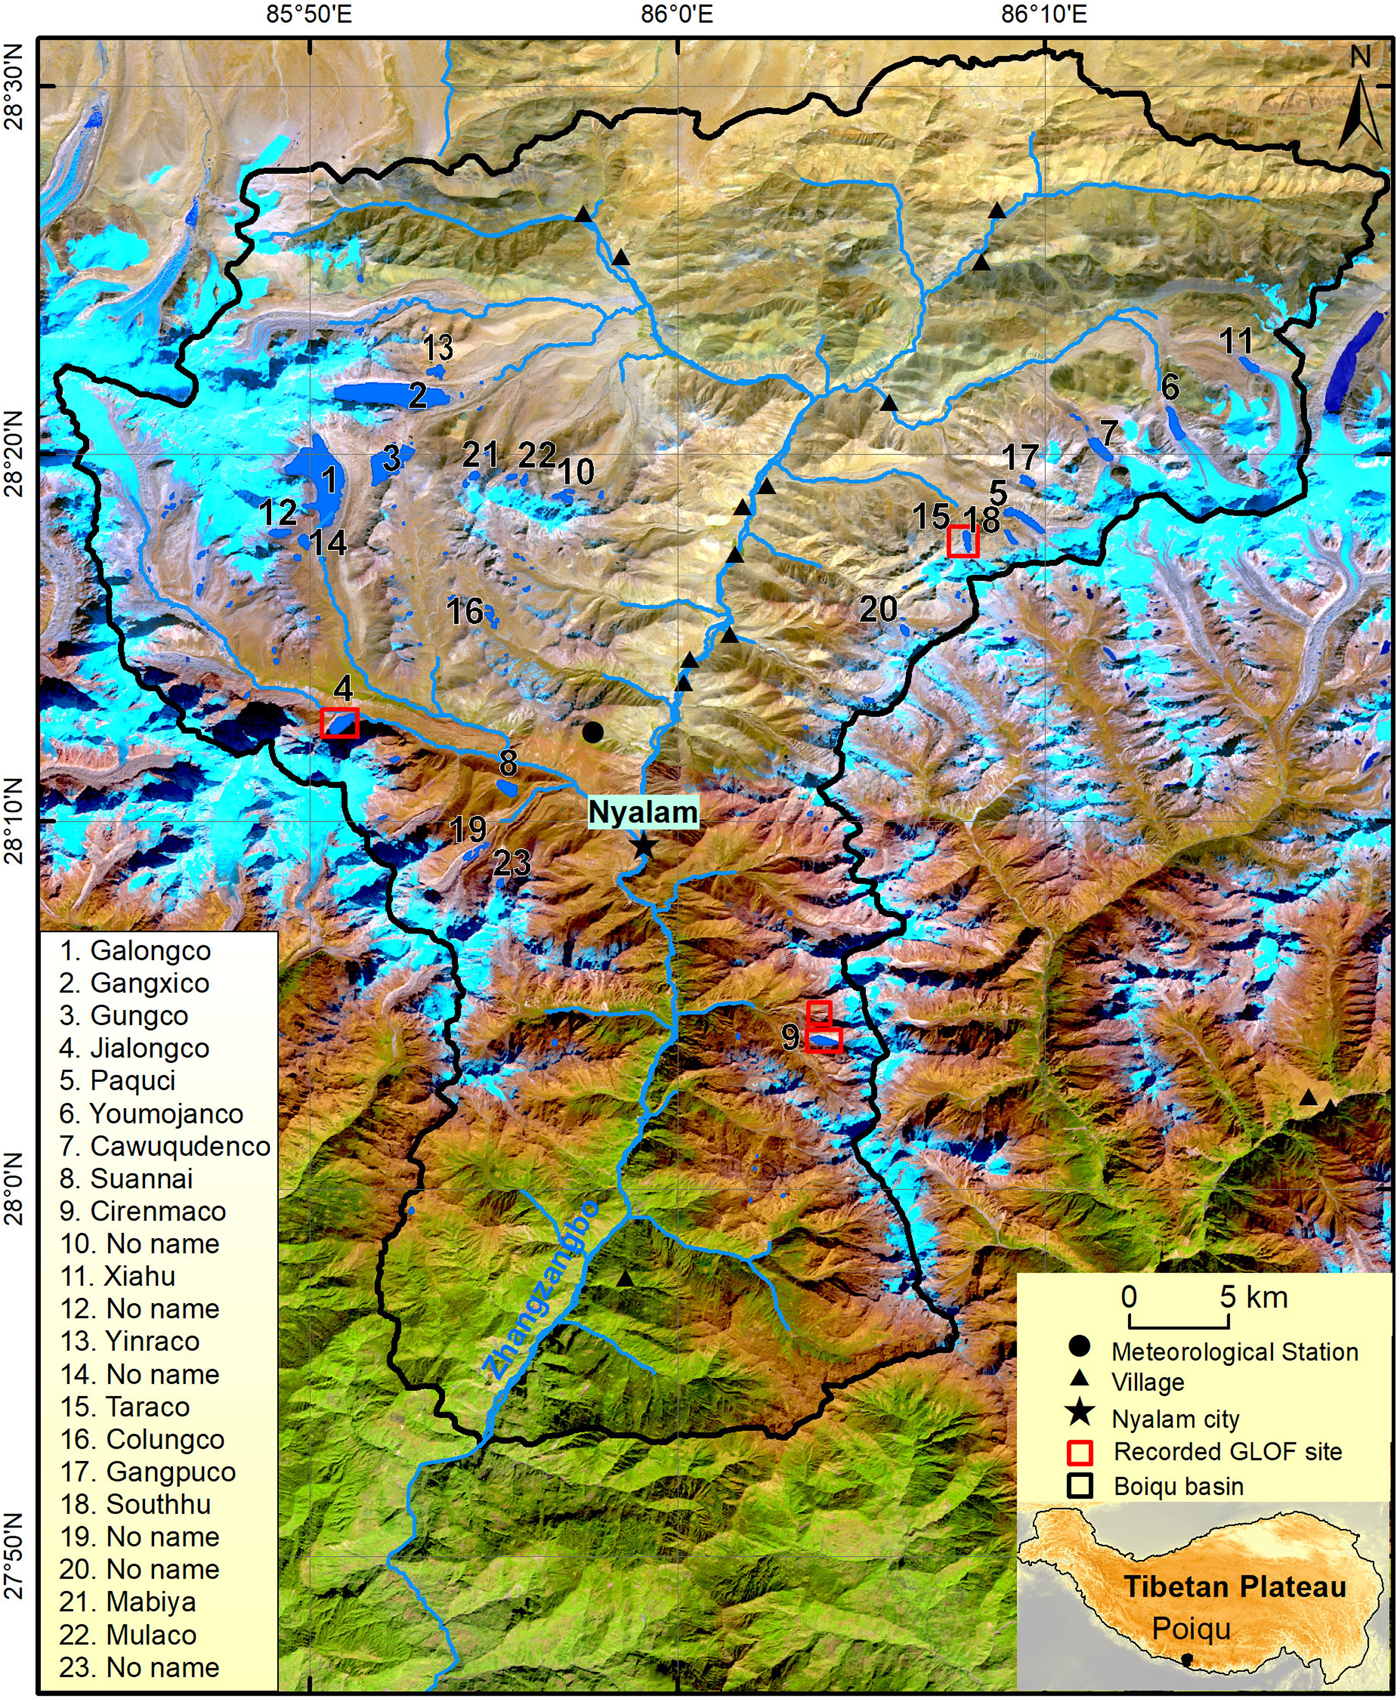
Lake mapping based on Landsat images revealed 329 moraine-dammed lakes (⩾0.02 km2) in the Chinese Himalaya with ~100 of them identified as potentially dangerous glacial lakes (PDGLs) (Wang and others, Reference Wang2012b, Reference Wang and Jiao2015). Several of these lakes are located in the Poiqu River Basin. This basin is a transboundary basin located in the central Himalaya. It originates in Tibet and flows into Nepal (Fig. 1). Previous studies identified the high level of risk in this basin, as the potential for GLOF hazards is high and any outburst could severely affect livelihoods and infrastructure (Khanal and others, Reference Khanal, Hu and Mool2015; Wang and others, Reference Wang and Jiao2015). This basin also has the highest ratio of glacier area to lake area in the Hindu-Kush-Karakoram-Himalaya (HKH) regions (Wang and others, Reference Wang and Zhang2014).
Glacier and lake distribution in the Poiqu River basin, central Himalaya. The IDs and names of 23 lakes (≥0.1 km2) in 2017 are indicated. The inset indicates the location of the Poiqu River basin in the TP. The four recorded GLOF sites are also shown, corresponding to data given in Table 2.
The specific objectives of our study are therefore: (1) to examine the detailed evolution of glacial lakes since 1964 in the Poiqu River basin; (2) to investigate glacier–lake interactions, that is glacier area, surface velocity and surface lowering and their relationship to glacial-lake changes, and (3) to simulate possible future lake development with an emphasis on lakes that are considered as being potentially dangerous.
2. PREVIOUS STUDIES IN THE POIQU RIVER BASIN
2.1 Glacier area shrinkage
Glacier area in the Koshi River basin (which includes the Poiqu River basin) has decreased by ~19% in the past four decades (Table 1) (Shangguan and others, Reference Shangguan2014; Xiang and others, Reference Xiang2018). Reported shrinkage rates for Poiqu basin based on Landsat observations vary between ~1.3% a−1 for the period 1986–2001 (Chen and others, Reference Chen, Cui, Li, Yang and Qi2007b) and ~0.54% a−1 for 1975–2010, with an accelerating rate after 2000 (Xiang and others, Reference Xiang, Gao and Yao2014). Although the retreat of glaciers allows proglacial lakes to develop and expand, glacial lake evolution in the Himalaya can be better explained by considering glacier mass balance (Gardelle and others, Reference Gardelle, Arnaud and Berthier2011; King and others, Reference King, Quincey, Carrivick and Rowan2017).
Overview of previous basin-scale glacial lake and glacier studies covering the Poiqu River basin, central Himalaya. The studies are sorted by year of publication

2.2 Glacial-lake area expansion
The total area of glacial lakes in the Koshi River basin increased by ~10% (0.7 km2 a−1) between 2000 and 2009 (Wang and Zhang, Reference Wang and Zhang2014). The total area of glacial lakes (with area ⩾0.02 km2) in the Poiqu River basin increased by ~47% (0.37 km2 a−1) in the period 1986–2001 (Chen and others, Reference Chen, Cui, Li, Yang and Qi2007b), corresponding to retreat of the parent glaciers. Between 1976 and 2010, Landsat imagery revealed that glacial lakes had an area increase of ~83% (0.26 km2 a−1), with a larger rate of 0.26 km2 a−1 for glacier-fed lakes compared with 0.003 km2 a−1 for nonglacier-fed lakes (Wang and others, Reference Wang and Zhang2014). A comparison of topographic maps from 1974 and Landsat imagery for 2014 reveals that Galongco and Gangxico lakes expanded by ~500% (0.45 km2 a−1) and ~107% (0.34 km2 a−1) respectively over this period. This expansion corresponds to an area shrinkage of their parent glaciers of Jipucong and Reqiang of ~40% (~0.07 km2 a−1) (Wang and Jiao, Reference Wang and Jiao2015). Seven lakes, including Galonco, Gangxico, Youmojianco and Cirenmaco in the basin have previously been identified as PDGLs based on high rates of expansion and a semiquantitative method considering other factors relevant for lake stability (Chen and others, Reference Chen, Cui, Yang and Qi2007a; Wang and others, Reference Wang and Zhang2014).
2.3 GLOF hazards
Historical records for moraine-dammed lake outbursts in the Poiqu River basin show that six GLOFs from four different glacial lakes have occurred since 1935 (Table 2 and Fig. 1). The Taraco outburst occurred in 1935 because of seepage and dam collapse (Chen and others, Reference Chen, Cui, Li, Yang and Qi2007b). The flood destroyed 66 000 m2 of wheat fields and killed several yaks. It was followed by a small outburst at Cirenmaco in 1964. On 11 July 1981, Cirenmaco burst again, due to the collapse of the hanging glacier. This event caused ~200 deaths in Nepal and over $3 million worth of damages (Xu, Reference Xu1988) including the destruction of the Sino-Nepal Friendship Bridge and the Sun-Kosi hydropower station. The immense destruction from this GLOF drew broad attention to Cirenmaco. Recent geomorphic field investigations indicate that Cirenmaco is prone to further GLOFs caused by ice/snow avalanches and the melting of dead ice in the moraine (Wang and others, Reference Wang2018). Two large-scale debris-flows in 2002 damaged the Sino-Nepal Highway, a hydropower station, communication facilities as well as pasture land, with total damages estimated at ~1.1 million USD (Chen and others, Reference Chen, Cui, Yang and Qi2006). The debris flow probably originated from a GLOF from Jialongco which was triggered by an ice avalanche and subsequent moraine dam failure (Chen and others, Reference Chen, Cui, Yang and Qi2006). Gongbatongsha Tsho was drained by an outburst in 5 July 2016 (Nie and others, Reference Nie2018), resulting in significant fluvial erosion in the downstream valley (Cook and others, Reference Cook, Andermann, Gimbert, Adhikari and Hovius2018). The main cause of all these outbursts was ice avalanches into moraine-dammed proglacial lakes, consistent with observations from the broader Himalayan region (Richardson and Reynolds, Reference Richardson and Reynolds2000).
Historical GLOF events in the Poiqu River basin, central Himalaya
3. DATA AND METHODOLOGY
In this study, we mapped glacial lakes in 1964, 1974 and from 1988 to 2017 using Corona KH-4A declassified spy imagery (spatial resolution ~2.7 m), Hexagon KH-9 (6–9 m) and multiple Landsat TM/OLI images (30 m), respectively (Table 3 and Table S1). In addition, we mapped glacier outlines in 2015 and glacier ice-front positions between 1964 and 2017 using Landsat data. Multiple Landsat images acquired at the end of the melt season (September/October) were selected to decrease the obscuration of glacier boundaries from snow cover. Glacier surface velocity was calculated using repeat Landsat OLI imagery (15-m Pan) from 2013 to 2017. Glacier surface elevation change was calculated using Digital Terrain Models (DTMs) generated from 1974 KH-9 stereo images, 2014 and 2017 TanDEM-X CoSSC data and the 2000 SRTM1 DTM.
Data used for lake and glacier area mapping, glacier surface velocity and elevation change. A detailed list of Landsat images used for delineation of glacial lake and glacier outlines is provided in Table S1
The Corona KH-4A mission carried two panoramic cameras and provided high-resolution ground samples for the period 1963–1969 (Dashora and others, Reference Dashora, Lohani and Malik2007), enabling us to start the inventory of small glacial lakes in the mid-1960s. The ground swath was 19.7 × 267 km. Two films acquired on 26 November 1964 covering the study area were downloaded from https://earthexplorer.usgs.gov/ (Fig. S1). Cloud cover in two images for the southern part of the Poiqu watershed is high, but the lakes are mainly distributed in the northern part of basin, such that this did not hinder the observations of lakes. Moreover, some glacial lakes were frozen in November when the images were acquired (Table 3). The boundaries of lake water are, however, still distinguishable from land owing to the high-resolution image and visible differences in the imaging characteristics of lake and land (Fig. S3). Image distortion is a serious problem away from the centre of the image (Slama, Reference Slama1980; Lamsal and others, Reference Lamsal, Sawagaki and Watanabe2011; Goerlich and others, Reference Goerlich, Bolch, Mukherjee and Pieczonka2017). To correct for this, 194 ground control points were selected from Google Earth (Fig. S2) and co-registration of the Corona KH-4A data was conducted in ArcMap using the Georeferencing tool, with a spline transformation.
The Hexagon KH-9 mission operated during the period 1971–1980 and provided high-resolution observations of 6–9 m (Burnett, Reference Burnett2012). Two cloud-free KH-9 images covering the study area on 23 November 1974 were downloaded. The better quality of these images, relative to those from KH-4A, makes the identification of glacier and lake outlines easier, despite lower resolution (Fig. S2). Fifty-five ground control points were selected for co-registration.
The TerraSAR-X (TSX) satellite was launched in 2007. A twin satellite TanDEM-X (TerraSAR-X add-on for Digital Elevation Measurement, TDX) with almost identical instrumentation was launched in 2010. TanDEM-X CoSSC (Coregistered Single Look Slant Range Complex) images were produced by the German Aerospace Centre (Deutsches Zentrum für Luft-und Raumfahrt; DLR). The images cover 30 × 50 km2, with a ground resolution of 1.7–3.5 m. Two images acquired in 2014 and 2017 (Table 3), covering 94.4% of the glaciers (excluding a small part of the east of the region without data) were downloaded from https://tandemx-science.dlr.de/.
3.1 Glacial lake mapping
The lake boundaries from the KH-4 and KH-9 images were manually vectorised using ArcGIS as these images are panchromatic. Visual inspection and manual delineation allowed also accounting for the different lake and snow conditions.
The raw water classification from the Landsat data was performed automatically using the normalised difference water index (NDWI, (green − NIR)/(green + NIR)), that is the band ratio between top-of-atmosphere reflectance of green and near infrared (NIR) bands (McFeeters, Reference McFeeters1996; Ji and others, Reference Ji, Zhang and Wylie2009). The NDWI has shown a good performance in automated delineation of glacial lakes in the Himalaya (Bolch and others, Reference Bolch, Buchroithner, Peters, Baessler and Bajracharya2008; Li and Sheng, Reference Li and Sheng2012; Zhang and others, Reference Zhang, Li and Zheng2017). The lake boundaries were further examined by comparison with original Landsat images to manually correct the misclassification of water, which is most likely to happen for turbid lakes and lakes with partial ice cover and in areas of shadow (Bolch and others, Reference Bolch, Buchroithner, Peters, Baessler and Bajracharya2008; Zhang and others, Reference Zhang2019). The lake ID, name, types, latitude, and longitude and perimeter for 2017 were labelled first. The corresponding details were then added for the earlier stages from 1964 to 2016. The lakes were classified as moraine-dammed, bedrock-dammed and supraglacial lakes according to how they are associated with glaciers.
3.2 Glacier mapping and ice-front position change
Glacier boundaries determined from Landsat images from 1975 to 2000 were derived from Xiang and others (Reference Xiang, Gao and Yao2014). Debris-covered glaciers were identified by combining a previous study (Xiang and others, Reference Xiang, Gao and Yao2014) and the second Chinese glacier inventory (Guo and others, Reference Guo2015). The glacier boundaries in 2015 were manually outlined from the Landsat OLI data in this study using the former outlines as guidance.
Rapidly increasing area is one important factor used to characterise dangerous glacial lakes, in addition to various other factors linked to GLOF triggering and the stability of the lake dam (Awal and others, Reference Awal2010; Bolch and others, Reference Bolch2011; GAPHAZ, Reference Allen, Frey and Huggel2017). Glacier ice-front positions between 1964 and 2017 were manually mapped for eight lakes that showed rapid areal expansion (>150%), and where information from previous studies identified these lakes as being potentially dangerous (Chen and others, Reference Chen, Cui, Yang and Qi2007a; Wang and others, Reference Wang and Zhang2014, Reference Wang and Jiao2015). Averaging along the glacier front provides more reliable estimations of frontal recession (Bhambri and others, Reference Bhambri, Bolch and Chaujar2012). Changes in glacier ice-front positions were therefore calculated according to the box-methods of Moon and Joughin (Reference Moon and Joughin2008) and King and others (Reference King, Dehecq, Quincey and Carrivick2018), that is the average ice-front position change was calculated within a polygon created between the ice front and a fixed reference line in the up-glacier direction.
3.3 Glacier surface velocity
Aspects of glacier dynamics, such as glacier flow instability, are important for understanding the development of glacial lakes and related hazards (Kääb, Reference Kääb2005; Bolch and others, Reference Bolch, Buchroithner, Peters, Baessler and Bajracharya2008). Glacial-flow velocity can be obtained from repeat optical satellite imagery and synthetic-aperture radar data using feature tracking. In this study, glacier surface velocity was calculated using repeat Landsat OLI imagery (15-m Pan, Table 3), performed with the COSI-Corr (Co-registration of Optically Sensed Images and Correlation) software package (Leprince and others, Reference Leprince, Barbot, Ayou and Avouac2007). An initial sliding window of 128 × 128 pixels combined with a smaller window of 16 × 16 pixels were used for frequency-based co-registration. The step size of a constant value of 5 pixels in each dimension, and a frequency masking threshold of 0.9 were adopted (Shen and others, Reference Shen2018).
3.4 Glacier surface elevation change
Glacier elevation changes (and therefore approximate geodetic mass balance) were calculated using DTMs from different sources and years (Table 3). The two KH-9 images, with an overlap of >70%, were used to produce DTMs of the whole study area. The contrast of the images was enhanced by adaptive filtering and histogram equalisation using ERDAS Imagine (version 2011) to enable recognition of Reseau crosses. The locations of 1081 Reseau crosses were automatically extracted using MATLAB, and the image distortion was corrected using the spline interpolation method (Surazakov and Aizen, Reference Surazakov and Aizen2010; Pieczonka and others, Reference Pieczonka, Bolch, Junfeng and Shiyin2013). The DTM was generated using the ERDAS Imagine Leica Photogrammetry Suite 9.2 (LPS). The nonmetric camera model was selected due to the lack of fiducials. Brown's physical model was used to correct for potential lens distortion and film deformation (Holzer and others, Reference Holzer2015). Thirty-four ground control points, identified from mountain ridge lines, river intersections and road intersections, were selected using Google Earth for external orientation (Zhou and others, Reference Zhou, Li, Li, Zhao and Ding2018). The overall root mean square error after the triangulation calculation was 0.7 pixels. Water bodies in the image were masked to avoid interference in the triangulation process. The pixel size of the DTM was resampled to 30 m to match the resolution of the Shuttle Radar Topography Mission (SRTM) DTM. The correction of the elevation difference error between the DTM in 1974 and SRTM in 2000 was conducted using data from a nonglacier region. Registration errors, systematic spatial trend, aspect-, slope- and curvature-dependent differences were fitted using the Bisquare Remain Robust method and removed in MATLAB (Nuth and Kääb, Reference Nuth and Kääb2011; Gardelle and others, Reference Gardelle, Berthier and Arnaud2012b; Pieczonka and others, Reference Pieczonka, Bolch, Junfeng and Shiyin2013; Li and Lin, Reference Li and Lin2017) (Fig. S4). Brightness saturation in snow-covered regions causes poor texture in optical images, which can result in erroneous matching (Zhou and others, Reference Zhou, Li and Li2017). Based on the assumption that glacier thinning is at a maximum at the glacier front and decreases with increasing altitude (Pieczonka and Bolch, Reference Pieczonka and Bolch2015), the peaks of glacier thinning were used as a reference to exclude the outliers. The outliers of elevation difference in each elevation bin were further removed using a 1.5 NMAD filter (Brun and others, Reference Brun, Berthier, Wagnon, Kääb and Treichler2017). The data gaps in the glacial area were not filled after outlier removal as the mean elevation change is used and consideration of an interpolation of data gaps can result in larger uncertainty.
DTMs from TarraSAR and TanDEM-X data were generated using the InSAR TanDEM-X bistatic DEM workflow in ENVI SARscape software, including interferogram generation, adaptive filter and coherence generation, phase unwrapping and phase-to-height conversion. TanDEM-X exhibited a better match and few outliers than the KH-9 DTM.
Debris cover and snow moisture content can affect the penetration depth of microwave bands. The difference between SRTMC-band and SRTMX-band was used to estimate a first approximation of C-band penetration assuming no penetration of X-band signal (Gardelle and others, Reference Gardelle, Berthier and Arnaud2012a). Elevation difference is regarded as a function of elevation, which is corrected by polynomial fitting (Gardelle and others, Reference Gardelle, Berthier, Arnaud and Kääb2013). C-band has greater penetration depth, ~1.0 m in the central Himalaya (Gardelle and others, Reference Gardelle, Berthier, Arnaud and Kääb2013; Zhou and others, Reference Zhou, Li, Li, Zhao and Ding2018), relative to the X-band. The SRTMX-band data are not available in our study area because of a trip-like distribution, preventing the estimation of penetration depth. X- and C-SRTM data from the regions close to the study area were used to perform curvature and slope-dependence error correction (Gardelle and others, Reference Gardelle, Berthier and Arnaud2012b). The mean penetration depth difference between X- and C-SRTM is 0.93 ± 0.41 m, which is similar to the estimation of 1.0 m from Zhou and others (Reference Zhou, Li, Li, Zhao and Ding2018) and 1.4 m from Gardelle and others (Reference Gardelle, Berthier, Arnaud and Kääb2013) (Fig. S5). KH-9 and C-SRTM were acquired in 1974 and 2000, respectively, and the penetration of X-band could introduce a small annual uncertainty relative to a 26-year period. C-SRTM was acquired in February, while one TanDEM-X in October and KH-9 in November are used. The seasonal correction of monsoon-type glaciers with ablation and accumulation during the summer (Fujita, Reference Fujita2008), that is 1-year additional accumulation, was removed using the elevation difference between TanDEM-X and C-SRTM minus their annual average change (Li and Lin, Reference Li and Lin2017).
3.5 Meteorological data
Global Precipitation Climatology Centre (GPCC) data show better performance in estimating long-term trend of precipitation change in the TP compared with other precipitation products such as GPCP and PERSIANN (Yang and others, Reference Yang2018). Gridded temperature (1960–2016) and precipitation (1960–2013) changes derived from the Climatic Research Unit (CRU) and GPCC data were used respectively. In addition, annual temperature and precipitation observed at the Nyalam station (located at 3810 m a.s.l.) from 1967 to 2017 were also collected.
3.6 Uncertainty estimation
The accuracy of delineated lake area was estimated using ±0.5 pixels multiplied by the lake perimeter and spatial resolution (Fujita and others, Reference Fujita, Sakai, Nuimura, Yamaguchi and Sharma2009; Salerno and others, Reference Salerno2012; Haritashya and others, Reference Haritashya2018). Uncertainties in the glacier area and ice-front position mapping were estimated following the methods from previous studies (Hall and others, Reference Hall, Bayr, Schöner, Bindschadler and Chien2003; Ye and others, Reference Ye, Kang, Chen and Wang2006).
Uncertainties in glacier elevation change in each elevation bin were estimated using the method of Gardelle and others (Reference Gardelle, Berthier, Arnaud and Kääb2013). The uncertainty in each elevation bin was calculated based on Eqn (1):
 $$Err_{hi} = \displaystyle{{E_{\Delta hi}} \over {\sqrt {N_{{\rm eff}}}}}, \quad N_{{\rm eff}} = \displaystyle{{N_{{\rm tot}}\cdot PS} \over {2d}}$$
where Err hi is the uncertainty of glacier elevation change in each elevation bin; E Δhi is the std dev. in each elevation bin; N eff is the number of pixels with independent elevation change measurements; N tot is the total number of elevation change measurements; PS is the pixel size (30 m here) and d is the distance of spatial autocorrelation (249 m here), which is determined by Moran's autocorrelation index of elevation difference from off-glacier regions (Gardelle and others, Reference Gardelle, Berthier, Arnaud and Kääb2013).
The glacier surface elevation change was calculated using Eqn (2):
 $$ME = \displaystyle{{\sum {S_i\cdot h_i}} \over {S_{{\rm tot}}}}$$
where ME is mean elevation change; h i is the change in each elevation bin; S i is the area in each elevation bin and S tot is the total glacier area.
The uncertainty of glacier elevation change was estimated by Eqn (3):
 $$Err_{ME} = \sqrt {\sum {\left( {{\left( {\sigma_{Err_{hi}}\displaystyle{{\partial_{ME}} \over {\partial_{hi}}}} \right)}^2} \right)}} $$
where Err ME is the uncertainty of total glacier elevation change.
3.7 Future lake development
Proglacial lake formation and expansion are facilitated when overdeepened subglacial basins become proglacial depressions due to glacier retreat, and when these depressions fill with meltwater rather than sediments (Clague and Evans, Reference Clague and Evans1994). Hence, by detecting overdeepenings in the glacier bed, sites of potential future lake formation and possible expansion of existing lakes can be identified (Allen and others, Reference Allen2016; Linsbauer and others, Reference Linsbauer2016). We applied the GlabTop model, which was originally developed for estimating ice thickness and bed topography across the Swiss Alps (Linsbauer and others, Reference Linsbauer, Paul and Haeberli2012; Paul and Linsbauer, Reference Paul and Linsbauer2012). The modelled ice thickness distribution was subtracted from a surface DTM to obtain the glacier bed topography, that is, a DTM without glaciers, from which overdeepenings in the glacier bed could be detected and analysed. Comparisons to ground-penetrating measurements has shown that the uncertainty of the modelled ice thickness is about ±30%, but the location of overdeepenings is robust (Linsbauer and others, Reference Linsbauer, Paul and Haeberli2012).
We compared the linear lake growth rates from 1964 through 2017 and rates using lake area differences between 1964 and 2017 for PDGLs. The growth rates from both methods were similar. We then used the linear rates from 1964 to 2017 to estimate the future timing of lake expansion, under scenarios where rates decrease by 50% or increase by same magnitude, 50 and 100%.
4. RESULTS
4.1 Changes in glacial lake area between 1964 and 2017
We found 102 lakes ranging in size from 0.007 to 5.5 km2 in 2017 (67 of these are ⩾0.02 km2), with a total area of 20.5 ± 0.4 km2. Most of the lakes are moraine-dammed lakes (63%), followed by bedrock-dammed lakes (25%) and supraglacial lakes (13%). The number of glacial lakes increased from 73 in 1964 to 99 in 2000 (Fig. 2). This is followed by a relative stability of the total number between 2000 and 2017 (102 lakes). The total area of these lakes increased by ~110% from 9.7 ± 0.1 km2 in 1964 to 20.3 ± 0.2 km2 in 2010 with a rate of 0.23 ± 0.01 km2 a−1; this trend is especially apparent for large lakes (area ⩾0.02 km2). The rate of increase in lake size slowed down after 2010 (0.03 ± 0.03 km2 a−1). Between 1964 and 2017, the total area of glacial lakes (⩾0.02 km2) increased by ~115% (0.20 ± 0.06 km2 a−1).
Number and area changes from 1964 to 2017 for lakes identified visually from Landsat imagery. (a) Number change for all lakes and lakes with area ≥0.02 km2. (b) Area change for all lakes and lakes with area ≥0.02 km2. (c) Number change for lakes in different size divisions. (d) Area change for lakes in different size divisions. (e) Number change for lake classification (moraine-dammed, bedrock-dammed and supraglacial lake). (f) Area change for lake classification (moraine-dammed, bedrock-dammed and supraglacial lake).
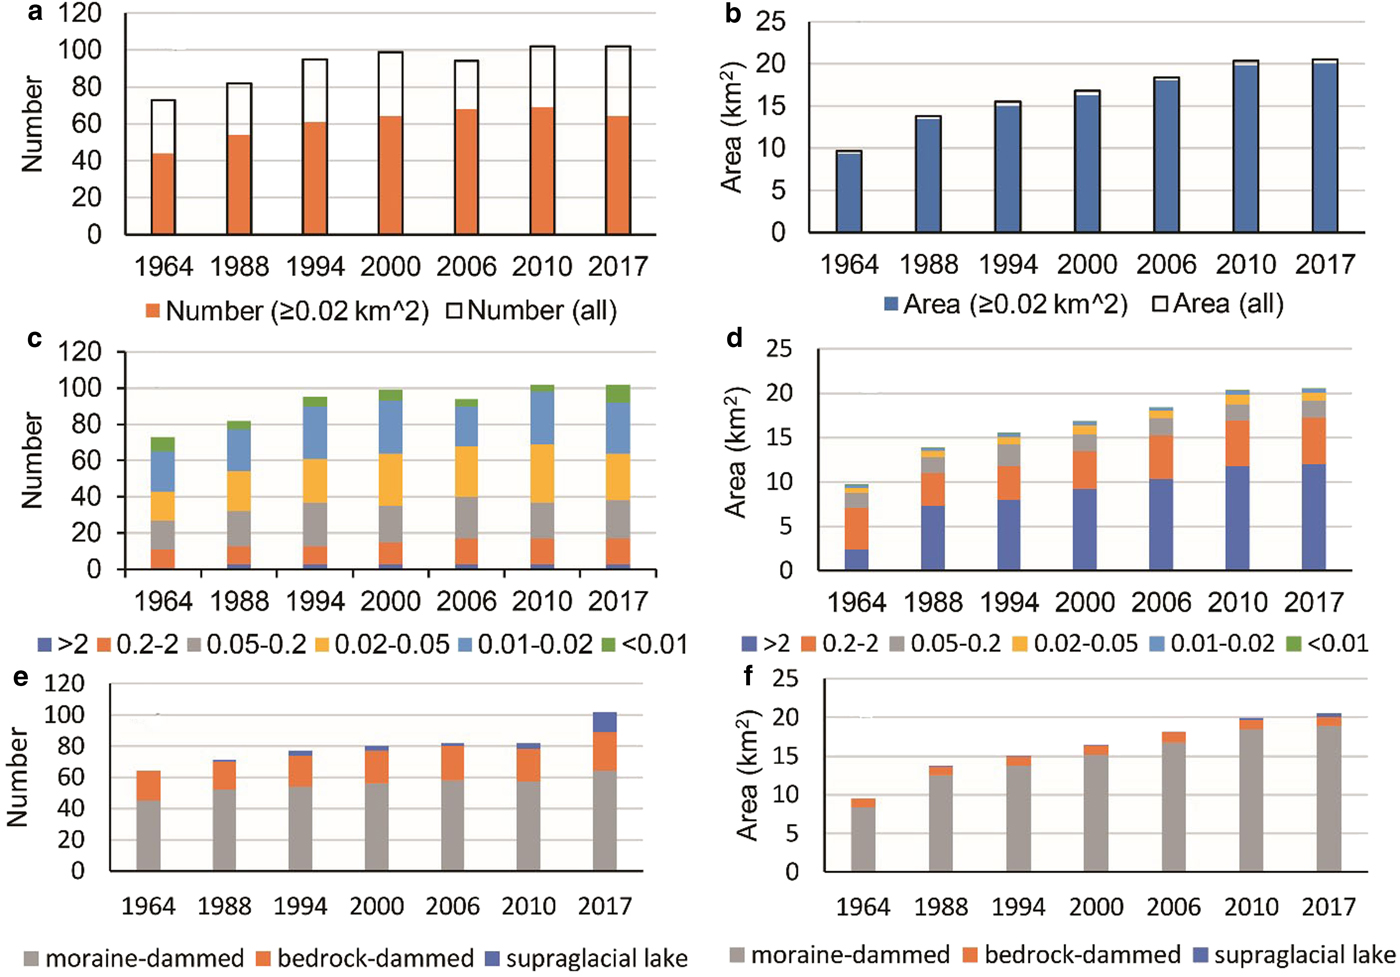
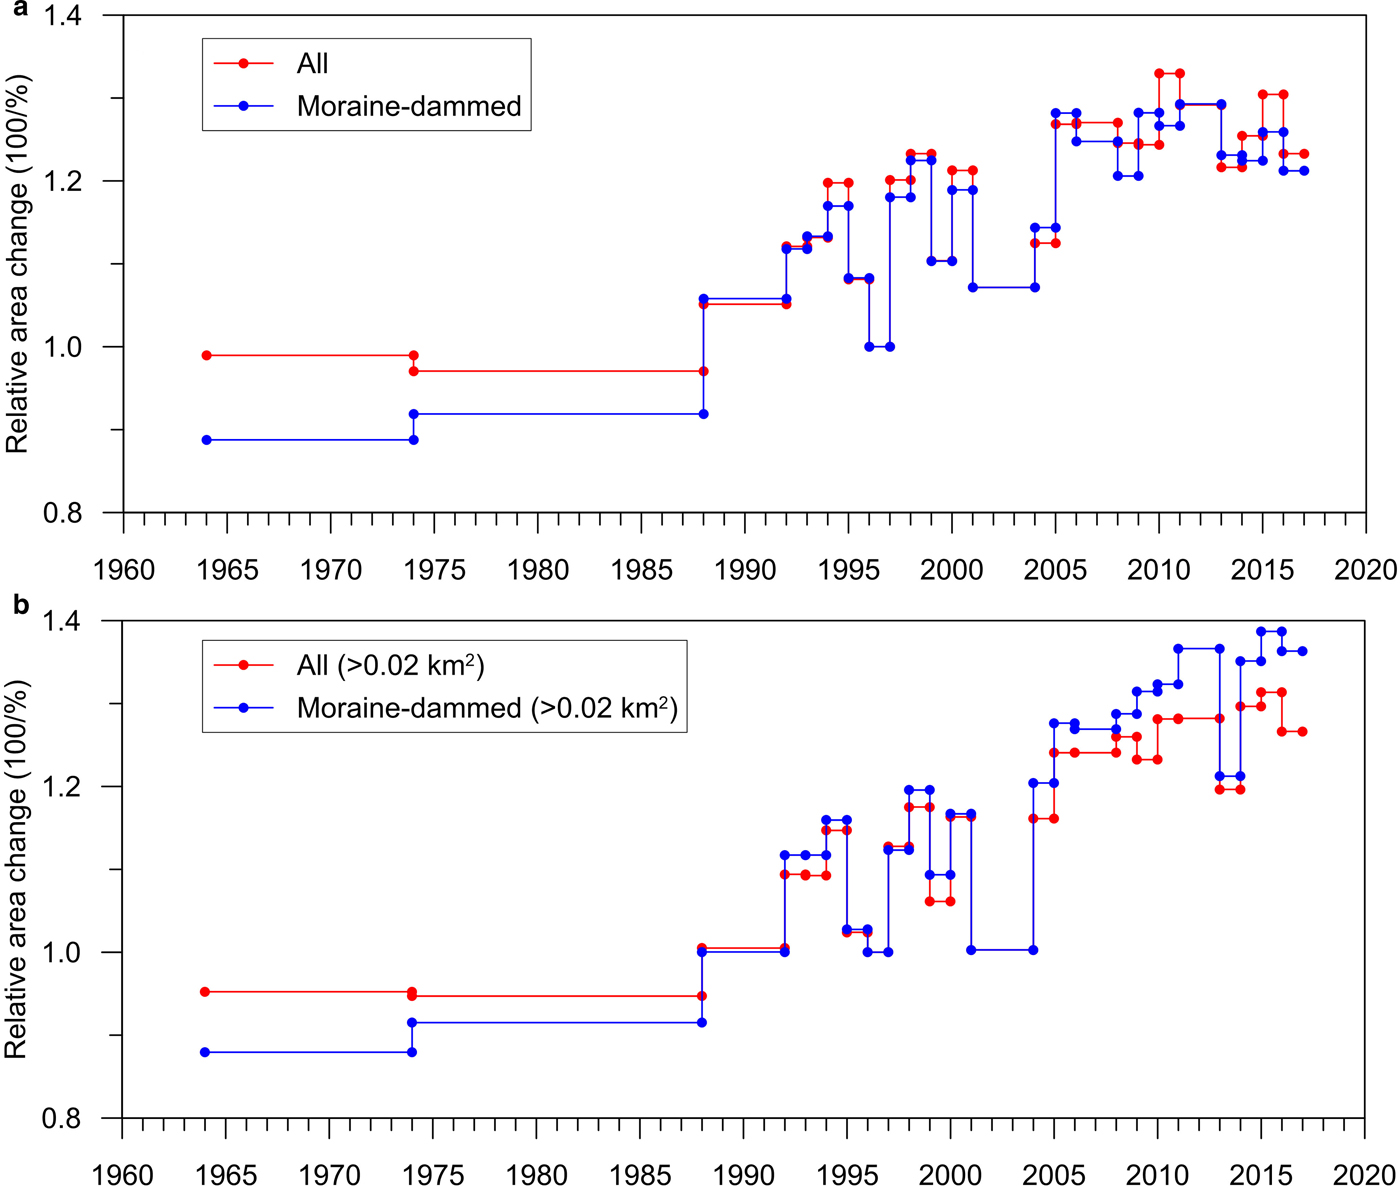
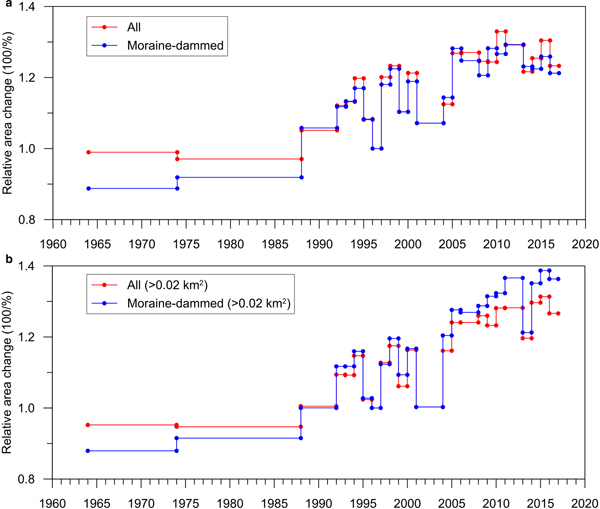
The temporal evolution of relative lake area changes showed a slight decrease in area between 1964 and 1988 (Fig. 3). However, the area of moraine-dammed lakes (glacier-fed lakes) expanded during this period. Between 1988 and 2010, glacial lakes rapidly increased in area, especially the large moraine-dammed lakes (⩾0.02 km2). During recent years, the area of moraine-dammed lakes larger than 0.02 km2 remained relative stable, but there has been a slight decrease in area for small glacial lakes (<0.02 km2).
Time series of relative lake area change from 1964 to 2017: (a) all glacial lakes and moraine-dammed lakes and (b) glacial lakes and moraine-dammed lakes (≥0.02 km2). The year 1996 is used as the reference year.
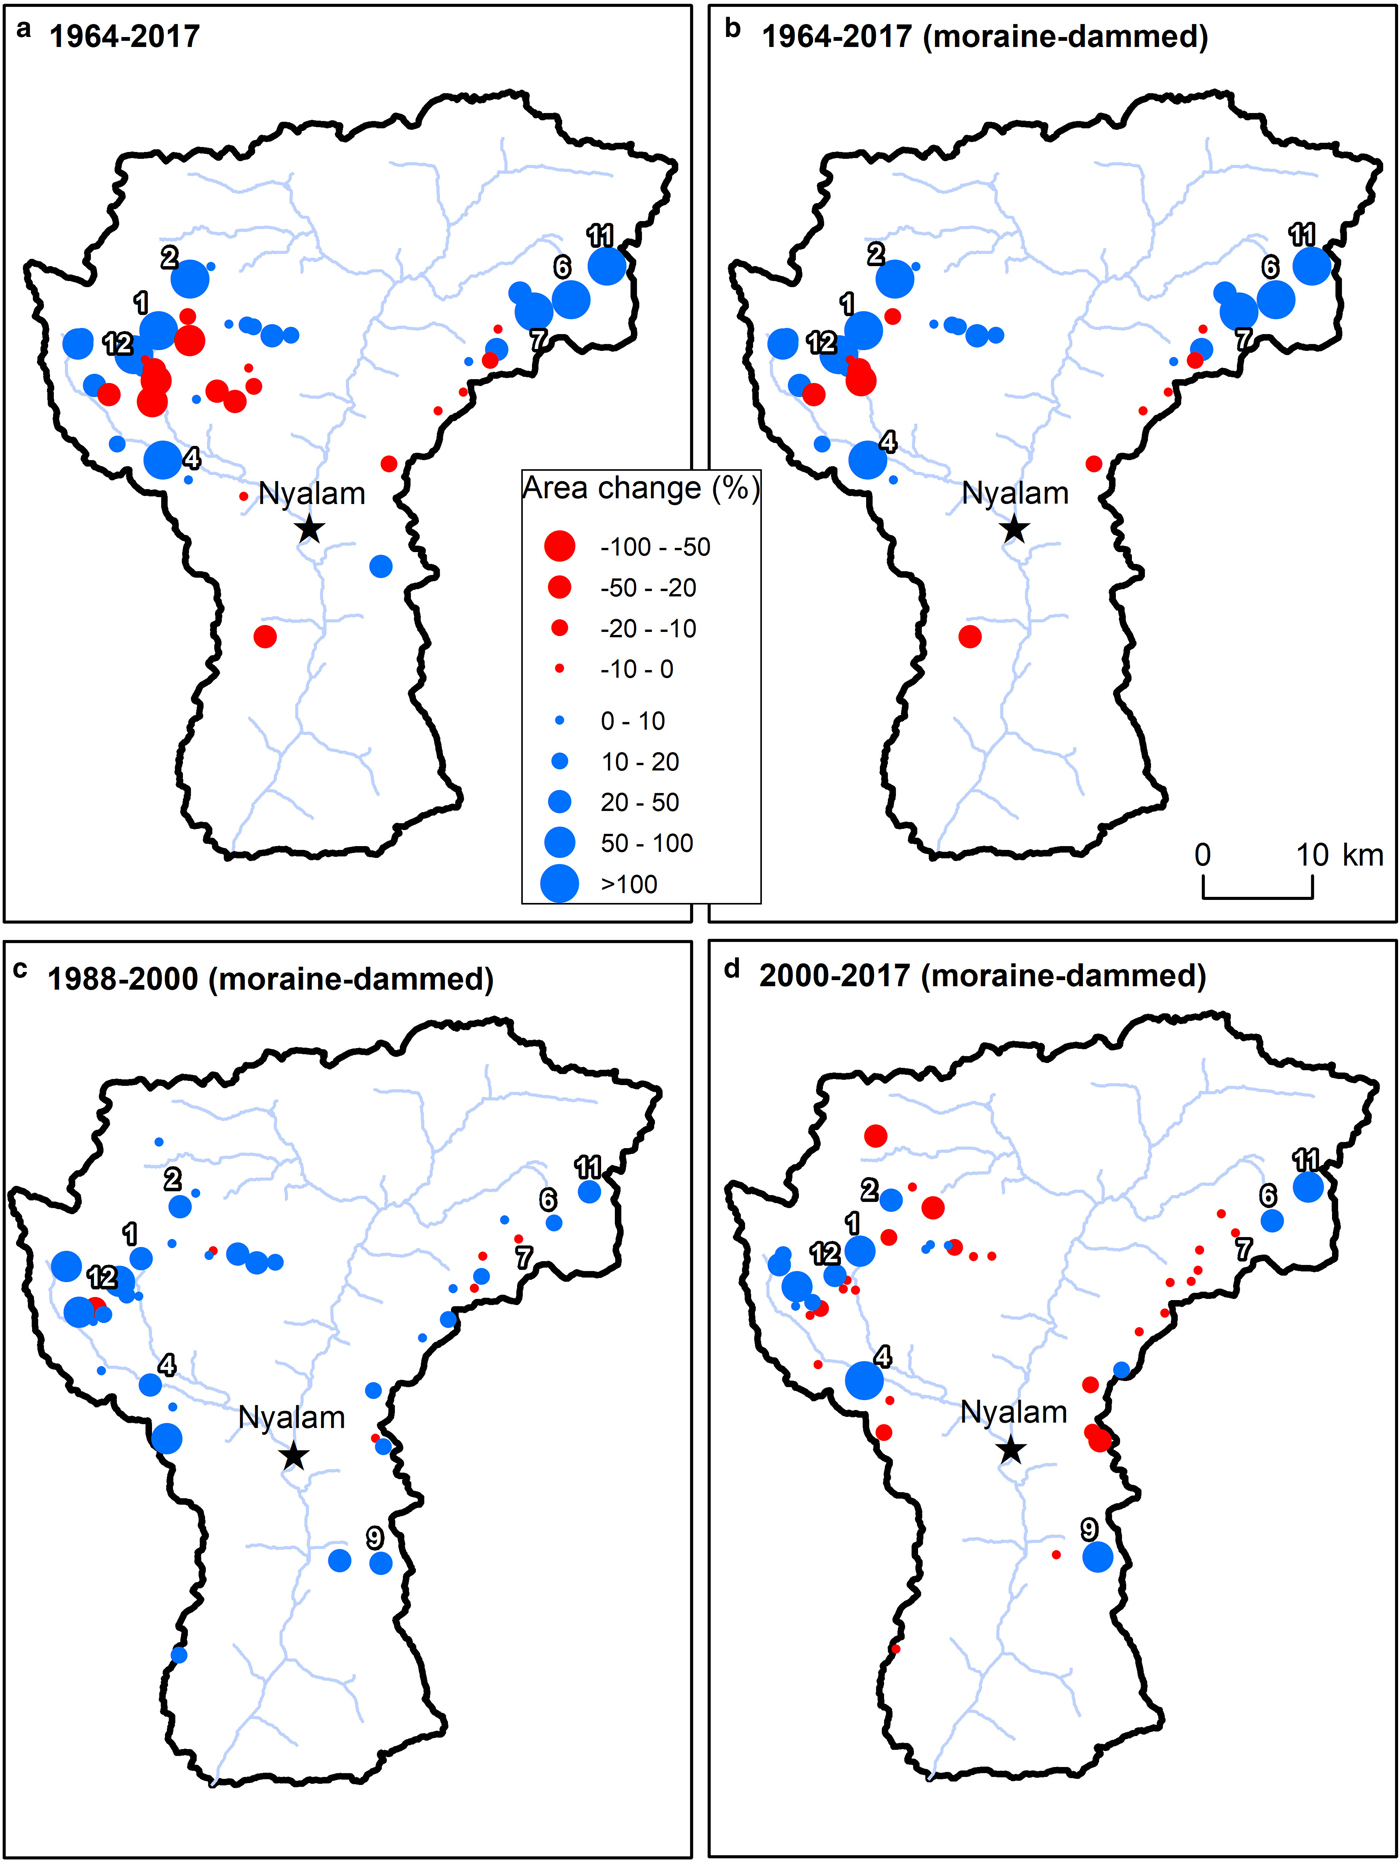
The lakes are mainly distributed in the catchments of the northwestern and northeastern parts of the basin (Fig. 4). Most lakes showed an area enlargement between 1964 and 2017, especially the moraine-dammed lakes. The spatial patterns of lake-area changes were clearer between 1988 and 2000 than between 2000 and 2017.
Spatial patterns of lake area changes (lakes with area ≥0.02 km2) between 1964 and 2017: (a) area change between 1964 and 2017, (b) area change between 1964 and 2017 for moraine-dammed lakes, (c) area change between 1988 and 2000 for moraine-dammed lakes and (d) area change between 2000 and 2017 for moraine-dammed lakes. Lakes with a rapid increase in area (Table 4) are labelled by their ID.
4.2 Potentially dangerous glacial lakes (PDGLs)
Based on results given in previous GLOF hazard and risk assessments (Chen and others, Reference Chen, Cui, Yang and Qi2007a; Wang and others, Reference Wang and Zhang2014, Reference Wang and Jiao2015), eight lakes with a significant area increase of >150% over the time period 1964–2017 (ranging from 162 ± 148 to 649 ± 81%) were considered as PDGLs in this study (Table 4, bold; Fig. 4).
List of glacial lakes (⩾0.02 km2) and their areas in 1964 and 2017 in the Poiqu River basin, central Himalaya. Only lakes for which data are available for both years are included. The lakes considered potentially dangerous are in bold type
* Area for Cirenmaco (no. 9) in 1988 is used, as the imagery available for the pre-1988 period did not cover this lake.
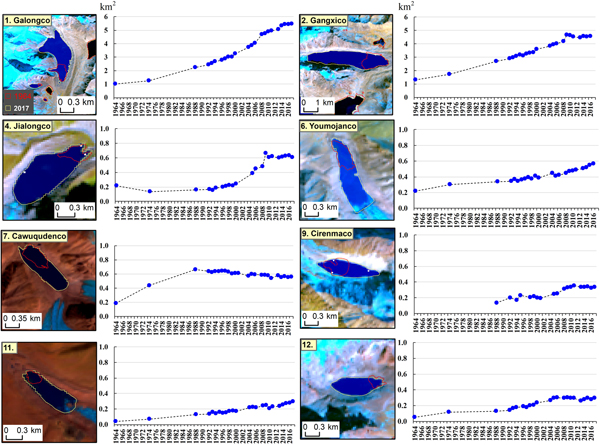
The continuous time series mapping of PDGLs showed that Galongco, Gangxico, Jialongco and Youmojanco have the largest areas and the greatest magnitude of increase in area (Fig. 5). Lake no. 7 displayed an abrupt area increase between 1964 and 1988, then tends towards stability. Cirenmaco, Lake no. 11 and Lake no. 12 also showed a continuous increase in area.
Time series of area for eight PDGLs with rapid area change between 1964 and 2017.

Ground observations and 3-D-views from Google Earth images (Fig. 6) show that these eight PDGLS are in direct or very near contact with their parent glaciers. Glacier tongues detached from Cirenmaco, Jialongco, Galongco and Gangxico. These lakes are still fed by the glacier tongues located on steep slopes behind the lakes. This situation could result in GLOFs due to ice avalanching from the steep glacier tongues causing wave overtopping of the damming moraines. The lake basin topography for Youmojanco and Lake no. 11, is relatively flat, which means that as these lake-terminating valley glaciers calve and retreat, the lakes can continue to advance rapidly up-valley. Cawuqudenco has two connected glaciers, but the steep tongues of the lake-terminating glaciers prevent further lake development. Lake no. 12 has lost connection to the surrounding steep glacial remnants, and is bounded by steep bedrock slopes that prevent this lake from expanding further.
Ground and 3-D views of eight PDGLs. (a, b) Photos for Cirenmaco (taken by W. Wang on 21 September 2012); (c) Cirenmaco from Google Earth image on 25 November 2016. (d, e) Photos for Jialongco (taken by G. Zhang on 18 October 2017); (f–i) Jialongco, Galongco, Gangxico, Youmojanco, Lake no. 11 from Google Earth images on 5 June 2015, 10 October 2017, 10 October 2017, 01 November 2012 and 01 November 2012, respectively. (k–l) Cawuqudenco and Lake no. 12 from Google Earth images on 01 November 2012 and 28 November 2009, respectively. Source of Google Earth images is from DigitalGlobe. The numbers displayed in red refer to the ID of the lakes listed in Table 4.

4.3 Glacier–lake interactions
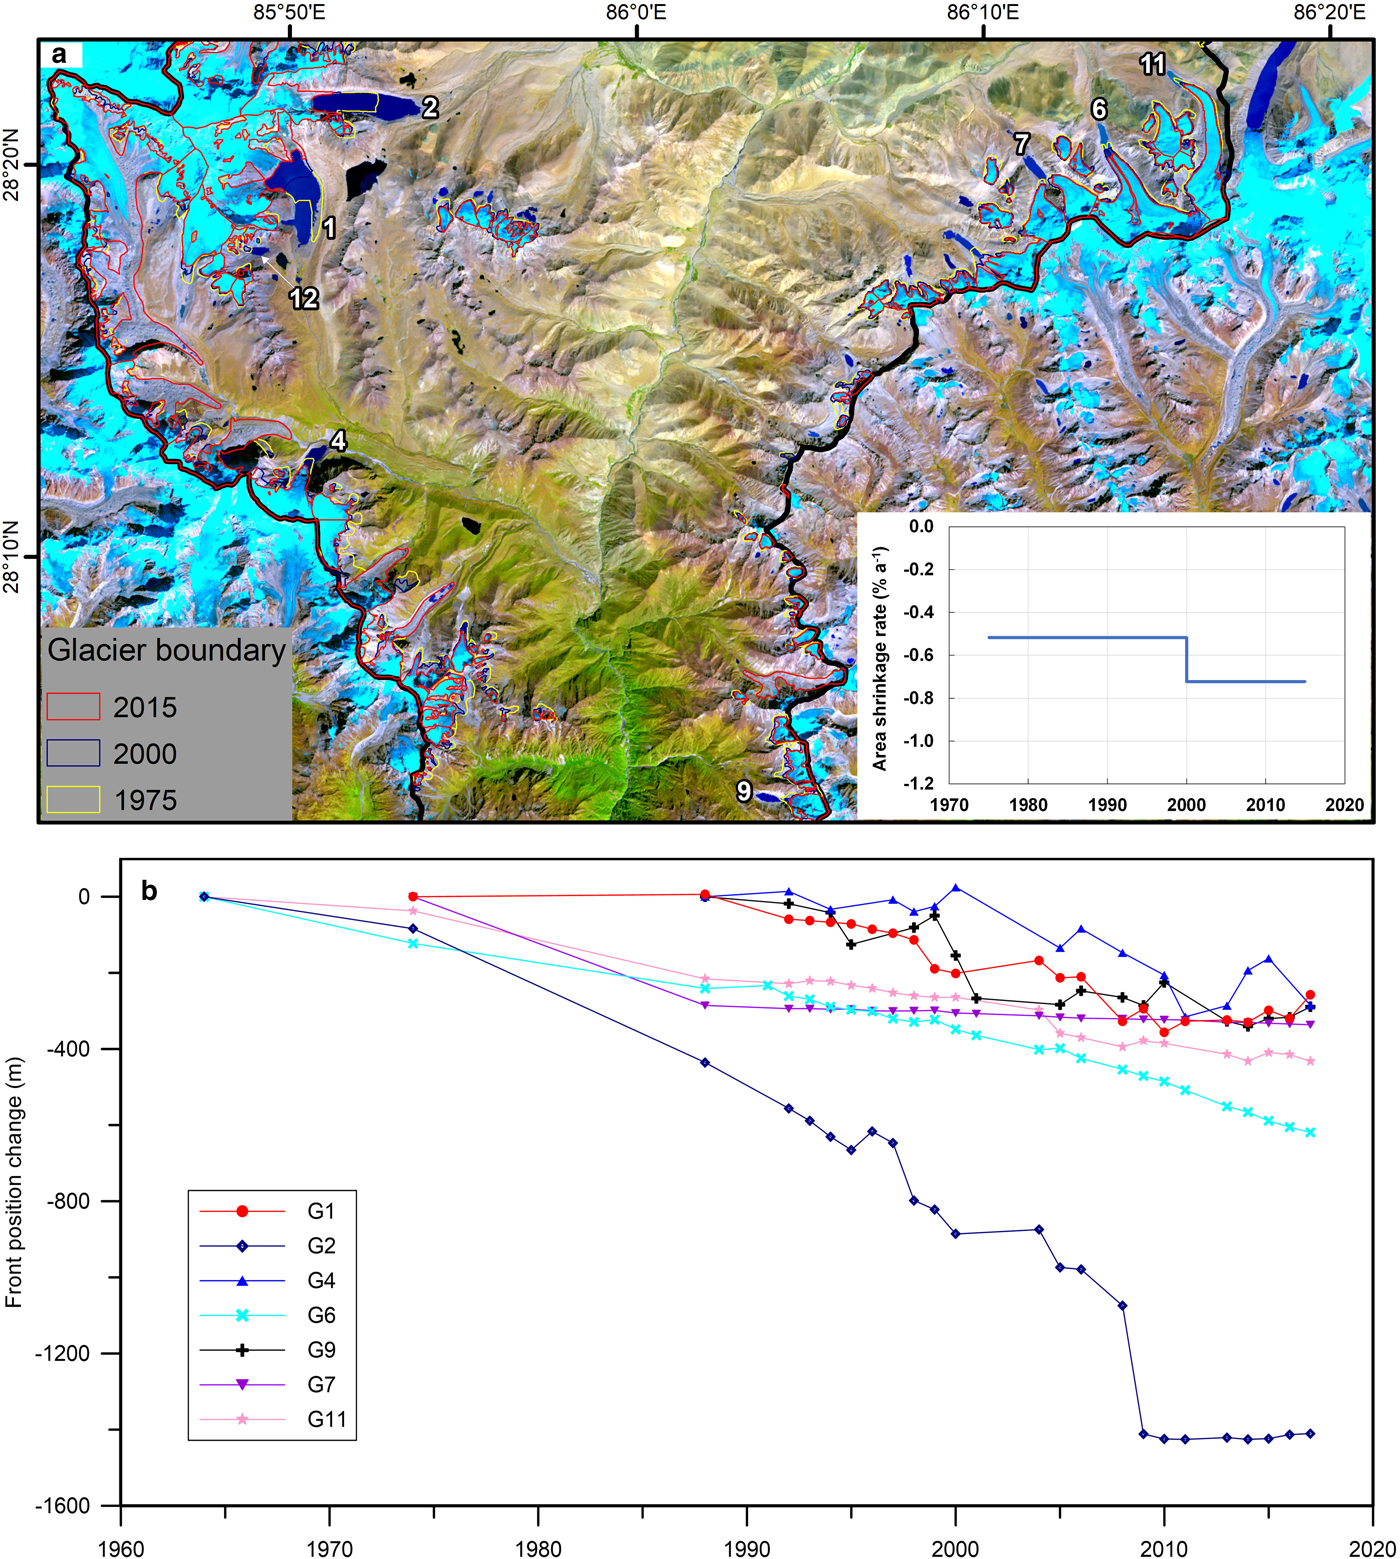
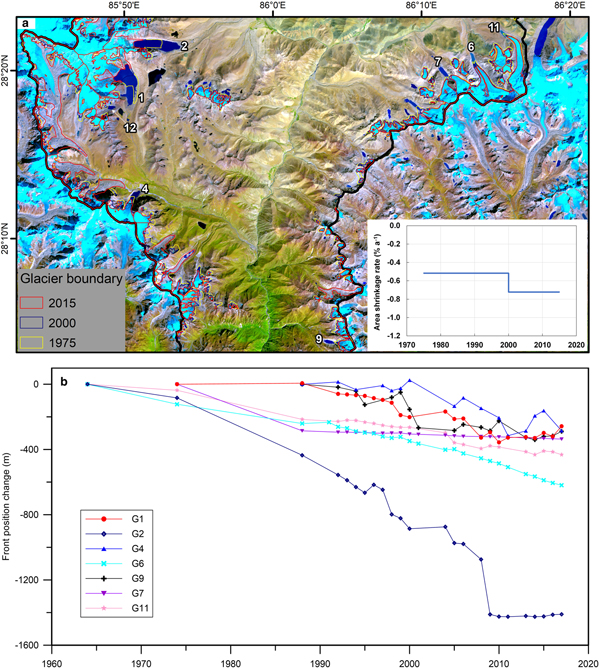
The glaciers in the Poiqu River basin have been shrinking at a rate of −0.52 ± 0.05% a−1 between 1975 and 2000 (Fig. 7). After 2000, glacier shrinkage accelerated to a rate of −0.72 ± 0.08% a−1 between 2000 and 2015. The overall shrinking rate of glaciers between 1975 and 2015 was −0.56 ± 0.02% a−1 (Table 5).
Glacier area and glacier-front position changes. (a) Glacier area change in the Poiqu River basin from 1975 to 2015. The inset shows the shrinkage rate of glacier area in the whole Poiqu River basin. (b) Ice front changes for the PDGLs.
Changes in glacial lake area, glaciers and related climatic factors in the Poiqu River basin, central Himalaya between 1974 and 2017. Lakes with areas of ⩾0.02 km2 are selected
* p < 0.01.
Lake-terminating glacier ice-front positions for the eight PDGLs showed overall retreat, which was accompanied by an expansion of the glacial lakes (Fig. 7). The ice-front retreat ranged from 258 ± 61 to 1410 ± 58 m (Table 6). Reqiang Glacier (parent glacier of Gangxico) experienced the fastest retreat (26.6 ± 1.1 m a−1). However, Galongco has the largest lake area expansion (0.08 ± 0.004 km2 a−1) which is slightly higher than the expansion of Gangxico (0.06 ± 0.003 km2 a−1), although the ice-front retreat was lower (−6.0 ± 1.4 m a−1). This slow change could be due to topographic control and the low length to width ratio of the glacier.
Rates of changes for PDGLs and the associated lake-terminating glaciers between 1964 and 2017
* Glacier velocities for eight lake-terminating glacier basins in 2016–2017 are used.
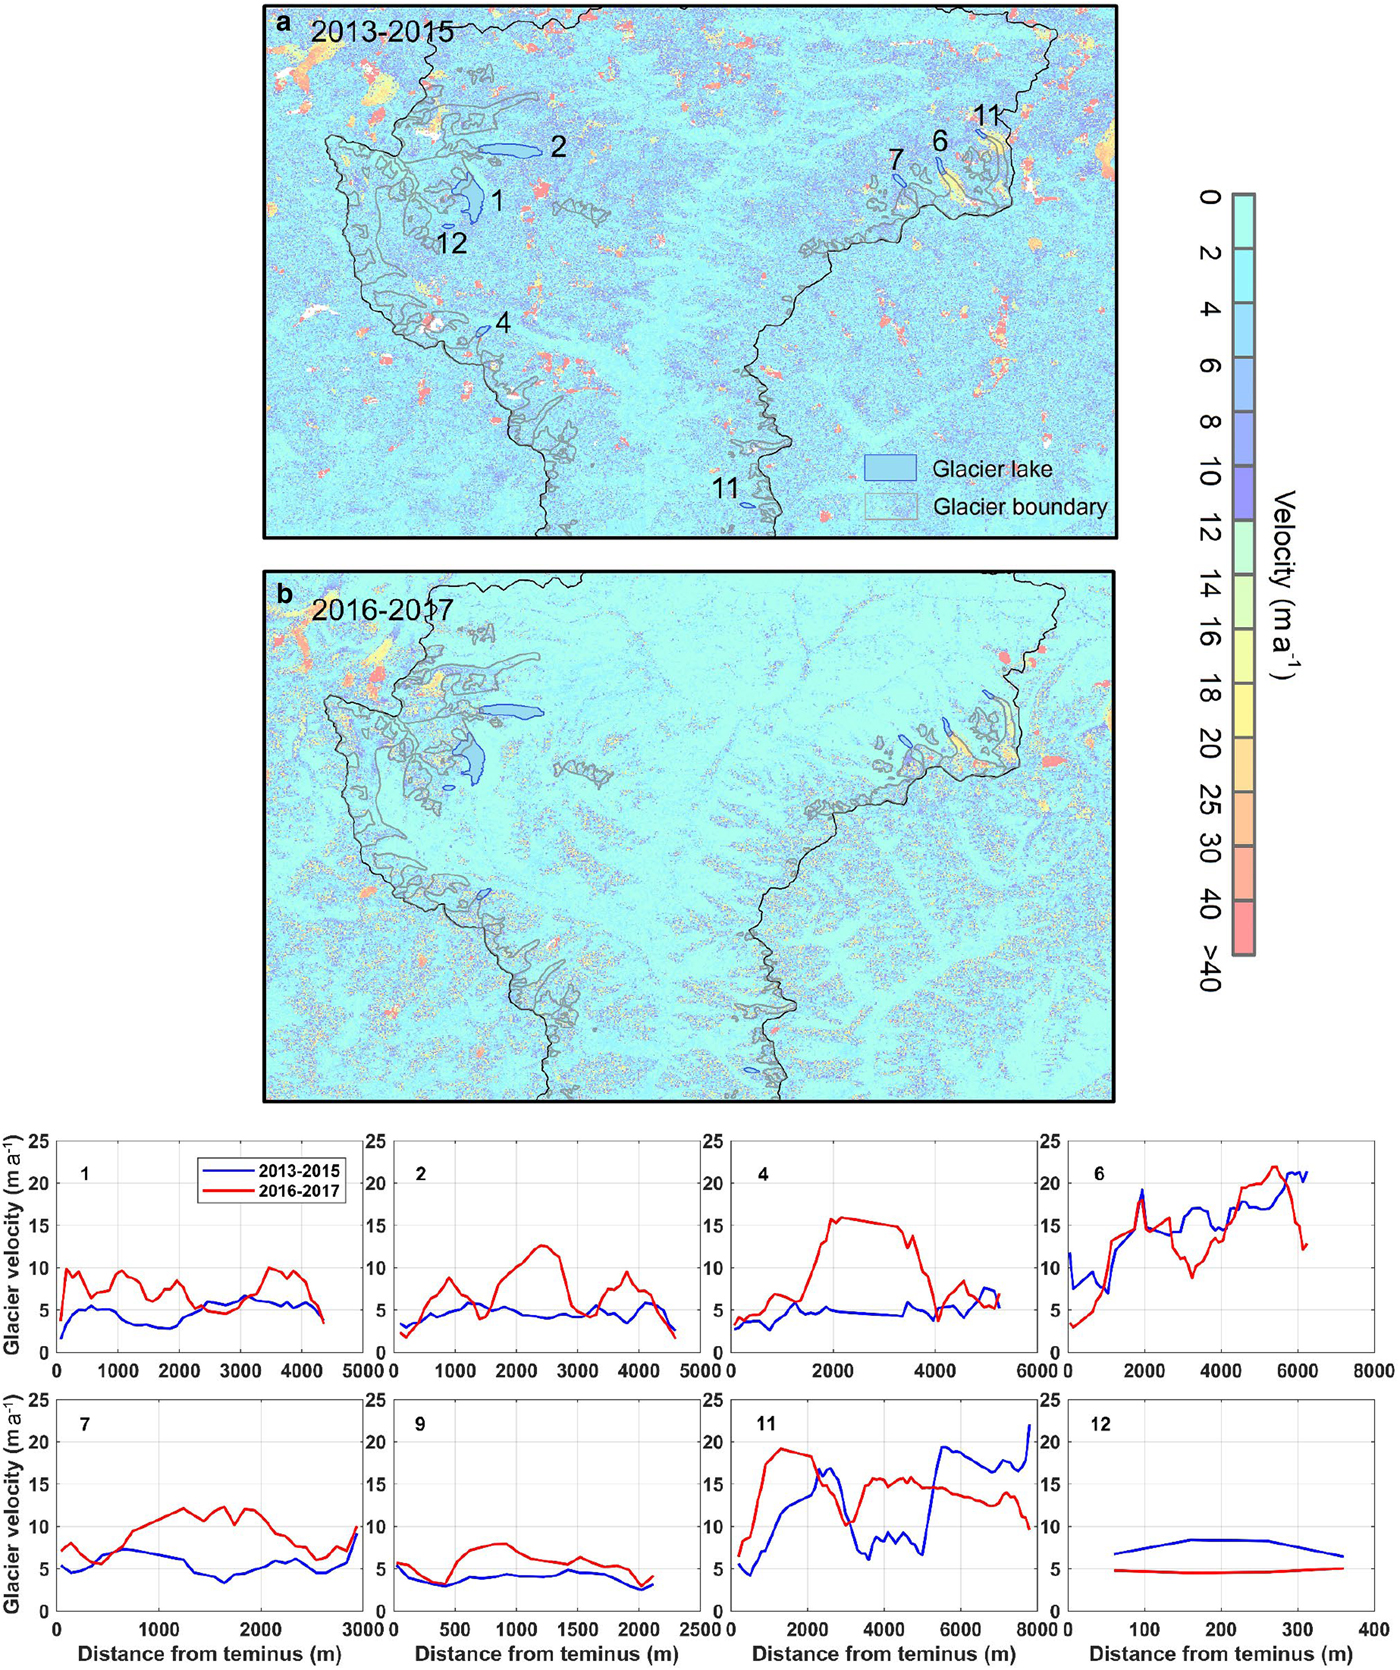
The mean glacier surface velocities in the Poiqu River basin for 2013–2015 and 2016–2017 were 4.7 ± 3.2 and 5.0 ± 3.9 m a−1, respectively (Fig. 8). The eight lake-terminating glaciers, however, flowed at a rate of ~10 m a−1 (ranging from 8.2 ± 0.4 to 13.9 ± 0.4 m a−1) (Table 6), which is for most glaciers significantly higher than the average of the study area. Five of the eight lake-terminating glaciers (Galongco, Gangxico, Jialongco, Cawuqudenco and Cirenmaco) had increased surface velocities from 2016–2017 relative to 2013–2015 (Fig. 8). Two lake-terminating glaciers (Youmojanco and Lake no. 11) displayed variability in surface velocity between the two periods. The terminating glacier of Lake no. 11 had a decreased surface velocity, which could be the cause of the flat topography of the glacier terminus (Fig. 6).
Glacier surface velocities and changes in the Poiqu River basin: (a) 2013 to 2015 velocity stack and (b) 2016 to 2017 velocity stack. The lower panels show the surface velocity changes of eight PDGLs in the 2016–2017 velocity stack compared with the 2013–2015 velocity stack.
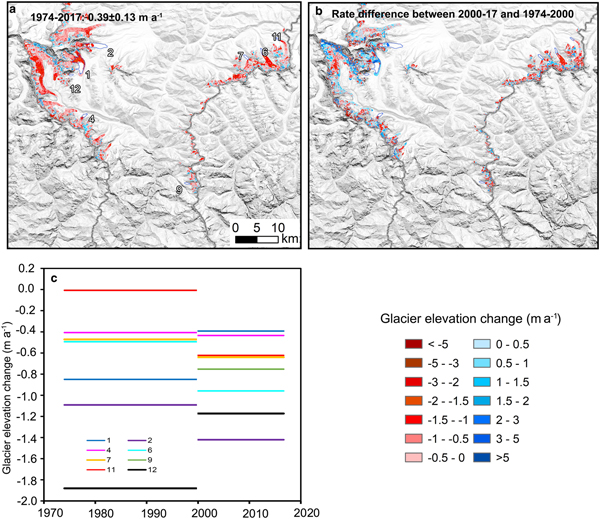
The mean rate of glacier elevation change in the Poiqu River basin between 1974 and 2000 was 0.38 ± 0.18 m a−1 (Fig. 9). In recent years (2000–2017), the glacier loss was similar, with an elevation lowering rate of −0.40 ± 0.14 m a−1. During the whole period of 1974–2017, the mean rate of glacier thickness change was −0.39 ± 0.13 m a−1.
Glacier elevation changes in the Poiqu River basin. (a) Glacier elevation change in 1974–2017. (b) Rate difference of glacier elevation change between 2000–17 and 1974–2000. (c) Changes in surface lowering for eight lake-terminating glaciers from 1974 to 2017.
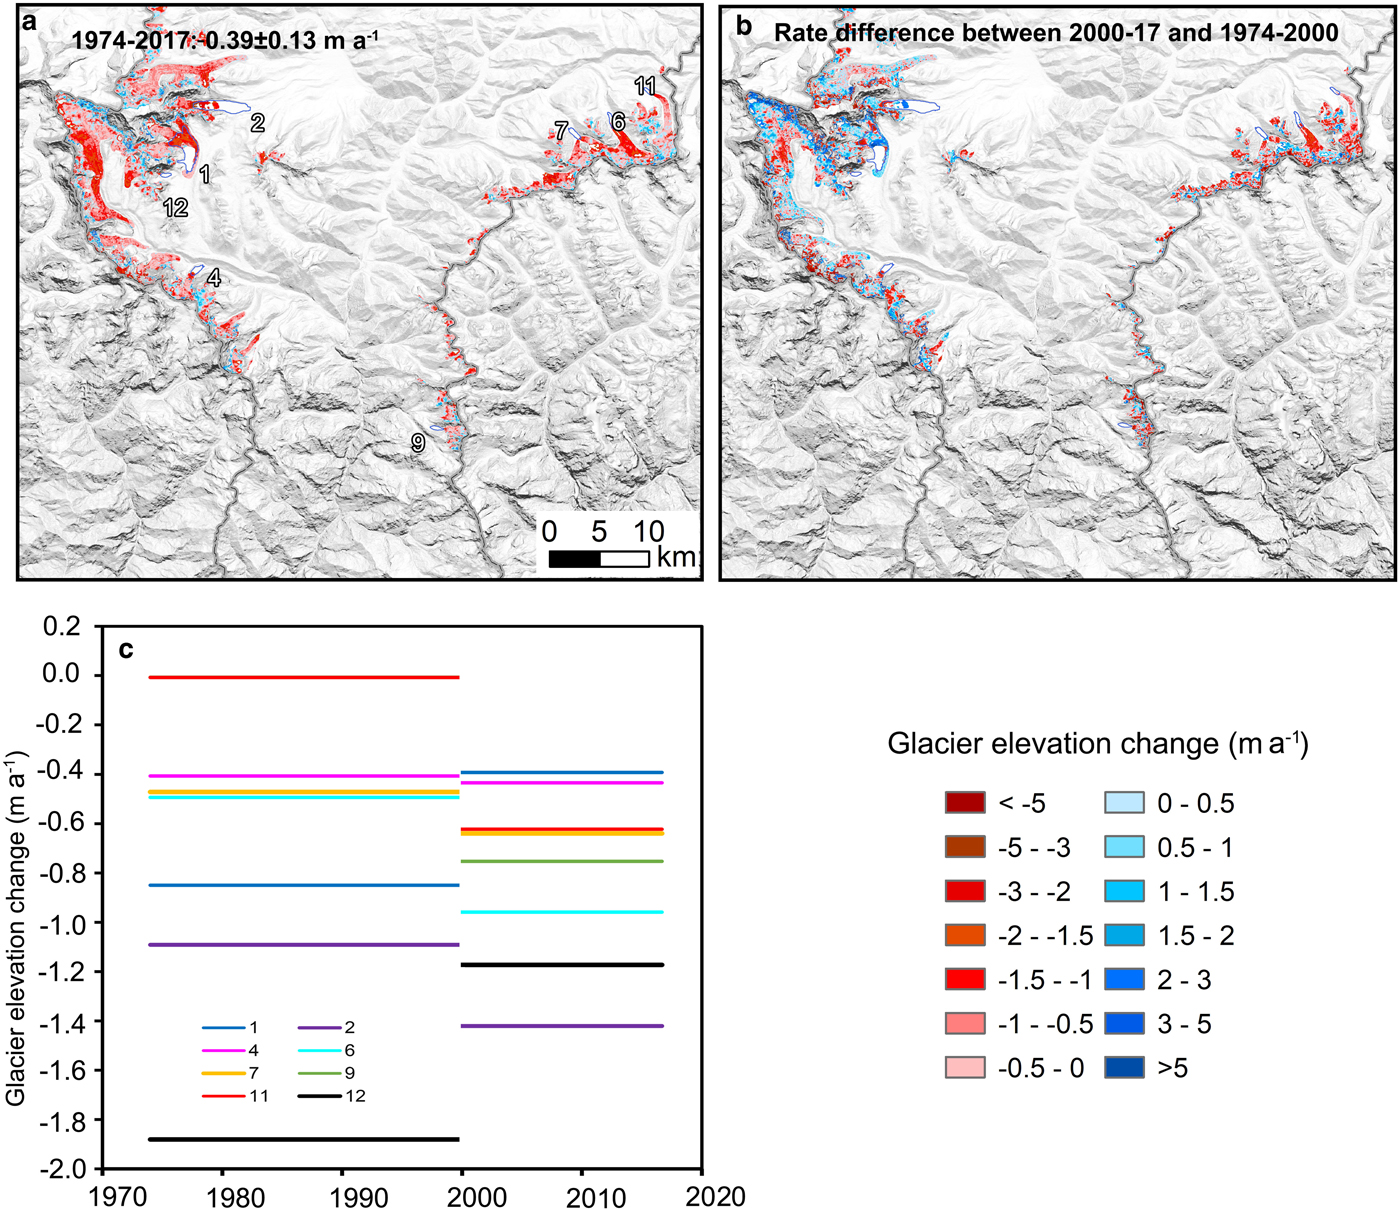
The eight PDGL-terminating glaciers showed an overall thinning trend (Fig. 9), with the mean glacier thickness change rate from 1974 to 2000 being −0.65 ± 0.04 m a−1, which indicates a greater melt than for the basin as a whole. These glaciers showed a higher thinning rate of −0.80 ± 0.05 m a−1 from 2000 to 2017. Six of the eight glaciers showed increased loss rates in 2000–2017 compared with 1974–2000.
4.4 Glacier-bed overdeepening and future lake development
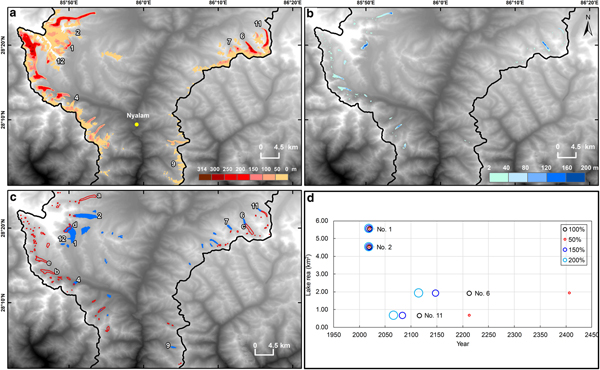
The average modelled ice thickness in the Poiqu River basin is ~150 m with a maximum thickness of ~310 m. Most of the thicker ice, including thick tongues (>150 m) are located in the northwestern and northeastern corners of the basin (Fig. 10). The modelled glacier bed overdeepenings indicates the formation of 74 new lakes (>0.01 km2) and expansion exisitng lakes, with a maximum depth of ~200 m. According to the modelling with GlabTop five lakes are predicted to be larger than 1 km2 (a–e in Fig. 10c).
Future glacial-lake development. (a) Modelled ice thickness using GlabTop. (b) Modelled bed overdeepenings. (c) Potential future new lakes or expansion of lake boundaries. Five new lakes larger than 1 km2 are labelled (a–e). (d) Future lake development in scenarios with an increase rate of −50%, same rate, 50% and 100% (relative to rates measured from 1964 to 2017).

Two PDGLs (Galongco and Gangxico) show a limited potential for future expansion. On the other hand, assuming that the expansion rates over the time period 1964–2017 slowdown, continue or accelerate, Youmojanco will continue expanding and could reach a maximum area of ~2.0 km2, an increase of ~240% of its area in 2017. Depending on the scenario this maximum area could be reached by ~2110 (assuming an increased rate of 100%), 2150 (50%), 2200 (same rate) or 2400 (−50%). Lake no. 11 can potentially increase by a further ~130%, reaching a size of ~0.7 km2 by ~2060 (100%), 2080 (50%), 2100 (same rate) and 2200 (−50%).
5. DISCUSSION
5.1 Glacier–lake interactions and potential GLOF threats
The majority of glaciers in the Himalaya are retreating and losing mass at an accelerating rate, especially in the period after 2000, which is consistent with atmospheric warming and decreasing precipitation (Bolch and others, Reference Bolch2012; Yao and others, Reference Yao2012; Azam and others, Reference Azam2018). The main exception to this trend is the nearly balanced mass budget of glaciers in the Karakoram since the 1970s (Bolch and others, Reference Bolch, Pieczonka, Mukherjee and Shea2017; Zhou and others, Reference Zhou, Li and Li2017) and a significant acceleration of glacier mass loss since ~2000 in Lahaul-Spiti, western Himalaya (Azam and others, Reference Azam2018; Mukherjee and others, Reference Mukherjee, Bhattacharya, Pieczonka, Ghosh and Bolch2018). Glaciers in the mid-east Himalaya are more sensitive to climate change than those in the western Himalaya and their rates of decline are greater (Azam and others, Reference Azam2018). These contrasting spatial patterns of glacier mass balance result in faster glacial lake growth in the central Himalaya compared with the western part (Gardelle and others, Reference Gardelle, Arnaud and Berthier2011; Wang and others, Reference Wang and Zhang2014). Glacier–lake interaction has also been observed in southeast Tibet (Liu and others, Reference Liu, Guo, Nie, Liu and Xu2016), in the central Himalaya (Jiang and others, Reference Jiang2018; King and others, Reference King, Dehecq, Quincey and Carrivick2018) and Sikkim Himalaya (Basnett and others, Reference Basnett, Kulkarni and Bolch2013). These studies have shown that lake-terminating glaciers retreat faster than land-terminating glaciers (Basnett and others, Reference Basnett, Kulkarni and Bolch2013; Liu and others, Reference Liu, Guo, Nie, Liu and Xu2016; Jiang and others, Reference Jiang2018). The wide distribution of glacial lakes in the Himalaya (Zhang and others, Reference Zhang, Yao, Xie, Wang and Yang2015) could have accelerated the retreat of their mother glaciers in other regions of the Third Pole.
Eight lakes are considered as potentially dangerous (Chen and others, Reference Chen, Cui, Li, Yang and Qi2007b; Wang and others, Reference Wang and Zhang2014, Reference Wang and Jiao2015), show rapid rates of expansion over recent decades. Two of them (Cirenmaco and Jialongco) have a historical record of GLOFs (Table 2). Triggered by external factors such as strong precipitation, extreme temperatures, ice avalanche and earthquake, outbursts from these lakes pose a significant threat to downstream communities. As lake-terminating glaciers further retreat, lakes such as Youmojanco and Lake no. 11 can expand rapidly up-glacier until they have reached their possible maximum extents bounded by topography. For such situations, the GLOF hazard potential can continue to increase into the future, as potential flood magnitudes increase, and as the lakes eventually advance towards steep mountain headwalls from which ice or rock avalanches become more likely (Allen and others, Reference Allen2016).
5.2 Glacier and lake variation in response to climate change
Temperature in the central Himalaya has increased significantly since the 1960s (Fig. S6a). The warming rate observed at the Nyalam station was 0.024 ± 0.004 °C a−1 (p < 0.01) between 1967 and 2017 (Fig. S6c). The increasing temperatures have probably driven the accelerated melting of glaciers as elsewhere (King and others, Reference King, Quincey, Carrivick and Rowan2017; Wang and others, Reference Wang2017; Xiang and others, Reference Xiang2018). A heterogeneous pattern of precipitation for the 1960–2013 period was found in the central Himalaya (Fig. S6b). The precipitation observed at the Nyalam station showed a decreasing trend with a rate of −0.76 ± 1.34 mm a−1 (although not statistically significant) (Fig. S6d). In addition, the precipitation for the entire Himalaya over the past few decades has a decreasing trend (Yao and others, Reference Yao2012). This trend suggests that it is glacier melting and calving that has played the dominant role in driving the observed lake enlargement.
5.3 Future lake development
In the most recent decade (2010–2017), the glacial lake area (⩾0.02 km2) expanded by ~1.1%, which is significantly smaller than changes during 1970s–2010 (also reported by Wang and others (Reference Wang and Zhang2014) and Chen and others (Reference Chen, Cui, Li, Yang and Qi2007b)). The rate of increase slowed down after 2010, indicating that many lakes have reached their maximum extent bounded by an abrupt steeping of topography. For example, the expansion of Cirenmaco, which is prone to GLOFs (Wang and others, Reference Wang2018), has stopped expanding after 2010, as the lake has reached a steep topographic step and cannot expand further upslope (Fig. 6). This means that the current volume of this dangerous lake can be used to reasonably estimate maximum flood magnitudes that could also occur in the future, reducing uncertainty in future risk reduction strategies relating to this lake.
Future lake developments were estimated using GlabTop (Linsbauer and others, Reference Linsbauer2016). The bed overdeepenings at slow flowing termini could be slightly overestimated by GlabTop as the flow of glaciers is not considered in this model (Pieczonka and others, Reference Pieczonka, Bolch, KrÖHnert, Peters and Liu2018). Uncertainties in the overdeepenings can result from the resolution and offset between SRTM DTM and the glacier outlines. The eight PDGLs considered in this study are fed from debris-free glaciers. Typically such lakes will have longer lifetimes, as sediment delivery into lakes from debris-free glaciers is less, although higher rates of erosion and sediment delivery may occur under the effects of rapid atmospheric warming (Linsbauer and others, Reference Linsbauer2016). Timelines for future lake expansion given in this study are rough estimates only, because of uncertainties in future climate scenarios and glacier dynamics. Nonetheless, these results highlight the need for decision-makers to consider long-term planning, and risk reduction strategies must consider that future flood volumes may for some lakes far exceed historical dimensions (Haeberli and others, Reference Haeberli, Linsbauer, Cochachin, Salazar and Fischer2016).
Warming of 2.1 ± 0.1 °C by the end of 21st century could occur in the high mountains of Asia with the projected global temperature rise of 1.5 °C (Kraaijenbrink and others, Reference Kraaijenbrink, Bierkens, Lutz and Immerzeel2017). Under this scenario, approximately half of the glacier ice in the central Himalaya is projected to disappear (Kraaijenbrink and others, Reference Kraaijenbrink, Bierkens, Lutz and Immerzeel2017). As demonstrated for the Poiqu River basin, this future loss of glacier mass will almost certainly be associated with increased glacial lake area, and a corresponding increasing threat to villages downstream.
6. CONCLUSIONS
The Poiqu river basin is prone to GLOFs, and recent and future lake development should be carefully monitored to improve the prediction of such events, and to estimate likely flood volumes. We extended the record of glacial-lake evolution to before the 1970s, by using high resolution KH-4A images from 1964, to the present, using Landsat 8 data of 2017. Specifically, we examined lake area changes in detail using 25 intervals between 1964 and 2017. The dense time series of lake-area observations helps to examine shifts in their different development phases, and the evolution of lakes considered as potentially dangerous. The total area of glacial lakes between 1964 and 2017 has greatly increased, predominantly from large lakes (area ⩾0.02 km2) and moraine-dammed lakes.
Monitoring lake-terminating glacier changes is important for evaluating lake expansion and related GLOF potential, and is lacking in previous studies from this important trans-boundary basin. Here, we revealed a mean change rate of −0.56 ± 0.02% a−1 in glacier areas and of −0.39 ± 0.13 m a−1 in glacier thickness over the whole Poiqu River basin for the period 1974–2017. Larger ice-front position retreat (258 ± 61 to 1410 ± 58 m), shrinkage rate (−0.62 ± 0.01% a−1) and thinning rates (−0.71 ± 0.05 m a−1) are found for eight PDGLs.
Modelling of future glacial-lake developments reveals 74 potential new lakes (>0.01 km2) and expansion of lake boundaries. Because of topographic controls, four of the eight potentially dangerous lakes have already reached their maximum extents and have stopped expanding, even though their parent glaciers are still retreating. Two lakes should soon reach their maximum extents; and the remaining two will continue to expand to reach their maximum topographically-controlled extents by ~2110–2400 (Youmojanco) and 2060–2200 (Lake no. 11). This wide range of dates encompasses different future expansion scenarios, considering slowdown or acceleration of current expansion rates.
The state-of-the-art evaluation of glacier–lake interactions in the Poiqu River basin presented here emphasises that the examination of coupled glacier and lake change is necessary to understand how catchment scale processes are evolving. Beyond the hazard potential from the eight PDGLs considered in this study, it should also be recognised that rapidly evolving glacial lakes can represent opportunities, as attractive landscape features for tourism, and as a water resource.
SUPPLEMENTARY MATERIAL
The supplementary material for this article can be found at https://doi.org/10.1017/jog.2019.13
ACKNOWLEDGEMENTS
This study was supported by grants from the Natural Science Foundation of China (41871056, 21661132003, 41571068, 41571061 and 41771088), the Strategic Priority Research Program (A) of the Chinese Academy of Sciences (XDA20060201), the Swiss National Science Foundation (project: “Recent and future EVOlution of Glacial LAkes in China (EVOGLAC)”, IZLCZ2_169979/1) and the Dragon 4 project funded by ESA (4000121469/17/I-NB). G. Zhang thanks the China Scholarship Council for supporting his visit to University of Zurich from December 2017 to December 2018 (no. 201704910339). TanDEM-X CoSSC data were provided by German Aerospace Center (DLR) with proposal ATI_HYDR7290. We thank the two anonymous reviewers and Dr Hester Jiskoot, SE/ACE for their constructive comments and edits.


 Open access