


Introduction
CHD affects 1% of live births in the United States every year. Reference Hoffman and Kaplan1 About 2–4% of these patients are born with complex single-ventricle heart disease and require the Fontan operation for palliation. Reference Hoffman and Kaplan1 With improvement in surgical techniques and post-operative care, 90% of these patients are now alive a decade after palliation, for a previously lethal condition. Reference dʼUdekem, Iyengar and Galati2 They require extensive resource utilisation Reference Dean, Hillman, McHugh and Gutgesell3,Reference Gajarski, Towbin and Garson4 and over time develop Fontan failure, lower quality of life, decreased exercise capacity, higher need for heart transplantation, and decreased survival. Reference Manlhiot, Knezevich, Radojewski, Cullen-Dean, Williams and McCrindle5–Reference Khairy, Ionescu-Ittu, Mackie, Abrahamowicz, Pilote and Marelli7 Atz AM et al. reported a significant decrease in exercise performance over a decade of follow-up in a well-characterised multicentre Fontan cohort with parallel maladaptive cardiac remodelling over time. Reference Atz, Zak and Mahony8
Exercise training is an established, safe, and effective strategy to improve functional health status and quality of life in patients after the Fontan operation. Reference Sutherland, Jones and dʼUdekem9 Prolonged and intensive endurance training leads to cardiac remodelling in previously sedentary healthy young adults like those observed in elite athletes. Reference Arbab-Zadeh, Perhonen and Howden10 The left ventricle responds with early concentric remodelling and after 6–9 month of training dilates to restore the baseline mass to volume ratio, whereas the right ventricle responds to endurance training with eccentric remodelling at all levels of training. Reference Arbab-Zadeh, Perhonen and Howden10 Although the benefits of structured exercise training in patients after the Fontan operation are well established, the high-resolution cardiac morphologic adaptations and mechanism of improved oxygen uptake associated with structured training remain unknown. Reference Sutherland, Jones and dʼUdekem9 The central hypothesis of this pilot study is that short-term exercise training induces cardiac remodelling and parallels improvement in exercise capacity in Fontan patients. To test this hypothesis, we prescribed a progressive endurance-based training programme to patients with a history of Fontan operation and assessed their cardiac and liver morphologic adaptation after 3 months of training using state-of-the-art cardiac MRI techniques.
Materials and methods
All patients completed exercise testing, cardiac MRI, liver MR elastography, and quality-of-life questionnaires before and after the training programme. The training stimulus was similar to previous training studies completed in our lab for sedentary adults with CHD. Reference Shafer, Janssen and Carrick-Ranson11
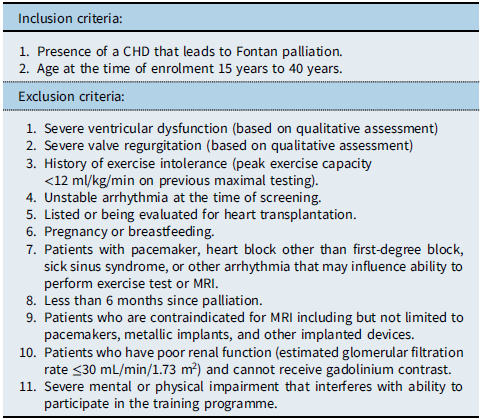
Patients were referred by their primary cardiologists and screened further by the principal investigator, with a thorough chart review and patient interview, prior to obtaining informed consent from the patient/parent/legal guardian for participation in the study. The inclusion criteria and exclusion criteria are summarised in Table 1. The study was approved by the Institutional review board of University of Texas Southwestern Medical Center at Dallas and Presbyterian Hospital of Dallas, and the procedures used in this study adhere to the tenets of the Declaration of Helsinki.
Inclusion and exclusion criteria
The details of testing and training are summarised below:
Exercise testing
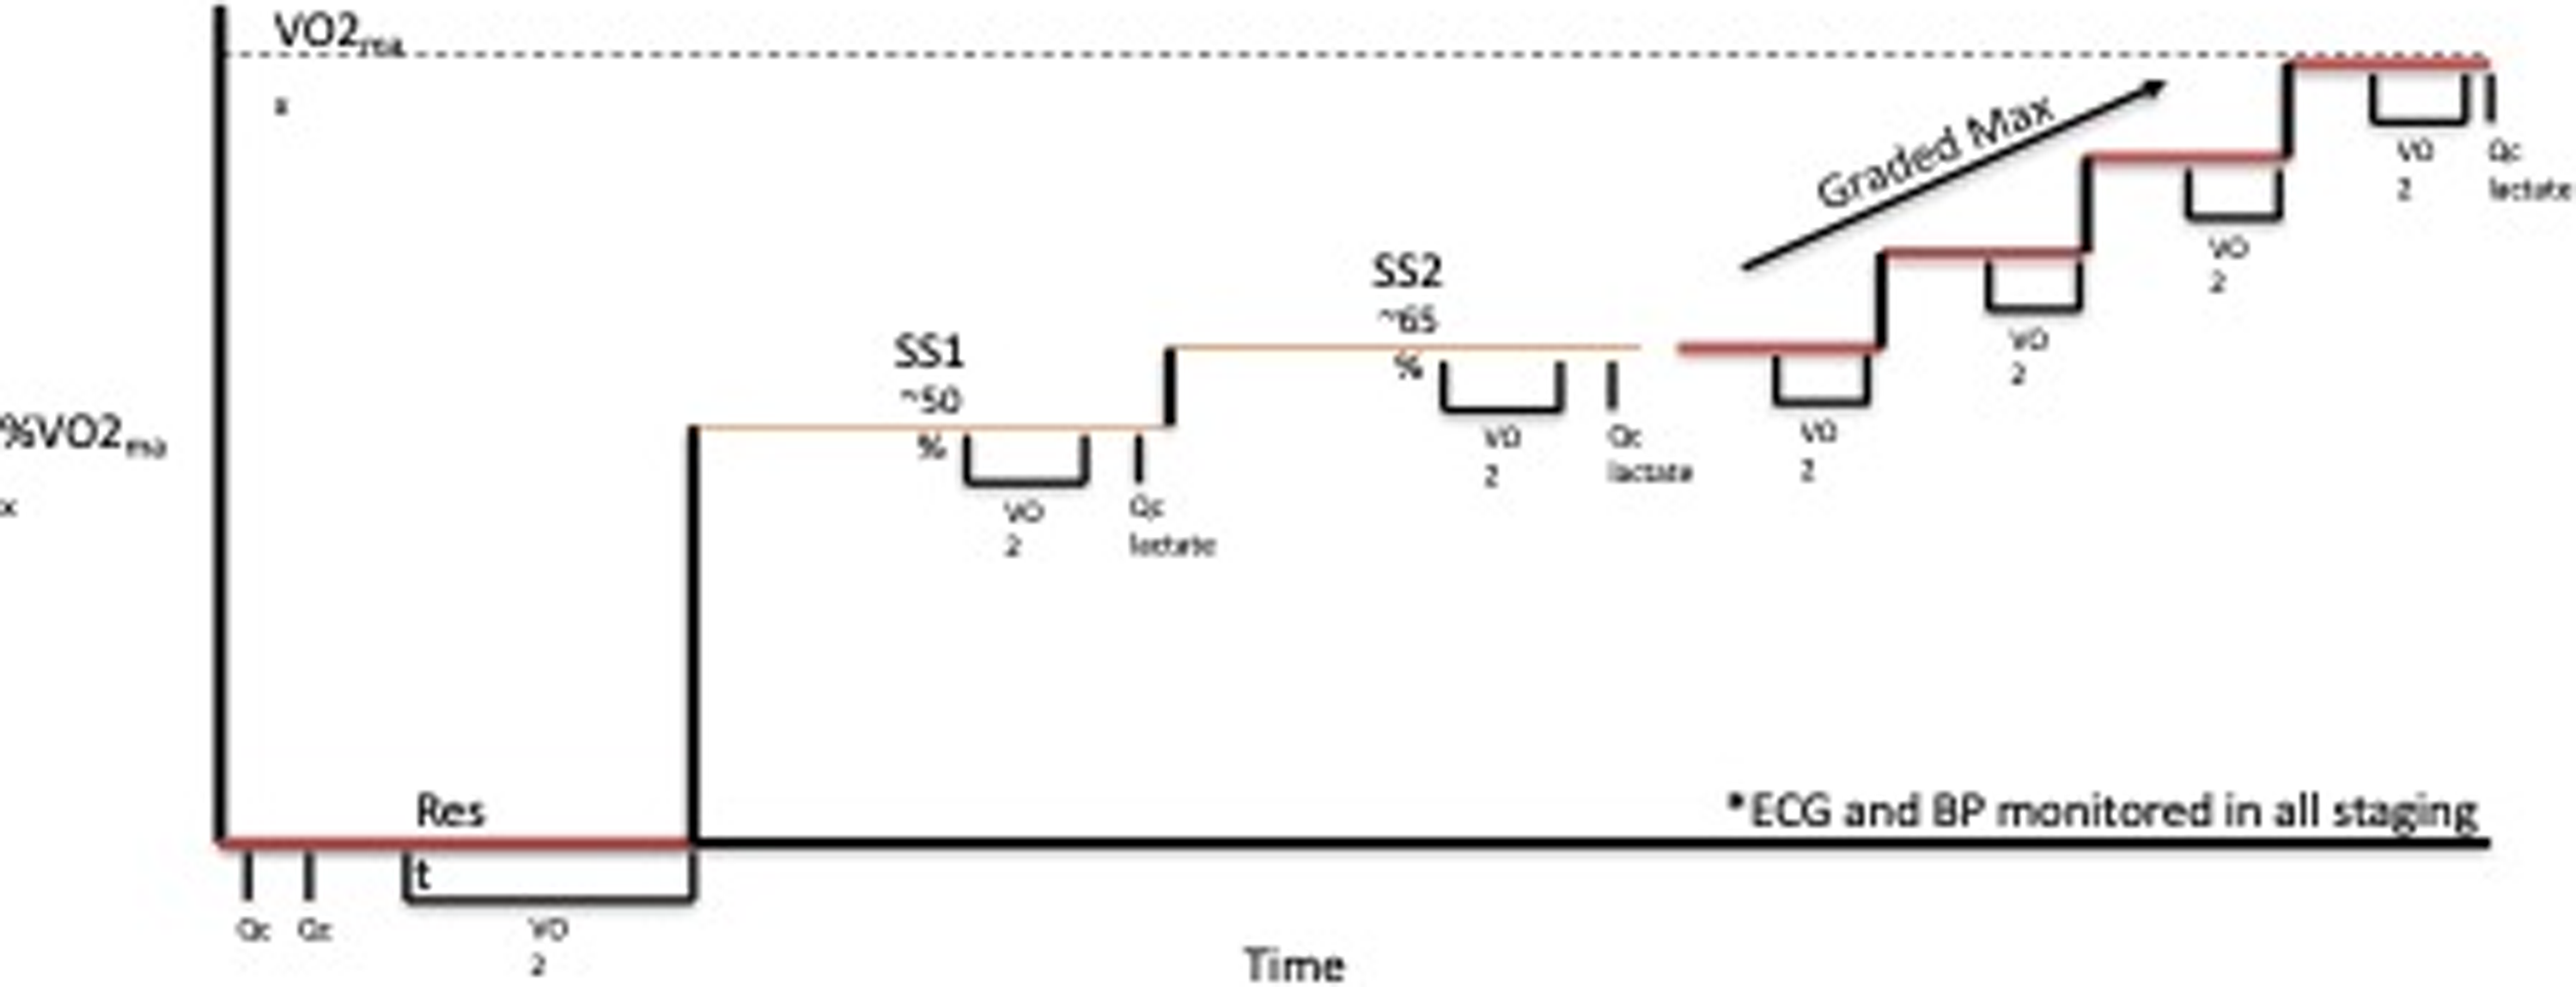
Testing was completed on a treadmill with all measurements made with the patients standing quietly, at 2 submaximal steady state (SS) work rates (5 minutes each) at ≈50% (SS1) and 65% (SS2) of peak work rate, and during an incremental test to maximum effort. During initial familiarisation sessions, two speeds were chosen for each patient: a brisk walking pace (usually 3.0–4.0 mph) and a comfortable jogging speed (generally 5–8 mph). These constant speeds were used for each subsequent test. After a brief rest, the incremental portion of the test was performed at the second submaximal speed, with the grade increased by 2% every 2 minutes until subjective exhaustion, despite vigorous encouragement (Fig. 1). Measures of ventilatory gas exchange were made with the use of the Douglas bag technique. Gas fractions were analysed by mass spectrometry (Marquette MGA1100), and ventilatory volume was measured by a Tissot spirometer. VO2 max was defined as the highest VO2 measured from at least a 40-s Douglas bag. In nearly all cases, a plateau in VO2 was observed with increasing work rate, confirming the identification of VO2 max. In addition, heart rate was monitored continuously via ECG (Polar), and fingertip capillary blood was obtained during the second minute of each stage for measurement of lactate concentration. Acetylene rebreathing technique was used to measure effective pulmonary blood flow (Qp) with acetylene as the soluble gas and helium as the insoluble gas. Reference Agostoni, Cattadori and Apostolo12,Reference Hardin, Stoller and Lawley13 In this method, Qp is calculated from the disappearance rate of acetylene in expired air, measured with a mass spectrometer (Marquette Medical Systems), after adequate mixing in the lung has been confirmed by a stable helium concentration. This method has been validated to be a close estimate of Qc in our laboratory in normal patients against standard invasive techniques over a range of values of Qc from 2.75 to 27.00 l/min. Reference Hardin, Stoller and Lawley13 Qp was assumed to be equal to cardiac output (Qc) for the purpose of the current analysis with no adjustments made to account for fenestration or collateral related right to left shunts in this pilot.
Treadmill exercise test progression SS = steady state, Qc = cardiac output, VO2 = exercise capacity.
Cardiac MRI measurements
Cardiac MRI was performed on a 1.5 T Philips NT MRI Scanner. The cardiac MRI protocol included standard clinical imaging sequences to measure ventricular mechanics (i.e., size and function), T1 mapping both pre- and post-contrast administration and presence of late gadolinium enhancement to assess myocardial fibrosis. Extracellular volume was calculated using the pre- and post-contrast T1 measurements in the blood and myocardium, as well as the haematocrit. Reference Riesenkampff, Messroghli, Redington and Grosse-Wortmann14 The presence of late gadolinium enhancement was interpreted qualitatively in the myocardium according to the 17-segment left ventricular model and a 9-segment right ventricular model. Additionally, the extent of the wall thickness that is involved and the pattern of enhancement were also noted. MR flow imaging was performed using standard techniques to quantify cardiac output, collateral blood flow, and differential blood flow through the pulmonary arteries. Reference Fratz, Chung and Greil15 Paired flow imaging data was available for 4/5 patients.
Magnetic resonance elastography liver measurements
Magnetic resonance elastography was performed to measure liver stiffness, which is an indicator of liver fibrosis and congestion Reference Rathgeber, Guttman and Lee16 . The propagating shear waves passed through the liver using specialised equipment were imaged using a standard gradient echo-based phase contrast acquisition technique. The phase contrast images were automatically processed on the scanner to generate the stiffness maps (i.e., elastogram) using an inversion algorithm. Reference Muthupillai, Lomas, Rossman, Greenleaf, Manduca and Ehman17 Liver stiffness from magnetic resonance elastography was measured by placing regions of interest of at least 100 mm2 on the elastogram, with specific care taken to avoid the liver edge, artefacts, and large vessels greater than 3 mm in size. Regions of interests selected on all slices were averaged, and a mean stiffness measurement in kilopascals was obtained, such that a large volume of liver is assessed.
Quality-of-life questionnaires
Age-appropriate measures of quality of life were used to assess functional health status and quality of life. For patients <18 years of age, data were collected from both the patient and the parent. The Pediatric Quality of Life Inventory (PedsQL) cardiac disease specific module 3.0 was used for this assessment. Reference Varni, Seid and Kurtin18 This module is a disease specific module and has 27 items in 6 domains, namely heart problems (7 items), treatment (5 items), perceived physical appearance (3 items), treatment anxiety (4), cognitive problems (5 items), and communication (3 items), and assesses issues of quality of life specific to patients with cardiac disease. This system provides instruments for children (age 2–12 years), for teens (age 13–18), and for young adults (age 19–25 and older). Each of the instruments includes 23 items. These measures rely upon patient/parent self-reporting. The patients completed this assessment at the beginning and end of study to assess the effects of exercise training on disease-specific quality of life.
Exercise training
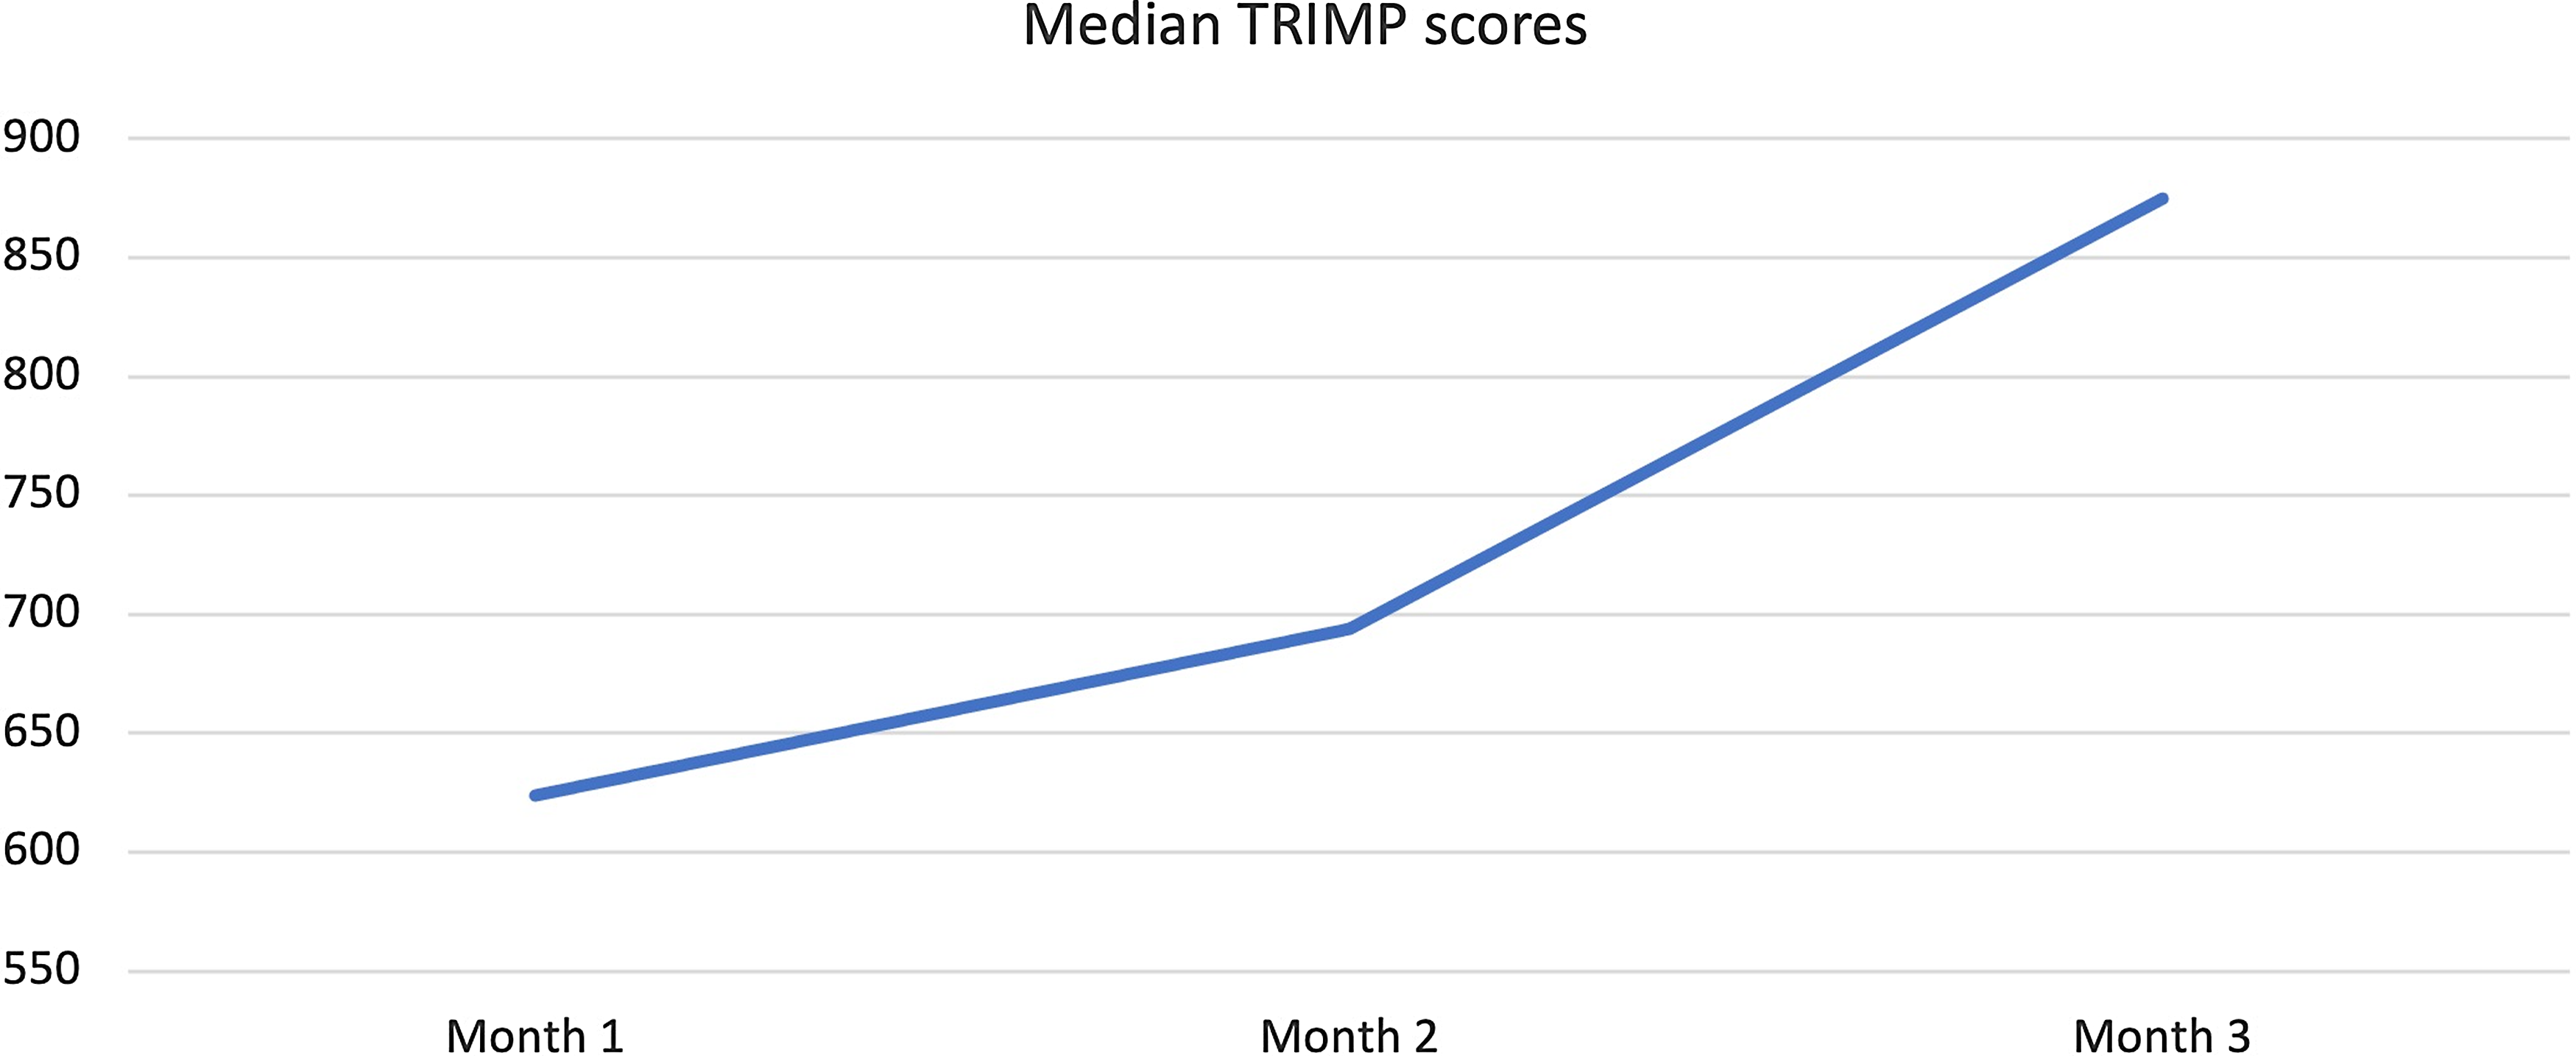
All patients participated in a 3-month-long endurance-based progressive training programme designed to improve fitness (Fig. 2). Target training heart rates were based on the initial exercise testing Reference Anderson and Rhodes19 and monitored throughout the training programme with heart rate monitors (Polar: Lake Success, NY, USA). Three types of exercise training workouts were completed during the study: (1) base pace – exercise at approximately 70–80% of patient’s maximal heart rate; (2) maximal steady state – 80–85% of the maximal heart rate (aiming just above the ventilator threshold); and (3) high-intensity interval training – intervals of exercise at ≥95% of patientsʼ maximal heart with intervals for recovery. There was a progressive increase in the number of sessions, exercise duration (minutes per exercise session), and intensity during the 3-month training period. Strength training sessions were also included at regular intervals in the training programme. Most training sessions were supervised by the physiologists in person and occurred at a gym close to the patient’s home with gym membership covered by the study budget to improve compliance with the programme. To confirm compliance with all sessions, the heart rate monitor data were uploaded to the research database and monitored by the exercise physiologists. "Training impulse" (TRIMP) scores were calculated using the Banister and Wenger method to determine training volumes (Fig. 3).
Schedule Template for the 3-month progressive training program.

Change in Median Training Impulse (TRIMP) Score during 3-months of training.
Statistical analysis
Descriptive statistics and confidence intervals are reported. Continuous variables are summarised with median and interquartile ranges. Individual responses were also examined graphically. Categorical variables, including any adverse events, were summarised in detail with descriptive statistics. The primary analysis comparing peak VO2 between baseline and the 3-month visit was conducted with Wilcoxon signed-rank test. Confidence intervals (95%) were constructed to estimate responses for each study visit and the difference between visits (post-exercise–pre-exercise). Post-exercise minus baseline (pre-exercise) changes were computed for all outcomes, including cardiorespiratory variables (e.g., VO2 max and Qc) and MRI indices of ventricular fibrosis, volumes, and mass. The correlations between variables at the baseline evaluation and ultimately between the post-exercise minus pre-changes (deltas) were evaluated with Pearson’s or Spearman’s correlation analysis. Hypothesis tests were two-sided at the 0.05 significance level. IBM SPSS Statistics for Windows, Version 26.0. Armonk, NY: IBM was used for statistical analysis.
Results
Five patients (four male and one female), with single-ventricle heart disease (two morphologic right ventricle, two morphologic left ventricle, and one with a dominant left/rudimentary right ventricle morphology), all with extracardiac conduit-type Fenestrated Fontan operation, 4/5 with a history of fenestration closure prior to study enrolment, Median (IQR) age 19.5 (17.6–21.3) years, weight 67.3 (64.6–67.6) kg, height 177 (169–178.7) cm, and time from Fontan operation 17.4 (13.8–18.6) years, participated in a 3-month-long, progressive, supervised training programme designed to improve endurance. All five patients had normal stroke volume function with only mild valve regurgitation and were on blood thinners (4/5 on aspirin and 1/5 on clopidogrel) and 2/5 on additional medications (ACE inhibitor and Digoxin) at the time of enrolment. There was no evidence of cyanosis at rest in any of the study participants, median (IQR) resting saturation 97 (95–98) with no significant change after training (p = 0.37). The patient with an open fenestration by history did not have any significant shunt through the fenestration noted on 3D imaging and had resting oxygen saturation of 95% with no change after 3 months of training. Additional anatomic and demographic details are summarised in Table 2. There was no significant change in body weight, resting oxygen saturations, and other haemodynamic parameters after 3 months of training (Table 3). No adverse events were reported during the training period.
Anatomic diagnosis and demographics for study participants
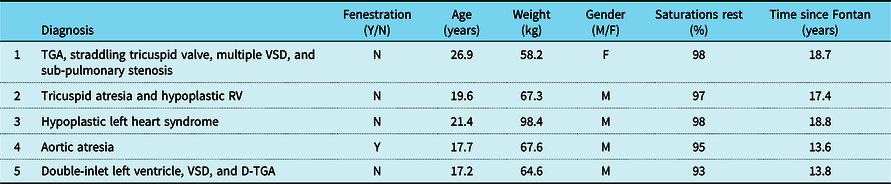
D-TGA = dextro-transposition of the great arteries; TGA = transposition of the great arteries; VSD = ventricular septal defect.
Change in haemodynamic, exercise, and MRI variables after 3-month training
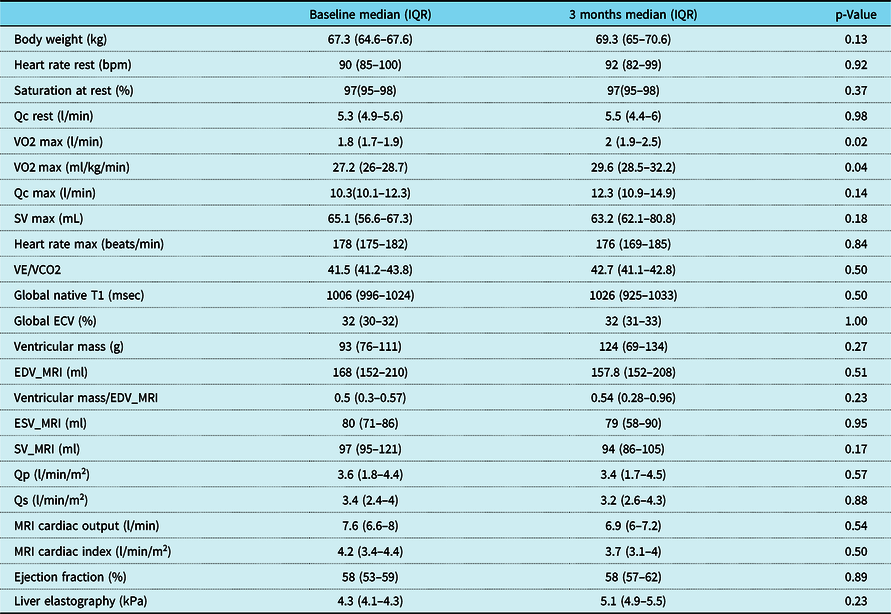
ECV = extracellular volume fraction; EDV_MRI = end-diastolic volume by MRI; ESV_MRI = end-systolic volume by MRI; Qc = cardiac output measured by C2H2 rebreathing method; Qp = pulmonary blood flow (MRI flow imaging); Qs = systemic blood flow (MRI flow imaging); SV = stroke volume measured by C2H2 rebreathing method; SV_MRI = stroke volume by MRI (volumetrics); VE/VCO2 = ventilation/CO2 fraction in expired air; VO2 = exercise capacity.
Training compliance
Median training compliance for the five patients was 80.5 (76.7–84) %. The median TRIMP scores increased from 624 (582–663) at baseline to 875 (746–893) at the end of the study reflecting progressive nature of the training programme (Fig 3). All except one patient, with a history of mild cognitive impairment, was able to record adherence in a satisfactory manner. This non-compliant patient was a teenager who had a history of mild cognitive impairment but did not have a formal neuropsychiatric diagnosis at the time of enrolment. He struggled with following specific instructions about training methods and recording progress. His impressive response to training suggested he likely still completed the sessions but struggled to document compliance in the prescribed format. Another patient struggled with interval training sessions due to history of anxiety and perceived chest pain during the higher intensity training sessions. We completed several supervised sessions with cardiopulmonary monitoring for this patient to provide reassurance, avoid major accommodations, and maintain the quality of the training programme. These interruptions in the training programme did not significantly affect training volume and this patient was able to complete the programme.
Maximal exercise
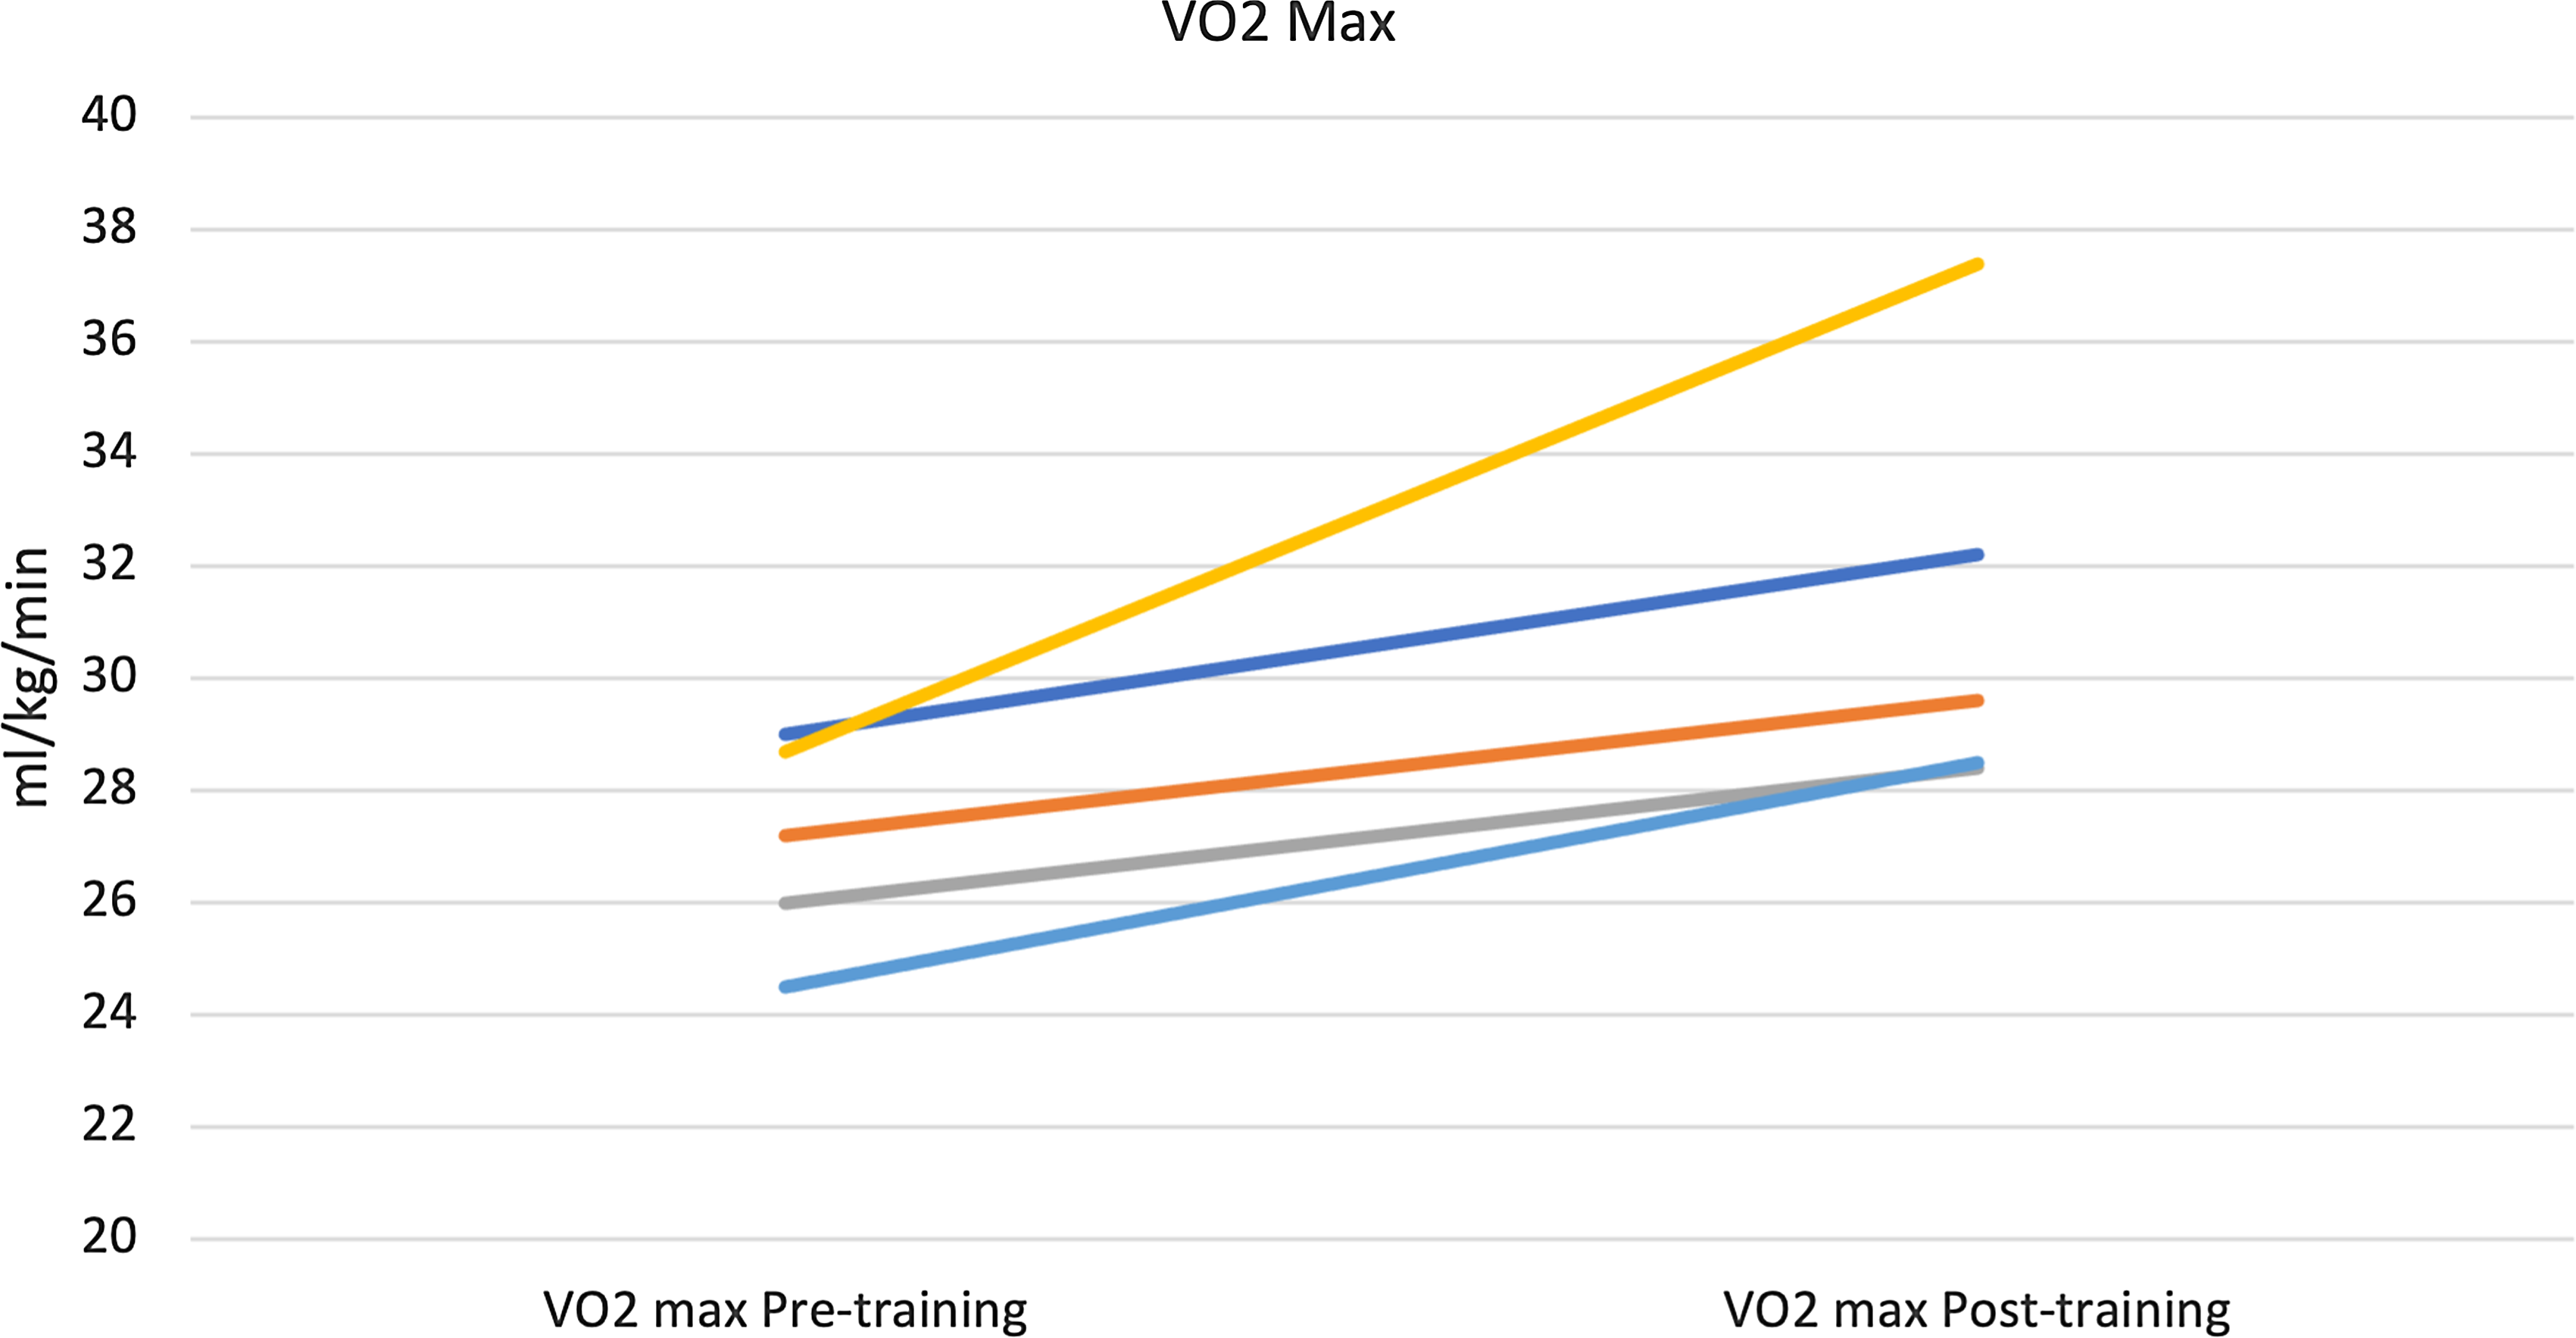
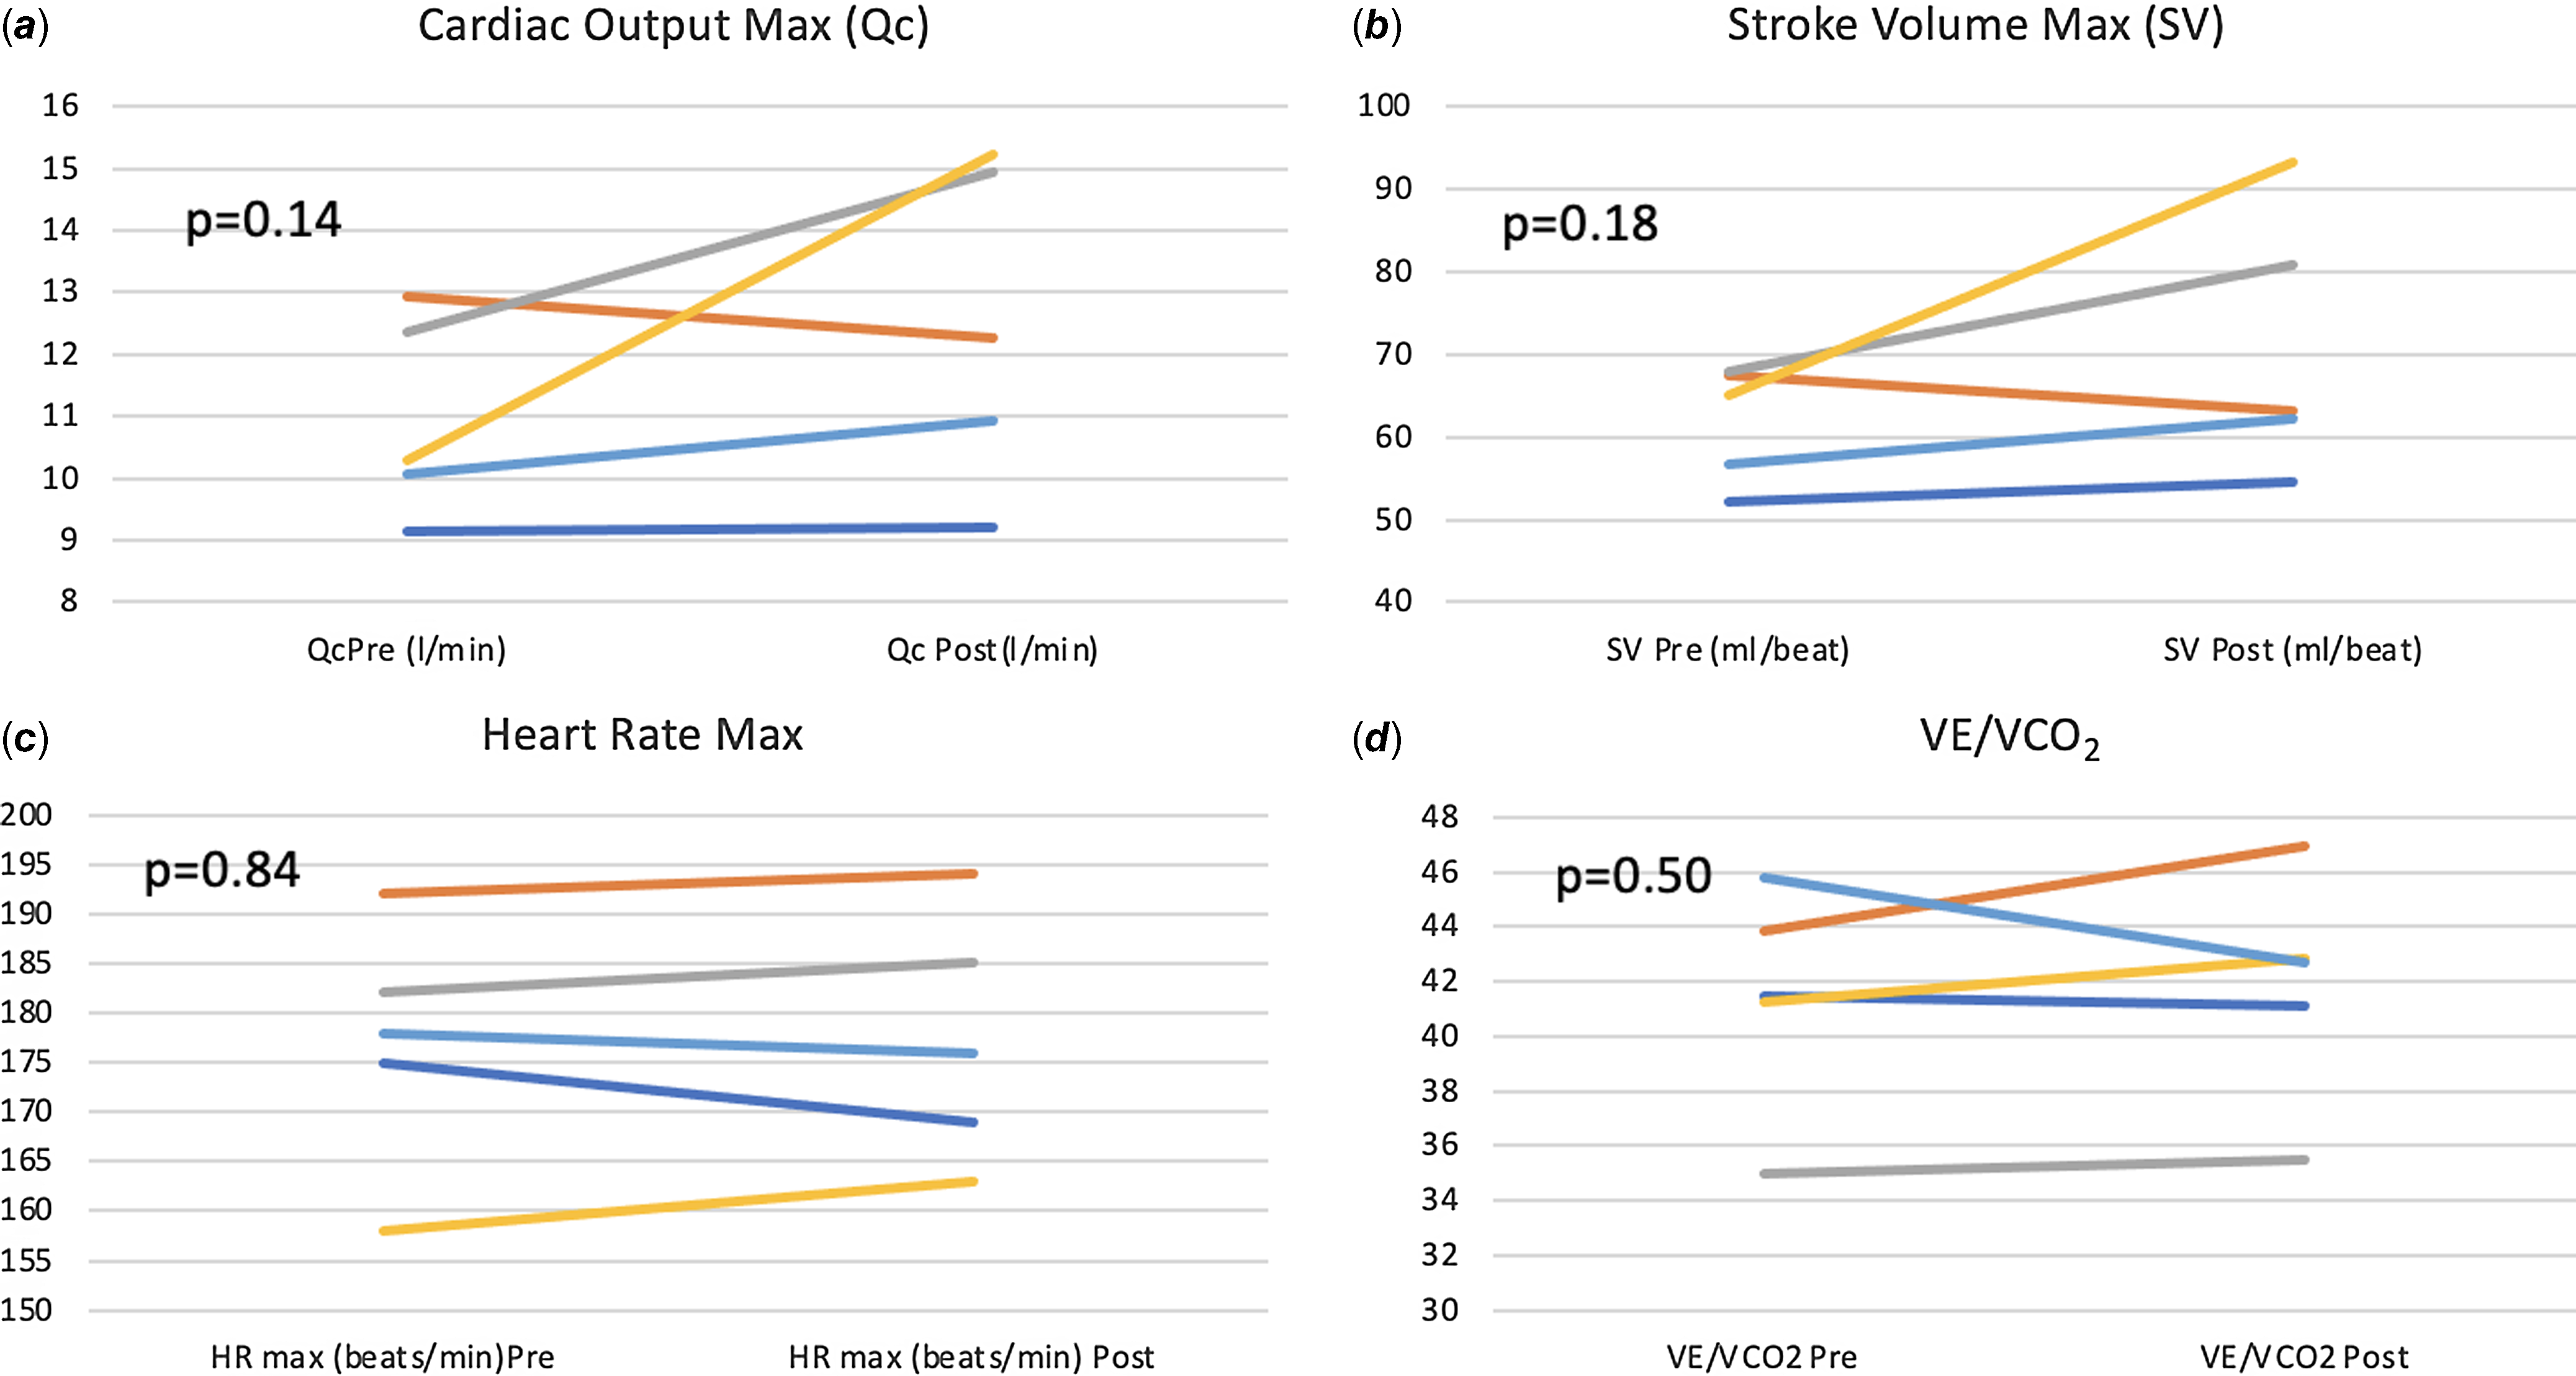
There was a significant improvement in maximal exercise capacity (VO2 max) from median (IQR) of 27.2 (26–28.7) to 29.6 (28.5–32.2) ml/min/kg (p = 0.04) (Fig. 4). This reflects an 8.8 % increase in peak VO2 with training compared to a 13% improvement observed after a similar programme by our same research team in healthy young individuals and better than the improvement noted in patients with transposition of the great arteries and a systemic right ventricle (6%). Reference Arbab-Zadeh, Perhonen and Howden10,Reference Shafer, Janssen and Carrick-Ranson11 There was an improvement in cardiac output (Qc) during maximal exercise testing (C2H2 rebreathing method) noted after 3 months of training from a median (IQR) of 10.3 (10.1–12.3) to 12.3 (10.9–14.9) l/min, and this change was variable (p = 0.14). Median changes from baseline in other exercise parameters after 3 months of training are summarised in Table 3. The changes from baseline in some of the exercise-based variables after 3 months of training for each patient are shown in Fig. 5.
Improvement in maximal exercise capacity (VO2 Max) after 3 months of training Median 27.2 to 29.6 ml/min/kg (p = 0.04).
Change from baseline in exercise-based variables after 3 months of training.
Cardiac remodelling
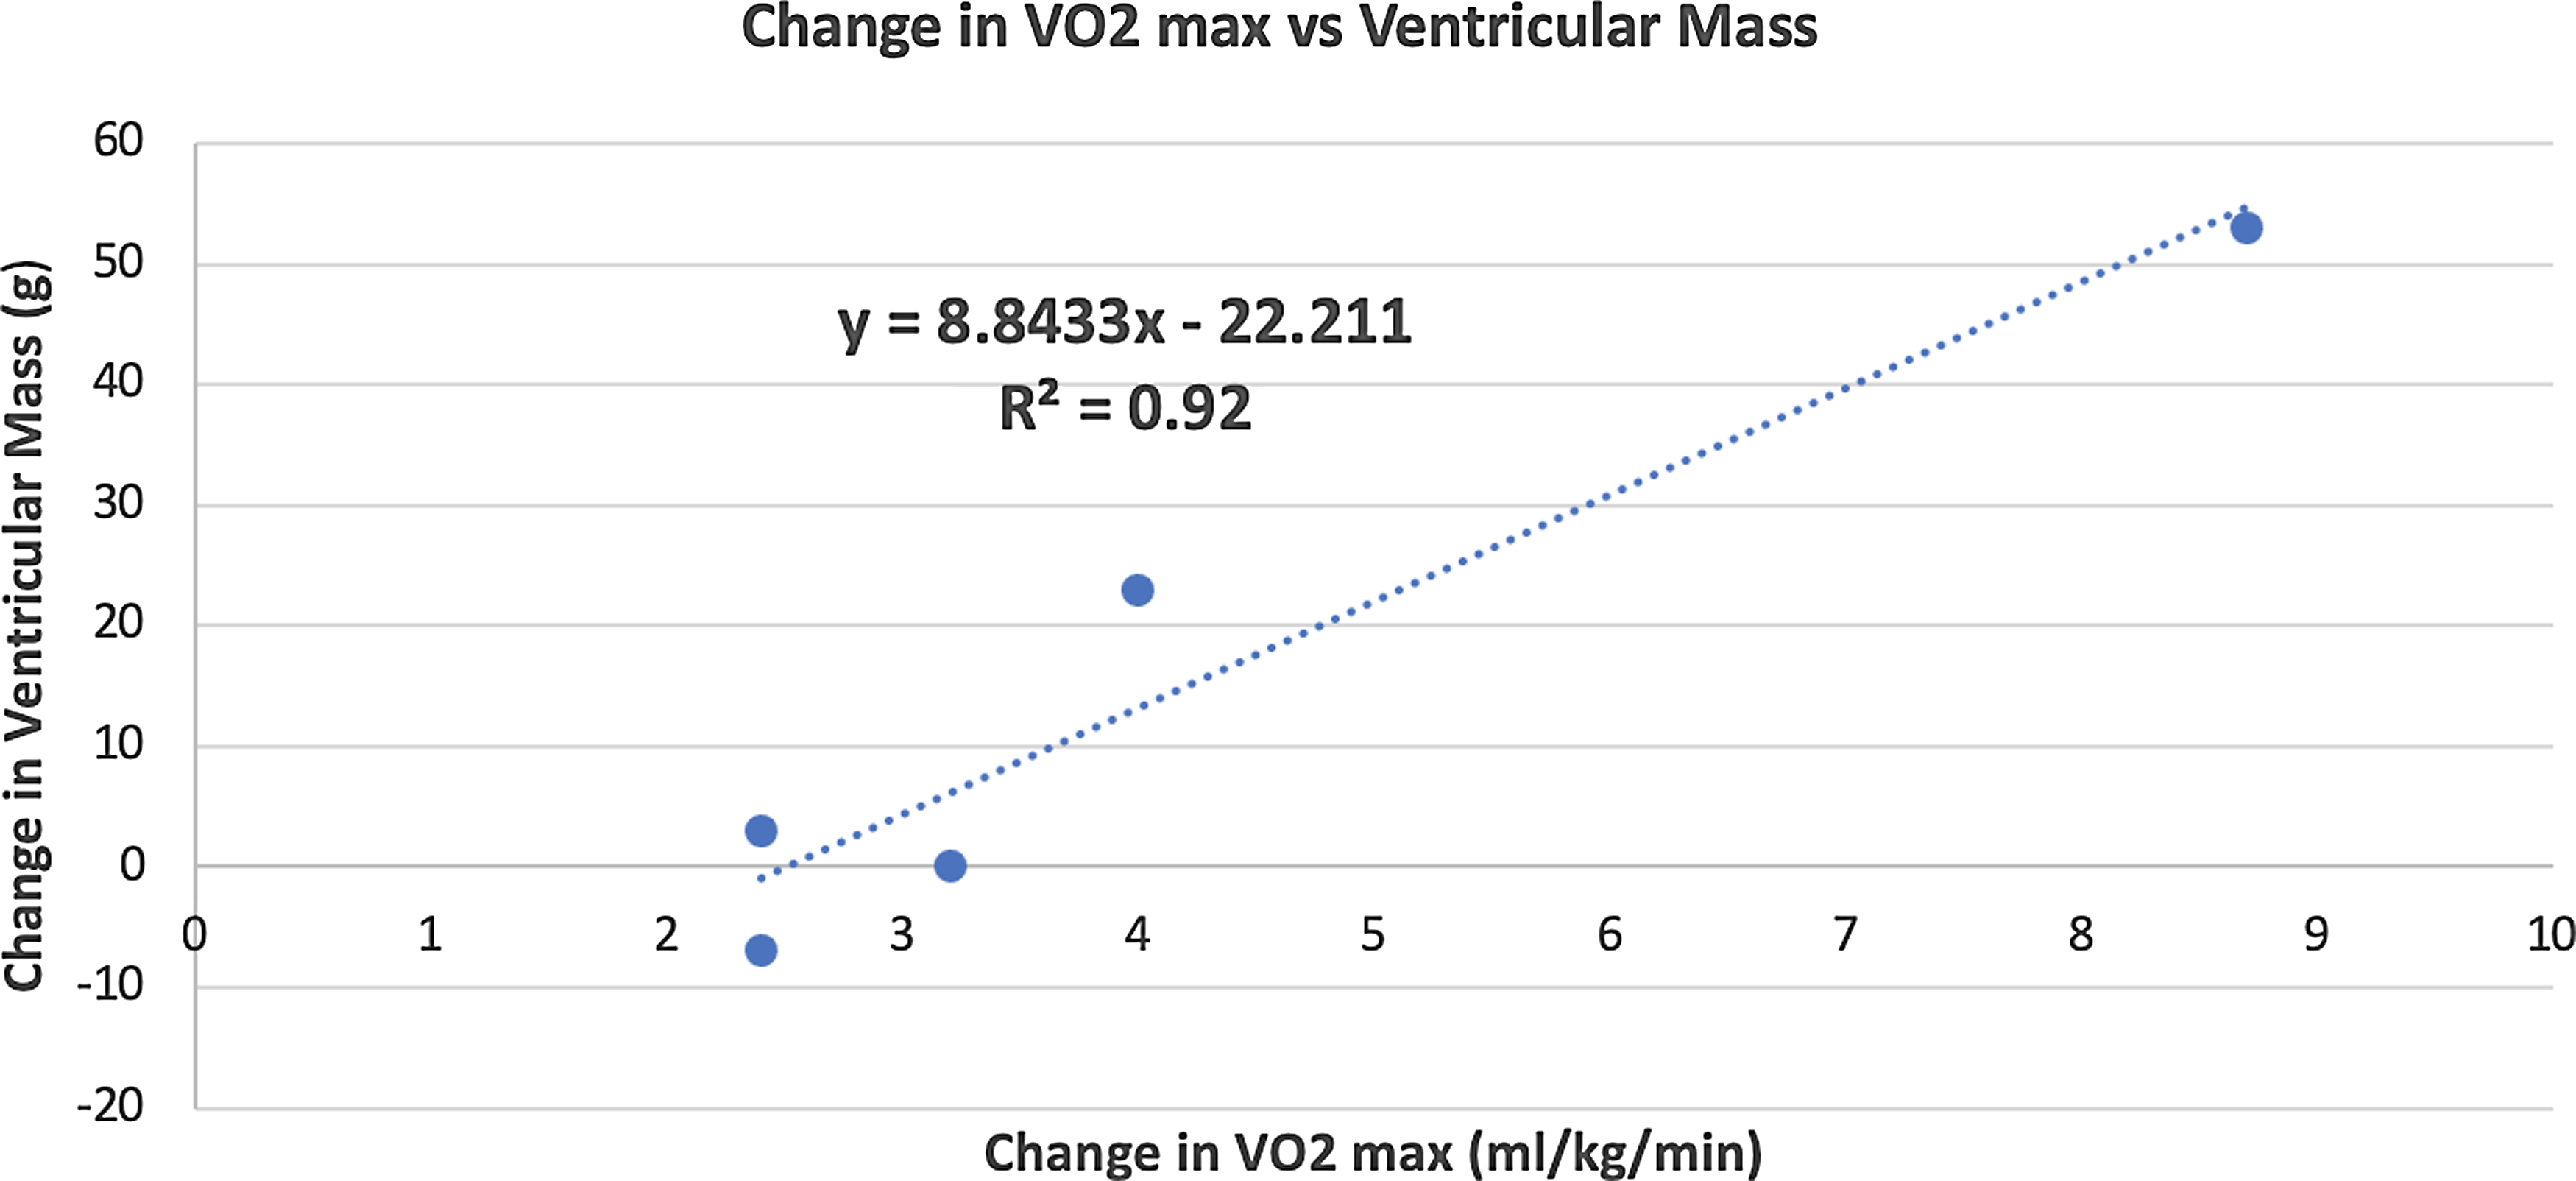
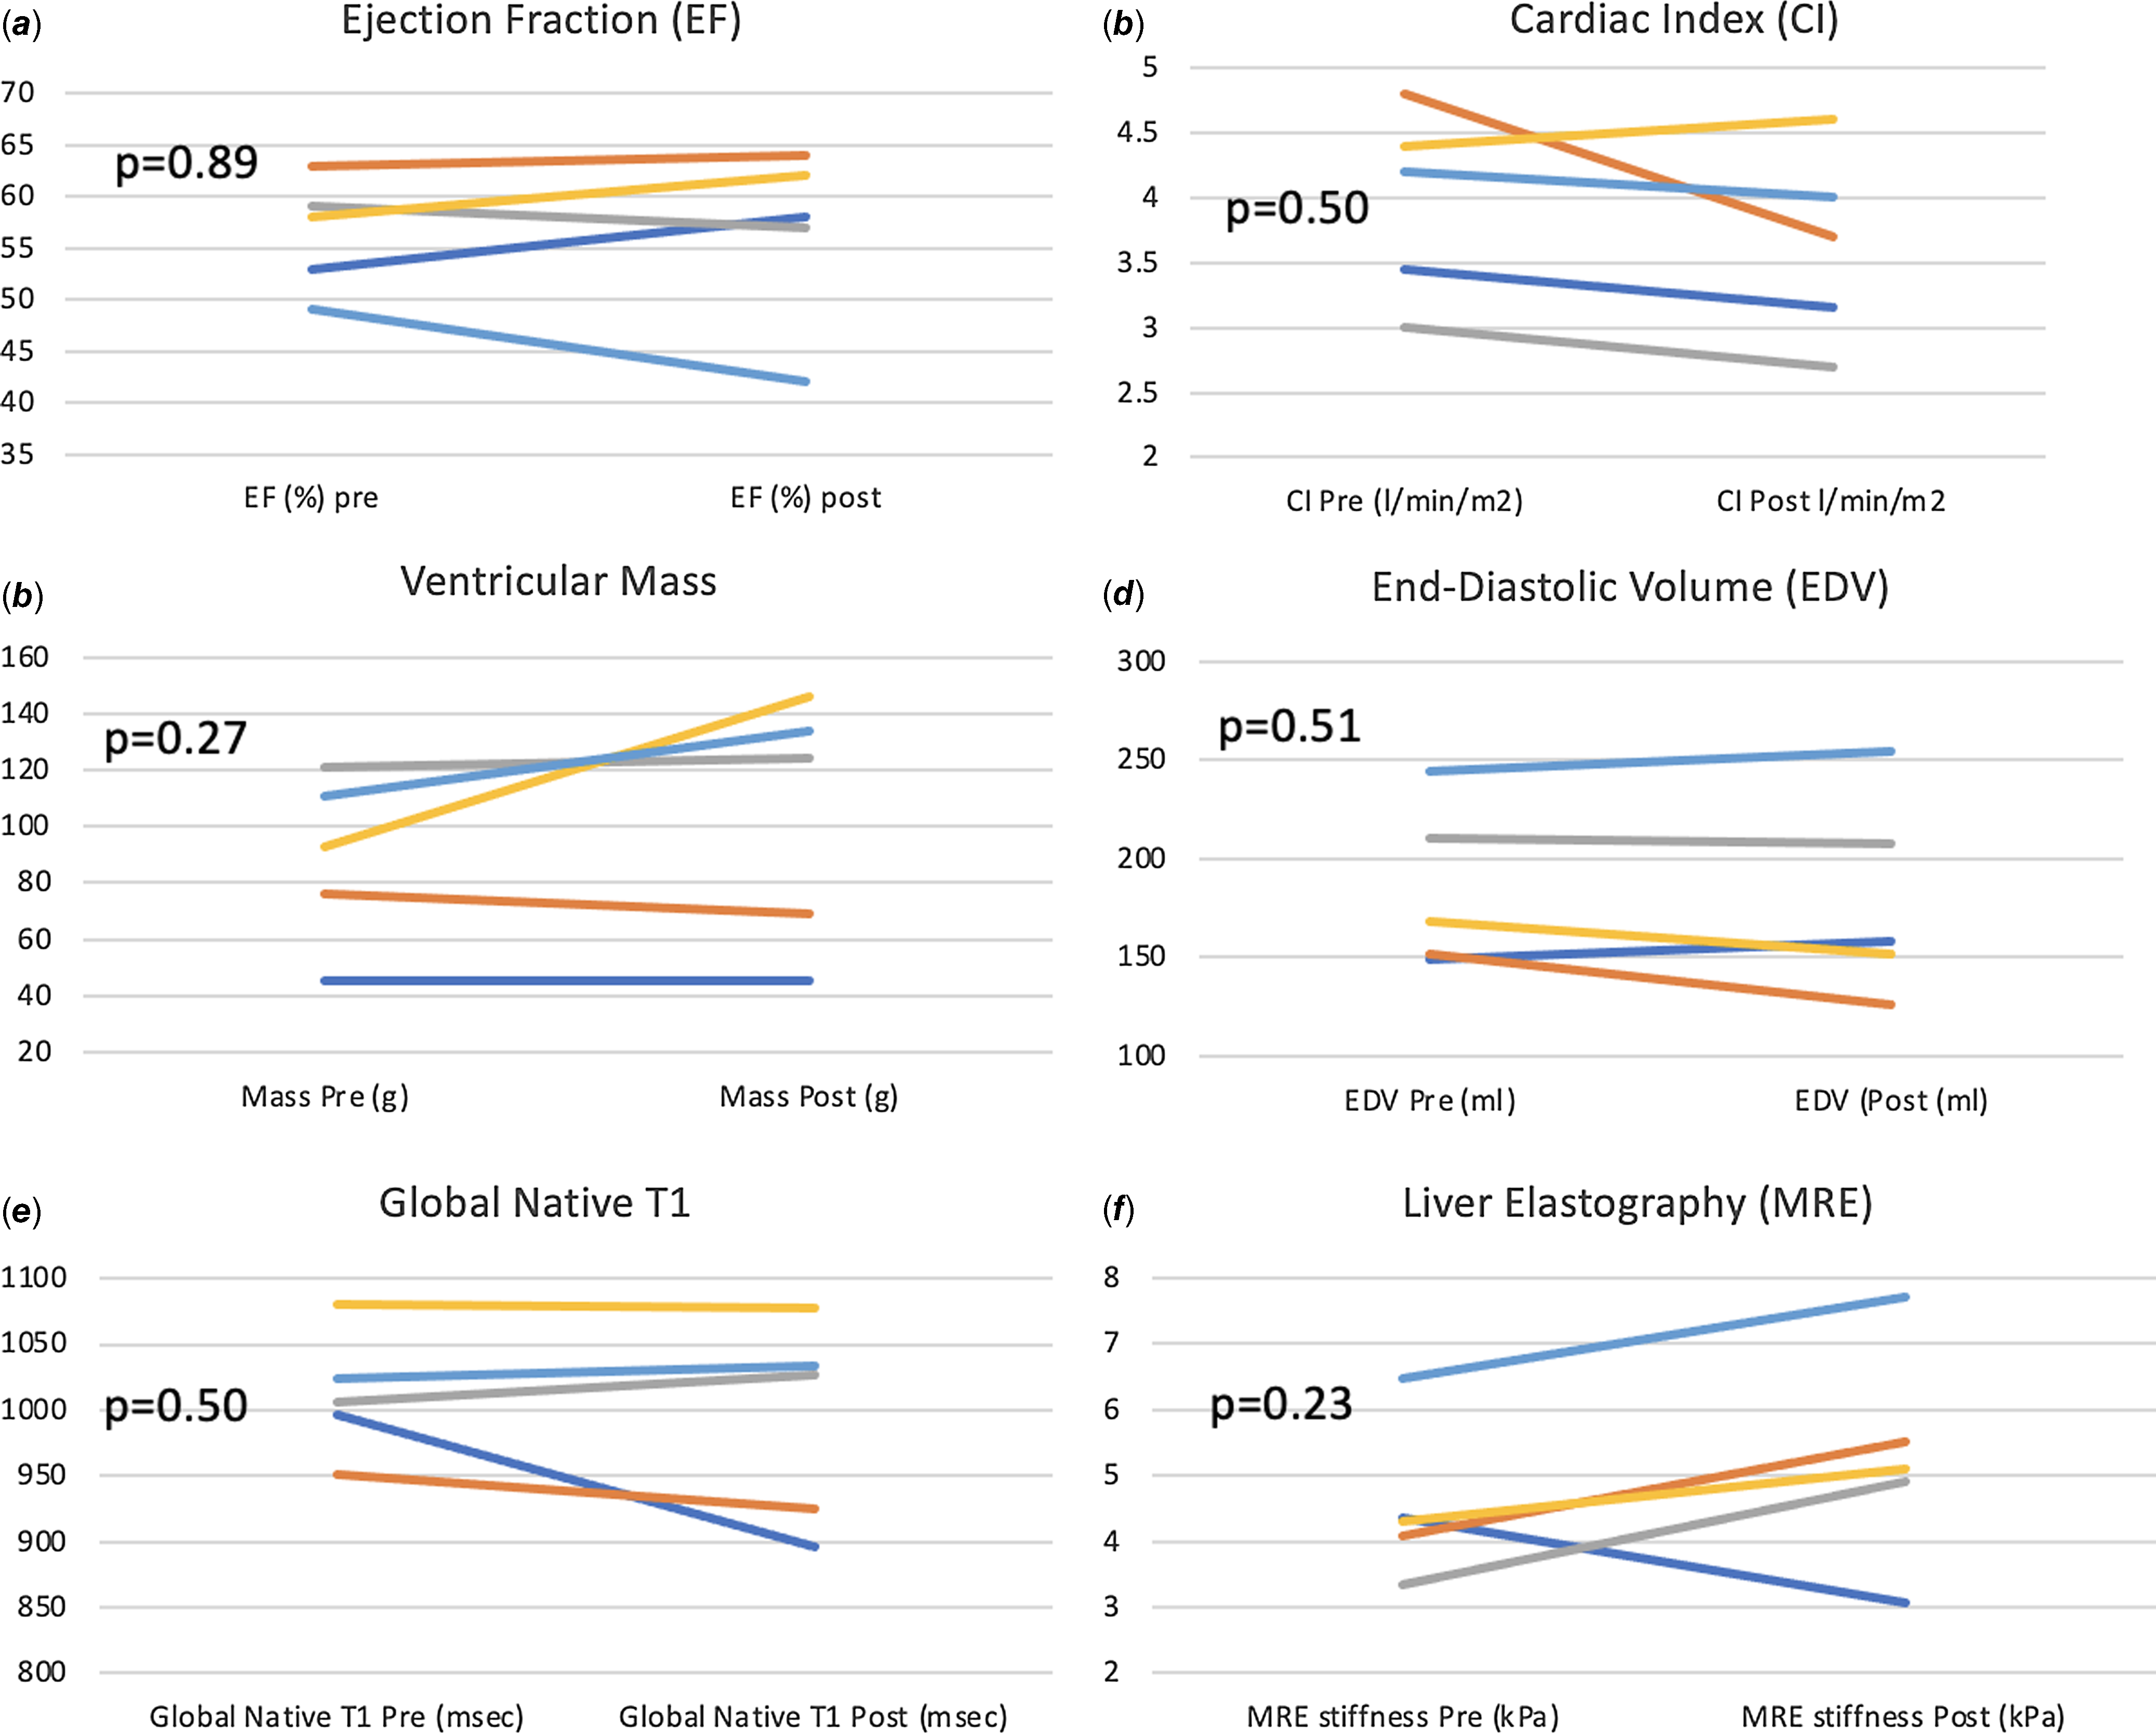
There was no statistically significant change in cardiac MRI-derived measures of single-ventricle function, volume, contractility, cardiac output (volumetric and flow-based assessments), and fibrosis. Improvement in VO2 max positively correlated with increase in ventricular mass (r = 0.95, p = 0.01) after 3 months of training (Fig. 6). The changes from baseline in some of the MRI-based variables after 3 months of training for each patient are shown in Fig. 7
Correlation between improvement in VO2 max and increase in ventricular mass after 3 months of training.
Change from baseline in MRI-based variables after 3 months of training.
Liver adaptation
There was no significant increase in liver stiffness as noted on magnetic resonance elastography after 3 months of training median (IQR) change: 1.23 (0.8–1.43) kPA (p = 0.22).
Quality of life
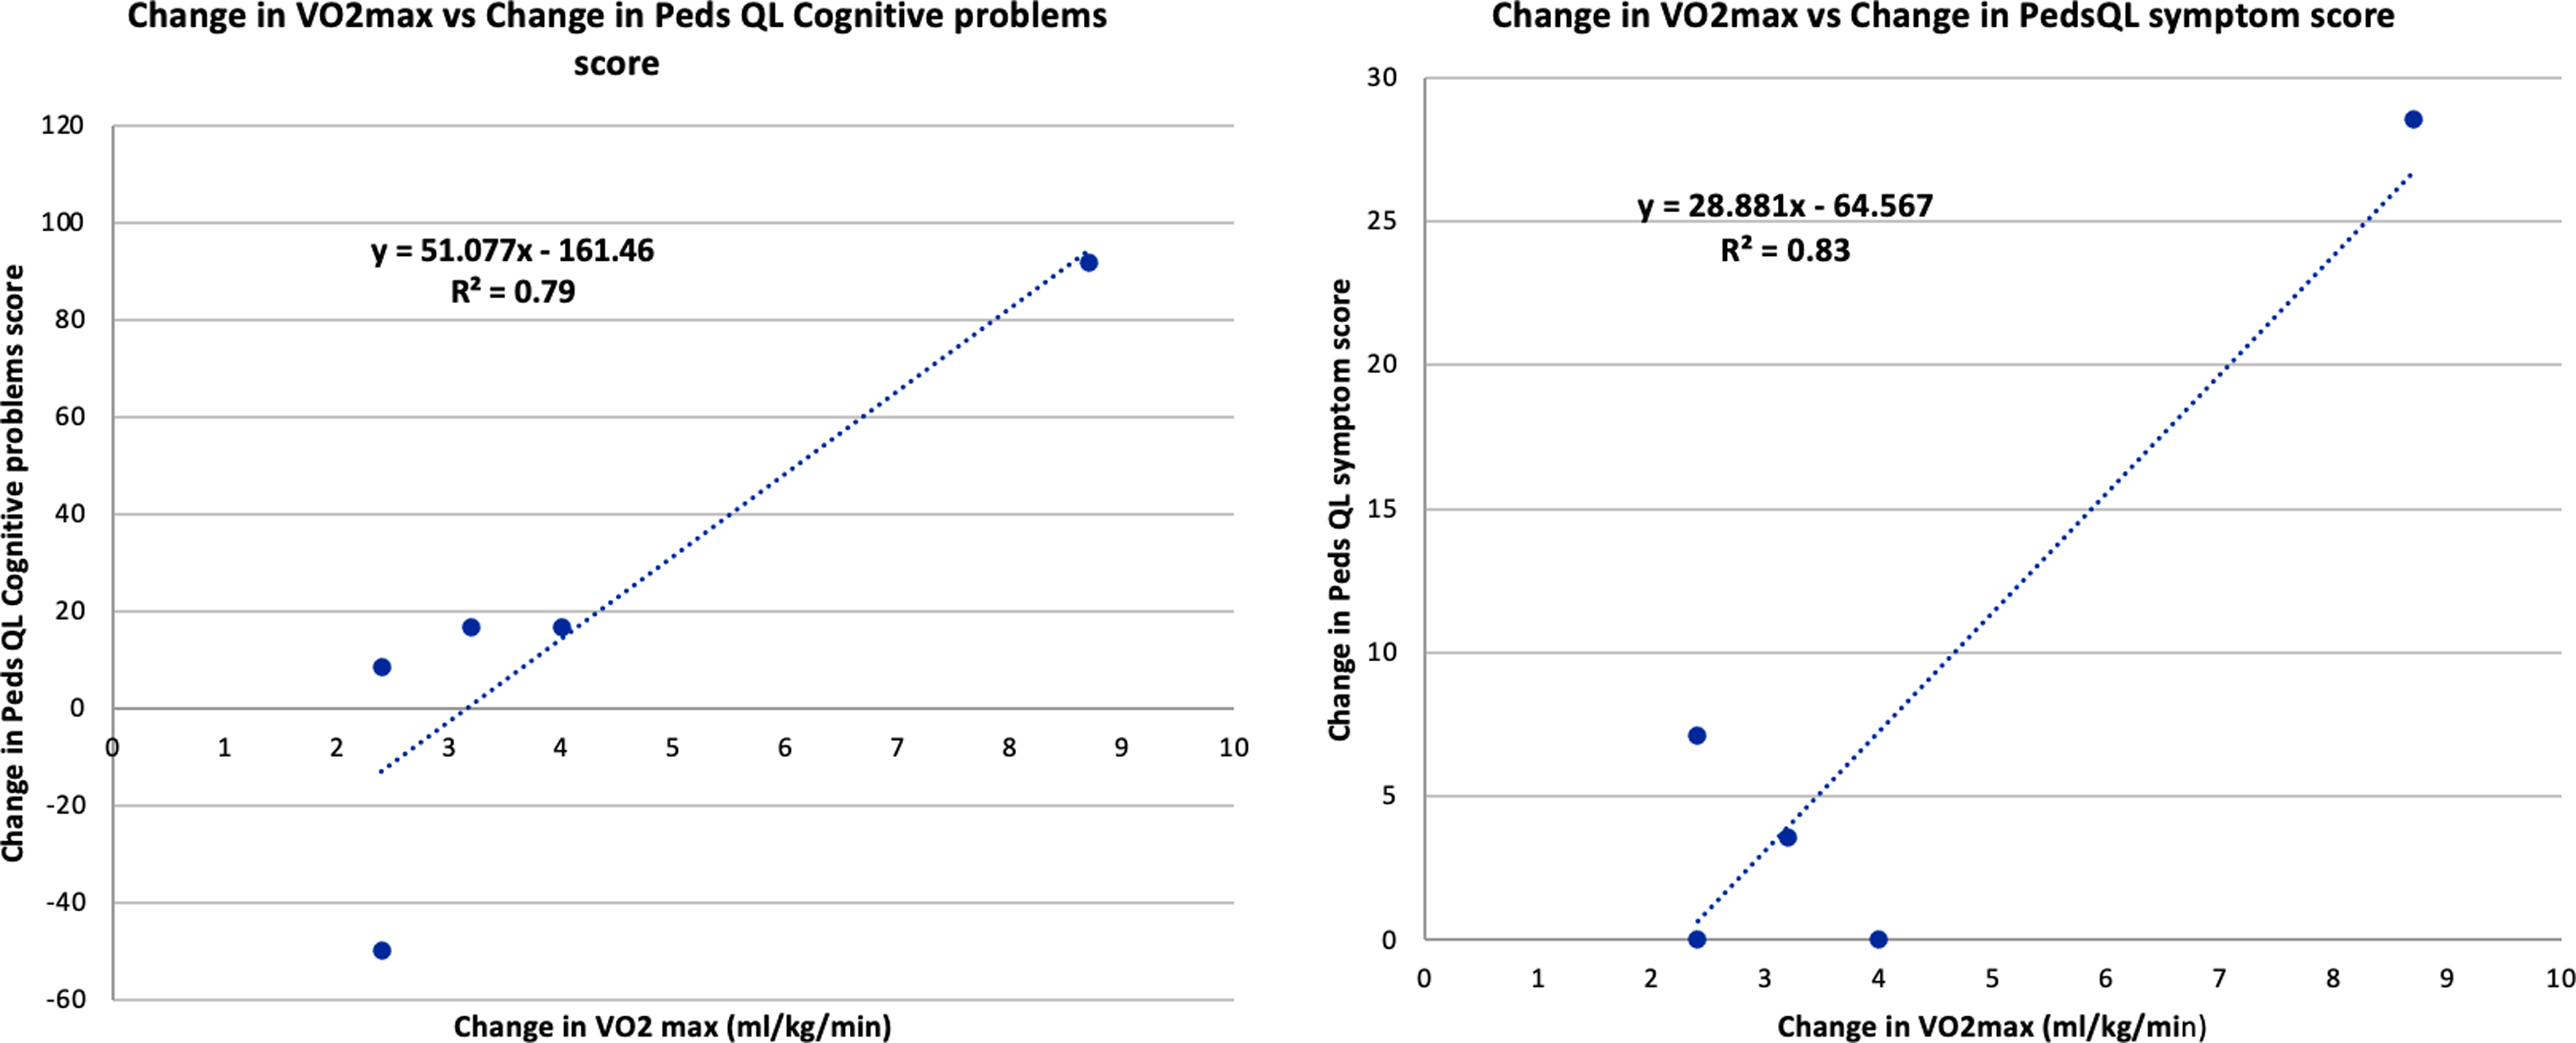
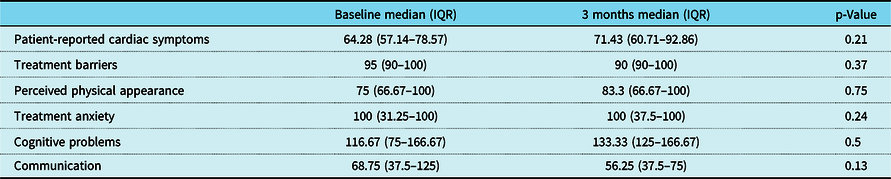
There was a trend towards improvement in most domains of disease-specific quality of life using Peds QL Cardiac scale scores after training, but this change was variable (Table 4). Improvement in VO2 max correlated with improvement in patient-reported cardiac symptoms (r = 0.90, p = 0.03) and cognitive problems (r = 0.89, p = 0.04) after training (Fig. 8).
Correlation between Improvement in VO2 max and Peds QL Cardiac scale scores: Patient reported cardiac symptoms, cognitive problems after 3 months of training.
Change in Peds QL Cardiac scale scores after 3 months of training
Discussion
This pilot exercise training study is the first to investigate the cardiac MRI-integrated multiorgan adaptations including cardiac and liver adaptation to progressive short-term endurance training in patients after the Fontan operation. We showed an improvement in exercise capacity after 3 months of training without any adverse cardiac or liver adaptations in this five-patient pilot.
All patients completed this intense and progressive training programme as reflected by the >80% compliance and increase in TRIMP scores throughout the training programme with no reported adverse events. This further supports the fact that Fontan patients are capable of safely and effectively participating in an exercise training programme without deterioration in cardiac morphology or haemodynamic response to exercise. The training accommodations that were required, for 2/5 patients in this cohort, highlight the anticipated challenges training this patient population with a sedentary lifestyle and a lifetime of exercise restrictions related to perceived cardiac fragility. The neurocognitive and mental health challenges in this patient population have been extensively reported, and training programmes designed for this population need to be flexible in accommodating these unique challenges. The positive trends of Quality-of-life inventory (Peds QL) Cardiac scale scores for patient-reported symptoms and cognitive problems correlating with improved exercise capacity after training suggest that an effective training programme may offer mental health benefits and improvement in quality of life beyond just the increased functional capacity. What remains unresolved is the outcome of maintaining a progressive training stimulus over a longer period in this medically complex population. It also remains to be seen if there would be additional adherence-related challenges that would become manifest during longer-term follow-up.
Exercise capacity is known to decline sharply over time in patients with a history of Fontan operation. Reference Atz, Zak and Mahony8 This decline is associated with parallel maladaptive cardiac remodelling with ventricular dilation and dysfunction ultimately leading to failure of the physiology. There was nearly 9% improvement in VO2 max after 3 months of training similar to improvements noted in other training studies in this population. Reference Sutherland, Jones and dʼUdekem9 There was no adverse cardiac or liver remodelling with this intense, progressive training programme providing reassurance about the safety of structured training in this population. It remains unknown if continued training, with or without an augmented dose, would be protective or accelerate their ultimate deterioration. Our team supervised most sessions but encouraged independent training with some accountability through heart rate monitors. It remains unknown if participation in a training programme improves lifetime exercise adherence in patients with Fontan anatomy.
This study utilises C2H2 rebreathing method, a previously used non-invasive measure of quantifying effective pulmonary blood flow (eQp) to estimate cardiac output in Fontan patients. Reference Garcia, McMinn, Zuckerman, Fixler and Levine20,Reference Shafer, Garcia, Babb, Fixler, Ayers and Levine21 The C2H2 rebreathing method has been validated to be a close estimate of Qc in our laboratory in normal patients. Reference Hardin, Stoller and Lawley13 There was a notable improvement in Qc, measured by this method, after training in this Fontan pilot, but this change was variable. This improvement is notable, since inability to augment pulmonary blood flow with exercise is proposed as the likely mechanism of truncated exercise capacity in these patients. Reference Shafer, Garcia, Babb, Fixler, Ayers and Levine21 We fully recognise that eQp is not expected to be equal to Qc in Fontan patients, and the variability is heavily influenced by anatomical factors such as presence or absence of collaterals and presence and size of a fenestration in the Fontan circuit as well as variable exercise and haemodynamic conditions. None of the pilot participants had any significant shunt through the fenestration, and hence the results of this pilot may not be generalisable to all Fontan patients. The mechanism for increased effective pulmonary blood flow during exercise after training needs to be explored in larger cohorts.
There was no significant change in any of the MRI-based measures of cardiac structure or function with short-term training in this cohort. There was, however, a correlation between improvement in exercise capacity and increase in ventricular mass after training. Concentric remodelling of the left ventricle (sub-aortic ventricle) is well described with effective short-term endurance-based training in healthy sedentary adults. Reference Arbab-Zadeh, Perhonen and Howden10 This pilot study was not powered to detect differences in cardiac adaptation to exercise, based on ventricle morphology in Fontan patients, an area of potential future investigation.
Previous studies using magnetic resonance elastography have shown variable degrees of increased liver stiffness related to Fontan-associated liver disease (fibrosis, venous congestion, and altered compliance). Reference Rathgeber, Guttman and Lee16 It is reassuring to note that Fontan patients in this pilot study did not develop any adverse remodelling related to the haemodynamic stress of training.
There are significant limitations of our study related to the pilot design. The five young adults included in this study were well-functioning Fontan patients with no significant anatomic or functional limitations. The findings, therefore, need to be validated in a larger, more diverse cohort of patients with Fontan palliation.
Conclusion
Structured short-term exercise training improved exercise capacity in this pilot exercise training study in patients with a history of Fontan operation without any significant change in ventricular size, function, and liver stiffness. These results warrant further study in a larger population with sustained high rates of physical activity/exercise training over a much longer period.
Acknowledgements
None.
Financial support
Children’s Health Foundation Funds, Dallas, TX.
Competing interests
None.
Ethical standard
The authors assert that all procedures contributing to this work comply with the ethical standards of Research regulation by US Department of Health and Human Services (DHHS) 45 CFR 46.103 for the protection of human subjects through office of Human Research Protection (OHRP) and with the Helsinki Declaration of 1975, as revised in 2008, and have been approved by the Institutional review board of University of Texas Southwestern Medical Center at Dallas and Presbyterian Hospital of Dallas.


 Open access