CLINICIAN’S CAPSULE
What is known about the topic?
Infographics are graphical illustrations of complex ideas that are broadly shared on social media platforms.
What did this study ask?
What is the effect of a social media strategy using infographics on the readership and dissemination of research articles?
What did this study find?
Infographic articles were associated with increased Altmetric scores and abstract views, but not full-text views.
Why does this study matter to clinicians?
The promotion of articles with infographics may increase awareness and dissemination of research findings among clinicians.
INTRODUCTION
With the increased publication of medical literature,Reference Bornmann and Mutz 1 , Reference Druss and Marcus 2 it is challenging for clinicians to keep up with new research findings. It has been estimated that it can take up to 17 years for the implementation of new information in clinical practice,Reference Morris, Wooding, Grant and Med 3 – Reference Grant, Green and Mason 5 but this varies based on the information being evaluated.Reference Cabana, Rand and Powe 6 Improving the dissemination time of new information to front-line practitioners is one modifiable barrier that can be achieved using emerging social media.Reference Thoma, Murray and Huang 7
Knowledge translation of the medical literature is the “application of knowledge… to accelerate the capture of the benefits of research.”Reference Graham, Logan and Harrison 8 A critical factor in knowledge translation is “awareness of the literature,” defined as having read or knowing that a study or guideline exists.Reference Masic, Miokovic and Muhamedagic 9 – Reference Wimpenny, Johnson, Walter and Wilkinson 12 Time constraints and volume of published literature are frequently cited barriers to awareness.Reference Masic, Miokovic and Muhamedagic 9 Innovative promotional methods that emphasize brevity and the use of visual cues are a possible solution.Reference Thoma, Murray and Huang 7 , Reference Ibrahim, Lillemoe, Klingensmith and Dimick 13
Educational research supporting cognitive load theory and dual-coding theory suggests that readers learn and remember the contents of article summaries better if they are presented in a combined written text and graphic formats, rather than text-only formats.Reference Mayer, Bove and Bryman 14 – Reference Martin, Turnquist and Groot 19 Infographics are graphical visualizations of data used to simplify complex ideas and are increasingly used by free open-access medical education websites and social media outlets.Reference Ibrahim, Lillemoe, Klingensmith and Dimick 13 , Reference Dur 18 , Reference Smiciklas 20 As they are broadly shared on social media platforms, such as Twitter and Facebook, presenting abstracts in infographic format may improve the dissemination and readership of research articles.Reference Thoma, Murray and Huang 7 , Reference Ibrahim, Lillemoe, Klingensmith and Dimick 13
Our previous non-randomized study found that social media-based promotion of journal articles with infographics increased abstract viewership and Altmetric scores.Reference Thoma, Murray and Huang 7 This randomized controlled trial (RCT) compared the impact of a robust social media promotion strategy involving both infographics and collaboration with an external website (CanadiEM.org) with text-only abstracts promoted by the journal alone.
METHODS
This research study was deemed exempt by the University of Saskatchewan Behavioral Research Ethics Board (BEH 16-407).
Design
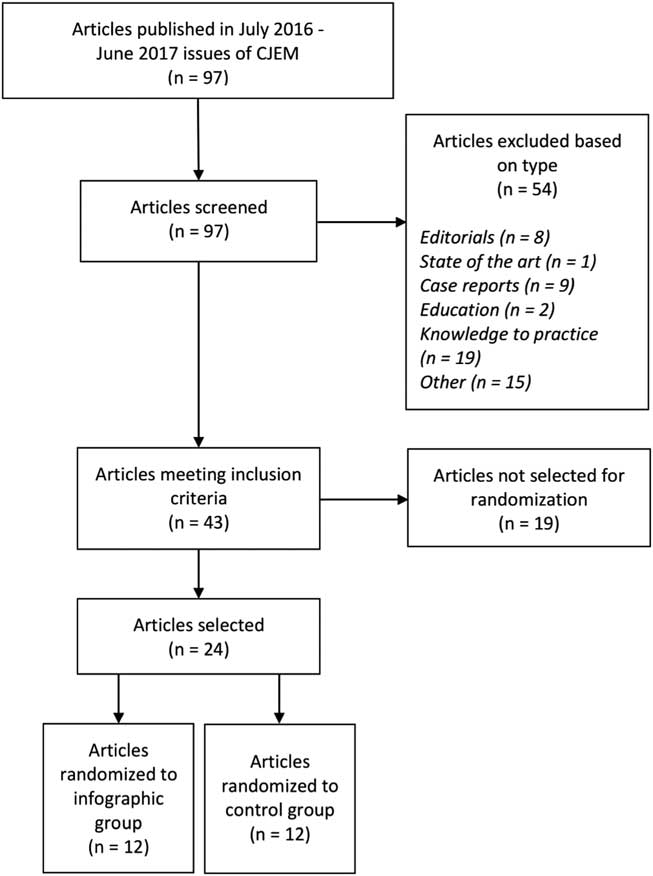
An RCT design was used for this study. Four original research articles were chosen from each issue of CJEM published between July 2016 and June 2017. Other article types, such as editorials and case reports, were excluded from the study. Articles were selected based on their perceived interest to Canadian emergency medicine physicians through a consensus of the study authors (including CJEM’s Senior and Junior Social Media Editors and a CJEM editorial team member [HM]). Consensus was achieved via an email-based discussion of the original research articles being published within each issue. The selected articles from each issue were subsequently randomized to intervention (infographic plus CanadiEM.org) and control groups using an online list randomizer (https://www.random.org). Figure 1 outlines the selection process and randomization of articles.
Flow chart outlining CJEM article selection and randomization to infographic and control groups.
Interventions
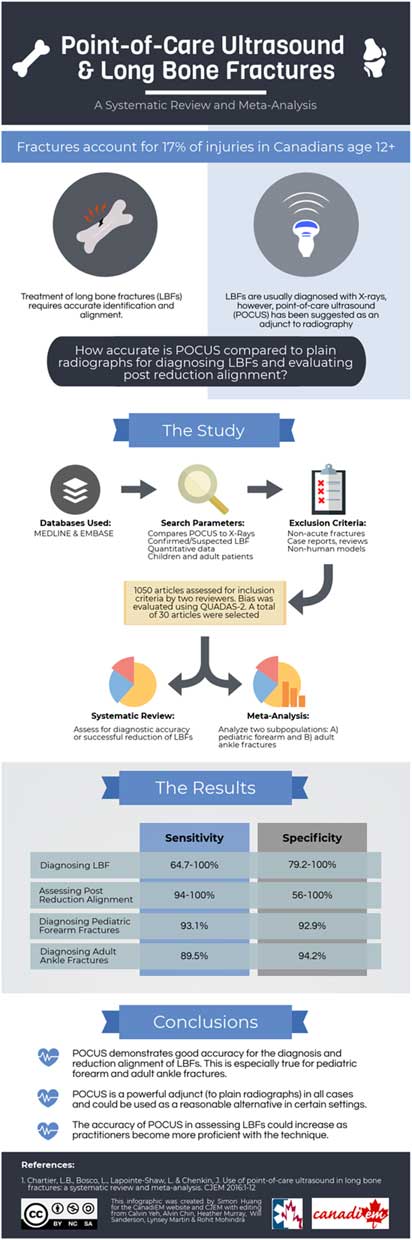
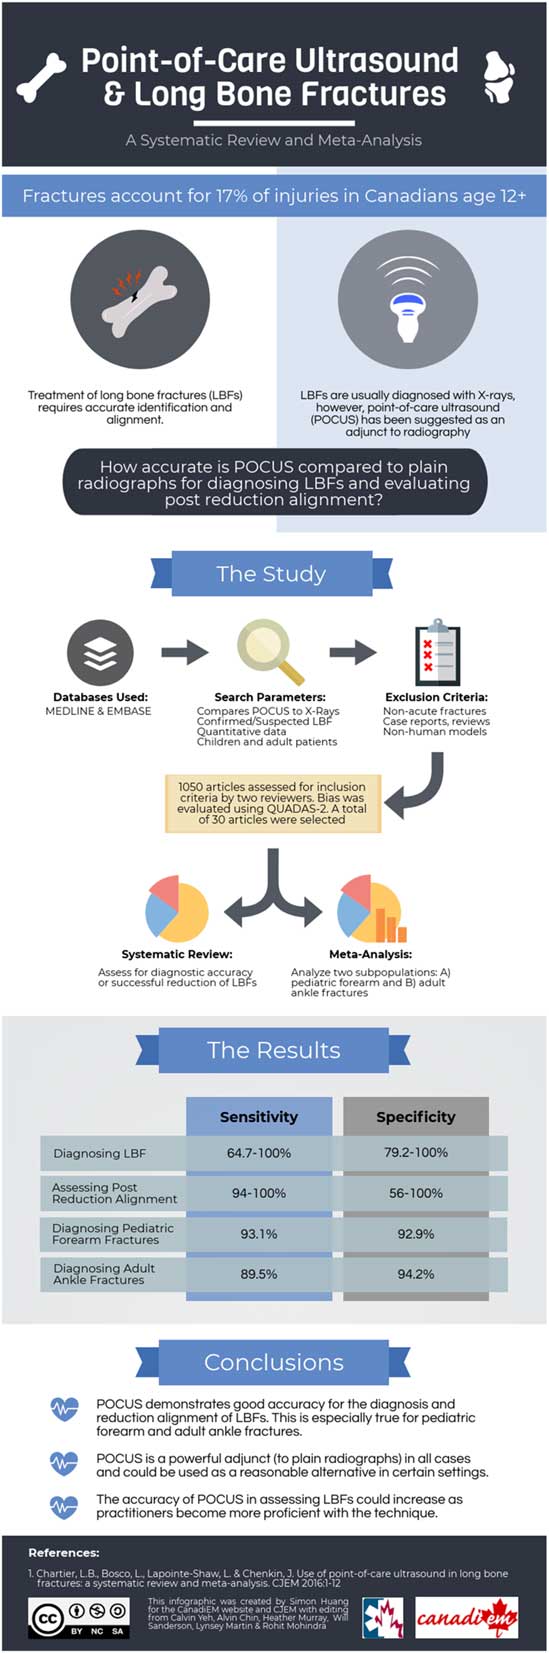
English-language infographics for the intervention group articles were created by medical student and resident members of the social media team (SH, CY, AC, KD, and LX). To ensure that the infographics were clear and concise, we adhered to generally accepted principles of design and multimedia learning. In practical terms, we focused on principles of multimedia learning (i.e., coherence, signaling, redundancy, and spatial contiguity)Reference Mayer and Fiorella 21 by minimizing the amount of text, using visual representations when possible, and ensuring that text and graphics were spatially aligned. To achieve the design principles of compellingness and coherence,Reference Dunlap and Lowenthal 22 each infographic was designed in a way to entice readership (e.g., provocatively phrasing the research question) and to consistently follow the same format between infographics (e.g., introduction, methods, results, and conclusion).Reference Dunlap and Lowenthal 22 Figure 2 shows an example of one infographic used in our study.
Infographic describing the study “Use of point-of-care ultrasound in long bone fractures: a systematic review and meta-analysis” that was used in this study.
The promotion process for each group is outlined in Figure 3. Infographics were reviewed by all members of the social media promotion team, which included attending emergency physicians with training in both research and education. An informal feedback process was used, with content and format edits made based on team suggestions. Each infographic was also reviewed by the article’s corresponding authors. For promotion of the control group articles, a screen capture image for each article’s text-based abstract was created.
Graphical representation of the social media promotion process for the infographic and control groups.
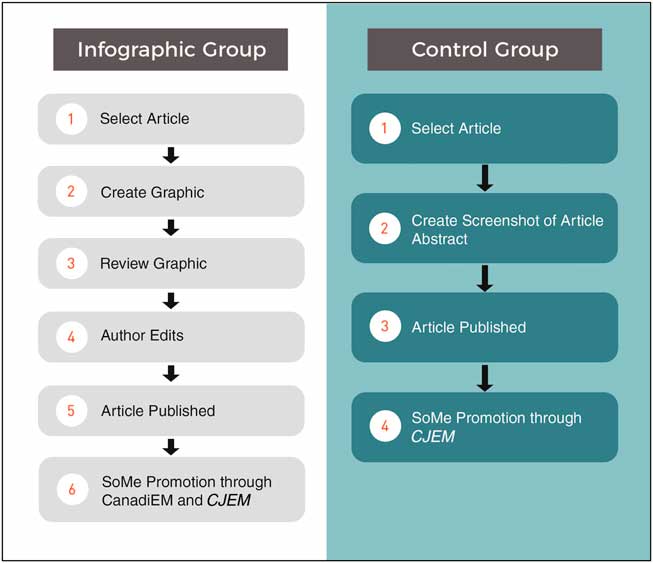
We aimed to promote each article within 1-2 weeks after its official publication in a CJEM issue. All articles had been published online on the CJEM website prior to official publication. Infographic articles were promoted via a 1) tweet of the infographic from both the CJEM and CanadiEM Twitter accounts; 2) post on both the CJEM and CanadiEM Facebook pages; and c) blog-post of the infographic on the CanadiEM website. Control articles were promoted with a tweet from the CJEM Twitter account and post from the CJEM Facebook account that contained a picture of the article’s abstract.
Data collection
Characteristics of the articles in the control and intervention groups were collected to demonstrate comparability between the two groups. They included the mean number of abstract views in the month prior to publication, mean full-text views in the month prior to publication, mean Altmetric score before publication, number of authors, whether the first author was Canadian, and whether the last author was Canadian. Altmetric scores for each article were logged by a member of the study team (SH) prior to each article’s print publication date and 30 days following each article’s release. Monthly abstract and full-text views for each article were obtained from the journal’s publisher (Cambridge University Press).
Outcomes
The primary outcome of this study was social media dissemination as measured by the change in Altmetric scores between the two groups. Altmetric scores are a freely available proprietary metric that measure the number of times that a journal is referenced by social media such as blogs, podcasts, news media, and other platforms.Reference Trueger, Thoma and Hsu 23 The Altmetric score was recorded the day before promotion (infographic or text abstract) and 30 days after promotion to fully capture the effect of social media promotion.
Secondary outcomes included abstract page views (each time the abstract was loaded in a Web browser) and full-text page views (each time the full-text article was loaded in a Web browser or downloaded as a PDF) recorded on the CJEM website in the month of formal publication and the subsequent month. 24 The 2-month time frame was chosen for the readership metrics to ensure that the full impact of social media promotion was included, because only monthly data were available. Using only the month of publication would have missed increased readership received by an article published and promoted near the end of a month.
Analysis
Simple descriptive statistics were calculated using Microsoft Excel (2016). Abstract views, full-text views, and the change in Altmetric scores were reported as the mean with 95% confidence interval (95% CI). The change in Altmetric score was calculated by subtracting the Altmetric score of each article on the date that the article was formally published from the Altmetric score 30 days later. Unpaired two-tailed t-tests were used to evaluate for the significant differences between the two groups at baseline and following the intervention.
RESULTS
Tables 1 and 2 show the list of articles in the control and infographic groups, respectively. Descriptive data for the articles in both groups are shown in Table 3. Although infographic articles had slightly higher abstract views, full-text views, Altmetric scores, and Canadian authors at baseline, these differences were not statistically significant. Furthermore, no significant differences were found between the groups in terms of time to publication or number of authors.
List of articles in the control group
List of articles in the infographic group
Baseline demographic data for articles in the control and infographic groups
CI=confidence interval.
The mean abstract views, mean full-text views, and change in Altmetric scores of each group are presented in Table 4. The infographic group had a significantly larger change in Altmetric score (p<0.0001) and more abstract views (p<0.001) than the control group. There was no statistically significant difference in full-text views.
Comparison of the infographic and control promotional strategies
CI=confidence interval.
DISCUSSION
This study builds on a previously published paperReference Thoma, Murray and Huang 7 that outlined the nonrandomized results of CJEM’s infographic and podcast-based social media strategy. It reinforces our previous resultsReference Thoma, Murray and Huang 7 by demonstrating the persistence of its findings in a randomized study. It is the first RCT to compare a “standard” medical journal social media strategy of using Facebook and Twitter channels for promotion to a more comprehensive strategy involving infographics created and promoted by a medical education website (https://CanadiEM.org).
Similar to the previous study,Reference Thoma, Murray and Huang 7 full-text readership did not increase despite increased abstract views and dissemination on social media. The reason for the lack of increase in full-text readership is unclear and concerning because this is a primary goal of social media promotion. It is likely that many international readers did not have full-text access to CJEM and were unable to download or view the full article. None of the promoted articles were freely available during the study period; all were behind a pay wall for access. Alternatively, readers may have felt that the infographic was sufficient as a summary and did not feel the need to read the full paper.
The Pathman model for knowledge translation lists four steps in the application of new clinical information: awareness, agreement, adoption, and adherence.Reference Pathman, Konrad and Freed 11 As shown in our study, infographic promotion in collaboration with a medical education website has the potential to raise awareness of an article through increased abstract views and social media dissemination. This is a critical step of knowledge translation, because physicians cannot apply the literature to their practice when they do not know it exists.Reference Masic, Miokovic and Muhamedagic 9 – Reference Wimpenny, Johnson, Walter and Wilkinson 12 Unfortunately, awareness is only one of the steps in the knowledge translation pathway.Reference Pathman, Konrad and Freed 11 Physicians often disagree on clinical guidelines and may be caught in the inertia of previous practice.Reference Cabana, Rand and Powe 6 External factors, such as local practice patterns and resource availability, also contribute as barriers to the adoption of new evidence.Reference Cabana, Rand and Powe 6 , Reference Pathman, Konrad and Freed 11 Infographic promotion is unlikely to help with these barriers because it is largely limited to increasing awareness.
Infographics require significant time and effort to create. In our study, this process involved a thorough review of the research article, creation of a first draft, and multiple peer reviews for clarity and content. From our experience, we found that an infographic required, on average, 2-3 weeks for production. However, this process was notably longer if author feedback were solicited. We were also fortunate to have experienced infographic editors and peer reviewers as part of the CJEM SoMe team through a collaboration with CanadiEM. Other journals may not have the personnel needed for creating high quality infographics and may need to outsource this work, which could be cost prohibitive, especially if the detailed principles of good design are followed.Reference Mayer and Fiorella 21 , Reference Dunlap and Lowenthal 22
Visual abstracts are a relatively simpler form of infographic that have recently been adopted by medical journals as a means of summarizing and promoting research articles.Reference Ibrahim, Lillemoe, Klingensmith and Dimick 13 They bear many similarities to the infographics we developed in our study but adhere to a more rigid design. Their brevity and standardization make them considerably easier to create compared to infographics, and they have also been shown to improve dissemination of research on social media platforms.Reference Ibrahim, Lillemoe, Klingensmith and Dimick 13 Future studies comparing infographics and visual abstracts would be useful to determine the advantages and disadvantages of each modality.
Overall, our findings support the use of infographics as a valuable knowledge translation tool for the initial phase of increasing awareness. Furthermore, infographic abstracts may provide additional benefit to medical journals by increasing their visibility and presence on social media.
LIMITATIONS
The promotion of infographic articles on the CanadiEM social media platform may have increased dissemination and makes it impossible to isolate the impact of infographics alone on Altmetric scores and abstract views. The inclusion of a third arm consisting of infographics created and promoted by CJEM alone would be helpful to address this question in future studies.
We were unable to perform a power calculation due to a lack of data from prior studies, and, because of the labour-intensive process of creating infographics, we were limited to a sample size of 24 articles. This may have limited the statistical power to detect a difference in full-text views.
Because only abstract and full-text views from the CJEM website were available for analysis, views and downloads through other means (e.g., PubMed, institutional repositories, and self-archiving) were not included and could have resulted in underestimations of readership. Furthermore, because abstract views and full-text views were available monthly only, readership metrics had to be collected for 2 months, which may have diluted the short-term impact of the infographic.
Free full-text access to articles published in CJEM was limited to members of the Canadian Association of Emergency Physicians (CAEP) or to academic institutions with access to Cambridge journals. Many readers may have had limited access to the articles in this study, as a result. This likely limited the full-text views in both groups; however, given the difference in Altmetric scores, it would likely have had a greater impact on the intervention group. This would have decreased the likelihood of finding a significant increase in full-text views.
Finally, emergency medicine has an established virtual community of practice that may not exist in other fields of medicine,Reference Thoma, Paddock and Purdy 25 , Reference Wenger, McDermott and Snyder 26 and we used a prominent social media platform in the CanadiEM website to disseminate the infographics online. These conditions may decrease the likelihood that journals in other fields of medicine are able to replicate the results of this study.
CONCLUSIONS
CJEM articles that promoted using infographics in collaboration with a medical education website had higher abstract viewership and Altmetric scores than those promoted with traditional social media methods. Based on these results, we believe that infographic abstracts are a tool that medical journals and researchers can use to effectively promote their research findings and increase their visibility on social media. The lack of a significant increase in full-text readership is concerning and suggests that the promoted articles were unlikely to be read in detail.
SUPPLEMENTARY MATERIALS
For supplementary material/s referred to in this article, please visit https://doi.org/10.1017/cem.2018.436
Competing interests: Simon Huang, Calvin H. Yeh, Alvin Chin, Heather Murray, Teresa M. Chan, and Brent Thoma are editors and/or advisory board members of the CanadiEM website.