


1. Introduction
Aquaculture production has become increasingly important for global seafood systems as wild capture fisheries become unable to respond to growing demand (Shamshak et al., Reference Shamshak, Anderson, Asche, Garlock and Love2019). As of 2018, aquaculture was the source of nearly half of seafood production, after more than doubling from 43 million metric tons to 104 million metric tons between 2000 and 2015 (FAO, 2021). That said, production increases have been geographically uneven, with aquaculture growth lagging in high-consumption nations such as the United States, where aquaculture contributes 0.6 billion pounds of seafood compared to 9.6 billion pounds from wild fisheries (NOAA, 2017) and increases in consumption have only been possible through imports (Abaidoo et al., Reference Abaidoo, Melstrom and Malone2021).
Producers need accurate information regarding consumer preferences for aquaculture products and product attributes to help identify marketing opportunities in the meat and seafood industry. To accommodate this, research has explored consumer acceptance of farm-raised seafood. Much of this research is motivated by questions about the drivers of consumption behavior and/or tradeoffs between regulatory burden on costs and consumer acceptance of aquaculture relative to alternative protein options (Staples et al., Reference Staples, Chambers, Melstrom and Malone2021).Footnote 1 Indeed, prior studies indicate that consumers care where and how their seafood is produced, which affects both demand for farm-raised seafood and the costs of production and marketing (Carlucci et al., Reference Carlucci, Nocella, De Devitiis, Viscecchia, Bimbo and Nardone2015). One common measure of consumer acceptance is willingness to pay (WTP), which measures the amount consumers will pay given their income for a product or product attribute. Studies have consistently identified WTP differences for attributes such as domestic versus imported seafood, packaging with and without certification labels, etc. (Asche et al., Reference Asche, Larsen, Smith, Sogn-Grundvåg and Young2015; Cantillo et al., Reference Cantillo, Martín and Román2020).
One challenge in interpreting the growing literature on consumer demand for aquaculture products is a lack of quantitative cross-study comparisons, which can complicate interpretations of the burgeoning number of WTP estimates. Individual studies typically assume that product attributes and consumer characteristics determine valuations but can only comment generally on the importance of study characteristics such as survey method and sample size. For example, if WTP is larger in studies that use web-based surveys, and smaller in studies with in-person interviews, then one might surmise that survey design is affecting WTP estimates (Johnston et al., Reference Johnston, Ranson, Besedin and Helm2006; Rosenberger and Loomis, Reference Rosenberger and Loomis2000).
This article uses meta-regression analysis to examine variation in estimates of WTP for farm-raised seafood products. We contribute to the literature in two ways. First, we measure the average premiums that consumers have for common product attributes, including domestic production—which is one of the most popular attributes in farmed seafood WTP studies—and environmental certifications—which are gaining prominence in aquaculture (Osmundsen et al., Reference Osmundsen, Amundsen, Alexander, Asche, Bailey, Finstad, Olsen, Herndandez and Salgado2020), consistent with certification trends across the food industry (Hatanaka et al., Reference Hatanaka, Bain and Busch2005). Second, we examine how WTP estimates vary systematically across study design elements, populations of interest, and sample characteristics. This second aim is important because research on WTP is evolving and prior studies, including meta-analyses, should help inform current study design decisions (Johnston et al., Reference Johnston, Boyle, Adamowicz, Bennett, Brouwer, Cameron, Hanemann, Hanley, Ryan, Scarpa, Tourangeau and Vossler2017).
Our paper relates closely to two prior studies, which review and document the escalating prevalence of fish and aquaculture consumer research over the past 20 years (Cantillo et al., Reference Cantillo, Martín and Román2020; Carlucci et al., Reference Carlucci, Nocella, De Devitiis, Viscecchia, Bimbo and Nardone2015). Both studies examine how product labeling affects consumer purchasing decisions and WTP. Cantillo et al. (Reference Cantillo, Martín and Román2020) examine prior research that used discrete choice experiments (DCEs) to measure WTP for finfish products. Drawing on DCE attributes and WTP values across 39 studies, they find that consumers are willing to pay a significant premium for local products, as well as for products with ecolabels such as “sustainable production”, “from natural ponds”, “sustainability level X”, “Organic”, and “Freedom Food”. Carlucci et al. (Reference Carlucci, Nocella, De Devitiis, Viscecchia, Bimbo and Nardone2015) describe the results from a literature review focused on consumer purchasing behavior towards fish and seafood. Based on 49 studies, they conclude that consumers are strongly influenced by country of origin, production method, packaging, and ecolabels. Our study differs from Cantillo et al. (Reference Cantillo, Martín and Román2020) and Carlucci et al. (Reference Carlucci, Nocella, De Devitiis, Viscecchia, Bimbo and Nardone2015) in that we focus exclusively on aquaculture products and use quantitative rather than qualitative methods to identify commonalities in WTP. Our meta-regression measures the relationship between WTP estimates, product attributes, and study characteristics from 45 studies identified through a systematic literature review. We confirm the importance of diverse attributes but also find that study characteristics significantly influence WTP estimates.
2. Methods
Our meta-analysis consists of three parts. First, we conduct a systematic literature review to identify studies that estimate WTP for farm-raised seafood. Second, we transfer WTP estimates as well as moderator variables into a meta-database. In meta-regression, moderator variables are independent variables included in the regression to control for systematic differences in the effect under study. In the context of this paper, WTP is the effect under study and the moderator variables are product and study characteristics that influence WTP. Third, we use regression analysis to estimate models relating WTP estimates to product and study characteristics.
2.1. Identification of Relevant Research
Studies included in our analysis must report at least one WTP estimate for farm-raised seafood. In fact, most WTP studies in the seafood demand literature use DCEs to estimate a large assortment of WTP for products differentiated by the presence or absence of various attributes. The simplest DCE study includes a single binary attribute in addition to price, which allows an analyst to estimate WTP for two products: one with and the other without the attribute. In practice, DCE studies usually examine several (usually binary) attributes and report on the additional WTP associated with each attribute, which we refer to as marginal WTP (MWTP). Because our meta-regression analysis requires WTP (for a product) rather than MWTP (for an attribute), later in this section we describe how we convert MWTP to WTP from DCE studies that report MWTP.
We searched several scholarly databases for studies with WTP estimates for aquaculture and farm-raised seafood products. We performed these searches initially in April 2021 in Elsevier’s abstract and citation database Scopus, Clarivate Analytics’ Web of Science, and Google Scholar using a combination of “willingness to pay” and “aquaculture” and then “willingness to pay” and “farmed fish.” The Scopus search returned 77 articles, the Web of Science search returned 93 articles, and the Google Scholar search returned about 13,000 articles. We downloaded the Scopus and Web of Science returns and then sorted the articles to identify duplicates. These two databases produced 117 unique articles. We did not define a date range although only a single study was published before 2000.
We then conducted a title check to filter studies that did not examine farm-raised seafood demand or did not estimate WTP for aquaculture consumers in the United States, Canada, the European Union, or Norway. Aquaculture and farm-raised seafood products in our study includes finfish, bivalves, and crustaceans. We focused on studies in Western countries to reduce WTP heterogeneity potentially attributable to differences in Western and non-Western diets, income levels, etc. The title check reduced the number of potentially eligible studies to 60. We then read the abstracts to further check that studies met these criteria, which reduced the number of studies to 44. We then read through each study to determine final eligibility. We removed studies that did not report WTP or provide enough information to calculate WTP. We discarded studies that did not include any WTP estimates for farm-raised seafood. We then cross-referenced the remaining studies with the first 200 Google Scholar search results. This allowed us to identify additional relevant studies not in the Web of Science and Scopus databases, leading to 37 total studies. In June 2022, we conducted the search a second time, which identified eight additional studies, including several in press at the time of the original queries. The search ended with 45 peer-reviewed articles, which became the primary studies supplying data for the meta-regression. Not every study provided explicit WTP estimates, but all studies provided at least enough information from model descriptions and parameter estimates (i.e. from DCEs) to calculate WTP.
2.2. Transforming and Coding Values
Our first task in transferring WTP estimates from the primary studies to the metadata is determining the type of WTP information in a study. We grouped studies into three types: DCE studies that reported utility function parameters suitable for calculating WTP or MWTP, DCE studies that did not report interpretable utility function parameters but reported MWTP in the main text, and non-DCE studies. To understand why we did this, it will be helpful to review random utility maximization (RUM) theory, which DCE studies draw on to estimate WTP. RUM theory posits that a given consumer i receives utility u ij of the form
 $${u_{ij}} = \sum\limits_{j \,=\, 1}^J {{\alpha _j}} {z_j} + \beta \left( {{y_i} - {t_j}} \right) + {\varepsilon _{ij}}$$
where z j are product attributes j = 1,…,J, y i is income, t j is price, and ϵ ij includes unknown factors important to the individual. Analysts typically learn about WTP from DCEs by including a set of dummy variables in z j to indicate a product and the presence of various product attributes. Depending on the choice structure and assumed distribution of ϵ ij , analysts use a form of logistic regression to estimate the parameters α and β. A DCE study can then estimate WTP for a product using the formula:
 $$E_{\varepsilon }\left({\rm WTP}_{j}|\alpha _{j},\beta,z_{j}\right)={\sum \alpha _{j}z_{j} \over \beta }$$
where z j includes the relevant attribute measures as well as the alternative-specific constant for the product line. Many DCE studies report MWTP for a single attribute, using a formula composed of just two parameters (Haab and McConnell, Reference Haab and McConnell2002):
 $$E_{\varepsilon }\left({\rm MWTP}_{j}|\alpha _{j},\beta \right)={\alpha _{j} \over \beta }$$
For DCE studies that report their utility function parameters in the main text, we transferred all α j and β to the metadata and then used a version of equation(2) to estimate WTP. In general, we could collect J + 1 WTP estimates from this type of study. Thus, for example, a study with just price and a single nonprice attribute would yield two estimates of WTP: one for the product with the nonprice attribute and one for the product without the nonprice attribute.Footnote 2 If a study presented utility functions for samples from different regions (state, province or country), then we transferred the α j and β estimated from each sample.
For DCE studies that reported only MWTP in the main text, we transferred MWTP and an estimate of base price to the metadata. By “base price”, we mean WTP for the product without any of the nonprice attributes. We then calculated WTP using the formula $b+{\alpha _{j} \over \beta }$
, where α
j
/β is the MWTP for a particular attribute and b is a base price. For this type of study, we calculated base price in one of two ways: We used the average price level in the experiment (eleven studies) or, if information about the experimental price was not available, we used the market price found through a web search based on the year and country in which the study took place (two studies).
$b+{\alpha _{j} \over \beta }$
, where α
j
/β is the MWTP for a particular attribute and b is a base price. For this type of study, we calculated base price in one of two ways: We used the average price level in the experiment (eleven studies) or, if information about the experimental price was not available, we used the market price found through a web search based on the year and country in which the study took place (two studies).
Lastly, there were several non-DCE studies, which used contingent valuation (CV) or employed hedonic valuation (HV). For one CV study that did not report WTP directly, we applied a Turnbull estimator to statistical summaries of subjects’ responses to WTP questions to estimate TWTP (Haab and McConnell, Reference Haab and McConnell2002). For another study, which estimated WTP for product attributes in percentage terms, we calculated TWTP by multiplying the estimated percentage increase times a base price found through a web search. The HV studies modeled WTP directly, so we could transfer the values from the study without reformulating parameters.
The primary studies denominate values in a variety of weights and currencies, which we converted to dollars at current exchange rates. Two studies on WTP for oysters reported estimates per oyster rather than by weight, and we converted the estimate to WTP per pound assuming 12 oysters per pound; this assumption is based on the approximate number of oysters per kg used in the base product in Carlucci et al. (Reference Carlucci, Devitiis, Nardone and Santeramo2017).
Our metadata includes several variables describing the availability of product attributes, the names of which are hereafter placed in italics. Fresh equals one if the study informed consumers that the product was sold fresh rather than frozen. Local and domestic equal one if the study indicated that the product was raised locally or domestically. Note that “raised locally” differed from study to study as there is not a universally agreed upon definition. Live equals one if a product was sold alive. Processed equals one if a product was sold prepared or pre-cooked in any way. This is a catch-all attribute category to account for a large variety of processing types examined in the literature, which could range from de-boned fillets sold raw to fried fish sold in the freezer section. Environmental certification equals one if the product was sold with an environmental certification or “eco-label”. As with processed, this attribute category covers a large diversity of attributes in the literature.Footnote 3 We coded IMTA certification separately, which was one of the most common environmental certifications.Footnote 4 We controlled for whether the study measures WTP for products intended for home consumption relative to away-from-home, i.e. a restaurant. Finally, we recorded the type of seafood (i.e. species) that distinguished the product.
Next, we collected variables describing study characteristics. We control for the year published, whether the study collected consumer data via a web-based survey (a dummy variable) and if the study used choice data from actual or real purchases. We include the number of participants as sample size in order to, as we explain below, help control for publication bias in the literature. We also include four variables describing the composition of the sample: North America is a dummy variable for the sample being composed of U.S. or Canadian residents; income is the average income in the sample; college is the share of the sample holding a college degree; and male is the share of the sample who are male.
2.3. Regression Analysis
The meta-regression applies regression analysis to a linear model of WTP as a function of product attributes X ij , seafood type-specific constants Y ij and study characteristics Z i of product j from sample i:
 $${\rm WT}{\rm P}_{ij}=\beta _{0}+\beta _{1}X_{ij}+\beta _{2}Y_{ij}+\beta _{3}Z_{i}+\epsilon _{ij}$$
where ϵ ij is random error. A linear model of WTP is consistent with a literature that assumes WTP is determined by additive, linear utility functions.Footnote 5 We refer to equation(4) as the ordinary least squares (OLS) specification. Meta-regression must address issues of data heterogeneity, heteroscedasticity, and correlated observations (Nelson and Kennedy, Reference Nelson and Kennedy2009). Analysts have proposed a variety of empirical strategies to address these issues, including moderator variables as regressors, multilevel modeling and regression weighting. The regressors, i.e., the moderator variables, in equation(4) allow us to examine how WTP is influenced by product attributes, seafood type, and study characteristics, which is the primary aim of this study. For valid inference under conditions of heteroscedasticity, we calculate robust standard errors with clustering on study and sample (so samples in the same study drawn from different regions were treated as independent).
To account for the fact that some studies contribute more precise estimates than others, meta-regression studies sometimes employ a weighted least-squares (WLS) estimator using the inverse variances from the primary studies as analytical weights (Nelson and Kennedy, Reference Nelson and Kennedy2009). Unfortunately, not all studies in our literature review report WTP variances or standard errors. However, an alternative is to use sample sizes as weights (Nelson and Kennedy, Reference Nelson and Kennedy2009). Employing this alternative approach, we can modify equation(4) to
 $$\sqrt{n_{i}}{\rm WT}{\rm P}_{ij}=\sqrt{n_{i}}\beta _{0}+\sqrt{n_{i}}\beta _{1}X_{ij}+\sqrt{n_{i}}\beta _{2}Y_{ij}+\sqrt{n_{i}}\beta _{3}Z_{i}+\nu _{ij}$$
where n
i
is the sample size associated with a set of estimates and $\nu _{ij}=\sqrt{n_{i}}\epsilon _{ij}$
. We refer to equation(5) as the WLS specification. As with the OLS specification, we report parameters with cluster-robust standard errors.
$\nu _{ij}=\sqrt{n_{i}}\epsilon _{ij}$
. We refer to equation(5) as the WLS specification. As with the OLS specification, we report parameters with cluster-robust standard errors.
Finally, we consider two more specifications to address concerns about sampling bias and unobserved heterogeneity. The first additional specification modifies the WLS approach by further weighting on the inverse of the number of estimates from each study, such that the weights on the individual observations within a single study sum to n i . This approach gives each study the same weight (conditional on sample size), which prevents primary studies with large numbers of WTP estimates in the meta-data from disproportionately influencing the parameters, a problem known as sampling bias (Nelson and Kennedy, Reference Nelson and Kennedy2009). We refer to this as the modified-WLS specification. Finally, we estimate a hierarchical version of the WTP model using random effects regression. Meta-regression applications often include a specification in which the error is decomposed into two parts, i.e., ϵ ij = η j + ϵ ij where η j varies systematically with each study and ϵ ij varies randomly. If the unobserved study heterogeneity is uncorrelated with the moderators, then the random effects specification will produce efficient parameter estimates. Including a random effects specification aligns with best practices in meta-regression (Nelson and Kennedy, Reference Nelson and Kennedy2009).
The product attributes X ij include the attributes described in the previous section, including fresh, local, live, processed, environmental certification, IMTA certification, and home consumption. The seafood type-specific constants Y ij include two dummy variables, one indicating bivalve products (clams, mussels, and oysters) and the other indicating crustacean products (crab, shrimp, and prawns). These constants measure the average difference in WTP for bivalves and crustaceans relative to fish. The study characteristics Z i include real, year published, web-based survey, as well as sample characteristics North America, income, college, male, and sample size. The effect of sample size on WTP allows us to test for publication bias, which arises when studies with more significant, positive findings (i.e. WTP estimates) are more likely to be published than studies with smaller or insignificant findings. Publication bias implies negative correlation between effect size and sample size because studies with smaller samples, which tend to have larger standard errors, need larger effect sizes to get published.
3. Results
3.1. Summary of the Meta-Data
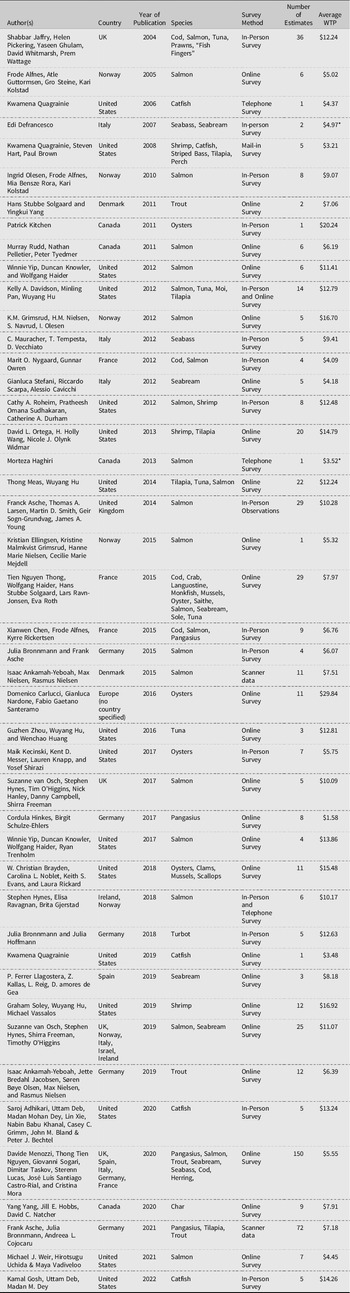
Table 1 summarizes the 45 studies along several key dimensions. The table columns include author names and year, country, species, survey method, the number of WTP estimates, and average WTP. This summary shows that the studies in our metadata are relatively new, with all studies having been published after 2003. The data covers 25 species, including bass, catfish, char, clams, cod, crab, haddock, herring, langoustine, moi, monkfish, mussels, oyster, pangasius, prawns, saithe, salmon, scallops, seabass, seabream, shrimp, sole, tilapia, trout, and tuna. More than half use data collected via online surveys (25 studies), with most of the remainder using data from in-person surveys. The number of WTP estimates per study ranges from 1 to 150. The average WTP ranges from $1.58 to $20.24 per pound.
List of aquaculture product studies reporting willingness to pay

* The base price used to calculate total WTP in these studies gathered from a web search.
We collected 601 observations based on the product varieties described in the primary studies. Table 2 summarizes these observations in terms of product attributes (panel A), seafood type (panel B), and study characteristics (panel C). The average WTP estimate is approximately $9 per pound. Most of the other statistics indicate the share of observations with a particular attribute or characteristic. Thus, we can see that 3% of observations are products sold fresh, 2% are sold local, and 6% are sold domestic. About 1% are sold live. Processed and environmental certification are the most prevalent attributes, showing up in 15% and 20% (or 23%, if one includes IMTA certifications) of the observations, respectively. This means nearly half of the metadata are WTP estimates for products with an environmental certification, processed, fresh, local, sold live, or domestically. About three-quarters of observations are WTP estimates for products consumed at home. Panel B shows that about 5% and 6% of observations are bivalve and crustacean products, respectively, with finfish species making up the remainder.
Summary statistics

Panel C of Table 2 summarizes the study characteristics in the metadata. About one out of five observations come from real purchases, which consists mainly of prices from hedonic studies. In terms of data collection, 59% of observations come from studies that used web-based surveys. The average sample size is 4607 participants.
3.2. Meta-Regression
Table 3 presents the results. Column (1) shows the basic OLS specification, column (2) the WLS specification, column (3) the modified-WLS specification, and column (4) the random effects specification. All specifications include the same moderators. The parameters in panel A measure the average WTP in dollars per pound for a given product attribute, while those in Panel B measure the average WTP difference between bivalve and finfish and between crustacean and finish, other things equal. The parameter estimates in panel C indicate how much WTP estimates change with respect to study characteristics.
WTP model parameter estimates

*, ** indicates statistically significant at the 0.10 and 0.05 levels, respectively.
Model statistics and specification tests imply that the modified-WLS and random effects specifications best describe the data. The OLS specification produces an R-squared of 0.297, while the WLS and modified-WLS specifications produce R-squareds of 0.182 and 0.493, respectively. So the modified-WLS regression does a better job predicting the (modified-weighted) WTP estimates than the other two regressions (in terms of weighted and unweighted WTP). A Breusch–Pagan test for random effects clearly rejects the null of no study-specific heterogeneity (the χ2 test statistic is 48.83 with one degree of freedom; p < 0.001), which indicates the presence of correlated unobservables in the WTP estimates. On the basis of these assessments, we focus our description and discussion of the results on the modified-WLS and random effects specifications.
Consider the estimates in panel A of column (3) first. The statistically insignificant parameter on local implies that we cannot be confident that observed differences in WTP between local and nonlocal seafood products are systematic, given the dispersion in WTP premiums associated with this attribute. There is also no significant evidence of WTP differences for processed versus unprocessed products or those consumed at home versus away from home. The significant parameters on fresh and domestic indicate that on average consumers are willing to pay $4.28 more per pound for fresh rather than frozen seafood, and $3.20 more per pound for seafood farmed in their own country rather than imported. The environmental certification and IMTA certification parameters are highly statistically significant, implying that on average WTP is $4.25 and $4.66 more for products sold with these certifications, respectively. The significant negative parameter on live indicates that consumers are willing to pay substantially less when purchasing live seafood. The significant parameters on bivalves and crustaceans in panel B indicate that on average these products are generally worth more to consumers on a per pound basis than fish products.
The estimates in Panel C show that WTP estimates are sensitive to some but not all study characteristics. The insignificant parameters on real purchase and year provide no evidence that WTP estimates are systematically different when using hypothetical choice data, or are trending over time. This result should increase confidence in the ability of analysts to estimate current WTP based on estimates from prior research (i.e. via benefit transfer). However, the statistically significant effect of web-based survey suggests that studies that rely on online surveys generate WTP values that are, on average, $2.14 higher than studies that use in-person surveys or scanner data. The negative and statistically significant parameter on North America indicates that WTP estimates are, on average, $2.22 lower in North American studies. There is also evidence that sample demographics influence WTP. While the parameter on college is not significant, the other parameters indicate that WTP estimates tend to be higher in samples with greater average incomes and a smaller share of males.
With a few exceptions, the random effects specification in column (4) produces parameters similar to the modified-WLS specification, at least in terms of signs and significance levels. One of these exceptions occurs in Panel A for the parameter on processed, which changes sign from positive to negative but remains statistically insignificant. Two more exceptions occur in Panel B, with the parameters on bivalves and crustaceans, which become statistically insignificant. In panel C, the parameter on sample size changes from significantly negative to significantly positive, while the parameters on web-based survey and North America lose significance.Footnote 6
4. Discussion
We estimated several models relating WTP to product attributes and study characteristics, given prior research on the demand for farm-raised seafood. The results indicate the typical premiums research finds that consumers will pay for product attributes. We found evidence that where and how a product is produced influences WTP. Consumers as a whole are willing to pay more when they know the product is raised domestically rather than imported. We found a premium of about $3 per pound for domestically raised seafood, which is one-third of the average price of $9 per pound in the metadata. We also found that consumers care whether their seafood is sold fresh and raised using environmentally certified practices. The additional WTP for fresh was $3–$4 per pound, depending on the model. For environmental certifications generally, the premium varied from $2 to $4 per pound, while for IMTA certification specifically the premium was $4 to $5 per pound, depending on the model. Understanding the value consumers place on environmental certifications provides insight into the benefits producers could get by raising seafood using environmentally friendly practices.
We found mixed evidence that consumers are, in general, willing to pay more for products sold local or processed. The premium associated with local ranged from less than $1 to about $2 per pound, depending on the model, and was never significantly different from zero. We found the difference in WTP between unprocessed and processed products fluctuated from positive to negative, depending on the model, and generally insignificant. This does not mean consumers overlook these two attributes, though, because a lack of statistical significance does not necessarily imply that the difference is zero. To be sure, prior research shows consumers are willing to pay more for local farm-raised seafood and some types of processing (e.g. Davidson et al. [Reference Davidson, Pan, Hu and Poerwanto2012] and Kecinski et al. [Reference Kecinski, Messer, Knapp and Shirazi2017]). Consumers may care about whether their seafood is farmed locally, or about the way it is processed and sold, but additional research is needed before we can measure the average WTP for these attributes precisely, across both products and populations.Footnote 7
Study characteristics are an important part of the research design and understanding their influence on WTP estimates can help inform future studies. The results in this paper provided little evidence that study timing and source of choice data influence WTP estimates for farm-raised seafood. Our results provided some evidence that using web-based surveys, or that North American versus European studies, produced significantly different WTP estimates, as these variables were significant in one of our preferred regressions though not the other. We found significant evidence across models that sample income influences WTP estimates. These results suggest that researchers should expect some bias when transferring WTP values between North America and Europe, and between study sites with large income differences—although our results can be used to correct for this bias, at least partially.
Model results provide some indication of publication bias. If publication bias is present in the seafood demand literature, then analysts would find it easier to publish research with statistically significant WTP (total and marginal) estimates. All else equal, significance is easier to demonstrate when working with larger samples, which produce parameters and WTP estimates with smaller standard errors. This would make publishing using individual data more difficult when working with a smaller sample, unless the sample happens to produce parameters and WTP estimates that are unusually large. So with publication bias WTP estimates would tend to be higher when sample sizes are lower. We find evidence of this pattern in the results: in particular, the sample size parameter in the modified-WLS regression implies that WTP estimates diminish significantly with sample size. When we run weighted regressions of TWTP on sample size alone, with no other moderators—i.e. a simple regression test of publication bias (Macaskill et al., Reference Macaskill, Walter and Irwig2001)—the association is significantly negative. However, the sample size parameter in the other preferred regression (the random effects specification, although also true in the OLS and WLS regressions) is positive and significant, which implies precisely the opposite effect, i.e. WTP estimates tend to scale proportionately with sample size.Footnote 8 Thus, the results provide somewhat mixed evidence that the seafood demand literature is distorted in favor of larger WTP estimates. Our data, unfortunately, are too limited to probe the sensitivity of this result to the publication status of the primary studies, for example, by contrasting peer-reviewed and non-peer-reviewed estimates.
How do our results compare with those from other literature? Bastounis et al. (Reference Bastounis, Buckell, Hartmann-Boyce, Cook, King, Potter, Bianchi, Rayner and Jebb2021) and Li and Kallas (Reference Li and Kallas2021) conducted recent meta-analyses of WTP premia for environmental attributes in foods. Bastounis et al. (Reference Bastounis, Buckell, Hartmann-Boyce, Cook, King, Potter, Bianchi, Rayner and Jebb2021) found an average premium of $1.72/pound for an eco-label, while Li and Kallas (Reference Li and Kallas2021) measured an average premium of 29.5% for a sustainability attribute (or $2.66/pound at a base price of $9/pound). We estimated a WTP premium for environmental certifications, which include ecolabels but not all sustainability attributes (as we separated local from other sustainability certifications), of $1.55 or $4.25, depending on the preferred model. With respect to WTP for local products, Li and Kallas (Reference Li and Kallas2021) measured an average premium of 21.1%, while another meta-analysis by Printezis et al. (Reference Printezis, Grebitus and Hirsch2019) found an average premium of 29.2%, which imply WTP of $1.89/pound and $2.63/pound for a local attribute given a base of $9/pound. We estimated a WTP premium for the local attribute of $0.51 or $2.25, depending on the model, though neither estimate was statistically significant. So, our estimate for environmental certification in farmed-raised seafood is either about double or slightly less than prior meta-analyses, while our estimate for local is right in-line or less than prior meta-analyses, depending on which model one prefers. With respect to study characteristics, Bastounis et al. (Reference Bastounis, Buckell, Hartmann-Boyce, Cook, King, Potter, Bianchi, Rayner and Jebb2021) and Li and Kallas (Reference Li and Kallas2021) both find that estimates tend to be higher in samples with a larger percentage of women but no association with income; Li and Kallas (Reference Li and Kallas2021) find no effect of education but Bastounis et al. (Reference Bastounis, Buckell, Hartmann-Boyce, Cook, King, Potter, Bianchi, Rayner and Jebb2021) finds higher education is associated with lower estimates. We also find evidence that WTP tends to be higher in samples with a larger share of women and, similar to Li and Kallas (Reference Li and Kallas2021), we find no significant association between WTP and education, however we do find a positive association with income.
This study comes with several caveats. First, we do not claim to have conducted an exhaustive literature search. While our search was systematic, we acknowledge that it may have missed some studies. The addition of one or two studies could affect the significance of some model estimates, particularly for product attributes sourced from just a few studies. Nevertheless, to our knowledge, our list of studies (Table 1) is the largest assembled for the purpose of analyzing consumer WTP for farm-raised seafood. Second and perhaps most obviously, the results only reflect research on farm-raised seafood, so caution should be exercised in transferring the insights and WTP estimates to wild seafood. While our search identified a number of studies comparing WTP for farmed and wild seafood (e.g. Jaffry et al. [Reference Jaffry, Pickering, Ghulam, Whitmarsh and Wattage2004]; Davidson et al. [Reference Davidson, Pan, Hu and Poerwanto2012]), pooling and analyzing WTP estimates across these two production methods goes beyond the scope of our analysis. Third, the moderator variables used in the meta-regression is a partial and imperfect set of product attributes examined in the literature. We excluded many product attributes that were investigated in only one paper or were too difficult to classify. We also excluded “information” treatments that some investigators used to study the effect of environmental information and media on seafood demand (e.g., Chen et al. [Reference Chen, Rickertsen and Alfnes2015]). As such, the attributes in our meta-regression should not be interpreted as the only attributes that matter or are the most important.
5. Conclusion
This article examined variation in WTP estimates for farmed seafood. Using a meta-regression analysis of estimates from 45 studies, we can conclude that, in general, consumers are willing to pay more for products farmed domestically, sold fresh, and sold with environmental certifications. We found consumers are WTP about $3 more per pound on average for products raised in their own country. We also found consumers will pay $3–$4 more per pound on average for products sold fresh, and $2–$5 more for IMTA certification or other environmental certifications.
Understanding the value that seafood consumers place on product attributes is important. Producers can use market prices to determine the profitability of existing products but assessing the profitability of products with new and unique attributes is more difficult. The meta-analysis in this article provides dollar value estimates that analysts can use to assess the profitability of such products more confidently. Based on the results in this article, consumers in general are willing to pay a significant premium for domestic, fresh, and environmentally certified farmed seafood.
WTP estimates were significantly influenced by some—but not all—study characteristics. We found some evidence of publication bias, specifically that published studies with smaller samples tended to have larger WTP estimates. In other words, studies that rely on small consumer surveys may be more likely to enter the literature if they estimate relatively large WTP. There was little evidence that using real rather than hypothetical choice data yields lower WTP estimates. Given the popularity of DCEs and concerns about hypothetical bias, this result appears to be good news, however our results suggest bias may be present in choice data from internet surveys. We found evidence that WTP estimates are significantly different in studies that used web-based surveys to collect data.
Our meta-analysis is the first to statistically examine the relationship between WTP, product attributes, and study characteristics in farm-raised seafood demand. While there remain important uncertainties and limitations, we believe these will be overcome in future research. The literature has expanded rapidly in 20 years. If this expansion continues and is complemented with a growing diversity of product varieties and study methodologies, for example, more in-person experiments, hedonic analyses, etc, then future meta-analyses will be able to ascertain a greater variety of the product attributes and study characteristics that influence WTP.
Author contributions
Conceptualization: R.T.M. and T.M.; Methodology: R.T.M.; Formal analysis:, K.S. and R.T.M.; Data curation: K.S.; Writing—original raft: K.S.; Writing—review and editing: K.S., R.T.M. and T.M.; Supervision: R.T.M.; Funding acquisition: R.T.M and T.M.
Financial support
This research was funded by the National Oceanic and Atmospheric Administration (Grant No. NA19OAR4170388) with support from the Great Lakes Sea Grant network.
Conflict of interest
Smetana, Melstrom and Malone declare none.


 Open access