

Studying speech production in children
For decades, the acquisition of the phonological, lexical–semantic, morphological, and syntactic knowledge necessary for speech was thoroughly documented together with that of early pragmatic and later discourse abilities. A related yet less investigated issue is that of the very utterance of the word and its course throughout childhood. The study here investigates the speech production of typically developing French-speaking children between the ages of four and eleven years with respect to narrative production. Its objective is two-fold. First, it aims at documenting the overall developmental pattern of narrative production in French, considering the speaking rate and the packaging of words and clauses into speech prosodic units. Second, it aims at tracking changes in the way that the child aged four to eleven years produces speech both at the micro-level of the speech unit and at the macro-level of the narrative, in order to study the way distinct abilities which are rarely considered simultaneously in the literature are related over language development in school-age children. Before presenting and discussing the method and results, the paper starts with an overview of past studies on age-related changes in the speaking rate and the prosodic unit of speech, and on cognitive skills that underlie narrative production in speech.
Speaking rate
In speech production, one of the most studied variables is the speaking rate. The reason is that the rate at which one speaks provides all kinds of information, and depends on age as well as on other factors such as the presence of an impairment in language or cognitive abilities (Flipsen, Reference Flipsen2002; Konopczynski & Vinter, Reference Konopczynski and Vinter1994; Logan, Byrd, Mazzocchi, & Gillam, Reference Logan, Byrd, Mazzocchi and Gillam2011; Ryan, Reference Ryan2000), or the type of task (Logan et al., Reference Logan, Byrd, Mazzocchi and Gillam2011; Sturm & Seery, Reference Sturm and Seery2007).
A common approach to speaking rate assessment is to determine the number of linguistic units that a speaker expresses per unit of time (Logan et al., Reference Logan, Byrd, Mazzocchi and Gillam2011). In previous studies, words per minute or second, syllables per minute or second, or phones per second, were used to measure the speaking rate in a range of tasks including repetition of words and sentences, reading aloud, elicited sentence production, elicited narration, and spontaneous talk in conversation. Taken together, results indicate an age-related increase in the speaking rate. For instance, studies on Dutch speakers suggest an increase of the average speaking rate from 3 syllables per second at age three years, up to 5–7 syllables per second in adults (den Os, Reference den Os1990; Koopmans-van Beinum, Reference Koopmans-van Beinum1993). Studies on English-speaking populations also index an increase in the speaking rate. However, they provide more detailed and contrasted results (see Table 1).
Selected Results from Studies Examining the Effect of Age upon Articulation Rate (Ar) and Speech Rate (Sp) Calibrated on Syllables per Second ( $ {\bar {\bf X}} $) in Typically Developing Children in Conversation (Conv) and Narration (Narr) Tasks

Language apart, both the task and the method of measurement impact the speaking rate at a certain age, and help to explain the variation (Logan et al., Reference Logan, Byrd, Mazzocchi and Gillam2011; Nip & Green, Reference Nip and Green2013; Sturm & Seery, Reference Sturm and Seery2007; Walker & Archibald, Reference Walker and Archibald2006). One issue is the difficulty/complexity of the task, which is higher in elicited narration and spontaneous conversation compared to syllable or word repetition, sentence repetition, or sentence production in an experimental setting. Another issue is that of whether to include pause time as part of the speaking time when measuring the speaking rate. There are two methods to the estimation of speaking rates. The first one corresponds to the overall time used for the spoken delivery of a message, and is referred to as ‘speech rate’. Its measure includes the time spent pausing between words as well as voiced hesitations, re-starts, repetition, and other hints of speech disfluency (Sturm & Seery, Reference Sturm and Seery2007). The second one reflects how quickly sound segments are produced in stretches or runs of speech that have no pauses or hesitations, and is referred to as ‘articulatory rate’ or ‘articulation rate’. This measure thus excludes the time spent pausing between words (Sturm & Seery, Reference Sturm and Seery2007). Consequently, the speech rate is more subject to variation than the articulation rate, as the length and the number of pauses may vary a lot across speakers and tasks (see Table 1 for examples across results in studies by Logan et al., Reference Logan, Byrd, Mazzocchi and Gillam2011; Nip & Green, Reference Nip and Green2013; Sturm & Seery, Reference Sturm and Seery2007). Even though the two methods focus on distinctive aspects of speech production, they form an essential baseline for the identification and diagnosis of impaired or delayed speech (Flipsen, Reference Flipsen2002; Logan et al., Reference Logan, Byrd, Mazzocchi and Gillam2011; Ryan, Reference Ryan2000; Sturm & Seery, Reference Sturm and Seery2007).
Table 1, adapted from Logan et al. (Reference Logan, Byrd, Mazzocchi and Gillam2011), presents normative data extracted from studies on English-speaking populations, from the United States and Canada, engaged in contrasted tasks – narration and/or conversation – which vary in their intrinsic difficulty. Overall results suggest a steady acceleration of the average speech rate with age (Kowal, O'Connell, & Sabin, Reference Kowal, O'Connell and Sabin1975; Nip & Green, Reference Nip and Green2013). The average articulation rate also seems to increase with age. However, results are not always consistent across studies: Sturm and Seery (Reference Sturm and Seery2007) and Nip and Green (Reference Nip and Green2013) report on an acceleration of the articulation rate, whereas Pindzola, Jenkins, and Lokken (Reference Pindzola, Jenkins and Lokken1989) and Walker and Archibald (Reference Walker and Archibald2006) do not. Such contrasted results across studies could find some cause in differences in their participants – preschoolers in the later studies against older children in the former ones; a large age span in the Nip and Green study as opposed to a short age span in the others.
Length and linguistic structure of the speech unit
An interesting, though less documented, aspect of speech processing is that of the length of the speech unit. A speech unit is an uninterrupted segment of speech between two pauses, sometimes named a ‘run’ of speech (Walker, Archibald, Cherniak, & Fish, Reference Walker, Archibald, Cherniak and Fish1992), a ‘breath group’ (Rochet-Capellan & Fuchs, Reference Rochet-Capellan and Fuchs2013), a ‘phonetic utterance’ (Haselager, Slis, & Rietveld, Reference Haselager, Slis and Rietveld1991), a ‘phonetic phrase’ (Flipsen, Reference Flipsen2002), or a ‘phonic group’ (Leon, Reference Leon2011). Flipsen (Reference Flipsen2002) reports on two studies that measured the average duration and linguistic information (i.e., number of syllables) of the speech unit in children with typical development. The two studies showed a significant increase both in duration and in the syllabic component. Walker et al. (Reference Walker, Archibald, Cherniak and Fish1992) found a mean length of 3.87 syllables per speech unit in children aged three years, and of 4.77 syllables in children aged five. Haselager et al. (Reference Haselager, Slis and Rietveld1991) provided mean values of 5.4 syllables at age five, 6.6 at age seven, 7.3 at age nine, and 7.4 at age eleven. Studying long-term changes in the speech of two groups of children with speech delay, Flipsen (Reference Flipsen2002) found mean values ranging from 4.85 syllables at age four to 6.97 at age nine, and to 7.32 at age fourteen.
A complementary approach to the speech unit is to consider its linguistic components in words and clauses. A common basic way to index and track linguistic changes in the child's speech is to calculate the Mean Length of Utterance (MLU) out of a child's speech production over a period of time or during a given task (Brown, Reference Brown1973). In a longitudinal study on discourse prosody in children's narratives, Kallay and Redford (Reference Kallay and Redford2016) found an increase in MLU – measured as the number of fluently produced words per speech unit – in children aged five to seven years, with values ranging from 4.79 words in the five-year-olds’ narratives to 5.26 words in the six-year-olds’, and to 5.59 in the seven-year-olds’.
Without contesting its relevance as regards the assessment of young children's speaking skills, MLU remains limited in its scope, as it provides an indication of the linguistic structure of the child's speech at the word level only. Curiously, the literature on the speech unit does not appear to document its structure beyond the word level, except for studies on adult's speech that show a direct link between breathing patterns and the duration of the speech unit (Fuchs, Petrone, Krivokapic, & Hoole, Reference Fuchs, Petrone, Krivokapic and Hoole2013; Rochet-Capellan & Fuchs, Reference Rochet-Capellan and Fuchs2013). For example, in a study on spontaneous speech by adult speakers of German, Rochet-Capellan and Fuchs found breathing patterns (e.g., depth and duration of inhalation prior to a run of speech) to vary according to the linguistic component of the following speech unit, considering both the number and the type of clauses. The authors reported an average of 2.11 clauses per speech unit (mean duration: 3.52 seconds).
Given the limited syntactic skills young preschool children demonstrate in their speech compared to their older peers (Diessel, Reference Diessel2004; Jisa, Reference Jisa and Berman2004; Jisa & Kern, Reference Jisa and Kern1998), together with their smaller breathing capacity and the lengthening of the speech unit over age as demonstrated in the above-mentioned studies (Flipsen, Reference Flipsen2002; Haselager et al., Reference Haselager, Slis and Rietveld1991, Walker et al., Reference Walker, Archibald, Cherniak and Fish1992), one would expect major changes over childhood in the linguistic structure of the speech prosodic unit. Studies on child pausing, despite their scarcity in the literature, clearly add indirect support for this view. For instance, using a relative clause elicitation task, McDaniel, McKee, and Garrett (Reference McDaniel, McKee and Garrett2010) found similarities between children aged three to five years and six to eight years and adults in overall pausing patterns, but specific differences, with children showing less hesitation with the short, rather than long, sentences, which they interpreted as evidence for span-limited sentence processing in children. Similar findings were found by Maloney, Payne, and Redford (Reference Maloney, Payne and Redford2012) in a study on spontaneous structured narratives produced by children aged five and seven years and their adult caregivers, with children pausing more frequently, and more within clause boundaries between the verb and the preceding or following NP, than adults. Their results support the view that, unlike adults, children tend to plan speech in smaller chunks than the clause, at the level of the clause constituents (see also Redford, Reference Redford2013).
The way pause patterns evolve during childhood remain unknown. Moreover, as pauses and the packaging of linguistic information in the speech unit are directly related, the course of changes that affect the speech unit should also be studied. However, speech production in children should also be considered in terms of its discourse properties.
Processing speech for narration
As speaking is an intentional and goal-oriented semiotic activity embedded in a social context and communication (Redford, Reference Redford2015), and hence highly subject to variation, one must first consider contextual features as well as the pragmatics of the language behavior the speaker is engaged in when investigating aspects of speech production. In dialog interactive tasks, the production of spontaneous speech is constrained mainly by pragmatic properties attached to the chaining of speech turns (Ochs, Schegloff, & Thompson, Reference Ochs, Schegloff and Thompson1996; Trognon, Batt, Caelen, & Vernant, Reference Trognon, Batt, Caelen and Vernant2011). Speech turns fulfil all sorts of pragmatic acts, ranging from short ‘hello’ types of greetings, ‘sorry’ types of repairs, and ‘yes’ and ‘no’ answers, to slightly longer direct commands and wh-questions such as ‘come here’, ‘who is coming’, and to longer assertive acts when detailed responses and replies are required because of the ongoing dynamics of dialogue. The consequence is that samples of speech prosodic units one can extract from dialog data are likely to be highly heterogeneous in their pragmatic function as well as in their prosodic features and linguistic structure.
By contrast, monolog-type language tasks – such as depicting an object or a scene, narrating an event, giving an explanation, exposing one's stance in a discussion – all bear the same basic pragmatic properties, that of assertive speech acts (Searle & Vanderveken, Reference Searle and Vanderveken1985). In the narration type of monolog task, speech production is highly constrained by textual – coherence and cohesion – properties attached to the goal of narrating an event from start to end, in a relevant if not complete account (Halliday & Hasan, Reference Halliday and Hasan1976), while marking the given vs. new status of each piece of information (Firbas, Reference Firbas1992; Givón, Reference Givón, Gernsbacher and Givón1995). Studies on children's narratives across cultures point out related cognitive abilities that are not yet fully mastered at the end of primary school. These include: knowledge of the appropriate story-telling text format; the ability to assemble information, organize it, and plan text production at the macro-level of the narrative structure; and the ability to use the appropriate linguistic resources to build reference, to contextualize information, and to distribute it in clauses whose chaining shows cohesion and entails coherence via the means of reference tracking and the use of connectors (Berman & Slobin, Reference Berman and Slobin1994; Fayol, Reference Fayol, Kail and Fayol2000; Hickmann, Reference Hickmann2003; Jisa & Kern, Reference Jisa and Kern1998; Karmiloff-Smith, Reference Karmiloff-Smith1979; Peterson & McCabe, Reference Peterson and McCabe1991; Tolchinsky, Reference Tolchinsky and Berman2004). Two major milestones are identified in the literature; the first one when the child enters primary school, and which corresponds to the building of the concept of the narrative text, and the second one when he is about to leave primary school (grade 5), and which corresponds to the emergence of new textual skills – the ability to construct a complete representation of a storyline, the ability to extract relevant information from a set of facts, and the ability to summarize linguistic information (Berman & Slobin, Reference Berman and Slobin1994; Colletta, Reference Colletta2004; Colletta, Pellenq, & Guidetti, Reference Colletta, Pellenq and Guidetti2010; Fayol, Reference Fayol, Kail and Fayol2000; Hickmann, Reference Hickmann2003).
The literature on children's prosody adds further evidence for the later acquisition of specific monolog discourse features and related planning abilities. For instance, in a study on the spontaneous retelling of events by children aged six to eleven years, Colletta (Reference Colletta2009) found differences in vocal and prosodic features when comparing older children's performance to younger children's. In contrast to the monotone and flat prosody-like retelling in children aged six to nine years, older children were found to use heterogeneous prosodic and voicing patterns (e.g., slow speech vs. fast speech, loud vs. low or whispering voice, and vocal expressions of various emotions, together with contrasted use of rising and falling tones) during their performance. This change towards putting more information into voice and prosody was related to a similar change in both gaze patterns and bodily behavior, and was analyzed as contributing to the marking of an increasing complexity in the narration per se, with verbal narratives from older children including personal comments and reported speech, breaks in the narrative thread, contrasts between depicting the background and narrating the foreground, expressing main vs. minor events, and given vs. new information, Similarly, analyzing prosodic patterns – F0 contours, slope steepness, and boundary tones – in greater detail in a longitudinal study on children aged five to eight years narrating a story, Kallay and Redford (Reference Kallay and Redford2016) found that children's narratives gradually become more adult-like in the prosodic domain. The authors interpreted changes in frequency patterns over age as indexing a gradual shift towards a ‘look ahead’ strategy, where speech is planned beyond the forthcoming speech unit.
To sum up, narrating an event requires a hierarchically structured speech plan, and processing speech for narration involves several levels, from the basic and local level of chaining sounds and words together into speech units to the higher superordinate levels of planning what to say next considering what has been said so far, what remains to be said, and in what order. As a consequence, the narrative is the ‘place par excellence’ where it is possible to identify age-related changes, both in terms of speech production and planning at the micro-level of the speech unit and at the macro-level of narration.
Purpose of the study
The objective of this study is to investigate the speech production of children with respect to narrative production, considering both prosodic parameters – speaking rate and duration of the prosodic speech unit – and linguistic components at the micro-level of the speech unit and at the macro-level of the narrative. The study has two parts. First, it aims at documenting the course of both the articulation rate and the duration and linguistic structure of the prosodic unit of speech in typically developing French children aged four to eleven years using an elicited monolog narrative task. Gathering reference data is important for assessment and clinical purposes, and data on the speaking rates in French are not adequately documented despite an impressive body of work on prosody (see Embarki & Dodane, Reference Embarki and Dodane2012; Lacheret-Dujour & Beaugendre, Reference Lacheret-Dujour and Beaugendre1999, for overviews). Apart from a study conducted by Konopczynski and Vinter in Reference Konopczynski and Vinter1994, measures of fluency, when available, are extracted from adult spoken data (Duez & Nishinuma, Reference Duez and Nishinuma1987; Grosjean & Deschamps, Reference Grosjean and Deschamps1975; Schwab & Avanzi, Reference Schwab and Avanzi2015; Zellner, Reference Zellner1998). As for the duration and linguistic component of the prosodic speech unit and the related changes over childhood, our study attempts at gathering reference data for French-speaking children out of a large corpus of elicited oral narratives (see ‘Method’ section below), as none is currently available.
Second, on theoretical grounds, despite the well-known assumption that speech production involves a whole range of abilities – from breathing and speech motor control for articulation to linguistic processing at various levels – studies on speech production in children either focus on short messages and on the micro-level of the packaging of syllables into words or of words into clauses (see Meyer & Wheeldon, Reference Meyer and Wheeldon2006, for a review), or they stress discourse units such as the narrative, and focus on the macro-level of text format, inter-clause relationships, and discourse cohesion. The present study aims at tracking changes in the way the child aged four to eleven years produces speech both at the micro-level of the speech unit and at the macro-level of the narrative in an attempt to detect and question changes in the course of speech production at both levels simultaneously. For this purpose, both prosodic cues (speaking rate, duration, and length of the speech unit, and duration and length of the whole narrative) and structured linguistic information (words and clauses) were extracted from a corpus of children's elicited narratives. We hypothesized that, as children grow older, their narrative performance would show inter-related changes in the speaking rate, the mean length of the speech unit and its structured linguistic component, and the mean length and component of the overall narrative. Due to the lack of metrics on the speech unit in school-age children, there could be no prediction about the precise timing of such changes. Consequently, we expected the course of changes in the speech unit to align with the course of changes in the overall narrative.
Method
Participants
The developmental path towards adult-like narrative abilities being related to the acquisition of reading and writing literacy abilities (Jisa, Reference Jisa and Berman2004), not age only but the schooling curriculum of participants had to be considered. However, pupils in France are not always schooled in the precise level that corresponds to their age. Some schools do not have the exact number of classes corresponding to the three preschool levels (respectively named ‘petite section’, ‘moyenne section’, ‘grande section’) and the five primary school grades, and they often host mixed classes grouping the more advanced of the younger children in a certain grade (e.g., grade 2) with the less advanced of the older children in the next grade (e.g., grade 3).
In our study, 85 French children aged 3½ years to 11½ years, attending the same school in the Grenoble area (France), were recruited in the precise grades corresponding to their age with 24 students in two preschool classes and 61 students in four primary school classes. For the sake of statistical analysis, and because the number of pupils varied across classes, six age groups were constituted out of the sample, considering both age and school grade. Each group was composed of 14 participants on average. The constitution of each group was done with great care considering age limits for inclusion – with no overlap between groups – as well as school grade, gender, and number of participants (see details in Table 2). Although gender was almost equal within the entire population (N = 40 girls + 45 boys), strict equality could not be established within each age group on the basis of the sample.
Study Population

To ensure homogeneity within the sample, all participants were L1 speakers of French language, and all of them had their mean scores on ELO within the standard norms of their age and school grade – ELO (Evaluation du Langage Oral) is a standardized language test that assesses vocabulary, morphology, and syntax in French-speaking children aged three to eleven years (Khomsi, Reference Khomsi2001).
Procedure
The protocol was originally designed for a developmental and cross-linguistic investigation of multimodal narrative abilities in children aged four to eleven years. The study was granted by the French Agence Nationale de la Recherche (project ‘Multimodality’ ANR-05-BLANC-0178-01 and -02). We proposed a narrative task in which each child had to recount to the experimenter an excerpt from an animated film (e.g., the first three minutes of A Close Shave by Nick Park, from the Wallace and Gromit series) that was shown to him/her on a computer in a quiet and separate room at school. The stimulus was selected both for its entertaining qualities and for its simple narrative characteristics, likely to allow retelling from every participant whatever their age. The excerpt shows Gromit the dog awakened at night by a loud noise outside. A sheep escapes from a truck driving along Wallace and Gromit's street, and clandestinely enters their home. At breakfast the following morning, strange things start to happen in the house. Gromit starts to investigate. The narrative performance of each child was filmed using a digital video-recorder together with an external sound recording system (a directional microphone placed on the table near the child).
Coding
All narratives were transcribed and coded using ELAN as an annotation tool.Footnote 1 ELAN is a multi-tier annotator that allows fine-grained alignment of the transcript with the audio source, as illustrated in Figure 1. A coding manual which covers all annotation steps was created so as to provide guidelines for the transcription and coding of the data.Footnote 2 It presents an accurate description of each variable to be coded on the corresponding tier, together with examples. All transcripts were made by two independent coders who settled disagreements whenever they appeared. As for annotation of the speech unit and linguistic components as described below, all annotations and coding were made by trained coders, with an additional coder checking for accuracy of alignment on the audio source, syllabic tabulating, and word-clause segmentation across all files in order to ensure homogeneity in the data.
Screenshot of an ELAN window. The upper part shows a participant narrating from the video extract (left panel), and his verbal performance (right panel). The bottom part shows the speech signal, our annotation system (left panel), and the filled tiers aligned to the audio-video source (right panel).
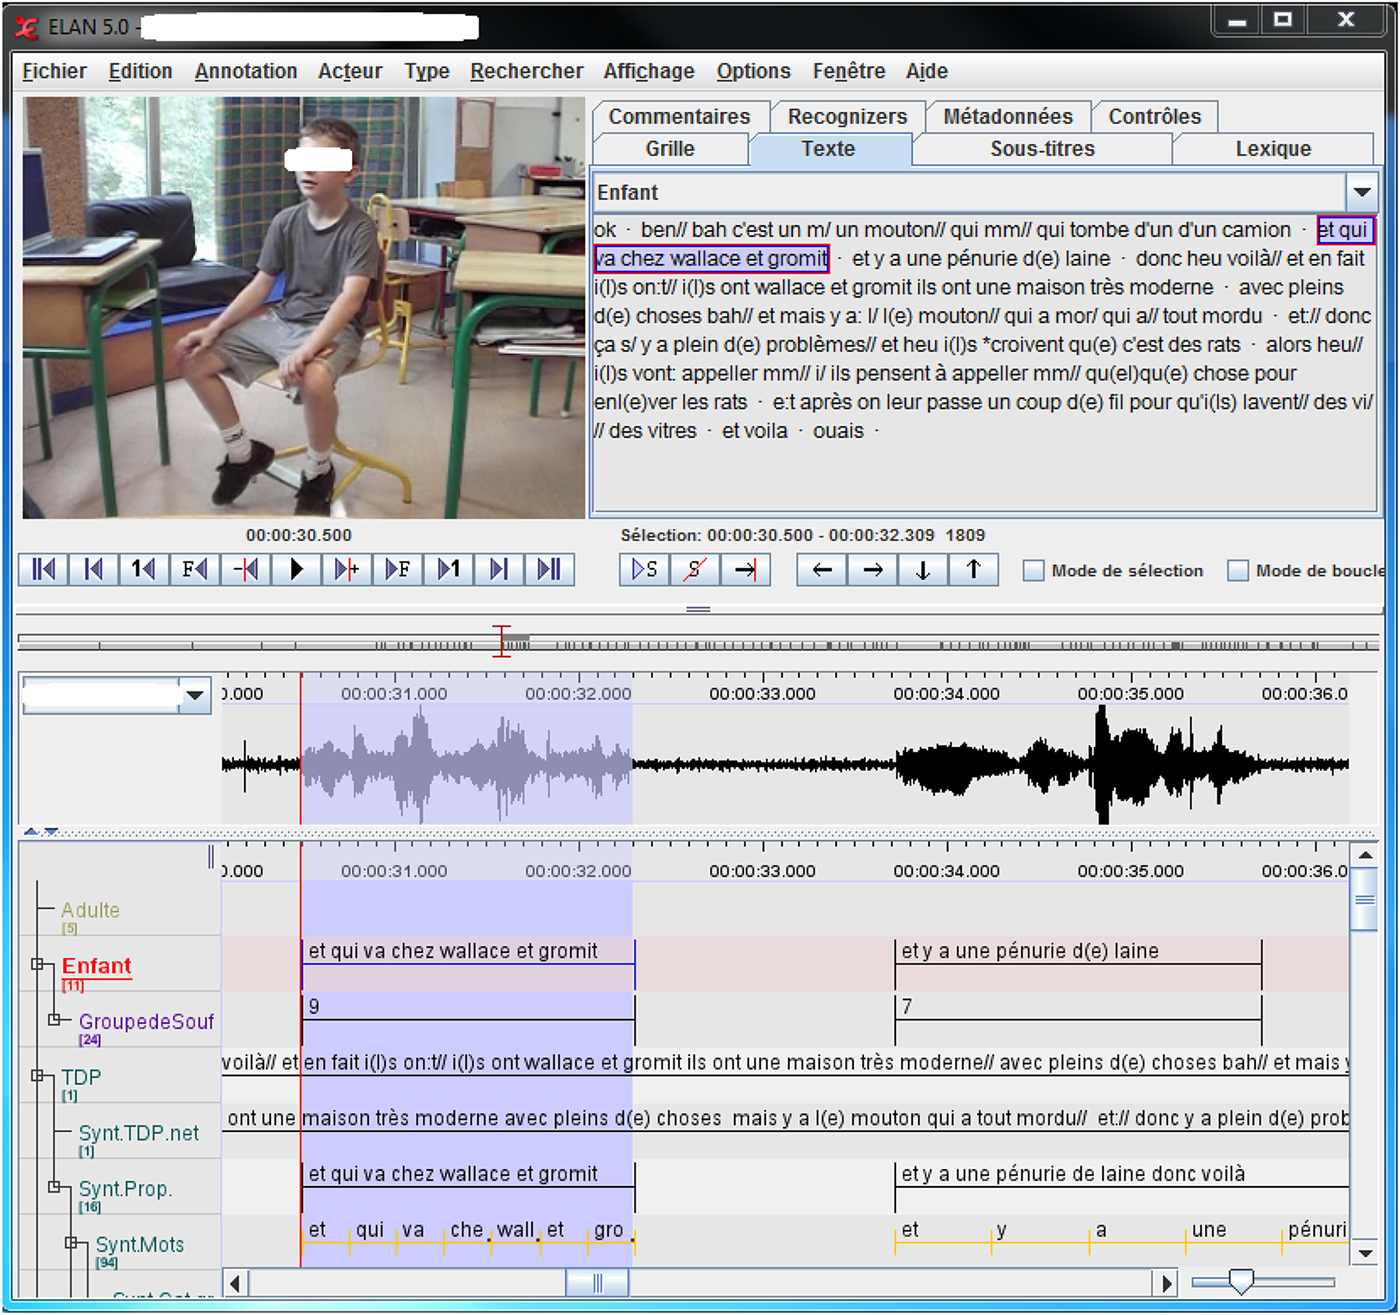
Variables considered for analysis were the following: duration of narration, duration of the speech unit, articulation rate, overall number of syllables, words, speech units, and clauses in the narrative, number of syllables, and words and clauses in the speech unit. The annotation process is described below.
1. Transcription. The coding process started with the transcribing of the words of the interviewer (on the first tier, named ‘Adulte’ in our annotation system) and of the child (on the second tier, named ‘Enfant’). The transcript is orthographic, and it presents the entirety of the remarks of the speakers.
2. Annotation of the speech unit. The child's speech (second tier) was annotated into speech units that we named ‘phonic groups’ after Leon's definition of “a group of syllables composing a sound unit with or without meaning” (Leon, Reference Leon2011, p. 141, our translation). Unlike other similar labels such as ‘phonetic phrase’ or ‘phonetic utterance’, the label ‘phonic group’ (PG) emphasizes a focus on vocal-phonic behavior only and avoids confusion with meaningful linguistic units. In our study, a PG refers to a segment of uninterrupted speech between two silences or pauses. Annotation of speech units was manually and accurately aligned on the speech signal (see Figure 1 for an example) after locating the exact start and end of each PG by both audition and the reading of the visual signal. All voiced segments were considered for annotation. The exact words of the child, including disfluencies such as restarts, repetitions, and rewordings, appear on the corresponding annotation, as Figure 1 shows. As for interruptions of speech, and following den Os (Reference den Os1990), we considered any silent segment greater than 200 ms as a pause.
3. Annotation of the linguistic units
3.1. The following step in the coding process consisted in adding a third tier named ‘Groupe de Souffle’. This tier replicates annotations from the child's speech transcription tier in order to extract the number of syllables out of each annotated PG. Each speaker's behavior was considered as regards pronunciation of the ‘schwa’ (‘e muet’) and the liaison between words, which are subject to cross-individual variation in French (Schwab & Avanzi, Reference Schwab and Avanzi2015).
3.2. In order to extract the number of words and clauses from each narrative re-segmented into speech turns, the transcripts of raw speech (second tier) were copied into new annotations on the fourth ‘TDP’ and fifth ‘Synt.TDP.net’ tiers. On the fifth tier, and for the sake of upcoming syntactic analysis and automatic word segmentation, all marks of vowel lengthening, restarts, and other hints of the speaker's ongoing process of enunciation were removed from the transcript.
3.3. The two following tiers were devoted to syntactic segmentation. On the tier named ‘Synt Prop’, the linguistic information annotated on the fifth tier was segmented into clauses so as to extract the number of clauses from each narrative. Following other work on child language (Berman & Slobin, Reference Berman and Slobin1994; Diessel, Reference Diessel2004; Jisa & Kern, Reference Jisa and Kern1998), we identified as a clause any speech segment presenting a set of arguments organized around a verb nucleus (e.g., “the man's face is covered with porridge”, “it is so funny”), including non-finite clauses (e.g., “… something eating a plant”). Incomplete clauses were also counted as clauses on the condition that the subject + verb components would be verbalized by the speaker.
3.4. Finally, the linguistic information from clauses extracted in the clause tier was tokenized (i.e., automatically segmented) into words on the tier named ‘Synt Mots’ so as to extract the number of words in each narrative.
An example of a narrative produced by a French nine-year-old is provided in the upper right part of the ELAN window (Figure 1).
In our study, narration time, excluding pauses and silences, is the average time (in seconds) it takes for the participant to verbalize something. In other words, the narration time is equal to the sum of the length of all PGs contained therein. Hence the articulation rate was calculated by dividing the number of syllables by the narration time in seconds. The amount of linguistic information per narrative was measured for PGs, syllables, words, and clauses. Finally, we measured the amount of linguistic information per PG for syllables, words, and clauses so as to track age-related changes not only at the level of the entire narrative production, but also at the level of the speech unit. This way we obtained PG density measures for syllables, words, and clauses.
Results
As a first analysis showed no effect of gender, as well as no interaction between age and gender, all subsequent analyses were performed across genders with age as the within-subject factor. In order to select appropriate statistical tests, we analyzed the normality of the distribution for each group, as assessed by the Shapiro–Wilk's test (p < .05). We conducted a one-way ANOVA when the distribution was normal and when the Levene's test of homogeneity of variances was not significant, using the Fisher LSD post-hoc test with Bonferroni correction (p < .05). We conducted a Welch ANOVA when the Levene's test was significant, using the Games–Howell post-hoc test (p < .05). We used the non-parametric Kruskal–Wallis test when the distribution was not normal, and pairwise comparisons were performed using Dunn's procedure with Bonferroni correction (p < .05). Statistical details on all comparisons are provided in the supplementary materials (available at < https://doi.org/10.1017/S0305000918000235).
Our results show a significant increase with age in the duration of the narration as well as in all other variables. Table 3 shows the mean values for the narration time and the articulation rate. As expected, older children talked longer (95 sec. on average) and spoke faster (4.29 syllables/sec. on average) than younger children (narration time: 42 sec.; articulation rate: 3.84 syllables/sec.).
Mean (SD) Median for Narration Time and Articulation Rate by Age

A Kruskal–Wallis H test showed that the median scores of narration time were significantly different between groups (χ 2(5) = 23.950, p < .001). The post-hoc analysis revealed significant differences between the 4–5YRS group and the four older age groups (7YRS to 11YRS), and between the 6YRS age group and the four older age groups, but not between the 4–5YRS and 6YRS age groups, as illustrated in Figure 2 (left panel).
Increase in mean narration time in seconds (left panel; medians & confidence interval), mean and articulation rate in syll./sec. (right panel; M & SD) with age.

Table 3 shows the average scores for the articulation rate measured in syllables per second. A one-way ANOVA showed an effect of age (F(5,79) = 3.956, p = .003, η 2 = 0.20). Articulation rate increased from the 4–5YRS age group to the 6YRS, 8–9YRS, 10YRS, and 11YRS age groups, in that order, with the 7YRS age group remaining the lowest. The Fisher LSD post-hoc analysis revealed a significant difference in scores between the first two age groups (4–5YRS and 6YRS) and the 11YRS age group. There was another significant difference in scores between the 7YRS age group and the three older age groups (8–9YRS to 11YRS), as illustrated in Figure 2 (Figure 3 right panel).
Increase in mean number of clauses (left panel; M & SD) and of PGs (right panel; M & SD).

The narration time being twice as long in the older children's groups compared to the younger children's group, one would expect the narratives produced by older children to contain more linguistic information than the narratives produced by their younger counterparts. Indeed, analysis of the linguistic data showed a large increase on all measures, with the mean number of PGs, syllables, words, and clauses per narrative increasing respectively, between the 4–5YRS age group and the 10YRS age group, from 33 to 50 PGs, from 156 to 407 syllables, from 112 to 304 words, from 19 to 54 clauses (see Table 4).
Mean Number (SD) of PGs, Syllables, Words, and Clauses by Age

The one-way Welch ANOVA showed an effect of age on the four linguistic variables, i.e., number of PGs (Welch's F(5,35.370) = 4.371, p = .003), Syllables (Welch's F(5,34.756) = 11.512, p < .001), Words (Welch's F(5,34.479) = 13.779, p < .001), and Clauses (Welch's F(5,33.834) = 13.913, p < .001). The scores in these variables increased from the 4–5YRS age group to the 11YRS age group, but the timing of changes differed between speech unit (PG) and the other variables. A Games–Howell post-hoc analysis revealed a significant increase in scores in three linguistic variables (Clauses, Words, Syllables) between the 4–5YRS age group and the last four age groups (7YRS to 11YRS), and between the 6YRS age group and the two older (10YRS and 11YRS) age groups. Figure 3 (left panel) illustrates this pattern for the mean number of clauses across groups. As for the mean number of PGs, the post-hoc test revealed a significant difference between the 4–5YRS age group who got the lowest value, and the 10YRS age group who got the second highest value (see Figure 3, right panel). Other differences observed between groups did not reach significance.
We now consider linguistic production at the level of the phonic group. In Table 5, we present results for the PG time (i.e., the mean duration of a PG) and PG density measures (mean number of syllables/words/clauses per PG) within each age group. Not only does the number of PGs per narrative increase with age, but the mean duration of a PG also increases with age, and jumps from 1.25 sec to 1.97 sec. between the 4–5YRS age group and the 11YRS age group. Yet, the timing of changes in PG time over age follows a very distinct pattern from that of the number of PGs per narrative.
Mean Number (SD) Median of PG Time and PG Density by Age

A one-way ANOVA showed that mean PG time scores were significantly different between age groups (F(5,79) = 5.868, p < .0005, η 2 = 0.271). A Fisher post-hoc analysis revealed that the increase from the younger 4–5YRS age group to the five other groups was significant, as well as the increase between the first four age groups (4–5YRS to 8–9YRS) to the 11YRS age group, but that there was no significant difference between the 6YRS, 7YRS, 8–9YRS, and 10YRS age groups, as illustrated in Figure 4 (left panel).
Increase in mean PG time in seconds (left panel; M & SD) and in mean number of clauses per PG (right panel; medians & confidence interval) with age.

Considering the linguistic structure of the PG over age, and following our reasoning on the effect of narration time on the amount of linguistic information, we would expect the PGs produced by older children to contain more linguistic information than the PGs produced by their younger counterparts. Analysis of the linguistic component of the PGs confirmed a statistically significant increase on all measures, with the syllabic, lexical, and clausal content jumping respectively, between the 4–5YRS age group and the 11YRS age group, from 4.73 to 8.32 syllables per PG, from 3.44 to 6.30 words per PG, and from 0.60 to 1.11 clauses per PG (see Table 5).
A Kruskal–Wallis H test showed that the median scores of each of the three PG density measures were significantly different between groups (χ 2(5) = 37.061, p < .001) for syllables per PG, (χ 2(5) = 30.982, p < .001) for words per PG, and (χ 2(5) = 29.383, p < .001) for clauses per PG. The post-hoc analysis revealed significant differences in median scores between the 4–5YRS age group and the 7YRS to 11 YRS age groups for the number of syllables, between the 4–5YRS age group and the 8–9YRS to 11YRS age groups for the number of words, and between the 4–5YRS age group and the 10YRS and 11 YRS age groups for the number of clauses (as illustrated in Figure 4).
In line with this last result, a correlation analysis using the Pearson test was conducted to explore correlations between age and the computed variables. All correlations were found significant, with strong positive correlations (r > .5) between age and narration measures (number of syllables, words, and clauses), as well as between age and density measures (number of syllables, words, and clauses per PG). In addition, the regression analysis showed that age explained 32% of the variance in the number of syllables per PG, and 28% of the variance in the number of clauses per PG.
Discussion
The purpose of the study was first to help document articulation rate and the packaging of words and clauses into speech units in typically developing French children aged four to eleven years in an elicited narrative task. Second, it aimed at characterizing the relationship between speech production at the micro-level of the phonic group and at the macro-level of the narrative, and in doing so, questioning its course during childhood.
To sum up our results, the older the child, the longer his/her narration becomes, the faster he/she talks, the more he/she recounts the events from the animated movie, and the more he/she distributes the linguistic information in phonic groups that grow longer and become syntactically more complex so as to include more than one clause on average in the older children's narration. Our study extends results on French-speaking children previously established from a smaller sample (Colletta, Pellenq, & Rousset, Reference Colletta, Pellenq and Rousset2008) for both the articulation rate and the duration and linguistic structure of the phonic group. It confirms, for French-speaking populations, the slow but steady increase in articulation rate over age that was observed in several studies on English-speaking populations as shown in Table 1. It also confirms a strong increase in the duration and linguistic structure of the phonic group reported in available studies on English-speaking children (Flipsen, Reference Flipsen2002). This convergence in results suggests that, together with articulation rate, measures of the speech unit during a narrative are a robust index to estimate speech production during childhood.
Assessment and clinical issues
Our study attempts to yield some reference data for speech production in French-speaking children aged four to eleven years. These are critical ages for language assessment, diagnosis, and treatment services by language pathologists and speech therapists, and for special needs education by trained teachers. Examples below focus on two contrasted speech production performances typical of that of a child aged four years, and of that of an eleven-year-old. On average, the four-year-old child produces a short narration of less than one minute composed of just over a hundred words organized into about 30 speech units and 20 clauses. He/she makes relatively frequent pauses and packages linguistic information into short phonic groups of 1.25 sec. that often contain far less than a clause (0.60 clause per PG on average). By contrast, on average the child aged eleven years produces a longer narration of one and a half minutes composed of about 300 words organized into 50 speech units and over 50 clauses. He/she makes relatively fewer pauses than his/her younger peer, and he/she packages linguistic information into phonic groups of almost 2 sec. that often contain more than one clause (1.11 clause per PG on average).
However, despite their showing an obvious effect of age, the measures we report here come out of a pioneering study on French-speaking children, and one should be cautious in presenting them as reference data for the following two reasons. First, this study needs to be replicated in other geographical areas in France in order to control for dialectal variation in pronunciation, as our enrollment of participants was limited to one single geographical area. Second, one should also consider variation across children: within each age group some children produce short narratives while others produce much longer narratives, and some children may speak faster than others. Standard deviation extracted from the data shows that the duration and the linguistic components of the narrative (Tables 3–4) vary a lot, whereas both articulation rate (Table 3) and phonic group measures (Table 5) show less variation and much more stability across children. As a consequence, future studies aimed at providing reference data on speech production in French children should preferably focus on articulation rate and phonic group measures.
On the development of speech production in a narrative task
Turning to theoretical considerations, the increase in measures on the overall narrative, obtained from children aged four to eleven years, were expected, and the study merely replicates findings from past studies on children performing narrative tasks (Berman & Slobin, Reference Berman and Slobin1994; Colletta, Reference Colletta2004; Colletta et al., Reference Colletta, Pellenq and Guidetti2010; Hickmann, Reference Hickmann2003). Similarly, the results on articulation rate confirm for French-speaking populations a slow and fairly continuous increase during childhood, as suggested from results on English-speaking populations. Such an increase could index either growing cognitive skills in memory (Adams & Gathercole, Reference Adams and Gathercole1995; Ferguson, Bowey & Tilley, Reference Ferguson, Bowey and Tilley2002) or in speech motor control (Nip & Green, Reference Nip and Green2013), or be the consequence of better abilities in linguistic processing. However, the course of language acquisition shows strong milestones – from early word production to later extension of the lexicon, acquisition of morphemic units, and complex sentence production – which is not entirely compatible with the fact that the rate at which a child speaks increases slowly and rather steadily.
More interesting results come from analysis of the duration and linguistic structure of the speech unit, showing a significant increase in the duration of the phonic group with age and, most importantly, a significant increase in its informational content that can be observed both at the syntactic level of the clause and at the levels of its lexical and syllabic components. The fact that at the age of eleven years, the child's phonic group is made up of more than one clause on average, whereas the four-year-old child has to verbalize two phonic groups to produce one clause, is particularly significant. Tentatively, we interpret this increase in phonic group measures as an index of growing cognitive abilities in the planning of verbal output at the level of the clause. We discuss this point below, while sketching a broader conclusion from our results.
Another interesting result comes from the confrontation of two sets of measures – narration measures on the one hand (i.e., narration time and overall syllable/word/clause production), and phonic group measures (i.e., PG time and number of syllables/words/clauses per PG) on the other – which suggests the existence of two distinct developmental patterns: the first with a significant increase in the duration and linguistic component of the narrative between the ages of four–five and seven years; the second with two significant increases in the length of the PG, one between the ages of four and six years and the other around eleven years of age.
The duration and the amount of linguistic information in the narrative are indicators (among others) of the narrative skills that are gradually emerging in children. Corresponding to grade one at school, the stage of six–seven years is important both in terms of the building of the concept of text and the linguistic tools which ensure textual cohesion/coherence in monolog discourse. Previous studies demonstrated that children of this age produce fewer scripts (short sequences of prototypical action) in favor of chains of events demonstrating a narrative organization (Fayol, Reference Fayol, Kail and Fayol2000), and that their use of linguistic markers specific to text cohesion (pronouns, determiners, spatial and temporal locators) begins to generalize (Hickmann, Reference Hickmann2003). In other words, considering narrative production, there seems to be a major milestone for narrative abilities when the child enters primary school, which our results reflect.
In contrast, measures of the phonic group such as its duration and its linguistic structure shed light on the micro-level of speech production as well as on its online structuring in uninterrupted linguistic segments. As stated in the third section, speech production at the level of the speech unit involves bio-physiological constraints on breathing, cognitive skills such as working memory span, lexical access, and phonetic encoding, and it depends on the nature of the linguistic information to be transmitted. The results from our study point to two milestones, the first one when the child is in the last year of preschool, the second one when he/she reaches the last year of primary school, during which the phonic group becomes significantly longer and allows for the verbalization of speech segments that contain more linguistic information. Without denying the effect of age on the above-mentioned abilities, as well as on abilities underpinning vocalization (breathing, sustained vocalization, articulatory coordination), one cannot fail to relate this evolution to syntactic development in production. Studying the emergence of complex syntactic structures between age two and age five, Diessel (Reference Diessel2004) showed that the child utterance evolves from simple syntactic structures (fixed constructions based on structures such as “to want to do + something”, dialogue structures such as “P because Q” with P being verbalized by the speaker) towards expressing the complex relationships involving coordination and/or subordination. In the Diessel study, such a developmental change was reflected in longer utterances in the verbal repertoire of older children. Subsequent research should examine the relationship between prosody and syntax through the detailed syntactic analysis of the phonic group in the data – over 4,200 occurrences in total. One would expect to find some qualitative change in the syntactic structures that compose the phonic groups in the speech of the six-year-olds compared to the phonic groups in the speech of the four-year-olds.
As for the second milestone located at around ten years of age, we view it as related to new conceptions of text and new textual skills (e.g., the ability to construct a complete representation of a storyline, the ability to extract relevant information from a set of facts, the ability to summarize linguistic information) that emerge at this age (Fayol, Reference Fayol, Kail and Fayol2000). As a consequence, while children aged nine to ten years struggle in delivering an accurate and complete account of events from the story, children at the threshold of secondary schooling – aged eleven years and over – and adults who can be credited with such abilities omit secondary events, focus on the main information from the story, and produce shorter oral narrations than the former, which they commonly enrich with commentaries (Colletta, Reference Colletta2004; Colletta et al., Reference Colletta, Pellenq and Guidetti2010). Our hypothesis is that the emergence of new textual abilities – which enable the narrator to plan speech at the macro-level of the narrative – show in the planning of speech at the micro-level of the speech unit, more specifically in the ability to verbalize several clauses in the phonic group, and thus in the processing of speech at the inter-clause level. Here again, a follow-up study should focus on the relationship between prosody and syntax through the detailed syntactic analysis of the phonic group.
Moreover, to gain a better insight into the issue of planning speech both at the micro-level of the speech unit and at the macro-level of the narration, one cannot but take into account the utterance production parameters mentioned in the literature, which are hesitations and pauses on the one hand (Maloney et al., Reference Maloney, Payne and Redford2012; Redford, Reference Redford2013), and on the other hand, co-speech gesture which we know is an integral part of the process of speech production (Mayberry & Jacques, Reference Mayberry, Jacques and McNeill2000; McNeill, Reference McNeill2005). For instance, the study of representational gesture production in spontaneous talk as well as in elicited language tasks led psycholinguists to reconsider the theoretical models for speech production (Kita & Özyürek, Reference Kita and Özyürek2003; McNeill & Duncan, Reference McNeill, Duncan and McNeill2000; de Ruiter, Reference de Ruiter and McNeill2000). Thanks to its imagistic properties, the import of representational gesture production in the study of online speech production in children would help us to better understand the processing and planning of speech at different ages, as also suggested by Redford (Reference Redford2015). Given the results from the present study, the linking of prosody (phonic groups and pauses), syntax, and gesture production in the study of children's narratives sounds an exciting and promising line of research for the future.
Acknowledgements
The data was gathered thanks to funding by the French National Research Agency (grant number ANR-05-BLANC-0178-01 and -02). We are grateful to teachers and students from the school ‘les Béalières’, Meylan, France, and to the people who helped to gather the data: Emilie Villand and Jennifer Pellenq. We also thank the people who participated in the coding of the data under ELAN: Magdalena Augustyn, Aurore Batista, Yana Bezinska, Virginie Ducey-Kaufmann, Ramona N. Kunene, Lidia Miladi, Asela Reig-Alamillo, Jean-Pascal Simon, and Aurélie Venouil.
Supplementary materials
For supplementary materials for this paper, please visit <https://doi.org/10.1017/S0305000918000235>.


