


1. Introduction
This paper is the third in a series describing an ongoing programme to find high-redshift radio galaxies with powerful radio emission (HzRGs; redshift $z \gt 2$
and 500-MHz radio luminosity
$z \gt 2$
and 500-MHz radio luminosity $L_{500\,\textrm{MHz}} \gt 10^{27}$
W Hz
$L_{500\,\textrm{MHz}} \gt 10^{27}$
W Hz $^{-1}$
; see review by Miley & De Breuck Reference Miley and De Breuck2008). In particular, to find new candidates, we have cross-matched the wideband 72–231 MHz GaLactic and Extragalactic All-sky Murchison Widefield Array (MWA; Tingay et al. Reference Tingay2013) survey (GLEAM; Wayth et al. Reference Wayth2015) with the Visible and Infrared Survey Telescope for Astronomy (VISTA; Dalton et al. Reference Dalton, McLean and Iye2006; Emerson, McPherson, & Sutherland Reference Emerson, McPherson and Sutherland2006) Kilo-degree Infrared Galaxy survey (VIKING; Edge et al. Reference Edge2013). In Drouart et al. (Reference Drouart2020), we described a pilot study of four HzRG candidates, introducing a novel selection technique that considers both radio spectral steepness and curvature within the GLEAM band. This study led to the discovery of GLEAM J0856
$^{-1}$
; see review by Miley & De Breuck Reference Miley and De Breuck2008). In particular, to find new candidates, we have cross-matched the wideband 72–231 MHz GaLactic and Extragalactic All-sky Murchison Widefield Array (MWA; Tingay et al. Reference Tingay2013) survey (GLEAM; Wayth et al. Reference Wayth2015) with the Visible and Infrared Survey Telescope for Astronomy (VISTA; Dalton et al. Reference Dalton, McLean and Iye2006; Emerson, McPherson, & Sutherland Reference Emerson, McPherson and Sutherland2006) Kilo-degree Infrared Galaxy survey (VIKING; Edge et al. Reference Edge2013). In Drouart et al. (Reference Drouart2020), we described a pilot study of four HzRG candidates, introducing a novel selection technique that considers both radio spectral steepness and curvature within the GLEAM band. This study led to the discovery of GLEAM J0856 $+$
0223, a powerful radio galaxy at
$+$
0223, a powerful radio galaxy at $z=5.55$
, as well as another potentially ultra-high-redshift source that was further investigated in two companion studies (GLEAM J0917+0012; Drouart et al. Reference Drouart2021; Seymour et al. Reference Seymour2022). Then, in Broderick et al. (Reference Broderick2022), henceforth B22, we defined a larger GLEAM–VIKING sample of 53 HzRG candidates (including GLEAM J0856
$z=5.55$
, as well as another potentially ultra-high-redshift source that was further investigated in two companion studies (GLEAM J0917+0012; Drouart et al. Reference Drouart2021; Seymour et al. Reference Seymour2022). Then, in Broderick et al. (Reference Broderick2022), henceforth B22, we defined a larger GLEAM–VIKING sample of 53 HzRG candidates (including GLEAM J0856 $+$
0223 and GLEAM J0917
$+$
0223 and GLEAM J0917 $+$
0012).
$+$
0012).
Our primary aim is that the B22 sample will provide high-quality candidate powerful radio galaxies at $z \gt 5$
; we will henceforth refer to such sources as ultra-high-redshift radio galaxies (UHzRGs). Finding UHzRGs, particularly those within the Epoch of Reionisation (EoR;
$z \gt 5$
; we will henceforth refer to such sources as ultra-high-redshift radio galaxies (UHzRGs). Finding UHzRGs, particularly those within the Epoch of Reionisation (EoR; $z \gtrsim 6.5$
), would provide further vital observational constraints for theoretical explanations of the formation and rapid growth of supermassive black holes (SMBHs) in the early Universe with mass
$z \gtrsim 6.5$
), would provide further vital observational constraints for theoretical explanations of the formation and rapid growth of supermassive black holes (SMBHs) in the early Universe with mass $M_\textrm{BH} \sim 10^{8-9}$
M
$M_\textrm{BH} \sim 10^{8-9}$
M $_\odot$
(e.g. Volonteri Reference Volonteri2012; Johnson et al. Reference Johnson, Whalen, Li and Holz2013; Latif & Ferrara Reference Latif and Ferrara2016; Smith, Bromm, & Loeb Reference Smith, Bromm and Loeb2017; Wise et al. Reference Wise2019; Smith & Bromm Reference Smith and Bromm2019; Inayoshi, Visbal, & Haiman Reference Inayoshi, Visbal and Haiman2020; Kroupa et al. Reference Kroupa, Subr, Jerabkova and Wang2020; Di Matteo, Angles-Alcazar, & Shankar Reference Di Matteo, Angles-Alcazar and Shankar2023). Identifying powerful radio galaxies within the EoR would also provide bright background radio sources to facilitate searches for redshifted 21-cm hydrogen absorption by the neutral intergalactic medium, including the 21-cm forest from intervening material along the line of sight (e.g. Carilli et al. Reference Carilli, Gnedin, Furlanetto and Owen2004; Mack & Wyithe Reference Mack and Wyithe2012; Ciardi et al. Reference Ciardi, Inoue, Mack, Xu and Bernardi2015), and also allow vital constraints to be placed on active galactic nucleus (AGN) feedback (e.g. review by Hardcastle & Croston Reference Hardcastle and Croston2020) at early cosmic times.
$_\odot$
(e.g. Volonteri Reference Volonteri2012; Johnson et al. Reference Johnson, Whalen, Li and Holz2013; Latif & Ferrara Reference Latif and Ferrara2016; Smith, Bromm, & Loeb Reference Smith, Bromm and Loeb2017; Wise et al. Reference Wise2019; Smith & Bromm Reference Smith and Bromm2019; Inayoshi, Visbal, & Haiman Reference Inayoshi, Visbal and Haiman2020; Kroupa et al. Reference Kroupa, Subr, Jerabkova and Wang2020; Di Matteo, Angles-Alcazar, & Shankar Reference Di Matteo, Angles-Alcazar and Shankar2023). Identifying powerful radio galaxies within the EoR would also provide bright background radio sources to facilitate searches for redshifted 21-cm hydrogen absorption by the neutral intergalactic medium, including the 21-cm forest from intervening material along the line of sight (e.g. Carilli et al. Reference Carilli, Gnedin, Furlanetto and Owen2004; Mack & Wyithe Reference Mack and Wyithe2012; Ciardi et al. Reference Ciardi, Inoue, Mack, Xu and Bernardi2015), and also allow vital constraints to be placed on active galactic nucleus (AGN) feedback (e.g. review by Hardcastle & Croston Reference Hardcastle and Croston2020) at early cosmic times.
While an increasing number of radio-loud quasars are now known at $z \gt 5$
(e.g. Bañados et al. Reference Bañados2018, Reference Bañados2021, Reference Bañados2023; Ighina et al. Reference Ighina2021, Reference Ighina2022, Reference Ighina2023, Reference Ighina2024a,Reference Ighinab; Momjian et al. Reference Momjian, Bañados, Carilli, Walter and Mazzucchelli2021; Gloudemans et al. Reference Gloudemans2022; Belladitta et al. Reference Belladitta2023), all but one of these sources are not radio powerful according to our aforementioned luminosity criterion. The exception is PSO J352.4034
$z \gt 5$
(e.g. Bañados et al. Reference Bañados2018, Reference Bañados2021, Reference Bañados2023; Ighina et al. Reference Ighina2021, Reference Ighina2022, Reference Ighina2023, Reference Ighina2024a,Reference Ighinab; Momjian et al. Reference Momjian, Bañados, Carilli, Walter and Mazzucchelli2021; Gloudemans et al. Reference Gloudemans2022; Belladitta et al. Reference Belladitta2023), all but one of these sources are not radio powerful according to our aforementioned luminosity criterion. The exception is PSO J352.4034 $-$
15.3373 at
$-$
15.3373 at $z=5.84$
(Bañados et al. Reference Bañados2018).Footnote
a
These radio-loud quasars are also not obscured (in the rest-frame ultraviolet and optical). The discovery of the obscured AGN COS-87259 at
$z=5.84$
(Bañados et al. Reference Bañados2018).Footnote
a
These radio-loud quasars are also not obscured (in the rest-frame ultraviolet and optical). The discovery of the obscured AGN COS-87259 at $z=6.85$
(Endsley et al. Reference Endsley2022, Reference Endsley2023b) was therefore a particularly noteworthy development. This source has
$z=6.85$
(Endsley et al. Reference Endsley2022, Reference Endsley2023b) was therefore a particularly noteworthy development. This source has $M_\textrm{BH} \gtrsim 1.5 \times 10^9$
M
$M_\textrm{BH} \gtrsim 1.5 \times 10^9$
M $_\odot$
(Endsley et al. Reference Endsley2023b) and is the only confirmed obscured and radio-loud (yet weakly radio emitting:
$_\odot$
(Endsley et al. Reference Endsley2023b) and is the only confirmed obscured and radio-loud (yet weakly radio emitting: $L_{500\,\textrm{MHz}} \approx 6.9 \times 10^{25}$
W Hz
$L_{500\,\textrm{MHz}} \approx 6.9 \times 10^{25}$
W Hz $^{-1}$
) AGN currently known at
$^{-1}$
) AGN currently known at $z \gt 6$
. Additionally, the source COSW-106725 is a candidate
$z \gt 6$
. Additionally, the source COSW-106725 is a candidate $z \sim 7.7$
obscured AGN with
$z \sim 7.7$
obscured AGN with $M_\textrm{BH} \geq 6.4 \times 10^8$
M
$M_\textrm{BH} \geq 6.4 \times 10^8$
M $_\odot$
(Lambrides et al. Reference Lambrides2024). If the redshift is confirmed, and depending on the extrapolation of the radio spectrum below 100 MHz, this source would have
$_\odot$
(Lambrides et al. Reference Lambrides2024). If the redshift is confirmed, and depending on the extrapolation of the radio spectrum below 100 MHz, this source would have $L_{500\,\textrm{MHz}} \approx 2.3 \times 10^{27}$
W Hz
$L_{500\,\textrm{MHz}} \approx 2.3 \times 10^{27}$
W Hz $^{-1}$
, that is, it would be powerful in the radio.
$^{-1}$
, that is, it would be powerful in the radio.
Gilli et al. (Reference Gilli2022) suggested that 80–90% of SMBHs at $z = 6$
–8 are obscured, mainly by the dense interstellar medium (ISM) of the host galaxy. Moreover, Johnson & Upton Sanderbeck (Reference Johnson and Upton Sanderbeck2022) presented a model where sustained super-Eddington growth remains hidden due to the extreme infall rate of material, preventing any radiation from escaping. These authors demonstrated that the obscured super-Eddington accretion rates can be maintained even for non-spherical accretion (i.e. more disc-like accretion), which would allow a pathway for radio jets to emerge. Therefore, a compelling picture is beginning to emerge in which radio selection, relatively unaffected by a dense ISM in the host galaxy, may play an especially vital role in finding AGN in the early Universe. Indeed, using wide-area radio surveys such as GLEAM to find obscured AGN provides a unique way to probe this population at high redshift. We note that if the radio lobes are sufficiently compact and within the host galaxy, there could be free–free absorption by the ISM, particularly at lower frequencies (e.g. Bicknell, Dopita, & O’Dea Reference Bicknell, Dopita and O’Dea1997). By selection, the B22 sample will have low-frequency turnovers, which could be due to free–free absorption. Hence, it is of particular interest whether the B22 sample contains brighter radio analogues of COS-87259.
$z = 6$
–8 are obscured, mainly by the dense interstellar medium (ISM) of the host galaxy. Moreover, Johnson & Upton Sanderbeck (Reference Johnson and Upton Sanderbeck2022) presented a model where sustained super-Eddington growth remains hidden due to the extreme infall rate of material, preventing any radiation from escaping. These authors demonstrated that the obscured super-Eddington accretion rates can be maintained even for non-spherical accretion (i.e. more disc-like accretion), which would allow a pathway for radio jets to emerge. Therefore, a compelling picture is beginning to emerge in which radio selection, relatively unaffected by a dense ISM in the host galaxy, may play an especially vital role in finding AGN in the early Universe. Indeed, using wide-area radio surveys such as GLEAM to find obscured AGN provides a unique way to probe this population at high redshift. We note that if the radio lobes are sufficiently compact and within the host galaxy, there could be free–free absorption by the ISM, particularly at lower frequencies (e.g. Bicknell, Dopita, & O’Dea Reference Bicknell, Dopita and O’Dea1997). By selection, the B22 sample will have low-frequency turnovers, which could be due to free–free absorption. Hence, it is of particular interest whether the B22 sample contains brighter radio analogues of COS-87259.
It is well known that there is a tight correlation between near-infrared K-band (2.2 $\unicode{x03BC}$
m) magnitude and redshift for powerful radio galaxies, which are among the most massive galaxies at a given redshift (the K–z relation; e.g. Lilly & Longair Reference Lilly and Longair1984; Eales et al. Reference Eales, Rawlings, Law-Green, Cotter and Lacy1997; van Breugel et al. Reference van Breugel, Stanford, Spinrad, Stern and Graham1998; Willott et al. Reference Willott, Rawlings, Jarvis and Blundell2003; Rocca-Volmerange et al. Reference Rocca-Volmerange, Le Borgne, De Breuck, Fioc and Moy2004). This K-band light from the host galaxy traces the old stellar population at low redshift, although it gradually probes the optical and then the ultraviolet with increasing redshift. Given the K–z relation, an HzRG search can be made significantly more efficient by selecting only those sources in large radio catalogues with K-band magnitudes fainter than a given cutoff (e.g. Ker et al. Reference Ker, Best, Rigby, Röttgering and Gendre2012). Dedicated K-band follow-up of HzRG candidate samples has been commonplace in the literature (e.g. Chambers et al. Reference Chambers1996; van Breugel et al. Reference van Breugel1999; Jarvis et al. Reference Jarvis2001, Reference Jarvis, Cruz, Cohen, Röttgering and Kassim2004; De Breuck et al. Reference De Breuck2002, Reference De Breuck, Hunstead, Sadler, Rocca-Volmerange and Klamer2004; Cruz et al. Reference Cruz2006; Bryant et al. Reference Bryant2009; Saxena et al. Reference Saxena2018, Reference Saxena2019).
$\unicode{x03BC}$
m) magnitude and redshift for powerful radio galaxies, which are among the most massive galaxies at a given redshift (the K–z relation; e.g. Lilly & Longair Reference Lilly and Longair1984; Eales et al. Reference Eales, Rawlings, Law-Green, Cotter and Lacy1997; van Breugel et al. Reference van Breugel, Stanford, Spinrad, Stern and Graham1998; Willott et al. Reference Willott, Rawlings, Jarvis and Blundell2003; Rocca-Volmerange et al. Reference Rocca-Volmerange, Le Borgne, De Breuck, Fioc and Moy2004). This K-band light from the host galaxy traces the old stellar population at low redshift, although it gradually probes the optical and then the ultraviolet with increasing redshift. Given the K–z relation, an HzRG search can be made significantly more efficient by selecting only those sources in large radio catalogues with K-band magnitudes fainter than a given cutoff (e.g. Ker et al. Reference Ker, Best, Rigby, Röttgering and Gendre2012). Dedicated K-band follow-up of HzRG candidate samples has been commonplace in the literature (e.g. Chambers et al. Reference Chambers1996; van Breugel et al. Reference van Breugel1999; Jarvis et al. Reference Jarvis2001, Reference Jarvis, Cruz, Cohen, Röttgering and Kassim2004; De Breuck et al. Reference De Breuck2002, Reference De Breuck, Hunstead, Sadler, Rocca-Volmerange and Klamer2004; Cruz et al. Reference Cruz2006; Bryant et al. Reference Bryant2009; Saxena et al. Reference Saxena2018, Reference Saxena2019).
The B22 HzRG candidate sample was partly selected on the basis of VIKING $K_\textrm{s}$
-band (2.15
$K_\textrm{s}$
-band (2.15 $\unicode{x03BC}$
m) host galaxy non-detections:
$\unicode{x03BC}$
m) host galaxy non-detections: $K_\textrm{s} \gt 21.2$
mag (
$K_\textrm{s} \gt 21.2$
mag ( $5\unicode{x03C3}$
point-source limits presented in Table 5 in B22; median seeing full width at half maximum (FWHM) 0
$5\unicode{x03C3}$
point-source limits presented in Table 5 in B22; median seeing full width at half maximum (FWHM) 0 $.\!^{\prime\prime}$
83; AB). As was described in B22, three of the 53 sources in our sample have deeper limits from the Southern H-ATLASFootnote
b
Regions
$.\!^{\prime\prime}$
83; AB). As was described in B22, three of the 53 sources in our sample have deeper limits from the Southern H-ATLASFootnote
b
Regions $K_\textrm{s}$
-band Survey (SHARKS; Dannerbauer et al. Reference Dannerbauer, Carnero, Cross and Gutierrez2022). A further four sources have
$K_\textrm{s}$
-band Survey (SHARKS; Dannerbauer et al. Reference Dannerbauer, Carnero, Cross and Gutierrez2022). A further four sources have $K_\textrm{s}$
-band host galaxy detections from Very Large Telescope (VLT; European Southern Observatory 1998) observations using the High-Acuity Widefield K-band Imager (HAWK-I; Kissler-Patig et al. Reference Kissler-Patig2008), including both GLEAM J0856
$K_\textrm{s}$
-band host galaxy detections from Very Large Telescope (VLT; European Southern Observatory 1998) observations using the High-Acuity Widefield K-band Imager (HAWK-I; Kissler-Patig et al. Reference Kissler-Patig2008), including both GLEAM J0856 $+$
0223 and GLEAM J0917
$+$
0223 and GLEAM J0917 $+$
0012 from the Drouart et al. (Reference Drouart2020) pilot study. In this paper, we significantly increase the number of sources in our sample with deep
$+$
0012 from the Drouart et al. (Reference Drouart2020) pilot study. In this paper, we significantly increase the number of sources in our sample with deep $K_\textrm{s}$
-band imaging by presenting the results from a HAWK-I
$K_\textrm{s}$
-band imaging by presenting the results from a HAWK-I $K_\textrm{s}$
-band observing campaign for an additional 35 targets. Such deep HAWK-I imaging allows us to further narrow down the best UHzRG candidates compared to the VIKING selection alone; for this particular observing campaign, the improvement in sensitivity is
$K_\textrm{s}$
-band observing campaign for an additional 35 targets. Such deep HAWK-I imaging allows us to further narrow down the best UHzRG candidates compared to the VIKING selection alone; for this particular observing campaign, the improvement in sensitivity is $\sim$
1–2 mag at an equivalent detection threshold. Hence, we can significantly increase the efficiency of spectroscopic follow-up, which can be an expensive and often challenging process, particularly in terms of observing time given that (U)HzRGs have a very low surface density (e.g. Miley & De Breuck Reference Miley and De Breuck2008).
$\sim$
1–2 mag at an equivalent detection threshold. Hence, we can significantly increase the efficiency of spectroscopic follow-up, which can be an expensive and often challenging process, particularly in terms of observing time given that (U)HzRGs have a very low surface density (e.g. Miley & De Breuck Reference Miley and De Breuck2008).
The layout of this paper is as follows. In Section 2, we describe the HAWK-I observations as well as our method for detecting the host galaxies and measuring their magnitudes. We also outline how a compilation of radio and near-infrared flux densities was obtained for both the B22 sample and (U)HzRGs from the literature. We present our results in Section 3, including the host galaxy magnitudes as well as the $K_\textrm{s}$
-band–radio overlay plots for our best UHzRG targets. A discussion follows in Section 4, in particular focusing on (i) how our data set compares to the literature in radio–near-infrared flux density space, and (ii) plausible scenarios for our best UHzRG candidates. We then present our conclusions in Section 5. Lastly, Appendix 1 contains the remaining overlay plots as well as notes on individual sources.
$K_\textrm{s}$
-band–radio overlay plots for our best UHzRG targets. A discussion follows in Section 4, in particular focusing on (i) how our data set compares to the literature in radio–near-infrared flux density space, and (ii) plausible scenarios for our best UHzRG candidates. We then present our conclusions in Section 5. Lastly, Appendix 1 contains the remaining overlay plots as well as notes on individual sources.
In this paper, we use the following conventions. Uncertainties are given as $\pm 1\unicode{x03C3}$
. Magnitudes are given in the AB system (Oke Reference Oke1974); to convert between Vega and AB magnitudes, we use the relation
$\pm 1\unicode{x03C3}$
. Magnitudes are given in the AB system (Oke Reference Oke1974); to convert between Vega and AB magnitudes, we use the relation $K_\textrm{s, AB} = K_\textrm{s, Vega} + 1.85$
as given in, for example, Blanton & Roweis (Reference Blanton and Roweis2007). We also assume a flat, Lambda cold dark matter (
$K_\textrm{s, AB} = K_\textrm{s, Vega} + 1.85$
as given in, for example, Blanton & Roweis (Reference Blanton and Roweis2007). We also assume a flat, Lambda cold dark matter ( $\Lambda$
CDM) cosmology with Hubble constant
$\Lambda$
CDM) cosmology with Hubble constant $H_0=67.7$
km s
$H_0=67.7$
km s $^{-1}$
Mpc
$^{-1}$
Mpc $^{-1}$
, matter density parameter
$^{-1}$
, matter density parameter $\Omega_\textrm{M}=0.31$
, and vacuum density parameter
$\Omega_\textrm{M}=0.31$
, and vacuum density parameter $\Omega_{\Lambda}=0.69$
(Planck Collaboration et al. Reference Collaboration2020). Additionally,
$\Omega_{\Lambda}=0.69$
(Planck Collaboration et al. Reference Collaboration2020). Additionally, $\log$
refers to the decimal logarithm (base 10).
$\log$
refers to the decimal logarithm (base 10).
2. Observations, data reduction and analysis
2.1 HAWK-I observing campaign and data products
Our HAWK-I observations of the B22 sample (49 targets without previous HAWK-I observations) took place from 2021 October 20 to 2022 March 30 in service mode (ESO period P108; programme ID 108.22HY.001). HAWK-I has a field of view (FoV) of $7\hbox{$.\mkern-4mu^\prime$}$ $5 \times 7\hbox{$.\mkern-4mu^\prime$}5$
and an average pixel size of 0
$5 \times 7\hbox{$.\mkern-4mu^\prime$}5$
and an average pixel size of 0 $.\!^{\prime\prime}$
1066. There were some very small differences in pixel size from image to image, but only at the level of the fourth decimal place. For 33 sources, observations comprised 12 sets of
$.\!^{\prime\prime}$
1066. There were some very small differences in pixel size from image to image, but only at the level of the fourth decimal place. For 33 sources, observations comprised 12 sets of $17 \times 10$
s jittered exposures, where the jitter box width was set to 30
$17 \times 10$
s jittered exposures, where the jitter box width was set to 30 $^{\prime\prime}$
, that is, 34 min on-source per target. Shorter observations were possible for two sources: J0129
$^{\prime\prime}$
, that is, 34 min on-source per target. Shorter observations were possible for two sources: J0129 $-$
3109 (680 s) and J0216–3301 (510 s). To improve the seeing, we used the GRound layer Adaptive optics Assisted by Lasers (GRAAL); the angular resolution ranged from 0
$-$
3109 (680 s) and J0216–3301 (510 s). To improve the seeing, we used the GRound layer Adaptive optics Assisted by Lasers (GRAAL); the angular resolution ranged from 0 $.\!^{\prime\prime}$
33–0
$.\!^{\prime\prime}$
33–0 $.\!^{\prime\prime}$
78 FWHM, with a median value of 0
$.\!^{\prime\prime}$
78 FWHM, with a median value of 0 $.\!^{\prime\prime}$
46. While our programme was not fully completed by the end of P108, we obtained science-quality images for 71% of the targets (35/49 sources), with most observations having a quality control grade ‘A’ and a handful ‘B’. Reduced data were mostly obtained from the automatic HAWK-I pipeline,Footnote
c
although for J0042
$.\!^{\prime\prime}$
46. While our programme was not fully completed by the end of P108, we obtained science-quality images for 71% of the targets (35/49 sources), with most observations having a quality control grade ‘A’ and a handful ‘B’. Reduced data were mostly obtained from the automatic HAWK-I pipeline,Footnote
c
although for J0042 $-$
3515, J0129
$-$
3515, J0129 $-$
3109, and J0216–3301 some manual data reduction steps were necessary.
$-$
3109, and J0216–3301 some manual data reduction steps were necessary.
2.2 $\textbf{K}_{\mathbf{s}}$
-band magnitude calibration
$\textbf{K}_{\mathbf{s}}$
-band magnitude calibration

An initial magnitude calibration was provided by the automatic HAWK-I pipeline. Then, as in B22, we used the Two-Micron All-Sky Survey (2MASS; Skrutskie et al. Reference Skrutskie2006) point-source catalogue (Cutri et al. Reference Cutri2003) to refine the magnitude calibration of the images. We used a sample of bright stars ( $K_\textrm{s} \lt 16.9$
mag) within the HAWK-I FoV to calculate the inverse-variance-weighted mean magnitude offset to subtract from the host galaxy magnitude. These corrections were mostly small, with a median value of 0.13 mag. The one large outlier was the correction required for J0042
$K_\textrm{s} \lt 16.9$
mag) within the HAWK-I FoV to calculate the inverse-variance-weighted mean magnitude offset to subtract from the host galaxy magnitude. These corrections were mostly small, with a median value of 0.13 mag. The one large outlier was the correction required for J0042 $-$
3515: 3.25 mag. However, given that the standard error of the weighted mean is only 0.01 mag in this case, we have confidence that the calibrated magnitude for the host galaxy of this source is reliable. Galactic extinction was not corrected for given that the corrections are much smaller than the magnitude uncertainties for our targets.
$-$
3515: 3.25 mag. However, given that the standard error of the weighted mean is only 0.01 mag in this case, we have confidence that the calibrated magnitude for the host galaxy of this source is reliable. Galactic extinction was not corrected for given that the corrections are much smaller than the magnitude uncertainties for our targets.
2.3 Host galaxy magnitude measurements
We adopted a conservative approach when searching for the $K_\textrm{s}$
-band counterparts of our targets. While some sources have multiple potential host galaxy candidates, we only assigned a host when a
$K_\textrm{s}$
-band counterparts of our targets. While some sources have multiple potential host galaxy candidates, we only assigned a host when a $K_\textrm{s}$
-band source is plausibly close to the radio centroid, as one might expect for a compact radio source. Otherwise, the source was classified as having a
$K_\textrm{s}$
-band source is plausibly close to the radio centroid, as one might expect for a compact radio source. Otherwise, the source was classified as having a $K_\textrm{s}$
-band non-detection. We will further discuss this strategy in Section 4.3.
$K_\textrm{s}$
-band non-detection. We will further discuss this strategy in Section 4.3.
Host galaxy magnitudes were determined as follows. Firstly, we used Source Extractor (sextractor; Bertin & Arnouts Reference Bertin and Arnouts1996) to efficiently identify as many host galaxy detections as possible. To increase the reliability of the results, we used a signal-to-noise (S/N) detection threshold $\geq 3$
over at least three connected pixels. However, it became apparent that some sources were not detected by sextractor using the above connected pixel criterion, yet there was visual evidence of a host galaxy (e.g. faint diffuse emission). Therefore, to ensure that the host galaxy magnitudes were determined in as consistent a manner as possible, we instead used photutils (Bradley et al. Reference Bradley2021) to measure a magnitude in a 2
$\geq 3$
over at least three connected pixels. However, it became apparent that some sources were not detected by sextractor using the above connected pixel criterion, yet there was visual evidence of a host galaxy (e.g. faint diffuse emission). Therefore, to ensure that the host galaxy magnitudes were determined in as consistent a manner as possible, we instead used photutils (Bradley et al. Reference Bradley2021) to measure a magnitude in a 2 $^{\prime\prime}$
diameter circular aperture for each source. We chose an aperture of this size as it is one of the standard choices used in the literature and many of our host galaxy detections are compact (as one might expect for a source at high redshift). In some cases, a larger circular aperture would be more appropriate to enclose all of the flux density from a given source; further information is provided in Appendix 1.
$^{\prime\prime}$
diameter circular aperture for each source. We chose an aperture of this size as it is one of the standard choices used in the literature and many of our host galaxy detections are compact (as one might expect for a source at high redshift). In some cases, a larger circular aperture would be more appropriate to enclose all of the flux density from a given source; further information is provided in Appendix 1.
Each aperture was centred on, in order of preference, (i) the flux-weighted centre as determined by sextractor, (ii) the $K_\textrm{s}$
-band centroid as estimated by eye if the S/N was insufficient for (i), or (iii) the radio centroid when (ii) was deemed to be inaccurate due to low S/N. For (iii), we used the high-resolution Australia Telescope Compact Array (ATCA; Frater, Brooks, & Whiteoak Reference Frater, Brooks and Whiteoak1992) data from B22 where available, factoring in both the angular resolution and S/N to choose the most accurate position at either 5.5 or 9 GHz. If high-resolution ATCA data were not available, we instead used the radio position from the 3-GHz VLA Sky Survey (VLASS; Lacy et al. Reference Lacy2020).
$K_\textrm{s}$
-band centroid as estimated by eye if the S/N was insufficient for (i), or (iii) the radio centroid when (ii) was deemed to be inaccurate due to low S/N. For (iii), we used the high-resolution Australia Telescope Compact Array (ATCA; Frater, Brooks, & Whiteoak Reference Frater, Brooks and Whiteoak1992) data from B22 where available, factoring in both the angular resolution and S/N to choose the most accurate position at either 5.5 or 9 GHz. If high-resolution ATCA data were not available, we instead used the radio position from the 3-GHz VLA Sky Survey (VLASS; Lacy et al. Reference Lacy2020).
A host galaxy detection was regarded as significant if the integrated flux density determined with photutils within the 2 $^{\prime\prime}$
diameter aperture had S/N
$^{\prime\prime}$
diameter aperture had S/N $\geq 3$
. The flux density statistical uncertainty was calculated by randomly placing
$\geq 3$
. The flux density statistical uncertainty was calculated by randomly placing $1\,000 \times 2$ $^{\prime\prime}$
diameter apertures within each image, avoiding sources. The
$^{\prime\prime}$
diameter apertures within each image, avoiding sources. The $1\unicode{x03C3}$
uncertainty was then the standard deviation of these measurements. Each magnitude uncertainty was also calculated with the appropriate error propagation. In some cases (see the notes on individual sources in Appendix 1), we repeated this exercise with apertures of different sizes. For non-detections, we report a
$1\unicode{x03C3}$
uncertainty was then the standard deviation of these measurements. Each magnitude uncertainty was also calculated with the appropriate error propagation. In some cases (see the notes on individual sources in Appendix 1), we repeated this exercise with apertures of different sizes. For non-detections, we report a $3\unicode{x03C3}$
flux density (magnitude) upper (lower) limit. Moreover, for detections, we conservatively added a 2% flux density calibration error in quadrature with the statistical uncertainty (followed by error propagation to obtain the magnitude uncertainty).
$3\unicode{x03C3}$
flux density (magnitude) upper (lower) limit. Moreover, for detections, we conservatively added a 2% flux density calibration error in quadrature with the statistical uncertainty (followed by error propagation to obtain the magnitude uncertainty).
2.4 Radio and near-infrared flux densities for the B22 sample and (U)HzRGs from the literature
In Fig. 1, we plot the 150-MHz radio flux density, $S_{150\,\rm{MHz}}$
, versus 2.2-
$S_{150\,\rm{MHz}}$
, versus 2.2- $\unicode{x03BC}$
m near-infrared flux density,
$\unicode{x03BC}$
m near-infrared flux density, $S_{2.2\,\unicode{x03BC}\rm{m}}$
, for 40/53 sources from the B22 sample as well as (to the best of our knowledge) all of the known powerful radio galaxies at
$S_{2.2\,\unicode{x03BC}\rm{m}}$
, for 40/53 sources from the B22 sample as well as (to the best of our knowledge) all of the known powerful radio galaxies at $z \gt 3$
with
$z \gt 3$
with $L_{500\,\textrm{MHz}} \gt 10^{27}$
W Hz
$L_{500\,\textrm{MHz}} \gt 10^{27}$
W Hz $^{-1}$
and
$^{-1}$
and $K_\textrm{s}$
-band data, plus the obscured, radio-loud AGN COS-87259 at
$K_\textrm{s}$
-band data, plus the obscured, radio-loud AGN COS-87259 at $z=6.85$
(42 sources from the literature in total, one of which is also in the B22 sample: the UHzRG GLEAM J0856
$z=6.85$
(42 sources from the literature in total, one of which is also in the B22 sample: the UHzRG GLEAM J0856 $+$
0223 at
$+$
0223 at $z=5.55$
discovered by Drouart et al. Reference Drouart2020).
$z=5.55$
discovered by Drouart et al. Reference Drouart2020).
150-MHz radio flux density (ordinate) versus 2.2- $\unicode{x03BC}$
m near-infrared flux density (bottom abscissa) for 40/53 radio sources from the B22 sample as well as for other HzRGs and UHzRGs from the literature with
$\unicode{x03BC}$
m near-infrared flux density (bottom abscissa) for 40/53 radio sources from the B22 sample as well as for other HzRGs and UHzRGs from the literature with $3.08 \leq z \leq 6.85$
. Also plotted are four lines denoting various radio to near-infrared flux density ratios:
$3.08 \leq z \leq 6.85$
. Also plotted are four lines denoting various radio to near-infrared flux density ratios: $S_{150\,\rm{MHz}} / S_{2.2\,\unicode{x03BC}\rm{m}} =10^{3}$
–
$S_{150\,\rm{MHz}} / S_{2.2\,\unicode{x03BC}\rm{m}} =10^{3}$
– $10^{6}$
. The top abscissa shows the AB magnitudes corresponding to a selection of the 2.2-
$10^{6}$
. The top abscissa shows the AB magnitudes corresponding to a selection of the 2.2- $\unicode{x03BC}$
m flux densities. Note that one of the grey ‘
$\unicode{x03BC}$
m flux densities. Note that one of the grey ‘ $+$
’ symbols is augmented with a triangle to denote a 2.2-
$+$
’ symbols is augmented with a triangle to denote a 2.2- $\unicode{x03BC}$
m flux density upper limit. For the sake of clarity, error bars are not plotted. Further details on the figure, including a discussion of the data presented, can be found in Sections 2 and 4. The references used for the 150-MHz flux densitie are as follows: Waldram et al. (Reference Waldram, Yates, Riley and Warner1996), Hurley-Walker et al. (Reference Hurley-Walker2017), Intema et al. (Reference Intema, Jagannathan, Mooley and Frail2017), and Endsley et al. (Reference Endsley2022). Furthermore, the references used for the 2.2-
$\unicode{x03BC}$
m flux density upper limit. For the sake of clarity, error bars are not plotted. Further details on the figure, including a discussion of the data presented, can be found in Sections 2 and 4. The references used for the 150-MHz flux densitie are as follows: Waldram et al. (Reference Waldram, Yates, Riley and Warner1996), Hurley-Walker et al. (Reference Hurley-Walker2017), Intema et al. (Reference Intema, Jagannathan, Mooley and Frail2017), and Endsley et al. (Reference Endsley2022). Furthermore, the references used for the 2.2- $\unicode{x03BC}$
m flux densities and magnitudes are as follows: Eales et al. (Reference Eales1993), van Breugel et al. (Reference van Breugel, Stanford, Spinrad, Stern and Graham1998), van Breugel et al. (Reference van Breugel1999), Villani & di Serego Alighieri (Reference Villani and di Serego Alighieri1999), Stern & Spinrad (Reference Stern and Spinrad1999), Jarvis et al. (Reference Jarvis2001), De Breuck et al. (Reference De Breuck2002, Reference De Breuck, Hunstead, Sadler, Rocca-Volmerange and Klamer2004), Brookes et al. (Reference Brookes, Best, Rengelink and Röttgering2006), Cruz et al. (Reference Cruz2006), Seymour et al. (Reference Seymour2007), Jarvis et al. (Reference Jarvis2009), Parijskij et al. (Reference Parijskij2014), Saxena et al. (Reference Saxena2018, Reference Saxena2019), Drouart et al. (Reference Drouart2020), Seymour et al. (Reference Seymour2022), Endsley et al. (Reference Endsley2022) and B22.
$\unicode{x03BC}$
m flux densities and magnitudes are as follows: Eales et al. (Reference Eales1993), van Breugel et al. (Reference van Breugel, Stanford, Spinrad, Stern and Graham1998), van Breugel et al. (Reference van Breugel1999), Villani & di Serego Alighieri (Reference Villani and di Serego Alighieri1999), Stern & Spinrad (Reference Stern and Spinrad1999), Jarvis et al. (Reference Jarvis2001), De Breuck et al. (Reference De Breuck2002, Reference De Breuck, Hunstead, Sadler, Rocca-Volmerange and Klamer2004), Brookes et al. (Reference Brookes, Best, Rengelink and Röttgering2006), Cruz et al. (Reference Cruz2006), Seymour et al. (Reference Seymour2007), Jarvis et al. (Reference Jarvis2009), Parijskij et al. (Reference Parijskij2014), Saxena et al. (Reference Saxena2018, Reference Saxena2019), Drouart et al. (Reference Drouart2020), Seymour et al. (Reference Seymour2022), Endsley et al. (Reference Endsley2022) and B22.

From the B22 sample, we only considered the sources that have deep HAWK-I or SHARKS $K_\textrm{s}$
-band images presented either in this paper (35 sources) or by us previously (six sources including GLEAM J0856
$K_\textrm{s}$
-band images presented either in this paper (35 sources) or by us previously (six sources including GLEAM J0856 $+$
0223; Drouart et al. Reference Drouart2020; Seymour et al. Reference Seymour2022; B22). The literature sources were obtained from the compilation of
$+$
0223; Drouart et al. Reference Drouart2020; Seymour et al. Reference Seymour2022; B22). The literature sources were obtained from the compilation of $3 \lt z \lt 5$
radio galaxies in Miley & De Breuck (Reference Miley and De Breuck2008, with the exception of two sources which only had optical and not near-infrared identifications), with additional sources from Jarvis et al. (Reference Jarvis2009), Saxena et al. (Reference Saxena2019) and Yamashita et al. (Reference Yamashita2020). We also included the UHzRGs TN J0924
$3 \lt z \lt 5$
radio galaxies in Miley & De Breuck (Reference Miley and De Breuck2008, with the exception of two sources which only had optical and not near-infrared identifications), with additional sources from Jarvis et al. (Reference Jarvis2009), Saxena et al. (Reference Saxena2019) and Yamashita et al. (Reference Yamashita2020). We also included the UHzRGs TN J0924 $-$
2201 (z = 5.19; van Breugel et al. Reference van Breugel1999) and TGSS J1530+1049 (z = 5.72; Saxena et al. Reference Saxena2018). However, we did not include the radio galaxy VLA J123642
$-$
2201 (z = 5.19; van Breugel et al. Reference van Breugel1999) and TGSS J1530+1049 (z = 5.72; Saxena et al. Reference Saxena2018). However, we did not include the radio galaxy VLA J123642 $+$
621331 at
$+$
621331 at $z=4.42$
(Waddington et al. Reference Waddington1999) as it is a weaker radio source that does not meet our radio luminosity criterion; the
$z=4.42$
(Waddington et al. Reference Waddington1999) as it is a weaker radio source that does not meet our radio luminosity criterion; the $3\unicode{x03C3}$
upper limit at 147.5 MHz from the Tata Institute of Fundamental Research (TIFR) Giant Metrewave Radio Telescope (GMRT; Swarup Reference Swarup, Cornwell and Perley1991) Sky Survey (TGSS) Alternate Data Release 1 (Intema et al. Reference Intema, Jagannathan, Mooley and Frail2017) is about 6 mJy beam
$3\unicode{x03C3}$
upper limit at 147.5 MHz from the Tata Institute of Fundamental Research (TIFR) Giant Metrewave Radio Telescope (GMRT; Swarup Reference Swarup, Cornwell and Perley1991) Sky Survey (TGSS) Alternate Data Release 1 (Intema et al. Reference Intema, Jagannathan, Mooley and Frail2017) is about 6 mJy beam $^{-1}$
.
$^{-1}$
.
The values of $S_{150\,\rm{MHz}}$
and
$S_{150\,\rm{MHz}}$
and $S_{2.2\,\unicode{x03BC}\rm{m}}$
per source were determined as follows.
$S_{2.2\,\unicode{x03BC}\rm{m}}$
per source were determined as follows.
2.4.1 Calculation of 150-MHz flux densities
Apart from two cases, the 150-MHz flux densities were obtained from GLEAM or TGSS. Where GLEAM data were available from both the Extragalactic data release (Hurley-Walker et al. Reference Hurley-Walker2017) as well as the deeper South Galactic Pole data release (Franzen et al. Reference Franzen2021), we used the data from the latter. Furthermore, where GLEAM and TGSS data were available for a particular source, we used the GLEAM flux densities only. Some of the sources in the literature sample are too far north on the sky to have been catalogued in GLEAM, but TGSS data were available instead. The sources without GLEAM or TGSS data are as follows. Firstly, the $z=3.395$
radio galaxy B2 0902
$z=3.395$
radio galaxy B2 0902 $+$
34 is too far north to have been catalogued in GLEAM, but it was also not catalogued in TGSS despite being a bright radio source (possibly due to it being in one of the failed pointings in the survey; see Intema et al. Reference Intema, Jagannathan, Mooley and Frail2017
Footnote
d
), and so we instead used the 151-MHz flux density from the 7C survey (Waldram et al. Reference Waldram, Yates, Riley and Warner1996). Secondly, COS-87259 is too faint to have been catalogued in GLEAM and TGSS, and we instead used the 144-MHz flux density reported in Endsley et al. (Reference Endsley2022) from the Low-Frequency Array (LOFAR; van Haarlem et al. Reference van Haarlem2013) Two-metre Sky Survey (LoTSS; Shimwell et al. Reference Shimwell2017, Reference Shimwell2019, Reference Shimwell2022).
$+$
34 is too far north to have been catalogued in GLEAM, but it was also not catalogued in TGSS despite being a bright radio source (possibly due to it being in one of the failed pointings in the survey; see Intema et al. Reference Intema, Jagannathan, Mooley and Frail2017
Footnote
d
), and so we instead used the 151-MHz flux density from the 7C survey (Waldram et al. Reference Waldram, Yates, Riley and Warner1996). Secondly, COS-87259 is too faint to have been catalogued in GLEAM and TGSS, and we instead used the 144-MHz flux density reported in Endsley et al. (Reference Endsley2022) from the Low-Frequency Array (LOFAR; van Haarlem et al. Reference van Haarlem2013) Two-metre Sky Survey (LoTSS; Shimwell et al. Reference Shimwell2017, Reference Shimwell2019, Reference Shimwell2022).
To enable as consistent a comparison as possible between the B22 sample and the sample from the literature, we did not use the curved fits to the broadband GLEAM data for the former presented in B22, but instead took the 143-, 151-, 158-, and 166-MHz GLEAM flux densities for each source and calculated the inverse-variance-weighted average. This step removes some of the scatter in the single-band GLEAM flux densities. At each frequency, a 2% internal calibration uncertainty (see Hurley-Walker et al. Reference Hurley-Walker2017) was added in quadrature to the fitting error reported in the GLEAM catalogue before the weighted average was computed.
Note that for simplicity, we did not make any corrections for the slightly different central frequencies of the data discussed above, nor for the fact that these values have small offsets from a frequency of 150 MHz. The scale offsets between the data sets used will affect the flux densities by $\lesssim10$
% (or
$\lesssim10$
% (or $ \lesssim 0.04$
dex).
$ \lesssim 0.04$
dex).
The inverse-variance-weighted average 150-MHz GLEAM flux densities for the 35 sources from the B22 sample with HAWK-I data presented in this paper are listed in Table 1. $K_\textrm{s}$
-band properties of the 35 sources observed with HAWK-I. We present the host galaxy magnitudes and corresponding flux densities determined in 2
$K_\textrm{s}$
-band properties of the 35 sources observed with HAWK-I. We present the host galaxy magnitudes and corresponding flux densities determined in 2 $^{\prime\prime}$
diameter circular apertures along with uncertainties. Magnitude (flux density) lower (upper) limits are
$^{\prime\prime}$
diameter circular apertures along with uncertainties. Magnitude (flux density) lower (upper) limits are $3\unicode{x03C3}$
values. Host galaxy positions are from sextractor unless specified with a footnote. Where the
$3\unicode{x03C3}$
values. Host galaxy positions are from sextractor unless specified with a footnote. Where the $K_\textrm{s}$
-band position was sufficiently well determined, we also provide the
$K_\textrm{s}$
-band position was sufficiently well determined, we also provide the $K_\textrm{s}$
-band–radio angular separation. Further details can be found in Sections 2.3 and 3.1. Furthermore, we list 150-MHz inverse-variance-weighted average flux densities from GLEAM; see Section 2.4.1. The uncertainties for these GLEAM flux densities include an extra 8% absolute flux density calibration uncertainty (see Hurley-Walker et al. Reference Hurley-Walker2017) added in quadrature.
$K_\textrm{s}$
-band–radio angular separation. Further details can be found in Sections 2.3 and 3.1. Furthermore, we list 150-MHz inverse-variance-weighted average flux densities from GLEAM; see Section 2.4.1. The uncertainties for these GLEAM flux densities include an extra 8% absolute flux density calibration uncertainty (see Hurley-Walker et al. Reference Hurley-Walker2017) added in quadrature.

Notes. $^\unicode{x2020}$
UHzRG candidate.
$^\unicode{x2020}$
UHzRG candidate. $^\textrm{a}$
Radio position where the aperture was centred; see Appendix 1 for further details.
$^\textrm{a}$
Radio position where the aperture was centred; see Appendix 1 for further details. $^\textrm{b}$
Separation uncertain due to an insufficiently well-constrained
$^\textrm{b}$
Separation uncertain due to an insufficiently well-constrained $K_\textrm{s}$
-band position.
$K_\textrm{s}$
-band position. $^\textrm{c}$
This incipient double-lobed radio source was fitted with a single Gaussian in RACS-mid.
$^\textrm{c}$
This incipient double-lobed radio source was fitted with a single Gaussian in RACS-mid. $^\textrm{d}$
Estimated by eye.
$^\textrm{d}$
Estimated by eye. $^\textrm{e}$
Host galaxy detected in a
$^\textrm{e}$
Host galaxy detected in a $1.\!\!^{\prime\prime}5$
diameter aperture; see the notes on this source in Appendix 1 for further details.
$1.\!\!^{\prime\prime}5$
diameter aperture; see the notes on this source in Appendix 1 for further details. $^\textrm{f}$
Distance from the
$^\textrm{f}$
Distance from the $K_\textrm{s}$
-band identification to the possible radio core visible at 5.5 GHz.
$K_\textrm{s}$
-band identification to the possible radio core visible at 5.5 GHz.
2.4.2 Calculation of 2.2-
$\unicode{x03BC}$
m flux densities

Regarding the 2.2- $\unicode{x03BC}$
m flux densities, different strategies were used in the literature to obtain the most accurate measurement for a given source, particularly regarding the size of the aperture used. Where more than one measurement was available for the literature sample, we used the value from the largest-sized aperture considered in order to increase the likelihood that all of the flux density from the galaxy was enclosed in the aperture. In many cases, this was an 8
$\unicode{x03BC}$
m flux densities, different strategies were used in the literature to obtain the most accurate measurement for a given source, particularly regarding the size of the aperture used. Where more than one measurement was available for the literature sample, we used the value from the largest-sized aperture considered in order to increase the likelihood that all of the flux density from the galaxy was enclosed in the aperture. In many cases, this was an 8 $^{\prime\prime}$
diameter aperture or a 64-kpc diameter aperture. Furthermore, to ensure consistency, we took the magnitude measurements from apertures larger than a 2
$^{\prime\prime}$
diameter aperture or a 64-kpc diameter aperture. Furthermore, to ensure consistency, we took the magnitude measurements from apertures larger than a 2 $^{\prime\prime}$
diameter for the sources J0007
$^{\prime\prime}$
diameter for the sources J0007 $-$
3040, J0034
$-$
3040, J0034 $-$
3112, J0048
$-$
3112, J0048 $-$
3540, J0301
$-$
3540, J0301 $-$
3132, J0326
$-$
3132, J0326 $-$
3013, J0909
$-$
3013, J0909 $-$
0154, J1032
$-$
0154, J1032 $+$
0339, J1040
$+$
0339, J1040 $+$
0150, and J1052
$+$
0150, and J1052 $-$
0318 from the B22 sample (Appendix 1; also see Section 2.3).
$-$
0318 from the B22 sample (Appendix 1; also see Section 2.3).
In Jarvis et al. (Reference Jarvis2009), the 2.2- $\unicode{x03BC}$
m magnitude of the HzRG FIRST J163912.11
$\unicode{x03BC}$
m magnitude of the HzRG FIRST J163912.11 $+$
405236.5 (
$+$
405236.5 ( $z=4.88$
) was estimated to be
$z=4.88$
) was estimated to be $K = 24.2$
mag (4
$K = 24.2$
mag (4 $^{\prime\prime}$
diameter aperture). This estimate was obtained by extrapolating from a 3.6-
$^{\prime\prime}$
diameter aperture). This estimate was obtained by extrapolating from a 3.6- $\unicode{x03BC}$
m detection with an assumed colour (2.2-
$\unicode{x03BC}$
m detection with an assumed colour (2.2- $\unicode{x03BC}$
m
$\unicode{x03BC}$
m $-$
3.6-
$-$
3.6- $\unicode{x03BC}$
m = 2.25 mag). Alternatively, using the photometry reported in Jarvis et al. (Reference Jarvis2009), we followed a similar approach to the one that we used in Seymour et al. (Reference Seymour2022) and carried out broadband spectral energy distribution (SED) fitting with the pégase code (version 3; Fioc & Rocca-Volmerange Reference Fioc and Rocca-Volmerange2019) for different galaxy templates; the 2.2-
$\unicode{x03BC}$
m = 2.25 mag). Alternatively, using the photometry reported in Jarvis et al. (Reference Jarvis2009), we followed a similar approach to the one that we used in Seymour et al. (Reference Seymour2022) and carried out broadband spectral energy distribution (SED) fitting with the pégase code (version 3; Fioc & Rocca-Volmerange Reference Fioc and Rocca-Volmerange2019) for different galaxy templates; the 2.2- $\unicode{x03BC}$
m magnitude in a 4
$\unicode{x03BC}$
m magnitude in a 4 $^{\prime\prime}$
diameter aperture is estimated to be
$^{\prime\prime}$
diameter aperture is estimated to be $K \sim 23.4$
mag (i.e. a flux density a factor of
$K \sim 23.4$
mag (i.e. a flux density a factor of $\sim$
2 brighter:
$\sim$
2 brighter: $S_{2.2\,\unicode{x03BC}\rm{m}}\sim 1.6$ $\unicode{x03BC}$
Jy). We have used our estimated magnitude in this study; in either case, this source is the faintest at 2.2
$\unicode{x03BC}$
Jy). We have used our estimated magnitude in this study; in either case, this source is the faintest at 2.2 $\unicode{x03BC}$
m from our compilation of HzRGs at
$\unicode{x03BC}$
m from our compilation of HzRGs at $3 \lt z \lt 5$
.
$3 \lt z \lt 5$
.
The SHARKS magnitude limit for J0008 $-$
3007 reported in B22 was converted from
$-$
3007 reported in B22 was converted from $5\unicode{x03C3}$
to
$5\unicode{x03C3}$
to $3\unicode{x03C3}$
(i.e. by adding 0.55 mag;
$3\unicode{x03C3}$
(i.e. by adding 0.55 mag; $K_\textrm{s} \gtrsim 23.7$
mag and
$K_\textrm{s} \gtrsim 23.7$
mag and $S_{2.2\,\unicode{x03BC}\rm{m}} \lesssim 1.2$ $\unicode{x03BC}$
Jy; 2
$\unicode{x03BC}$
Jy; 2 $^{\prime\prime}$
diameter aperture). The SHARKS limit for J0007
$^{\prime\prime}$
diameter aperture). The SHARKS limit for J0007 $-$
3040 reported in B22 is superseded by the HAWK-I data presented in this study. Regarding the SHARKS data presented in B22 for J2340
$-$
3040 reported in B22 is superseded by the HAWK-I data presented in this study. Regarding the SHARKS data presented in B22 for J2340 $-$
3230, the interpretation of this source (and hence the validity of a
$-$
3230, the interpretation of this source (and hence the validity of a $3\unicode{x03C3}$
limit) is uncertain (see Section 5.5 in B22), and deeper
$3\unicode{x03C3}$
limit) is uncertain (see Section 5.5 in B22), and deeper $K_\textrm{s}$
-band data are needed. We therefore did not include J2340
$K_\textrm{s}$
-band data are needed. We therefore did not include J2340 $-$
3230 in our analysis, that is, the number of sources from the B22 sample with previously presented deep
$-$
3230 in our analysis, that is, the number of sources from the B22 sample with previously presented deep $K_\textrm{s}$
-band data was reduced from six to five.
$K_\textrm{s}$
-band data was reduced from six to five.
For simplicity, we did not make any corrections for the slightly different central wavelengths of the image filters used in the various studies in the literature (e.g. $K_\textrm{s}$
versus K), and considered all values as measurements at 2.2
$K_\textrm{s}$
versus K), and considered all values as measurements at 2.2 $\unicode{x03BC}$
m.
$\unicode{x03BC}$
m.
3. Results
3.1 Host galaxy magnitudes
The host galaxy magnitude measurements (2 $^{\prime\prime}$
diameter apertures) from our HAWK-I observing campaign are presented in Table 1, along with the corresponding flux density measurements,
$^{\prime\prime}$
diameter apertures) from our HAWK-I observing campaign are presented in Table 1, along with the corresponding flux density measurements, $S_{2.15\,\unicode{x03BC}\textrm{m}}$
, as well as the positions on which the apertures were centred (see Section 2.3). As can be seen in Table 1, 27 out of the 35 sources (77%) were detected in the HAWK-I images. For these detections, the host galaxy magnitudes range from
$S_{2.15\,\unicode{x03BC}\textrm{m}}$
, as well as the positions on which the apertures were centred (see Section 2.3). As can be seen in Table 1, 27 out of the 35 sources (77%) were detected in the HAWK-I images. For these detections, the host galaxy magnitudes range from $K_\textrm{s} \approx 21.6$
–
$K_\textrm{s} \approx 21.6$
– $23.0$
mag. The remaining eight non-detections have
$23.0$
mag. The remaining eight non-detections have $3\unicode{x03C3}$
magnitude lower limits that are generally quite uniform (median depth
$3\unicode{x03C3}$
magnitude lower limits that are generally quite uniform (median depth $K_\textrm{s} \approx 23.3$
mag). We consider five of these non-detections (J0053
$K_\textrm{s} \approx 23.3$
mag). We consider five of these non-detections (J0053 $-$
3256, J1033
$-$
3256, J1033 $+$
0107, J1127
$+$
0107, J1127 $-$
0332, J1443
$-$
0332, J1443 $+$
0229, and J2326
$+$
0229, and J2326 $-$
3028; marked in Table 1 with
$-$
3028; marked in Table 1 with $^\unicode{x2020}$
) to be our best UHzRG candidates, along with J0008
$^\unicode{x2020}$
) to be our best UHzRG candidates, along with J0008 $-$
3007 from B22 (deep SHARKS limit). Notes on individual sources are given in Appendix 1.
$-$
3007 from B22 (deep SHARKS limit). Notes on individual sources are given in Appendix 1.
3.2 Overlay plots
In Fig. 2, we present high-resolution radio contours overlaid on our HAWK-I images for five of the six best UHzRG candidates (see Figure 2 in B22 for the previously presented overlay plot for J0008 $-$
3007). The remaining 30 overlay plots can be found in Fig. A1 in Appendix 1.
$-$
3007). The remaining 30 overlay plots can be found in Fig. A1 in Appendix 1.
Radio contours overlaid on HAWK-I $K_\textrm{s}$
-band images for five of the six best UHzRG candidates from this study, ordered by right ascension. The VLASS (3 GHz; magenta) and ATCA (5.5 and 9 GHz; blue and red, respectively) contours were previously presented in B22, except for the new single-epoch contours from VLASS for J1033
$K_\textrm{s}$
-band images for five of the six best UHzRG candidates from this study, ordered by right ascension. The VLASS (3 GHz; magenta) and ATCA (5.5 and 9 GHz; blue and red, respectively) contours were previously presented in B22, except for the new single-epoch contours from VLASS for J1033 $+$
0107. The contours are a geometric progression in
$+$
0107. The contours are a geometric progression in $\sqrt{2}$
, with the lowest contour at the
$\sqrt{2}$
, with the lowest contour at the $5\unicode{x03C3}$
level; a summary of the contour levels can be found in Table 5 in B22. For the single-epoch image from VLASS for J1033
$5\unicode{x03C3}$
level; a summary of the contour levels can be found in Table 5 in B22. For the single-epoch image from VLASS for J1033 $+$
0107, the updated lowest contour level (
$+$
0107, the updated lowest contour level ( $5\unicode{x03C3}$
) is 0.75 mJy beam
$5\unicode{x03C3}$
) is 0.75 mJy beam $^{-1}$
. In each panel, we also show the radio synthesised beams with different hatching styles (VLASS: vertical; ATCA 5.5 GHz: forward slash; ATCA 9 GHz: backslash). The host galaxy magnitude lower limits are reported in Table 1. The overlay plots for the remaining 30 sources observed with HAWK-I can be found in Fig. A1 in Appendix 1, while the SHARKS/VLASS/ATCA overlay for J0008
$^{-1}$
. In each panel, we also show the radio synthesised beams with different hatching styles (VLASS: vertical; ATCA 5.5 GHz: forward slash; ATCA 9 GHz: backslash). The host galaxy magnitude lower limits are reported in Table 1. The overlay plots for the remaining 30 sources observed with HAWK-I can be found in Fig. A1 in Appendix 1, while the SHARKS/VLASS/ATCA overlay for J0008 $-$
3007, our sixth UHzRG candidate, can be found in Figure 2 in B22. Furthermore, notes on individual sources can be found in Appendix 1.
$-$
3007, our sixth UHzRG candidate, can be found in Figure 2 in B22. Furthermore, notes on individual sources can be found in Appendix 1.

Tracks of modelled 2.2- $\unicode{x03BC}$
m (i.e.
$\unicode{x03BC}$
m (i.e. $K_\textrm{s}$
-band) flux density from pégase for galaxies of different masses formed no earlier than
$K_\textrm{s}$
-band) flux density from pégase for galaxies of different masses formed no earlier than $z=16$
. ‘Ell’ and ‘SB’ refer to an old, 0.5-Gyr elliptical galaxy template and a young, 30-Myr starburst galaxy template, respectively. The elliptical tracks terminate when the age implies a formation redshift above
$z=16$
. ‘Ell’ and ‘SB’ refer to an old, 0.5-Gyr elliptical galaxy template and a young, 30-Myr starburst galaxy template, respectively. The elliptical tracks terminate when the age implies a formation redshift above $z=16$
; see Section 4.2 for more details. As in Fig. 1, we overlay TN J0924
$z=16$
; see Section 4.2 for more details. As in Fig. 1, we overlay TN J0924 $-$
2201, GLEAM J0856
$-$
2201, GLEAM J0856 $+$
0223, TGSS J1530
$+$
0223, TGSS J1530 $+$
1049 and COS-87259, as well as the HzRGs with
$+$
1049 and COS-87259, as well as the HzRGs with $4 \lt z \lt 5$
from our literature sample. We also indicate the median
$4 \lt z \lt 5$
from our literature sample. We also indicate the median $3\unicode{x03C3}$
limit of our deep non-detections (
$3\unicode{x03C3}$
limit of our deep non-detections ( $S_{2.2\,\unicode{x03BC}\rm{m}} \lesssim 1.5$ $\unicode{x03BC}$
Jy; 2
$\unicode{x03BC}$
Jy; 2 $^{\prime\prime}$
diameter apertures). Error bars (
$^{\prime\prime}$
diameter apertures). Error bars ( $\pm1\unicode{x03C3}$
) are plotted (apart from the case of the
$\pm1\unicode{x03C3}$
) are plotted (apart from the case of the $3\unicode{x03C3}$
limit for TGSS J1530
$3\unicode{x03C3}$
limit for TGSS J1530 $+$
1049), but sometimes are smaller than the symbols. When uncertainties were not available in the literature, we assumed a 10% error. Discussion of this figure can be found in Section 4.2.
$+$
1049), but sometimes are smaller than the symbols. When uncertainties were not available in the literature, we assumed a 10% error. Discussion of this figure can be found in Section 4.2.

The radio data used in Figs. 2 and A1 were mostly presented in B22. Apart from four cases outlined below, we have only plotted contours that are at an angular resolution of a few arcsec or better: 3-GHz ‘quick-look’ data from the first epoch of VLASSFootnote
e
as well as 5.5- and 9-GHz ATCA data. For J1030 $+$
0135, J1032
$+$
0135, J1032 $+$
0339, J1033
$+$
0339, J1033 $+$
0107, and J1037
$+$
0107, and J1037 $-$
0325, we used the higher-quality, single-epoch (epoch 2.1) VLASS continuum imagesFootnote
f
instead, which had become available since the B22 study.
$-$
0325, we used the higher-quality, single-epoch (epoch 2.1) VLASS continuum imagesFootnote
f
instead, which had become available since the B22 study.
The overlays for J0007 $-$
3040, J0034
$-$
3040, J0034 $-$
3112, and J1037
$-$
3112, and J1037 $-$
0325 presented in Fig. A1 also include data from the Rapid Australian Square Kilometre Array Pathfinder (ASKAP; Johnston et al. Reference Johnston2007; Hotan et al. Reference Hotan2021) Continuum Survey at 1367.5 MHz (RACS-mid; median angular resolution 11
$-$
0325 presented in Fig. A1 also include data from the Rapid Australian Square Kilometre Array Pathfinder (ASKAP; Johnston et al. Reference Johnston2007; Hotan et al. Reference Hotan2021) Continuum Survey at 1367.5 MHz (RACS-mid; median angular resolution 11 $\hbox{$.\!^{\prime\prime}$}$
2× 9
$\hbox{$.\!^{\prime\prime}$}$
2× 9 $\hbox{$.\!^{\prime\prime}$}$
3; Duchesne et al. Reference Duchesne2023, Reference Duchesne2024).Footnote
g
These RACS-mid data became available near the completion of our study and changed the interpretation of these three sources. Originally thought to be additional UHzRG candidates, these are larger radio sources than previously thought and therefore much more likely to lie at lower redshift. For both J0007
$\hbox{$.\!^{\prime\prime}$}$
3; Duchesne et al. Reference Duchesne2023, Reference Duchesne2024).Footnote
g
These RACS-mid data became available near the completion of our study and changed the interpretation of these three sources. Originally thought to be additional UHzRG candidates, these are larger radio sources than previously thought and therefore much more likely to lie at lower redshift. For both J0007 $-$
3040 and J0034
$-$
3040 and J0034 $-3112$
, the high-resolution VLASS and ATCA contours trace only one of the lobes. Further details can be found in the notes on individual sources in Appendix 1.
$-3112$
, the high-resolution VLASS and ATCA contours trace only one of the lobes. Further details can be found in the notes on individual sources in Appendix 1.
For J2311 $-$
3359, also presented in Fig. A1, given that this source is only faintly detected in the ATCA data presented in B22, and not detected in VLASS, we confirmed the host galaxy identification using the publicly available data (angular resolution 10
$-$
3359, also presented in Fig. A1, given that this source is only faintly detected in the ATCA data presented in B22, and not detected in VLASS, we confirmed the host galaxy identification using the publicly available data (angular resolution 10 $^{\prime\prime}$
) from a recent study by Gürkan et al. (Reference Gürkan2022), who conducted deep 887.5-MHz ASKAP observations of the GAMA-23 field from the Galaxy And Mass Assembly survey (Driver et al. Reference Driver2009, Reference Driver2011, Reference Driver2016).Footnote
h
$^{\prime\prime}$
) from a recent study by Gürkan et al. (Reference Gürkan2022), who conducted deep 887.5-MHz ASKAP observations of the GAMA-23 field from the Galaxy And Mass Assembly survey (Driver et al. Reference Driver2009, Reference Driver2011, Reference Driver2016).Footnote
h $K_\textrm{s}$
-band–radio angular separations are reported in Table 1 for the 25 sources where the
$K_\textrm{s}$
-band–radio angular separations are reported in Table 1 for the 25 sources where the $K_\textrm{s}$
-band position is known to sufficient accuracy. We again used the high-resolution ATCA data where available (factoring in both the angular resolution and S/N to choose the most accurate position at either 5.5 or 9 GHz), or otherwise the VLASS position. However, for J0007
$K_\textrm{s}$
-band position is known to sufficient accuracy. We again used the high-resolution ATCA data where available (factoring in both the angular resolution and S/N to choose the most accurate position at either 5.5 or 9 GHz), or otherwise the VLASS position. However, for J0007 $-$
3040, J0034
$-$
3040, J0034 $-$
3112, J1037
$-$
3112, J1037 $-$
0325, and J2311
$-$
0325, and J2311 $-$
3359, we instead used the ASKAP data from either RACS-mid or the Gürkan et al. (Reference Gürkan2022) study. For multi-component radio sources, the geometric midpoint was calculated unless otherwise specified in Table 1. Given both the mostly compact radio morphologies of the targets and our conservative approach at assigning host galaxy identifications, it is not surprising that the offsets are small, with a median value of approximately 0
$-$
3359, we instead used the ASKAP data from either RACS-mid or the Gürkan et al. (Reference Gürkan2022) study. For multi-component radio sources, the geometric midpoint was calculated unless otherwise specified in Table 1. Given both the mostly compact radio morphologies of the targets and our conservative approach at assigning host galaxy identifications, it is not surprising that the offsets are small, with a median value of approximately 0 $.^{\!{\prime\prime}}$
5.
$.^{\!{\prime\prime}}$
5.
4. Discussion
4.1 Comparison to known HzRGs
As can be seen in Fig. 1 and as was initially discussed in Section 3.1, our detection rate for the B22 sample is high in $K_\textrm{s}$
-band: 78% for the 40 sources plotted. We can see that the B22 sample overlaps with the
$K_\textrm{s}$
-band: 78% for the 40 sources plotted. We can see that the B22 sample overlaps with the $3 \lt z \lt 5$
powerful HzRGs, presenting an extension of the observed trend (i.e. flux density ratios
$3 \lt z \lt 5$
powerful HzRGs, presenting an extension of the observed trend (i.e. flux density ratios $S_{150\,\rm{MHz}} / S_{2.2\,\unicode{x03BC}\rm{m}}$ $\sim$ $10^{4}$
–
$10^{4}$
– $10^{6}$
) towards lower 150-MHz and 2.2-
$10^{6}$
) towards lower 150-MHz and 2.2- $\unicode{x03BC}$
m flux densities. Extreme flux density ratios
$\unicode{x03BC}$
m flux densities. Extreme flux density ratios $\gtrsim10^5$
are not surprising as they arise from a common approach in the various HzRG selection techniques applied in the literature: sufficiently bright radio flux densities to select luminous radio galaxies (most likely powered by SMBHs) combined with faint 2.2-
$\gtrsim10^5$
are not surprising as they arise from a common approach in the various HzRG selection techniques applied in the literature: sufficiently bright radio flux densities to select luminous radio galaxies (most likely powered by SMBHs) combined with faint 2.2- $\unicode{x03BC}$
m magnitudes to ensure that the host galaxy is distant. By and large, these extreme ratios are only seen at
$\unicode{x03BC}$
m magnitudes to ensure that the host galaxy is distant. By and large, these extreme ratios are only seen at $z\gt 1$
(with a notable exception being Cygnus A; e.g. see Figure 5 in Drouart et al. Reference Drouart2021). Fainter 150-MHz and 2.2-
$z\gt 1$
(with a notable exception being Cygnus A; e.g. see Figure 5 in Drouart et al. Reference Drouart2021). Fainter 150-MHz and 2.2- $\unicode{x03BC}$
m flux densities could, generally speaking, result from less massive galaxies with less massive BHs, or an increase in redshift. Which is the dominant of these two effects in the B22 sample is unclear given the lack of spectroscopic redshift information.
$\unicode{x03BC}$
m flux densities could, generally speaking, result from less massive galaxies with less massive BHs, or an increase in redshift. Which is the dominant of these two effects in the B22 sample is unclear given the lack of spectroscopic redshift information.
It should be noted that the sources presented in Fig. 1 have been selected using a variety of multi-wavelength criteria. Additionally, as one moves from lower to higher redshift, k-corrections at both radio and near-infrared wavelengths affect the flux densities. As discussed in Section 3.3 of Drouart et al. (Reference Drouart2021), these k-corrections account for separate segments from the SED that are both approximated by power laws with negative slopes; see that study for further details.
4.2 UHzRG candidates from the B22 sample
Of particular interest in Fig. 1 are the six sources (marked in blue) previously outlined in Section 3.1 as our best UHzRG candidates. This subset of six sources has median $3\unicode{x03C3}$
limits of
$3\unicode{x03C3}$
limits of $K_\textrm{s} \gtrsim 23.5$
mag and
$K_\textrm{s} \gtrsim 23.5$
mag and $S_{2.2\,\unicode{x03BC}\rm{m}} \lesssim 1.5$ $\unicode{x03BC}$
Jy (2
$\unicode{x03BC}$
Jy (2 $^{\prime\prime}$
diameter apertures); moreover,
$^{\prime\prime}$
diameter apertures); moreover, $S_{150\,\rm{MHz}} \gt 200$
mJy. All of these sources have extreme radio to near-infrared flux density ratios,
$S_{150\,\rm{MHz}} \gt 200$
mJy. All of these sources have extreme radio to near-infrared flux density ratios, $S_{150\,\rm{MHz}} / S_{2.2\,\unicode{x03BC}\rm{m}} \gt 10^5$
, similar to a number of the radio galaxies from the literature plotted in Fig. 1, including the UHzRGs TN J0924
$S_{150\,\rm{MHz}} / S_{2.2\,\unicode{x03BC}\rm{m}} \gt 10^5$
, similar to a number of the radio galaxies from the literature plotted in Fig. 1, including the UHzRGs TN J0924 $-$
2201 (
$-$
2201 ( $z=5.19$
), GLEAM J0856
$z=5.19$
), GLEAM J0856 $+$
0223 (
$+$
0223 ( $z=5.55$
), and TGSS J1530
$z=5.55$
), and TGSS J1530 $+$
1049 (
$+$
1049 ( $z=5.72$
). While at least slightly fainter in
$z=5.72$
). While at least slightly fainter in $K_\textrm{s}$
-band than TN J0924
$K_\textrm{s}$
-band than TN J0924 $-$
2201 and GLEAM J0856
$-$
2201 and GLEAM J0856 $+$
0223, our UHzRG candidates have 2.2-
$+$
0223, our UHzRG candidates have 2.2- $\unicode{x03BC}$
m flux density upper limits that are about a factor of two brighter than the upper limit for TGSS J1530
$\unicode{x03BC}$
m flux density upper limits that are about a factor of two brighter than the upper limit for TGSS J1530 $+$
1049:
$+$
1049: $S_{2.2\,\unicode{x03BC}\rm{m}} \lt 0.76$ $\unicode{x03BC}$
Jy and
$\unicode{x03BC}$
Jy and $K_\textrm{s} \gt 24.2$
mag (
$K_\textrm{s} \gt 24.2$
mag ( $3\unicode{x03C3}$
;
$3\unicode{x03C3}$
; $1.\!\!^{\prime\prime}5$
diameter aperture; Saxena et al. Reference Saxena2018, Reference Saxena2019). For the five sources with HAWK-I data, repeating the limit calculations in
$1.\!\!^{\prime\prime}5$
diameter aperture; Saxena et al. Reference Saxena2018, Reference Saxena2019). For the five sources with HAWK-I data, repeating the limit calculations in $1.\!\!^{\prime\prime}5$
diameter apertures (see the notes on individual sources in Appendix 1) so as to better match the analysis for TGSS J1530
$1.\!\!^{\prime\prime}5$
diameter apertures (see the notes on individual sources in Appendix 1) so as to better match the analysis for TGSS J1530 $+$
1049 yielded deeper median
$+$
1049 yielded deeper median $3\unicode{x03C3}$
limits of
$3\unicode{x03C3}$
limits of $K_\textrm{s} \gtrsim 23.8$
mag and
$K_\textrm{s} \gtrsim 23.8$
mag and $S_{2.2\,\unicode{x03BC}\rm{m}} \lesssim 1.1$ $\unicode{x03BC}$
Jy. Henceforth, however, we will use the more conservative limits from the 2
$\unicode{x03BC}$
Jy. Henceforth, however, we will use the more conservative limits from the 2 $^{\prime\prime}$
diameter apertures.
$^{\prime\prime}$
diameter apertures.
Only recently has an obscured, radio-loud AGN been detected at $z \gt 6$
: COS-87259 with
$z \gt 6$
: COS-87259 with $z=6.85$
, previously discussed in Section 1. This source has
$z=6.85$
, previously discussed in Section 1. This source has $S_{2.2\,\unicode{x03BC}\rm{m}} = 0.67 \pm 0.09$ $\unicode{x03BC}$
Jy (
$\unicode{x03BC}$
Jy ( $K_\textrm{s} = 24.33 \pm 0.15$
mag;
$K_\textrm{s} = 24.33 \pm 0.15$
mag; $1.\!\!^{\prime\prime}2$
diameter aperture; Endsley et al. Reference Endsley2022), that is, too faint to have been detected in our deepest HAWK-I observations. It was found as part of the Cosmic Evolution Survey (COSMOS; Scoville et al. Reference Scoville2007), which has unparalleled multi-wavelength data, albeit over 2 deg
$1.\!\!^{\prime\prime}2$
diameter aperture; Endsley et al. Reference Endsley2022), that is, too faint to have been detected in our deepest HAWK-I observations. It was found as part of the Cosmic Evolution Survey (COSMOS; Scoville et al. Reference Scoville2007), which has unparalleled multi-wavelength data, albeit over 2 deg $^{2}$
only. Assuming that the rest-frame ultraviolet and optical emission is dominated by star formation, the faint 2.2-
$^{2}$
only. Assuming that the rest-frame ultraviolet and optical emission is dominated by star formation, the faint 2.2- $\unicode{x03BC}$
m flux density is consistent with a massive galaxy with stellar mass
$\unicode{x03BC}$
m flux density is consistent with a massive galaxy with stellar mass $M_\textrm{*} = (1.7 \pm 0.7) \times 10^{11}\,{\rm M}_\odot$
(Endsley et al. Reference Endsley2023b, although those authors explain that the mass could lie anywhere between
$M_\textrm{*} = (1.7 \pm 0.7) \times 10^{11}\,{\rm M}_\odot$
(Endsley et al. Reference Endsley2023b, although those authors explain that the mass could lie anywhere between $10^{10}$
–
$10^{10}$
– $10^{11}\,\textit{M}_\odot$
depending on the star formation history). The host galaxy has a very high obscured AGN infrared luminosity,
$10^{11}\,\textit{M}_\odot$
depending on the star formation history). The host galaxy has a very high obscured AGN infrared luminosity, $L_\textrm{IR} = (2.5 \pm 0.2) \times 10^{13}\,{\rm L}_\odot$
, which is not evident in the rest-frame ultraviolet/optical (Endsley et al. Reference Endsley2023b). Its stellar mass and AGN luminosity are similar to powerful radio galaxies at
$L_\textrm{IR} = (2.5 \pm 0.2) \times 10^{13}\,{\rm L}_\odot$
, which is not evident in the rest-frame ultraviolet/optical (Endsley et al. Reference Endsley2023b). Its stellar mass and AGN luminosity are similar to powerful radio galaxies at $2 \lt z \lt 5$
(e.g. Seymour et al. Reference Seymour2007; Drouart et al. Reference Drouart2016). While COS-87259 has a faint 144-MHz flux density (
$2 \lt z \lt 5$
(e.g. Seymour et al. Reference Seymour2007; Drouart et al. Reference Drouart2016). While COS-87259 has a faint 144-MHz flux density ( $S_{144\,\textrm{MHz}} = 475 \pm 180$ $\unicode{x03BC}$
Jy; Endsley et al. Reference Endsley2022) and is therefore much less luminous in the radio than the powerful radio galaxies referenced above, it nonetheless demonstrates the existence of detectable radio emission from an obscured AGN within the EoR. Potentially, some of the prime targets from the B22 sample are the radio-luminous analogues of COS-87259, but spectroscopic redshift determinations are needed.
$\unicode{x03BC}$
Jy; Endsley et al. Reference Endsley2022) and is therefore much less luminous in the radio than the powerful radio galaxies referenced above, it nonetheless demonstrates the existence of detectable radio emission from an obscured AGN within the EoR. Potentially, some of the prime targets from the B22 sample are the radio-luminous analogues of COS-87259, but spectroscopic redshift determinations are needed.
To obtain further evidence that our six deep non-detections are strong UHzRG candidates, in Fig. 3 we have used pégase to model 2.2- $\unicode{x03BC}$
m flux density as a function of redshift for several galaxy templates (elliptical and starburst) with different stellar masses. We followed a similar method as that described in both Drouart et al. (Reference Drouart2021) and Seymour et al. (Reference Seymour2022), but assumed that the galaxies formed no earlier than
$\unicode{x03BC}$
m flux density as a function of redshift for several galaxy templates (elliptical and starburst) with different stellar masses. We followed a similar method as that described in both Drouart et al. (Reference Drouart2021) and Seymour et al. (Reference Seymour2022), but assumed that the galaxies formed no earlier than $z=16$
when the Universe was
$z=16$
when the Universe was $\sim250\,$
Myr old. The elliptical template was assumed to be old (0.5 Gyr: the oldest it could be at
$\sim250\,$
Myr old. The elliptical template was assumed to be old (0.5 Gyr: the oldest it could be at $z\sim 7$
given our formation redshift and therefore the tracks terminate at
$z\sim 7$
given our formation redshift and therefore the tracks terminate at $z=7.1$
), whereas the starburst template was assumed to be young (0.03 Gyr: chosen to match the youngest galaxies seen at
$z=7.1$
), whereas the starburst template was assumed to be young (0.03 Gyr: chosen to match the youngest galaxies seen at $7\lt z\lt 8$
; Endsley et al. Reference Endsley2023a). We have overlaid the positions of the nine HzRGs with
$7\lt z\lt 8$
; Endsley et al. Reference Endsley2023a). We have overlaid the positions of the nine HzRGs with $4\lt z\lt 5$
included in Fig. 1, as well as TN J0924
$4\lt z\lt 5$
included in Fig. 1, as well as TN J0924 $-$
2201, GLEAM J0856
$-$
2201, GLEAM J0856 $+$
0223, TGSS J1530
$+$
0223, TGSS J1530 $+$
1049, and COS-87259. In addition, we show the median
$+$
1049, and COS-87259. In addition, we show the median $3\unicode{x03C3}$
limit of our deep non-detections. Several conclusions can be drawn from Fig. 3 and are as follows.
$3\unicode{x03C3}$
limit of our deep non-detections. Several conclusions can be drawn from Fig. 3 and are as follows.
-
1. If the host galaxies of our
$K_\textrm{s} \gtrsim 23.5$
mag radio sources are massive like other known powerful HzRGs at
$2\lt z\lt 5$
(
$M_\textrm{*} \gtrsim 10^{11}$
M
$_\odot$
; e.g. Rocca-Volmerange et al. Reference Rocca-Volmerange, Le Borgne, De Breuck, Fioc and Moy2004; Seymour et al. Reference Seymour2007; De Breuck et al. Reference De Breuck2010; Saxena et al. Reference Saxena2019), then they must lie at ultra-high redshift,
$z\gtrsim 5.4$
, to be so faint. -
2. For a lower stellar mass,
$M_\textrm{*} \sim 10^{10.5}$
M
$_\odot$
, the elliptical and starburst model tracks indicate that
$z\gtrsim 4.2$
(elliptical) or
$z\gtrsim 4.9$
(starburst) for
$K_\textrm{s} \gtrsim 23.5$
mag. -
3. A corollary of the two preceding conclusions is that for
$M_\textrm{*} \gtrsim 10^{10.5}$
M
$_\odot$
and
$K_\textrm{s} \gtrsim 23.5$
mag,
$z \gtrsim 4.2$
. -
4. Another possibility is that our deep non-detections are perhaps indicative of a class of powerful radio-loud AGN in undermassive (
$M_\textrm{*} \lesssim 10^{10}\,{\rm M}_\odot$
) host galaxies. Although not visible in the region of parameter space shown in Fig. 3,
$z\gtrsim 2.4$
(elliptical) or
$z\gtrsim 2.5$
(starburst) for
$M_\textrm{*} \sim 10^{10}$
M
$_\odot$
and
$K_\textrm{s} \gtrsim 23.5$
mag. However, given the findings from previous studies of powerful HzRGs, undermassive host galaxies would be unexpected, at least at
$z \lt 5$
. Furthermore, radio-loud AGN in dwarf galaxies (
$M_\textrm{*} \lesssim 10^{9.5}\,\textit{M}_\odot$
) are at least a few orders of magnitude less radio luminous (e.g. Mezcua, Suh, & Civano Reference Mezcua, Suh and Civano2019; Davis et al. Reference Davis2022). On the other hand, at
$z\gt 4$
, there is emerging evidence from the James Webb Space Telescope (JWST; Gardner et al. Reference Gardner2006, Reference Gardner2023) of a population of AGN not detected in the radio with BH to stellar mass ratios up to several dex larger than is what usually observed (e.g. Furtak et al. Reference Furtak2023, Reference Furtak2024; Goulding et al. Reference Goulding2023; Pacucci et al. Reference Pacucci, Nguyen, Carniani, Maiolino and Fan2023; Kokorev et al. Reference Kokorev2023; Maiolino et al. Reference Maiolino2024). Assuming a fiducial value of
$M_\textrm{BH}$
$\gtrsim 10^9$
M
$_\odot$
for a powerful radio galaxy (e.g. Nesvadba et al. Reference Nesvadba2011; Drouart et al. Reference Drouart2014; also see Willott et al. Reference Willott, Rawlings, Blundell and Lacy1999; Kauffmann et al. Reference Kauffmann, Heckman and Best2008; Martnez-Sansigre & Rawlings Reference Martnez-Sansigre and Rawlings2011), then, in the case of an undermassive host galaxy scenario, our targets might have BH to stellar mass ratios exceeding the local relation (e.g. Reines & Volonteri Reference Reines and Volonteri2015) and potentially approaching the sources analysed in the above JWST studies. -
5. COS-87259 lies below both of the
$10^{11}$
M
$_\odot$
tracks and the
$10^{10.5}$
M
$_\odot$
starburst track; its estimated stellar mass from broadband SED fitting is in the range
$M_\textrm{*} \sim$
$10^{10}$
–
$10^{11}$
M
$_\odot$
(assuming no AGN contribution to the ultraviolet/optical flux density; Endsley et al. Reference Endsley2023b). This large range is due to the uncertainty in the star formation history of this source, which demonstrates how uncertain stellar mass estimates can be even with extensive and accurate photometry. It is worth noting that from its BH mass estimate (
$M_\textrm{BH} \gtrsim 1.5 \times 10^9$
M
$_\odot$
), COS-87259 is likely to have a relatively low stellar mass compared to local galaxies; see the discussion in Section 4 of Endsley et al. (Reference Endsley2023b). -
6. A suggested stellar mass of
$M_\textrm{*} \lt 10^{10.5}$
M
$_\odot$
(starburst) or
$M_\textrm{*} \lt 10^{11}$
M
$_\odot$
(elliptical) for TGSS J1530
$+$
1049 is also broadly consistent with the modelling carried out by Saxena et al. (Reference Saxena2019), who determined that
$M_\textrm{*} \lt 10^{10.5}$
M
$_\odot$
. TN J0924
$-$
2201 is best described by an elliptical template with
$M_\textrm{*} \sim 10^{11}$
M
$_\odot$
or a starburst with
$M_\textrm{*} \sim 10^{10.5}\,\textrm{M}_\odot$
; from multi-wavelength SED fitting, Seymour et al. (Reference Seymour2007) determined the maximum stellar mass of this source to be
$M_\textrm{*} = 10^{11.1}$
M
$_\odot$
. Lastly, GLEAM J0856
$+$
0223 is potentially at least slightly more massive than TN J0924
$-$
2201 (also see discussion in Drouart et al. Reference Drouart2020). -
7. Though with some scatter, the inclusion of the
$4 \lt z \lt 5$
HzRGs in Fig. 3 demonstrates an increase in 2.2-
$\unicode{x03BC}$
m flux density with decreasing redshift, as expected from the K–z relation, albeit with an upper envelope described by a
$\sim10^{11.5}\,\textrm{M}_\odot$
stellar mass compared to
$\sim10^{12}\,\textrm{M}_\odot$
at lower redshift (e.g. Rocca-Volmerange et al. Reference Rocca-Volmerange, Le Borgne, De Breuck, Fioc and Moy2004). All but one of these HzRGs have 2.2-
$\unicode{x03BC}$
m flux densities at least a factor of two above the median
$3\unicode{x03C3}$
limit for our deep non-detections.


4.3 Alternative scenarios for the UHzRG candidates
What is the nature of the $K_\textrm{s} \gtrsim 23.5$
sources from B22 should they not be at
$K_\textrm{s} \gtrsim 23.5$
sources from B22 should they not be at $z \gtrsim 4$
–5? With an undermassive host galaxy scenario unprecedented at
$z \gtrsim 4$
–5? With an undermassive host galaxy scenario unprecedented at $z\lt 4$
given the powerful radio emission, these sources could instead be massive galaxies with heavy dust obscuration. As discussed in B22, none of our UHzRG candidates have detections in the mid-infrared Widefield Infrared Survey Explorer (WISE; Wright et al. Reference Wright2010) AllWISE data release (Cutri et al. Reference Cutri2014). Additionally, no detections were found in the deeper unWISE (Schlafly, Meisner, & Green Reference Schlafly, Meisner and Green2019) data release. However, unWISE is much shallower than our HAWK-I data; the 50% completeness limits for the 3.37-
$z\lt 4$
given the powerful radio emission, these sources could instead be massive galaxies with heavy dust obscuration. As discussed in B22, none of our UHzRG candidates have detections in the mid-infrared Widefield Infrared Survey Explorer (WISE; Wright et al. Reference Wright2010) AllWISE data release (Cutri et al. Reference Cutri2014). Additionally, no detections were found in the deeper unWISE (Schlafly, Meisner, & Green Reference Schlafly, Meisner and Green2019) data release. However, unWISE is much shallower than our HAWK-I data; the 50% completeness limits for the 3.37- $\unicode{x03BC}$
m (W1) and 4.62-
$\unicode{x03BC}$
m (W1) and 4.62- $\unicode{x03BC}$
m (W2) bands are
$\unicode{x03BC}$
m (W2) bands are $W1 = 20.72$
mag/
$W1 = 20.72$
mag/ $S_{3.37\,\unicode{x03BC}\rm{m}} = 18.71$ $\unicode{x03BC}$
Jy and
$\unicode{x03BC}$
Jy and $W2 = 19.97$
mag/
$W2 = 19.97$
mag/ $S_{4.62\,\unicode{x03BC}\rm{m}} = 37.33$ $\unicode{x03BC}$
Jy, respectively (Schlafly et al. Reference Schlafly, Meisner and Green2019). JWST is opening up a new window on the study of dusty starburst galaxies at (ultra-)high redshift (e.g. Zavala et al. Reference Zavala2023; Barrufet et al. Reference Barrufet2023), suggesting that we would potentially need much deeper mid-infrared data to detect our targets. Moreover, COS-87259 has 3.6- and 4.5-
$\unicode{x03BC}$
Jy, respectively (Schlafly et al. Reference Schlafly, Meisner and Green2019). JWST is opening up a new window on the study of dusty starburst galaxies at (ultra-)high redshift (e.g. Zavala et al. Reference Zavala2023; Barrufet et al. Reference Barrufet2023), suggesting that we would potentially need much deeper mid-infrared data to detect our targets. Moreover, COS-87259 has 3.6- and 4.5- $\unicode{x03BC}$
m flux densities of
$\unicode{x03BC}$
m flux densities of $2.75 \pm 0.10$
and
$2.75 \pm 0.10$
and $2.77 \pm 0.12$ $\unicode{x03BC}$
Jy, respectively (Endsley et al. Reference Endsley2022).
$\unicode{x03BC}$
Jy, respectively (Endsley et al. Reference Endsley2022).
Additionally, in B22, we investigated if all of the sources in the sample had been identified as pulsars in the literature, but none were. For the non-detections in the $K_\textrm{s} \gtrsim 23.5$
mag subset, a pulsar origin seems unlikely given that all of these sources are at least slightly extended in the radio (Table 2 in B22). None of the sources show evidence for variability at radio frequencies either. Furthermore, none of the sources are detected in the optical in the third data release of the SkyMapper Southern Sky Survey (SMSS; Onken et al. Reference Onken2019),Footnote
i
nor in the 18th data release of the Sloan Digital Sky Survey SDSS; Almeida et al. Reference Almeida2023) for the equatorial targets. While our sources do not have X-ray data, the lack of radio variability, optical non-detections, and, additionally, the relatively steep spectral indices at GHz frequencies (B22 cf. e.g. Fender Reference Fender2001 and Trushkin, Bursov, & Nizhelskij Reference Trushkin, Bursov and Nizhelskij2003) do not paint a compelling picture that we are seeing persistent radio emission from Galactic X-ray binaries (e.g. see the radio–optical parameter space presented in Stewart et al. Reference Stewart, Muñoz-Darias, Fender and Pietka2018).
$K_\textrm{s} \gtrsim 23.5$
mag subset, a pulsar origin seems unlikely given that all of these sources are at least slightly extended in the radio (Table 2 in B22). None of the sources show evidence for variability at radio frequencies either. Furthermore, none of the sources are detected in the optical in the third data release of the SkyMapper Southern Sky Survey (SMSS; Onken et al. Reference Onken2019),Footnote
i
nor in the 18th data release of the Sloan Digital Sky Survey SDSS; Almeida et al. Reference Almeida2023) for the equatorial targets. While our sources do not have X-ray data, the lack of radio variability, optical non-detections, and, additionally, the relatively steep spectral indices at GHz frequencies (B22 cf. e.g. Fender Reference Fender2001 and Trushkin, Bursov, & Nizhelskij Reference Trushkin, Bursov and Nizhelskij2003) do not paint a compelling picture that we are seeing persistent radio emission from Galactic X-ray binaries (e.g. see the radio–optical parameter space presented in Stewart et al. Reference Stewart, Muñoz-Darias, Fender and Pietka2018).
Lastly, our non-detections could be radio sources with one-sided lobes, that is, more extreme versions of J0007 $-$
3040 and J0034
$-$
3040 and J0034 $-$
3112 (as well as J2330
$-$
3112 (as well as J2330 $-$
3237) in Fig. A1. Therefore, the host galaxies may be located elsewhere in the HAWK-I images. For these sources, there is no evidence in RACS-mid of a second candidate lobe. While we cannot fully rule out that at least some of the
$-$
3237) in Fig. A1. Therefore, the host galaxies may be located elsewhere in the HAWK-I images. For these sources, there is no evidence in RACS-mid of a second candidate lobe. While we cannot fully rule out that at least some of the $K_\textrm{s} \gtrsim 23.5$
mag sources have one-sided radio morphologies, the number density of K-band sources is
$K_\textrm{s} \gtrsim 23.5$
mag sources have one-sided radio morphologies, the number density of K-band sources is $\sim$
70 arcmin
$\sim$
70 arcmin $^{-2}$
for
$^{-2}$
for $23 \lt K \lt 24$
(Fontana et al. Reference Fontana2014). Therefore, the probability of a host galaxy candidate within this magnitude range being within 2
$23 \lt K \lt 24$
(Fontana et al. Reference Fontana2014). Therefore, the probability of a host galaxy candidate within this magnitude range being within 2 $^{\prime\prime}$
of the radio centroid by chance is about 20%, that is, for
$^{\prime\prime}$
of the radio centroid by chance is about 20%, that is, for $\sim$
1 of our 6 UHzRG candidates with non-detections. The corresponding values for a 5
$\sim$
1 of our 6 UHzRG candidates with non-detections. The corresponding values for a 5 $^{\prime\prime}$
search radius are 80% and
$^{\prime\prime}$
search radius are 80% and $\sim$
5 sources. Therefore, we can see that this quickly becomes a challenging exercise to identify the true host galaxy for increasingly large, one-sided radio sources. Very long baseline interferometry (VLBI) would allow a better assessment of whether the radio emission from the UHzRG candidates is lobe-like, possibly with backflow towards a host galaxy candidate, or whether the emission is resolved into multiple lobes and also potentially a core, which would strengthen the argument for a compact radio source with an undetected host galaxy in
$\sim$
5 sources. Therefore, we can see that this quickly becomes a challenging exercise to identify the true host galaxy for increasingly large, one-sided radio sources. Very long baseline interferometry (VLBI) would allow a better assessment of whether the radio emission from the UHzRG candidates is lobe-like, possibly with backflow towards a host galaxy candidate, or whether the emission is resolved into multiple lobes and also potentially a core, which would strengthen the argument for a compact radio source with an undetected host galaxy in $K_\textrm{s}$
-band. Such observations are underway and will be presented in a future study.
$K_\textrm{s}$
-band. Such observations are underway and will be presented in a future study.
The above analysis of chance radio–near-infrared matches is also relevant for the host galaxy identifications presented in Section 3, although the offset from the radio centroid is typically much smaller (median 0 $.^{\!{\prime\prime}}$
5; Table 1). We would therefore expect at most one source of the 27 with
$.^{\!{\prime\prime}}$
5; Table 1). We would therefore expect at most one source of the 27 with $K_\textrm{s}$
-band counterparts in Table 1 to be a chance radio–near-infrared match.
$K_\textrm{s}$
-band counterparts in Table 1 to be a chance radio–near-infrared match.
4.4 Comparison to IFRSs
Our UHzRG candidates, and indeed the majority of the other sources from the B22 sample studied in this paper, have properties consistent with the class of infrared-faint radio sources (IFRSs; e.g Norris et al. Reference Norris2006, Reference Norris2011; Middelberg et al. Reference Middelberg2008, Reference Middelberg2011; Garn & Alexander Reference Garn and Alexander2008; Zinn, Middelberg, & Ibar Reference Zinn, Middelberg and Ibar2011; Collier et al. Reference Collier2014; Maini et al. Reference Maini2016). IFRSs have typically been characterised on the basis of their 1.4-GHz radio to 3.6- $\unicode{x03BC}$
m mid-infrared flux density ratios; Zinn et al. (Reference Zinn, Middelberg and Ibar2011) proposed standard IFRS selection criteria of (i)
$\unicode{x03BC}$
m mid-infrared flux density ratios; Zinn et al. (Reference Zinn, Middelberg and Ibar2011) proposed standard IFRS selection criteria of (i) $S_{1.4\,\rm{GHz}} / S_{3.6\,\unicode{x03BC}\rm{m}} \gt 500$
and (ii)
$S_{1.4\,\rm{GHz}} / S_{3.6\,\unicode{x03BC}\rm{m}} \gt 500$
and (ii) $S_{3.6\,\unicode{x03BC}\rm{m}} \lt 30$ $\unicode{x03BC}$
Jy. For the 40 sources from the B22 sample plotted in Fig. 1, the 1.4-GHz flux densities from the National Radio Astronomy Observatory (NRAO) VLA Sky Survey (NVSS; Condon et al. Reference Condon1998) span the range
$\unicode{x03BC}$
Jy. For the 40 sources from the B22 sample plotted in Fig. 1, the 1.4-GHz flux densities from the National Radio Astronomy Observatory (NRAO) VLA Sky Survey (NVSS; Condon et al. Reference Condon1998) span the range $\lt $
1.6–98.9 mJy, with a median of 18.7 mJy (Table 2 in B22). Even after factoring in a k-correction between 2.2 and 3.6
$\lt $
1.6–98.9 mJy, with a median of 18.7 mJy (Table 2 in B22). Even after factoring in a k-correction between 2.2 and 3.6 $\unicode{x03BC}$
m, which will depend on the SED, we would expect the majority of our sources to (comfortably) meet the Zinn et al. (Reference Zinn, Middelberg and Ibar2011) selection criteria. Indeed, this is suggested in Fig. 1, albeit with plotted flux density ratios based on the radio value at 150 MHz (
$\unicode{x03BC}$
m, which will depend on the SED, we would expect the majority of our sources to (comfortably) meet the Zinn et al. (Reference Zinn, Middelberg and Ibar2011) selection criteria. Indeed, this is suggested in Fig. 1, albeit with plotted flux density ratios based on the radio value at 150 MHz ( $S_{150\,\rm{MHz}} / S_{1.4\,\rm{GHz}} \sim 10$
for a radio spectral index
$S_{150\,\rm{MHz}} / S_{1.4\,\rm{GHz}} \sim 10$
for a radio spectral index $\alpha = -1$
; flux density
$\alpha = -1$
; flux density $S_{\nu} \propto \nu^{\alpha}$
).
$S_{\nu} \propto \nu^{\alpha}$
).
As mentioned above in Section 4.3, none of our $K_\textrm{s} \gtrsim 23.5$
mag UHzRG candidates were detected in AllWISE or unWISE. However, despite the difference in sensitivity between unWISE and our HAWK-I data, seven sources (with
$K_\textrm{s} \gtrsim 23.5$
mag UHzRG candidates were detected in AllWISE or unWISE. However, despite the difference in sensitivity between unWISE and our HAWK-I data, seven sources (with $S_{2.2\,\unicode{x03BC}\rm{m}} = 2.54$
–
$S_{2.2\,\unicode{x03BC}\rm{m}} = 2.54$
– $8.02$ $\unicode{x03BC}$
Jy in 2
$\unicode{x03BC}$
Jy in 2 $^{\prime\prime}$
diameter apertures) from the B22 sample plotted in Fig. 1 have unWISE detections. In Table 2, we present the unWISE and NVSS flux densities for these sources, along with the values of
$^{\prime\prime}$
diameter apertures) from the B22 sample plotted in Fig. 1 have unWISE detections. In Table 2, we present the unWISE and NVSS flux densities for these sources, along with the values of $S_{1.4\,\rm{GHz}} / S_{3.37\,\unicode{x03BC}\rm{m}}$
. All seven sources meet the Zinn et al. (Reference Zinn, Middelberg and Ibar2011) IFRS selection criteria, albeit considering a slightly different mid-infrared observing wavelength. An additional handful of sources from the B22 sample may also have unWISE counterparts (e.g. J1335
$S_{1.4\,\rm{GHz}} / S_{3.37\,\unicode{x03BC}\rm{m}}$
. All seven sources meet the Zinn et al. (Reference Zinn, Middelberg and Ibar2011) IFRS selection criteria, albeit considering a slightly different mid-infrared observing wavelength. An additional handful of sources from the B22 sample may also have unWISE counterparts (e.g. J1335 $+$
0112 and J2219
$+$
0112 and J2219 $-$
3312, which were discussed in Section 5.5 in B22 as having potential AllWISE detections), but it was not clear whether these detections are affected by confusion from nearby sources visible at 2.2
$-$
3312, which were discussed in Section 5.5 in B22 as having potential AllWISE detections), but it was not clear whether these detections are affected by confusion from nearby sources visible at 2.2 $\unicode{x03BC}$
m in the higher-resolution HAWK-I images. A detailed analysis was beyond the scope of this paper.
$\unicode{x03BC}$
m in the higher-resolution HAWK-I images. A detailed analysis was beyond the scope of this paper.
Sources in the B22 sample with unWISE detections. For each unWISE detection, we also report the 1.4 GHz flux density from NVSS and the flux density ratio $S_{1.4\,\rm{GHz}} / S_{3.37\,\unicode{x03BC}\rm{m}}$
.
$S_{1.4\,\rm{GHz}} / S_{3.37\,\unicode{x03BC}\rm{m}}$
.
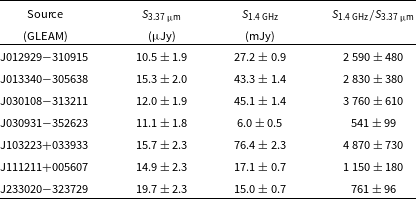
Norris et al. (Reference Norris2011) considered the scenarios listed in Section 4.3, as well as others, to explain the nature of IFRSs. They concluded that most IFRSs are likely either radio-loud AGN at $z \gtrsim 3$
or radio-loud AGN at
$z \gtrsim 3$
or radio-loud AGN at $1 \lt z \lt 3$
that are significantly obscured by dust. Subsequent studies have found that many IFRSs are at high redshift, up to
$1 \lt z \lt 3$
that are significantly obscured by dust. Subsequent studies have found that many IFRSs are at high redshift, up to $z=4.39$
(e.g. Collier et al. Reference Collier2014; Herzog et al. 2014; Singh et al. Reference Singh2017; Orenstein, Collier, & Norris Reference Orenstein, Collier and Norris2019). This bodes well for the B22 sample.
$z=4.39$
(e.g. Collier et al. Reference Collier2014; Herzog et al. 2014; Singh et al. Reference Singh2017; Orenstein, Collier, & Norris Reference Orenstein, Collier and Norris2019). This bodes well for the B22 sample.
4.5 The role of wide and deep near-infrared surveys in the study of UHzRGs
From the above discussion of Fig. 1, it is clear that the six sources from the B22 sample with the faintest $K_\textrm{s}$
-band magnitudes are the most promising UHzRG candidates and could potentially fall within the EoR. However, obtaining deep
$K_\textrm{s}$
-band magnitudes are the most promising UHzRG candidates and could potentially fall within the EoR. However, obtaining deep $K_\textrm{s}$
-band imaging is expensive in terms of telescope time, especially as these rare bright radio sources are well-spaced across the sky and therefore require individual observations.
$K_\textrm{s}$
-band imaging is expensive in terms of telescope time, especially as these rare bright radio sources are well-spaced across the sky and therefore require individual observations.
Various ongoing and future near-infrared surveys that are both wide and deep offer excellent prospects for improving the efficiency of UHzRG searches. For example, SHARKS, made use of in this project (B22), will cover 300 deg $^2$
to a median
$^2$
to a median $5\unicode{x03C3}$
limiting magnitude of
$5\unicode{x03C3}$
limiting magnitude of $K_\textrm{s} = 22.7$
mag (2
$K_\textrm{s} = 22.7$
mag (2 $^{\prime\prime}$
diameter aperture;
$^{\prime\prime}$
diameter aperture; $S_{2.2\,\unicode{x03BC}\rm{m}} = 3.0$ $\unicode{x03BC}$
Jy; Dannerbauer et al. Reference Dannerbauer, Carnero, Cross and Gutierrez2022). The
$\unicode{x03BC}$
Jy; Dannerbauer et al. Reference Dannerbauer, Carnero, Cross and Gutierrez2022). The $K_\textrm{s}$
-band magnitudes of TN J0924
$K_\textrm{s}$
-band magnitudes of TN J0924 $-$
2201 and GLEAM J0856
$-$
2201 and GLEAM J0856 $+$
0223 (van Breugel et al. Reference van Breugel1999; Drouart et al. Reference Drouart2020) are at brightness levels approximately corresponding to the
$+$
0223 (van Breugel et al. Reference van Breugel1999; Drouart et al. Reference Drouart2020) are at brightness levels approximately corresponding to the $3\unicode{x03C3}$
SHARKS depth. Referring to Fig. 3, SHARKS may be able to find UHzRGs with
$3\unicode{x03C3}$
SHARKS depth. Referring to Fig. 3, SHARKS may be able to find UHzRGs with $M_\textrm{*} \gtrsim 10^{11}$
M
$M_\textrm{*} \gtrsim 10^{11}$
M $_\odot$
.
$_\odot$
.
The Euclid mission (Racca et al. Reference Racca, MacEwen, Fazio, Lystrup, Batalha, Siegler and Tong2016; Euclid Collaboration et al. 2024) will also significantly advance searches for UHzRGs. The Euclid Wide Survey (EWS; Laureijs et al. Reference Laureijs2011; Euclid Collaboration et al. 2022) will cover approximately 15 000 deg $^2$
in a wide optical band (530–920 nm) and three near-infrared filters (Y-, J-, and H-bands; 0.95–2.0
$^2$
in a wide optical band (530–920 nm) and three near-infrared filters (Y-, J-, and H-bands; 0.95–2.0 $\unicode{x03BC}$
m). The near-infrared point-source depth is expected to be 24.5 mag (
$\unicode{x03BC}$
m). The near-infrared point-source depth is expected to be 24.5 mag ( $5\unicode{x03C3}$
; radius of 50% encircled energy
$5\unicode{x03C3}$
; radius of 50% encircled energy $\lt 0\hbox{$.\!^{\prime\prime}$}4$
), that is, approximately 1.5 mag fainter (at an equivalent detection threshold) than the deepest HAWK-I imaging presented here. Such data will greatly speed up the discovery of UHzRG candidates going forward; as a lower limit, extrapolating from six UHzRG candidates over approximately 1 200 deg
$\lt 0\hbox{$.\!^{\prime\prime}$}4$
), that is, approximately 1.5 mag fainter (at an equivalent detection threshold) than the deepest HAWK-I imaging presented here. Such data will greatly speed up the discovery of UHzRG candidates going forward; as a lower limit, extrapolating from six UHzRG candidates over approximately 1 200 deg $^2$
from our study, we would expect
$^2$
from our study, we would expect $\gtrsim 75$
UHzRG candidates to be found in the EWS. Furthermore, while the Euclid data alone can be used to discover bright regular galaxies at
$\gtrsim 75$
UHzRG candidates to be found in the EWS. Furthermore, while the Euclid data alone can be used to discover bright regular galaxies at $z\gt 6$
–7, having a strong radio detection as well will immediately rule out contamination by very low-mass stars or dwarf star-forming galaxies at
$z\gt 6$
–7, having a strong radio detection as well will immediately rule out contamination by very low-mass stars or dwarf star-forming galaxies at $1\lt z\lt 2$
, which are not known to host powerful AGN. The required radio surveys are extant, with, for example, GLEAM complete and its successor (GLEAM-X; Hurley-Walker et al. Reference Hurley-Walker2022; Ross et al. Reference Ross2024) observed. With Euclid having now launched and beginning to collect science data, further candidate UHzRGs can be identified quickly.
$1\lt z\lt 2$
, which are not known to host powerful AGN. The required radio surveys are extant, with, for example, GLEAM complete and its successor (GLEAM-X; Hurley-Walker et al. Reference Hurley-Walker2022; Ross et al. Reference Ross2024) observed. With Euclid having now launched and beginning to collect science data, further candidate UHzRGs can be identified quickly.
Looking towards the second half of this decade, the Vera C. Rubin Observatory (Ivezić et al. Reference Ivezić2019) will have an exceptionally large FoV (9.6 deg $^{2}$
) and survey approximately 18 000 deg
$^{2}$
) and survey approximately 18 000 deg $^2$
in six optical and near-infrared bands across the wavelength range 320–1050 nm. After a first pass of the survey area, the
$^2$
in six optical and near-infrared bands across the wavelength range 320–1050 nm. After a first pass of the survey area, the $5\unicode{x03C3}$
point-source sensitivity in Y-band will be approximately 23.0 mag (expected median zenith seeing
$5\unicode{x03C3}$
point-source sensitivity in Y-band will be approximately 23.0 mag (expected median zenith seeing $\approx 0\hbox{$.\!^{\prime\prime}$}7$
), with an expected depth of 24.8 mag after 10 yr of operations. Additionally, the Nancy Grace Roman Space Telescope (Spergel et al. Reference Spergel2015; Akeson et al. Reference Akeson2019) will have an unprecedented combination of FoV and sensitivity: the Wide-Field Instrument (WFI) will have a 0.281 deg
$\approx 0\hbox{$.\!^{\prime\prime}$}7$
), with an expected depth of 24.8 mag after 10 yr of operations. Additionally, the Nancy Grace Roman Space Telescope (Spergel et al. Reference Spergel2015; Akeson et al. Reference Akeson2019) will have an unprecedented combination of FoV and sensitivity: the Wide-Field Instrument (WFI) will have a 0.281 deg $^2$
FoV and a limiting
$^2$
FoV and a limiting $5\unicode{x03C3}$
point-source sensitivity in the F213 filter (2.13
$5\unicode{x03C3}$
point-source sensitivity in the F213 filter (2.13 $\unicode{x03BC}$
m) of 25.6 mag (1 h integration; point spread function FWHM
$\unicode{x03BC}$
m) of 25.6 mag (1 h integration; point spread function FWHM $= 0\hbox{$.\!^{\prime\prime}$}169$
). A combination of Roman and the upcoming Square Kilometre Array (SKA; e.g. Dewdney et al. Reference Dewdney, Hall, Schilizzi and Lazio2009; Braun et al. Reference Braun, Bonaldi, Bourke, Keane and Wagg2019) would transform searches for UHzRGs, including those which are much less powerful at radio frequencies than the sources considered in this study.
$= 0\hbox{$.\!^{\prime\prime}$}169$
). A combination of Roman and the upcoming Square Kilometre Array (SKA; e.g. Dewdney et al. Reference Dewdney, Hall, Schilizzi and Lazio2009; Braun et al. Reference Braun, Bonaldi, Bourke, Keane and Wagg2019) would transform searches for UHzRGs, including those which are much less powerful at radio frequencies than the sources considered in this study.
5. Conclusions
In this paper, we presented deep VLT/HAWK-I $K_\textrm{s}$
-band imaging for 35 of the 53 sources from the B22 HzRG candidate sample, bringing the total number of sources from this sample with deep
$K_\textrm{s}$
-band imaging for 35 of the 53 sources from the B22 HzRG candidate sample, bringing the total number of sources from this sample with deep $K_\textrm{s}$
-band imaging to 41. Our conclusions are as follows:
$K_\textrm{s}$
-band imaging to 41. Our conclusions are as follows:
-
1. Host galaxies were detected for 27/35 sources (77%) using photutils. The corresponding
$K_\textrm{s}$
-band magnitudes in 2
$^{\prime\prime}$
diameter circular apertures range from approximately 21.6–23.0 mag. The remaining eight sources were not detected in the HAWK-I images, with deep magnitude lower limits being obtained (median
$3\unicode{x03C3}$
depth
$K_\textrm{s} \approx 23.3$
mag; 2
$^{\prime\prime}$
diameter apertures). -
2. In the
$S_{150\,\rm{MHz}}$
–
$S_{2.2\,\unicode{x03BC}\rm{m}}$
flux density parameter space, the distribution of known powerful radio galaxies across
$3\lt z\lt 6$
is extended to fainter flux densities by the inclusion of the B22 sample. Like these distant radio galaxies from the literature, the B22 sources have large to extreme radio to near-infrared flux density ratios (
$S_{150\,\rm{MHz}} / S_{2.2\,\unicode{x03BC}\rm{m}}$
$\sim$
$7.0 \times 10^3$
–
$3.1 \times 10^5$
). -
3. Five of the eight targets with HAWK-I non-detections, along with J0008
$-$
3007 from B22 that was not detected in SHARKS, are of particular interest given that they are UHzRG candidates. These six sources have a median
$3\unicode{x03C3}$
magnitude limit of
$K_\textrm{s} \gtrsim 23.5$
mag in 2
$^{\prime\prime}$
diameter apertures; moreover, the five HAWK-I non-detections have a median
$3\unicode{x03C3}$
limit of
$K_\textrm{s} \gtrsim 23.8$
mag in
$1.\!\!^{\prime\prime}5$
diameter apertures. All of these UHzRG candidates have extreme radio to near-infrared flux density ratios (
$S_{150\,\rm{MHz}} / S_{2.2\,\unicode{x03BC}\rm{m}} \gt 10^5$
), similar to the three known powerful radio galaxies at
$z\gt 5$
(TN J0924
$-$
2201, GLEAM J0856
$+$
0223, and TGSS J1530
$+$
1049). -
4. If the host galaxies of these
$K_\textrm{s} \gtrsim 23.5$
mag sources have stellar masses
$M_\textrm{*} \gtrsim 10^{10.5}$
M
$_\odot$
, then there is a distinct possibility that at least some of them lie at ultra-high redshift to be so faint, or at least at
$z \gtrsim 4.2$
. They could also perhaps be powerful radio sources at
$z \gtrsim 4$
hosted by undermassive (
$M_\textrm{*} \lesssim 10^{10}$
M
$_\odot$
) galaxies, that is, the radio-loud analogues of the population of AGN with large BH to stellar mass ratios being uncovered with JWST. Other possibilities are lower-redshift sources that are extremely obscured by dust or have one-sided radio emission. -
5. The majority of the 35 sources studied in this paper have radio and near/mid-infrared properties consistent with IFRSs, many of which have been confirmed in the literature to be at high redshift.
-
6. Wide and deep (
$K_\textrm{s} \gtrsim 23$
–24 mag) near-infrared surveys are key to efficiently selecting the most promising UHzRG candidates.


For future work, deeper near-infrared observations are needed to identify the host galaxy for each of our UHzRG candidates. Given the tracks in Fig. 3, as well as the (very) faint near-infrared flux densities being measured with JWST for confirmed or candidate obscured AGN in massive galaxies at ultra-high redshift (e.g. Labbé et al. Reference Labbé2023a,b; Akins et al. Reference Akins2023; Lambrides et al. Reference Lambrides2024; Barro et al. Reference Barro2024), JWST or Hubble Space Telescope (HST; e.g. Bahcall Reference Bahcall1986) observations would be the most efficient way of securing an identification for our targets. Additionally, efforts are underway to obtain spectroscopic redshifts for the B22 sample; these data will be presented in a future paper.
Acknowledgement
We thank the referee for their constructive review, which helped improve the presentation and clarity of this paper. We also acknowledge the Noongar people as the traditional owners and custodians of Whadjuk Boodjar, the land on which the majority of this work was completed.
Based on observations collected at the European Southern Observatory under ESO programme 108.22HY.001. Based on data obtained from the ESO Science Archive Facility with DOI: https://doi.org/10.18727/archive/34. We thank Lowell Tacconi-Garman from the ESO User Support Department for helping us to finalise the observing strategy and for manually processing a number of datasets that could not be automatically reduced by the HAWK-I pipeline. We also thank Helmut Dannerbauer and Aurelio Carnero Rosell from the SHARKS team for providing us with available SHARKS data prior to the submission of the proposal for our HAWK-I observing campaign, allowing us to finalise the target list.
We thank Anshu Gupta, Joe Grundy and Luca Ighina for useful discussions regarding the nature of our UHzRG candidates.
JMA acknowledges financial support from the Science and Technology Foundation (FCT, Portugal) through research grants PTDC/FIS-AST/29245/2017, UIDB/04434/2020 and UIDP/04434/2020. GN acknowledges funding support from the Natural Sciences and Engineering Research Council (NSERC) of Canada through a Discovery Grant and Discovery Accelerator Supplement, and from the Canadian Space Agency through grant 18JWST-GTO1.
This publication makes use of data products from the Two Micron All-Sky Survey, which is a joint project of the University of Massachusetts and the Infrared Processing and Analysis Center/California Institute of Technology, funded by the National Aeronautics and Space Administration and the National Science Foundation. This publication makes use of data products from the Wide-field Infrared Survey Explorer, which is a joint project of the University of California, Los Angeles, and the Jet Propulsion Laboratory/California Institute of Technology, funded by the National Aeronautics and Space Administration.
This scientific work uses data obtained from Inyarrimanha Ilgari Bundara/the Murchison Radio-astronomy Observatory. We acknowledge the Wajarri Yamaji People as the Traditional Owners and native title holders of the Observatory site. CSIRO’s ASKAP radio telescope is part of the Australia Telescope National Facility (https://ror.org/05qajvd42). Operation of ASKAP is funded by the Australian Government with support from the National Collaborative Research Infrastructure Strategy. ASKAP uses the resources of the Pawsey Supercomputing Research Centre. Establishment of ASKAP, Inyarrimanha Ilgari Bundara, the CSIRO Murchison Radio-astronomy Observatory and the Pawsey Supercomputing Research Centre are initiatives of the Australian Government, with support from the Government of Western Australia and the Science and Industry Endowment Fund. This paper includes archived data obtained through the CSIRO ASKAP Science Data Archive, CASDA (http://data.csiro.au).
The Australia Telescope Compact Array is part of the Australia Telescope National Facility (https://ror.org/05qajvd42) which is funded by the Australian Government for operation as a National Facility managed by CSIRO. We acknowledge the Gomeroi people as the Traditional Owners of the Observatory site.
The National Radio Astronomy Observatory is a facility of the National Science Foundation operated under cooperative agreement by Associated Universities, Inc.
The national facility capability for SkyMapper has been funded through ARC LIEF grant LE130100104 from the Australian Research Council, awarded to the University of Sydney, the Australian National University, Swinburne University of Technology, the University of Queensland, the University of Western Australia, the University of Melbourne, Curtin University of Technology, Monash University and the Australian Astronomical Observatory. SkyMapper is owned and operated by The Australian National University’s Research School of Astronomy and Astrophysics. The survey data were processed and provided by the SkyMapper Team at ANU. The SkyMapper node of the All-Sky Virtual Observatory (ASVO) is hosted at the National Computational Infrastructure (NCI). Development and support of the SkyMapper node of the ASVO has been funded in part by Astronomy Australia Limited (AAL) and the Australian Government through the Commonwealth’s Education Investment Fund (EIF) and National Collaborative Research Infrastructure Strategy (NCRIS), particularly the National eResearch Collaboration Tools and Resources (NeCTAR) and the Australian National Data Service Projects (ANDS).
Funding for the Sloan Digital Sky Survey V has been provided by the Alfred P. Sloan Foundation, the Heising-Simons Foundation, the National Science Foundation, and the Participating Institutions. SDSS acknowledges support and resources from the Center for High-Performance Computing at the University of Utah. The SDSS web site is www.sdss.org.
SDSS is managed by the Astrophysical Research Consortium for the Participating Institutions of the SDSS Collaboration, including the Carnegie Institution for Science, Chilean National Time Allocation Committee (CNTAC) ratified researchers, the Gotham Participation Group, Harvard University, Heidelberg University, The Johns Hopkins University, L’Ecole polytechnique fédérale de Lausanne (EPFL), Leibniz-Institut für Astrophysik Potsdam (AIP), Max-Planck-Institut für Astronomie (MPIA Heidelberg), Max-Planck-Institut für Extraterrestrische Physik (MPE), Nanjing University, National Astronomical Observatories of China (NAOC), New Mexico State University, The Ohio State University, Pennsylvania State University, Smithsonian Astrophysical Observatory, Space Telescope Science Institute (STScI), the Stellar Astrophysics Participation Group, Universidad Nacional Autónoma de México, University of Arizona, University of Colorado Boulder, University of Illinois at Urbana-Champaign, University of Toronto, University of Utah, University of Virginia, Yale University, and Yunnan University.
This research has made use of the CIRADA cutout service at URL cutouts.cirada.ca, operated by the Canadian Initiative for Radio Astronomy Data Analysis (CIRADA). CIRADA is funded by a grant from the Canada Foundation for Innovation 2017 Innovation Fund (Project 35999), as well as by the Provinces of Ontario, British Columbia, Alberta, Manitoba and Quebec, in collaboration with the National Research Council of Canada, the US National Radio Astronomy Observatory and Australia’s Commonwealth Scientific and Industrial Research Organisation.
This work made use of Astropy:Footnote j a community-developed core Python package and an ecosystem of tools and resources for astronomy (Astropy Collaboration et al. 2013, 2018, 2022). This research made use of Photutils, an Astropy package for detection and photometry of astronomical sources (Bradley et al. Reference Bradley2021).
This research has made use of the VizieR catalogue access tool, CDS, Strasbourg, France (DOI: 10.26093/cds/vizier). The original description of the VizieR service was published in A&AS 143, 23 (Ochsenbein, Bauer, & Marcout Reference Ochsenbein, Bauer and Marcout2000). This research has made use of the NASA/IPAC Extragalactic Database (NED), which is funded by the National Aeronautics and Space Administration and operated by the California Institute of Technology. This research has made use of NASA’s Astrophysics Data System Bibliographic Services. This project also made use of kvis (Gooch Reference Gooch, Shaw, Payne and Hayes1995), matplotlib (Hunter Reference Hunter2007), numpy (Oliphant Reference Oliphant2006), scipy (Virtanen et al. Reference Virtanen2020), and topcat (Taylor Reference Taylor, Shopbell, Britton and Ebert2005).
Data Availability
The HAWK-I data used in this project that were obtained from standard ESO pipeline processing can be downloaded at https://doi.eso.org/10.18727/archive/34 (ESO programme 108.22HY.001). HAWK-I data that were reduced manually, as well as the various codes used in this study, will be shared on reasonable request to the corresponding author.
Appendix 1. Additional information from the HAWK-I observing campaign
In Fig. A1, we present overlay plots for the 30 sources not included in Fig. 2. For four of the host galaxy detections in Fig. A1, additional greyscale plots without radio contours overlaid can be found in Fig. A2, allowing the reader a clearer view of the $K_\textrm{s}$
-band emission.
$K_\textrm{s}$
-band emission.
Radio contours overlaid on HAWK-I $K_\textrm{s}$
-band images for the 30 sources not shown in Fig. 2, again ordered by right ascension. The panels are formatted in the same way as those in Fig. 2, except that the contours for J0309
$K_\textrm{s}$
-band images for the 30 sources not shown in Fig. 2, again ordered by right ascension. The panels are formatted in the same way as those in Fig. 2, except that the contours for J0309 $-$
3526 start at
$-$
3526 start at $3\unicode{x03C3}$
rather than
$3\unicode{x03C3}$
rather than $5\unicode{x03C3}$
(Table 5 in B22). Additionally, crosshairs mark the position of each host galaxy detection. Further relevant information is as follows. We used the new single-epoch images from VLASS for J1030
$5\unicode{x03C3}$
(Table 5 in B22). Additionally, crosshairs mark the position of each host galaxy detection. Further relevant information is as follows. We used the new single-epoch images from VLASS for J1030 $+$
0135, J1032
$+$
0135, J1032 $+$
0339, and J1037
$+$
0339, and J1037 $-$
0325. For J0007
$-$
0325. For J0007 $-$
3040, J0034
$-$
3040, J0034 $-$
3112, and J1037
$-$
3112, and J1037 $-$
0325, we show 1367.5-MHz contours (in orange) from RACS-mid, while for J2311
$-$
0325, we show 1367.5-MHz contours (in orange) from RACS-mid, while for J2311 $-$
3359 we show 887.5-MHz contours (in turquoise) from the ASKAP study by Gürkan et al. (Reference Gürkan2022). For the single-epoch images from VLASS, the lowest contour levels (
$-$
3359 we show 887.5-MHz contours (in turquoise) from the ASKAP study by Gürkan et al. (Reference Gürkan2022). For the single-epoch images from VLASS, the lowest contour levels ( $5\unicode{x03C3}$
) are 0.75 (J1030
$5\unicode{x03C3}$
) are 0.75 (J1030 $+$
0135), 0.65 (J1032
$+$
0135), 0.65 (J1032 $+$
0339), and 0.80 (J1037
$+$
0339), and 0.80 (J1037 $-$
0325) mJy beam
$-$
0325) mJy beam $^{-1}$
. For the RACS-mid data as well as the ASKAP data from Gürkan et al. (Reference Gürkan2022). the lowest contour levels (
$^{-1}$
. For the RACS-mid data as well as the ASKAP data from Gürkan et al. (Reference Gürkan2022). the lowest contour levels ( $5\unicode{x03C3}$
) are 0.85 (J0007
$5\unicode{x03C3}$
) are 0.85 (J0007 $-$
3040), 0.70 (J0034
$-$
3040), 0.70 (J0034 $-$
3112), 0.95 (J1037
$-$
3112), 0.95 (J1037 $-$
0325), and 0.185 (J2311
$-$
0325), and 0.185 (J2311 $-$
3359) mJy beam
$-$
3359) mJy beam $^{-1}$
. The hatching style for the RACS-mid/ASKAP synthesised beams is horizontal. Note that the host galaxy of J0240
$^{-1}$
. The hatching style for the RACS-mid/ASKAP synthesised beams is horizontal. Note that the host galaxy of J0240 $-$
3206 is only detected above our
$-$
3206 is only detected above our $3\unicode{x03C3}$
threshold in a
$3\unicode{x03C3}$
threshold in a $1.\!\!^{\prime\prime}5$
diameter aperture.
$1.\!\!^{\prime\prime}5$
diameter aperture.

A selection of the HAWK-I images shown in Fig. A1 without radio contours overlaid, so as to allow a clearer view of the host galaxy detections (marked with crosshairs, as in Fig. A1). The contrast levels have been modified as well. See the notes on individual sources in this appendix for further details.

For all 35 targets for which HAWK-I data are presented in this paper, notes on individual sources are as follows.
J0002–3514: The host galaxy, near the radio centroid, was detected by sextractor.
J0006–2946: There is evidence of faint, diffuse $K_\textrm{s}$
-band emission near the radio centroid, almost ring-like in appearance. While this emission is not bright enough to meet our connected pixel S/N criterion for a sextractor detection, measuring the integrated flux density with photutils in a 2
$K_\textrm{s}$
-band emission near the radio centroid, almost ring-like in appearance. While this emission is not bright enough to meet our connected pixel S/N criterion for a sextractor detection, measuring the integrated flux density with photutils in a 2 $^{\prime\prime}$
diameter aperture centred on the ATCA 9-GHz radio centroid yielded S/N
$^{\prime\prime}$
diameter aperture centred on the ATCA 9-GHz radio centroid yielded S/N $= 4.8$
. The HAWK-I image without radio contours overlaid is shown in Fig. A2; the crosshairs mark the position of the ATCA radio centroid.
$= 4.8$
. The HAWK-I image without radio contours overlaid is shown in Fig. A2; the crosshairs mark the position of the ATCA radio centroid.
J0007–3040: This was a target of particular interest in the B22 study given its curved, ultra-steep broadband radio spectrum. The RACS-mid morphology of this source is extended (largest angular size LAS 4 $.\!^{\prime\prime}$
8; deconvolved position angle 36
$.\!^{\prime\prime}$
8; deconvolved position angle 36 $^\circ$
measured north through east; Duchesne et al. Reference Duchesne2023, Reference Duchesne2024) and suggestive of an incipient double (i.e. it would be resolved into two components at higher resolution). Therefore, the high-resolution VLASS and ATCA contours very likely map out the north-eastern lobe only. The revised LAS from RACS-mid is larger than the value reported in B22 given the hitherto undetected extension to the south-west. The north-eastern lobe is extended towards the host galaxy, which was detected by sextractor. A 2
$^\circ$
measured north through east; Duchesne et al. Reference Duchesne2023, Reference Duchesne2024) and suggestive of an incipient double (i.e. it would be resolved into two components at higher resolution). Therefore, the high-resolution VLASS and ATCA contours very likely map out the north-eastern lobe only. The revised LAS from RACS-mid is larger than the value reported in B22 given the hitherto undetected extension to the south-west. The north-eastern lobe is extended towards the host galaxy, which was detected by sextractor. A 2 $^{\prime\prime}$
diameter aperture does not enclose all of the emission and the magnitude is therefore underestimated (in the sense that it is too faint and hence a larger value). The magnitude in a 3
$^{\prime\prime}$
diameter aperture does not enclose all of the emission and the magnitude is therefore underestimated (in the sense that it is too faint and hence a larger value). The magnitude in a 3 $^{\prime\prime}$
diameter aperture, which encloses all of the flux density, is
$^{\prime\prime}$
diameter aperture, which encloses all of the flux density, is $K_\textrm{s} = 22.34 \pm 0.23$
mag.
$K_\textrm{s} = 22.34 \pm 0.23$
mag.
J0034–3112: RACS-mid reveals that this source is an asymmetric double with LAS $ \approx 12\hbox{$.\!^{\prime\prime}$}5$
(Duchesne et al. Reference Duchesne2023, Reference Duchesne2024); the high-resolution VLASS and ATCA contours map out the western lobe only. The eastern lobe is detected at about the 6
$ \approx 12\hbox{$.\!^{\prime\prime}$}5$
(Duchesne et al. Reference Duchesne2023, Reference Duchesne2024); the high-resolution VLASS and ATCA contours map out the western lobe only. The eastern lobe is detected at about the 6 $\unicode{x03C3}$
level. The revised LAS falls well outside of the B22 selection criterion and is sufficiently large such that this source is very unlikely to be a UHzRG. There is evidence of a faint host galaxy identification between the lobes and closer to the brighter western lobe. It is possible that the
$\unicode{x03C3}$
level. The revised LAS falls well outside of the B22 selection criterion and is sufficiently large such that this source is very unlikely to be a UHzRG. There is evidence of a faint host galaxy identification between the lobes and closer to the brighter western lobe. It is possible that the $K_\textrm{s}$
-band morphology is diffuse and with several components, but a deeper image is needed to better characterise this possible extension. While the
$K_\textrm{s}$
-band morphology is diffuse and with several components, but a deeper image is needed to better characterise this possible extension. While the $K_\textrm{s}$
-band emission is not bright enough to meet our connected pixel S/N criterion for a sextractor detection, measuring the integrated flux density with photutils in a 2
$K_\textrm{s}$
-band emission is not bright enough to meet our connected pixel S/N criterion for a sextractor detection, measuring the integrated flux density with photutils in a 2 $^{\prime\prime}$
diameter aperture centred on the brightest component yielded S/N
$^{\prime\prime}$
diameter aperture centred on the brightest component yielded S/N $= 4.6$
. However, a 2
$= 4.6$
. However, a 2 $^{\prime\prime}$
diameter aperture potentially does not enclose all of the emission and the magnitude is therefore possibly significantly underestimated. The magnitude in a 6
$^{\prime\prime}$
diameter aperture potentially does not enclose all of the emission and the magnitude is therefore possibly significantly underestimated. The magnitude in a 6 $^{\prime\prime}$
diameter aperture, which encloses all of the potential flux density from the host galaxy, is
$^{\prime\prime}$
diameter aperture, which encloses all of the potential flux density from the host galaxy, is $K_\textrm{s} = 21.81 \pm 0.42$
mag.
$K_\textrm{s} = 21.81 \pm 0.42$
mag.
J0042–3515: There is evidence of faint, diffuse $K_\textrm{s}$
-band emission near the radio centroid. While this emission is not bright enough to meet our connected pixel S/N criterion for a sextractor detection, measuring the integrated flux density with photutils in a 2
$K_\textrm{s}$
-band emission near the radio centroid. While this emission is not bright enough to meet our connected pixel S/N criterion for a sextractor detection, measuring the integrated flux density with photutils in a 2 $^{\prime\prime}$
diameter aperture centred on the ATCA 5.5-GHz radio centroid (the 9-GHz detection has relatively low S/N; B22) yielded S/N
$^{\prime\prime}$
diameter aperture centred on the ATCA 5.5-GHz radio centroid (the 9-GHz detection has relatively low S/N; B22) yielded S/N $= 5.1$
. The HAWK-I image without radio contours overlaid is shown in Fig. A2; the crosshairs mark the position of the ATCA 5.5-GHz radio centroid. As can be seen in this figure, there is another nearby diffuse source to the south-east (which is not enclosed by the aperture).
$= 5.1$
. The HAWK-I image without radio contours overlaid is shown in Fig. A2; the crosshairs mark the position of the ATCA 5.5-GHz radio centroid. As can be seen in this figure, there is another nearby diffuse source to the south-east (which is not enclosed by the aperture).
J0048–3540: The host galaxy, near the radio centroid, was detected by sextractor. The host is extended with two distinct components. A 2 $^{\prime\prime}$
diameter aperture does not enclose all of the emission and is therefore underestimated. The magnitude in a 3
$^{\prime\prime}$
diameter aperture does not enclose all of the emission and is therefore underestimated. The magnitude in a 3 $^{\prime\prime}$
diameter aperture, which encloses all of the flux density, is
$^{\prime\prime}$
diameter aperture, which encloses all of the flux density, is $K_\textrm{s} = 21.56 \pm 0.14$
mag.
$K_\textrm{s} = 21.56 \pm 0.14$
mag.
J0053–3256: The host galaxy was not detected. While it tentatively appears that there is faint $K_\textrm{s}$
-band emission near the radio centroid, an integrated flux density measurement with photutils in a 2
$K_\textrm{s}$
-band emission near the radio centroid, an integrated flux density measurement with photutils in a 2 $^{\prime\prime}$
diameter aperture centred on the ATCA 5.5-GHz radio centroid (the 9-GHz detection has relatively low S/N; B22) did not meet our detection threshold (S/N
$^{\prime\prime}$
diameter aperture centred on the ATCA 5.5-GHz radio centroid (the 9-GHz detection has relatively low S/N; B22) did not meet our detection threshold (S/N $= 1.5$
). This is a high-priority target with
$= 1.5$
). This is a high-priority target with $K_\textrm{s} \gt 23.2$
(
$K_\textrm{s} \gt 23.2$
( $3\unicode{x03C3}$
); moreover, in a
$3\unicode{x03C3}$
); moreover, in a $1.\!\!^{\prime\prime}5$
diameter aperture,
$1.\!\!^{\prime\prime}5$
diameter aperture, $K_\textrm{s} \gt 23.6$
(
$K_\textrm{s} \gt 23.6$
( $3\unicode{x03C3}$
).
$3\unicode{x03C3}$
).
J0108–3501: The host galaxy, near the radio centroid, was detected by sextractor.
J0129–3109: The host galaxy, near the radio centroid, was detected by sextractor.
J0201–3441: The host galaxy, between the radio lobes, was detected by sextractor.
J0216–3301: While there is a hint of a potential host galaxy identification between the radio lobes of this incipient double source, an integrated flux density measurement with photutils in a 2 $^{\prime\prime}$
diameter aperture centred on this
$^{\prime\prime}$
diameter aperture centred on this $K_\textrm{s}$
-band emission was below our detection threshold (S/N
$K_\textrm{s}$
-band emission was below our detection threshold (S/N $= 2.1$
). This target has
$= 2.1$
). This target has $K_\textrm{s} \gt 22.8$
(
$K_\textrm{s} \gt 22.8$
( $3\unicode{x03C3}$
); moreover, in a
$3\unicode{x03C3}$
); moreover, in a $1.\!\!^{\prime\prime}5$
diameter aperture,
$1.\!\!^{\prime\prime}5$
diameter aperture, $K_\textrm{s} \gt 23.1$
(
$K_\textrm{s} \gt 23.1$
( $3\unicode{x03C3}$
).
$3\unicode{x03C3}$
).
J0239–3043: The host galaxy, very close to the radio centroid, was detected by sextractor.
J0240–3206: While there is a hint of a potential host galaxy identification near the position of the radio centroid, an integrated flux density measurement with photutils in a 2 $^{\prime\prime}$
diameter aperture centred on this
$^{\prime\prime}$
diameter aperture centred on this $K_\textrm{s}$
-band emission was below our detection threshold (S/N
$K_\textrm{s}$
-band emission was below our detection threshold (S/N $= 2.2$
). The host galaxy magnitude limit is
$= 2.2$
). The host galaxy magnitude limit is $K_\textrm{s} \gt 23.3$
(
$K_\textrm{s} \gt 23.3$
( $3\unicode{x03C3}$
). However, the compact nature of this candidate host galaxy, coupled with the excellent seeing (0
$3\unicode{x03C3}$
). However, the compact nature of this candidate host galaxy, coupled with the excellent seeing (0 $.\!^{\prime\prime}$
37), allowed a detection to be made above the
$.\!^{\prime\prime}$
37), allowed a detection to be made above the $3\unicode{x03C3}$
threshold in a
$3\unicode{x03C3}$
threshold in a $1.\!\!^{\prime\prime}5$
diameter aperture. In this case, S/N
$1.\!\!^{\prime\prime}5$
diameter aperture. In this case, S/N $= 3.1$
and
$= 3.1$
and $K_\textrm{s} = 23.65 \pm 0.35$
mag.
$K_\textrm{s} = 23.65 \pm 0.35$
mag.
J0301–3132: There is evidence of faint, diffuse $K_\textrm{s}$
-band emission near the radio centroid. While this emission is not bright enough to meet our connected pixel S/N criterion for a sextractor detection, measuring the integrated flux density with photutils in a 2
$K_\textrm{s}$
-band emission near the radio centroid. While this emission is not bright enough to meet our connected pixel S/N criterion for a sextractor detection, measuring the integrated flux density with photutils in a 2 $^{\prime\prime}$
diameter aperture centred on the ATCA 9-GHz radio centroid yielded S/N
$^{\prime\prime}$
diameter aperture centred on the ATCA 9-GHz radio centroid yielded S/N $= 4.5$
. The HAWK-I image without radio contours overlaid is shown in Fig. A2; the crosshairs mark the position of the ATCA radio centroid. The magnitude from the 2
$= 4.5$
. The HAWK-I image without radio contours overlaid is shown in Fig. A2; the crosshairs mark the position of the ATCA radio centroid. The magnitude from the 2 $^{\prime\prime}$
diameter aperture might be significantly underestimated if the brighter diffuse emission to the north of the radio centroid is also associated with the host galaxy; for example, the magnitude in a 4
$^{\prime\prime}$
diameter aperture might be significantly underestimated if the brighter diffuse emission to the north of the radio centroid is also associated with the host galaxy; for example, the magnitude in a 4 $^{\prime\prime}$
diameter aperture is
$^{\prime\prime}$
diameter aperture is $K_\textrm{s} = 21.95 \pm 0.26$
mag. A deeper
$K_\textrm{s} = 21.95 \pm 0.26$
mag. A deeper $K_\textrm{s}$
-band image is needed to better characterise the diffuse emission near the radio centroid.
$K_\textrm{s}$
-band image is needed to better characterise the diffuse emission near the radio centroid.
J0309–3526: The host galaxy, near the possible core of this multi-component radio source (discussed in Section 5.5 in B22), was detected by sextractor.
J0326–3013: We interpret the $K_\textrm{s}$
-band emission near the radio centroid, detected by sextractor, as a host galaxy that is extended and with two distinct components. A 2
$K_\textrm{s}$
-band emission near the radio centroid, detected by sextractor, as a host galaxy that is extended and with two distinct components. A 2 $^{\prime\prime}$
diameter aperture does not enclose all of the flux density from these components and the magnitude is therefore significantly underestimated. The magnitude in a 5
$^{\prime\prime}$
diameter aperture does not enclose all of the flux density from these components and the magnitude is therefore significantly underestimated. The magnitude in a 5 $^{\prime\prime}$
diameter aperture, enclosing all of the emission, is
$^{\prime\prime}$
diameter aperture, enclosing all of the emission, is $K_\textrm{s} = 21.23 \pm 0.20$
mag; this value is approximately 0.8 mag brighter than the point-source
$K_\textrm{s} = 21.23 \pm 0.20$
mag; this value is approximately 0.8 mag brighter than the point-source $5\unicode{x03C3}$
limit from VIKING estimated in B22 (i.e. which did not take into account extended emission). Given the offset between the radio and
$5\unicode{x03C3}$
limit from VIKING estimated in B22 (i.e. which did not take into account extended emission). Given the offset between the radio and $K_\textrm{s}$
-band emission (1
$K_\textrm{s}$
-band emission (1 $.\!^{\prime\prime}$
9; Table 1), the former may not be as compact as calculated in B22. VLBI would be useful to determine the underlying radio morphology. Another possibility is that there are two galaxies close in projection, with the fainter emission to the north-east and closer to the radio centroid being the host galaxy. The HAWK-I image without radio contours overlaid is shown in Fig. A2.
$.\!^{\prime\prime}$
9; Table 1), the former may not be as compact as calculated in B22. VLBI would be useful to determine the underlying radio morphology. Another possibility is that there are two galaxies close in projection, with the fainter emission to the north-east and closer to the radio centroid being the host galaxy. The HAWK-I image without radio contours overlaid is shown in Fig. A2.
J0909–0154: The host galaxy, near the radio centroid, was detected by sextractor. A 2 $^{\prime\prime}$
diameter aperture does not enclose all of the extended emission and the magnitude is therefore underestimated. The magnitude in a 3
$^{\prime\prime}$
diameter aperture does not enclose all of the extended emission and the magnitude is therefore underestimated. The magnitude in a 3 $^{\prime\prime}$
diameter aperture, which encloses all of the emission, is
$^{\prime\prime}$
diameter aperture, which encloses all of the emission, is $K_\textrm{s} = 21.48 \pm 0.11$
mag; this value is brighter by approximately 0.2 mag than the VIKING
$K_\textrm{s} = 21.48 \pm 0.11$
mag; this value is brighter by approximately 0.2 mag than the VIKING $5\unicode{x03C3}$
point-source limit estimated in B22 (i.e. which did not take into account extended emission).
$5\unicode{x03C3}$
point-source limit estimated in B22 (i.e. which did not take into account extended emission).
J1030+0135: There is evidence of faint, diffuse $K_\textrm{s}$
-band emission near the radio centroid. While this emission is not bright enough to meet our connected pixel S/N criterion for a sextractor detection, measuring the integrated flux density with photutils in a 2
$K_\textrm{s}$
-band emission near the radio centroid. While this emission is not bright enough to meet our connected pixel S/N criterion for a sextractor detection, measuring the integrated flux density with photutils in a 2 $^{\prime\prime}$
diameter aperture centred on this emission yielded S/N
$^{\prime\prime}$
diameter aperture centred on this emission yielded S/N $= 5.5$
.
$= 5.5$
.
J1032+0339: The host galaxy, near the radio centroid of this incipient double, was detected by sextractor. A 2 $^{\prime\prime}$
diameter aperture does not enclose all of the extended emission and the magnitude is therefore underestimated. The magnitude in a 3
$^{\prime\prime}$
diameter aperture does not enclose all of the extended emission and the magnitude is therefore underestimated. The magnitude in a 3 $^{\prime\prime}$
diameter aperture, which encloses all of the emission, is
$^{\prime\prime}$
diameter aperture, which encloses all of the emission, is $K_\textrm{s} = 21.82 \pm 0.15$
mag.
$K_\textrm{s} = 21.82 \pm 0.15$
mag.
J1033+0107: While there is a hint of a potential host galaxy identification near the position of the radio centroid, an integrated flux density measurement with photutils in a 2 $^{\prime\prime}$
diameter aperture centred on the VLASS radio centroid was below our detection threshold (S/N
$^{\prime\prime}$
diameter aperture centred on the VLASS radio centroid was below our detection threshold (S/N $= 1.7$
). This is a high-priority target with
$= 1.7$
). This is a high-priority target with $K_\textrm{s} \gt 23.5$
(
$K_\textrm{s} \gt 23.5$
( $3\unicode{x03C3}$
); moreover, in a
$3\unicode{x03C3}$
); moreover, in a $1.\!\!^{\prime\prime}5$
diameter aperture,
$1.\!\!^{\prime\prime}5$
diameter aperture, $K_\textrm{s} \gt 23.9$
(
$K_\textrm{s} \gt 23.9$
( $3\unicode{x03C3}$
).
$3\unicode{x03C3}$
).
J1037–0325: The host galaxy was not detected, but the RACS-mid data suggest an extended radio source with LAS $= 6\hbox{$.\!^{\prime\prime}$}6$
(Duchesne et al. Reference Duchesne2023, Reference Duchesne2024) and thus significantly larger than the value reported in B22 (indeed beyond the LAS selection criterion used in that study). These data confirm a discussion in Section 5.2.1 in B22 about the potential extension of this source in the radio that is not apparent in the high-resolution VLASS contours. While the revised LAS suggests that this source is unlikely to be a UHzRG, it is still of interest that the host galaxy was not detected. We determined that
$= 6\hbox{$.\!^{\prime\prime}$}6$
(Duchesne et al. Reference Duchesne2023, Reference Duchesne2024) and thus significantly larger than the value reported in B22 (indeed beyond the LAS selection criterion used in that study). These data confirm a discussion in Section 5.2.1 in B22 about the potential extension of this source in the radio that is not apparent in the high-resolution VLASS contours. While the revised LAS suggests that this source is unlikely to be a UHzRG, it is still of interest that the host galaxy was not detected. We determined that $K_\textrm{s} \gt 23.3$
(
$K_\textrm{s} \gt 23.3$
( $3\unicode{x03C3}$
; 2
$3\unicode{x03C3}$
; 2 $^{\prime\prime}$
diameter aperture). We also investigated whether this source could be one of the lobes of a giant radio galaxy, but we could not find evidence of another candidate lobe in RACS-mid.
$^{\prime\prime}$
diameter aperture). We also investigated whether this source could be one of the lobes of a giant radio galaxy, but we could not find evidence of another candidate lobe in RACS-mid.
J1040+0150: There is evidence of faint, diffuse $K_\textrm{s}$
-band emission near the radio centroid. While this emission is not bright enough to meet our connected pixel S/N criterion for a sextractor detection, measuring the integrated flux density with photutils in a 2
$K_\textrm{s}$
-band emission near the radio centroid. While this emission is not bright enough to meet our connected pixel S/N criterion for a sextractor detection, measuring the integrated flux density with photutils in a 2 $^{\prime\prime}$
diameter aperture centred on this emission yielded S/N
$^{\prime\prime}$
diameter aperture centred on this emission yielded S/N $= 5.5$
. The magnitude from the 2
$= 5.5$
. The magnitude from the 2 $^{\prime\prime}$
diameter aperture might be underestimated depending on the amount of diffuse emission that is associated with the host galaxy; for example, the magnitude in a 4
$^{\prime\prime}$
diameter aperture might be underestimated depending on the amount of diffuse emission that is associated with the host galaxy; for example, the magnitude in a 4 $^{\prime\prime}$
diameter aperture is
$^{\prime\prime}$
diameter aperture is $K_\textrm{s} = 22.06 \pm 0.30$
mag. A deeper
$K_\textrm{s} = 22.06 \pm 0.30$
mag. A deeper $K_\textrm{s}$
-band image is needed to better characterise the diffuse emission near the radio centroid.
$K_\textrm{s}$
-band image is needed to better characterise the diffuse emission near the radio centroid.
J1052–0318: The host galaxy, near the radio centroid, was detected by sextractor. The host is extended with possible multiple components. A 2 $^{\prime\prime}$
diameter aperture does not enclose all of the extended emission and the magnitude is therefore underestimated. The magnitude in a 3
$^{\prime\prime}$
diameter aperture does not enclose all of the extended emission and the magnitude is therefore underestimated. The magnitude in a 3 $^{\prime\prime}$
diameter aperture, which encloses all of the emission, is
$^{\prime\prime}$
diameter aperture, which encloses all of the emission, is $K_\textrm{s} = 21.80 \pm 0.15$
mag.
$K_\textrm{s} = 21.80 \pm 0.15$
mag.
J1112+0056: The host galaxy, near the radio centroid, was detected by sextractor.
J1125–0342: The host galaxy, near the radio centroid, was detected by sextractor.
J1127–0332: The host galaxy was not detected; this is a high-priority target with $K_\textrm{s} \gt 23.2$
(
$K_\textrm{s} \gt 23.2$
( $3\unicode{x03C3}$
; 2
$3\unicode{x03C3}$
; 2 $^{\prime\prime}$
diameter aperture); moreover, in a
$^{\prime\prime}$
diameter aperture); moreover, in a $1.\!\!^{\prime\prime}5$
diameter aperture,
$1.\!\!^{\prime\prime}5$
diameter aperture, $K_\textrm{s} \gt 23.6$
(
$K_\textrm{s} \gt 23.6$
( $3\unicode{x03C3}$
).
$3\unicode{x03C3}$
).
J1136–0351: The host galaxy, near the radio centroid, was detected by sextractor.
J1141–0158: The host galaxy, near the radio centroid, was detected by sextractor.
J1335+0112: The host galaxy, very close to the radio centroid, was detected by sextractor.
J1443+0229: The host galaxy was not detected; this is a high-priority target with $K_\textrm{s} \gt 23.5$
(
$K_\textrm{s} \gt 23.5$
( $3\unicode{x03C3}$
; 2
$3\unicode{x03C3}$
; 2 $^{\prime\prime}$
diameter aperture); moreover, in a
$^{\prime\prime}$
diameter aperture); moreover, in a $1.\!\!^{\prime\prime}5$
diameter aperture,
$1.\!\!^{\prime\prime}5$
diameter aperture, $K_\textrm{s} \gt 23.9$
(
$K_\textrm{s} \gt 23.9$
( $3\unicode{x03C3}$
).
$3\unicode{x03C3}$
).
J2219–3312: The host galaxy, near the radio centroid, was detected by sextractor. Note that a 2 $^{\prime\prime}$
diameter aperture only encloses the source that we have identified as the host.
$^{\prime\prime}$
diameter aperture only encloses the source that we have identified as the host.
J2311–3359: The host galaxy, near the radio centroid, was detected by sextractor. Moreover, Gürkan et al. (Reference Gürkan2022) reported a radio LAS $=5\hbox{$.\!^{\prime\prime}$}2$
, confirming that this source does not meet the B22 LAS selection criterion (see Sections 2.3 and 5.5 in B22).
$=5\hbox{$.\!^{\prime\prime}$}2$
, confirming that this source does not meet the B22 LAS selection criterion (see Sections 2.3 and 5.5 in B22).
J2314–3517: The host galaxy, near the radio centroid, was detected by sextractor.
J2326–3028: The host galaxy was not detected; this is a high-priority target with $K_\textrm{s} \gt 23.4$
(
$K_\textrm{s} \gt 23.4$
( $3\unicode{x03C3}$
; 2
$3\unicode{x03C3}$
; 2 $^{\prime\prime}$
diameter aperture); moreover, in a
$^{\prime\prime}$
diameter aperture); moreover, in a $1.\!\!^{\prime\prime}5$
diameter aperture,
$1.\!\!^{\prime\prime}5$
diameter aperture, $K_\textrm{s} \gt 23.8$
(
$K_\textrm{s} \gt 23.8$
( $3\unicode{x03C3}$
).
$3\unicode{x03C3}$
).
J2330–3237: The host galaxy, located between the two lobes (as indicated by the blue 5.5-GHz contours in Fig. A1) of this asymmetric radio source, was detected by sextractor. The host is closer to the brighter lobe to the east. The HAWK-I detection confirms the suggestion in B22 of a hint of a $K_\textrm{s}$
-band detection of the host, at the same position, in VIKING.
$K_\textrm{s}$
-band detection of the host, at the same position, in VIKING.


 Open access