


1. Introduction
Active galactic nuclei (AGN) are believed to influence the way in which their host galaxies evolve, through thermal feedback (e.g. Croton et al. Reference Croton2006) connected with the accretion process, and kinetic feedback (e.g. Gaibler et al. Reference Gaibler, Khochfar, Krause and Silk2012) associated with powerful, relativistic radio jets. However, the overall impact of the latter is debated. In some cases, radio jets may suppress star formation by expelling gas from the system (e.g. Morganti et al. Reference Morganti, Fogasy, Paragi, Oosterloo and Orienti2013), whilst in others they appear to promote star formation by triggering the collapse of a molecular cloud (e.g. Croft et al. Reference Croft2006). In order to appreciate which scenario is more significant, a large sample of ‘jetted’ AGN is required in order to determine robust statistics on their properties and to account for factors such as the size of the molecular gas reservoir (Emonts et al. Reference Emonts2011), the jet power (Mukherjee et al. Reference Mukherjee, Bicknell, Sutherland and Wagner2016), and the inclination of the jet with respect to the galaxy plane (García-Burillo et al. Reference García-Burillo2014).
In addition, a large sample is needed for disentangling the effects of jet power, age, and environmental density on the radio luminosity, and exploring these properties as a function of redshift (Wang & Kaiser Reference Wang and Kaiser2008; Hardcastle Reference Hardcastle2018). Furthermore, we are yet to understand the actual mechanism by which material, accreting onto the central supermassive black hole, is launched as collimated jets. It is thought that magnetic fields play a crucial role in this process (Blandford & Znajek Reference Blandford and Znajek1977; Blandford & Payne Reference Blandford and Payne1982; Tchekhovskoy, Narayan, & McKinney Reference Tchekhovskoy, Narayan and McKinney2011), and so polarimetric observations offer an excellent opportunity for further investigation (e.g. Hovatta et al. Reference Hovatta, O’Sullivan, Martí-Vidal, Savolainen and Tchekhovskoy2019). For this and high-resolution follow-up using very long baseline interferometry, it is necessary to use a sample of bright radio sources detected at a high signal-to-noise ratio.
We have defined such a sample using observations from the Murchison Widefield Array (MWA; Tingay et al. Reference Tingay2013) over the entire southern sky (Declination,  $\delta< 30^{\circ}$
). This is the GaLactic and Extragalactic All-sky MWA (GLEAM; Wayth et al. Reference Wayth2015) Survey, and we use the extragalactic catalogue (EGC) (Galactic latitude,
$\delta< 30^{\circ}$
). This is the GaLactic and Extragalactic All-sky MWA (GLEAM; Wayth et al. Reference Wayth2015) Survey, and we use the extragalactic catalogue (EGC) (Galactic latitude,  $|b| >10^{\circ}$
; Hurley-Walker et al. Reference Hurley-Walker2017) to identify 1 863 sources with an integrated flux density greater than 4 Jy at 151 MHz. These we collectively refer to as the GLEAM 4-Jy (G4Jy) Sample (Jackson et al. Reference Jackson2015; White et al. Reference White2018), for which full sample details are described in the accompanying definition paper (White et al. 2020a; hereafter ‘Paper I’). This sample is over 10 times larger than that of the revised Third Cambridge Catalogue of Radio Sources (3CRR; Laing, Riley, & Longair Reference Laing, Riley and Longair1983), which is also selected at low frequencies (
$|b| >10^{\circ}$
; Hurley-Walker et al. Reference Hurley-Walker2017) to identify 1 863 sources with an integrated flux density greater than 4 Jy at 151 MHz. These we collectively refer to as the GLEAM 4-Jy (G4Jy) Sample (Jackson et al. Reference Jackson2015; White et al. Reference White2018), for which full sample details are described in the accompanying definition paper (White et al. 2020a; hereafter ‘Paper I’). This sample is over 10 times larger than that of the revised Third Cambridge Catalogue of Radio Sources (3CRR; Laing, Riley, & Longair Reference Laing, Riley and Longair1983), which is also selected at low frequencies ( $S_{\mathrm{178\,MHz}}>10.9$
Jy). As a result, both samples avoid the orientation bias that is inherent in higher-frequency radio surveys, where Doppler boosting (Rees Reference Rees1966; Blandford & Königl Reference Blandford and Königl1979) leads to a greater-than-expected fraction of radio AGN with their jet axis close to the line of sight.
$S_{\mathrm{178\,MHz}}>10.9$
Jy). As a result, both samples avoid the orientation bias that is inherent in higher-frequency radio surveys, where Doppler boosting (Rees Reference Rees1966; Blandford & Königl Reference Blandford and Königl1979) leads to a greater-than-expected fraction of radio AGN with their jet axis close to the line of sight.
Having constructed a sample of bright, extragalactic radio sources, based on new ‘blind’ survey data, the next important step is to determine the host galaxy of the radio emission for each source. This is necessary if the low-frequency radio information is to be combined with other datasets, allowing us to build a comprehensive, multi-wavelength view of the different processes taking place within these objects. However, cross-identification is notoriously difficult for extended radio sources and those with complex morphology, as demonstrated by the Radio Galaxy Zoo project (Banfield et al. Reference Banfield2015).Footnote a It is also further complicated by: (i) the resolution of the radio images (McAlpine et al. Reference McAlpine, Smith, Jarvis, Bonfield and Fleuren2012; Tang, Scaife, & Leahy Reference Tang, Scaife and Leahy2019), (ii) projection effects (Reynolds Reference Reynolds1980), (iii) the depth of the radio data (Smolčić et al. Reference Smolčić2017), (iv) the depth of optical/infrared data used for the identification (McAlpine et al. Reference McAlpine, Smith, Jarvis, Bonfield and Fleuren2012), and (v) there being different mechanisms that can produce the same radio morphology (e.g. Jones & McAdam Reference Jones and McAdam1992). Whilst effort is being invested in developing machine learning algorithms for morphology classification (e.g. Aniyan & Thorat Reference Aniyan and Thorat2017; Wu et al. Reference Wu2019) and likelihood ratio methods for cross-identification (e.g. Weston et al. Reference Weston, Seymour, Gulyaev, Norris, Banfield, Vaccari, Hopkins and Franzen2018; Williams et al. Reference Williams2019), visual inspection still remains the most reliable method. Indeed, this is the method used by Williams et al. (Reference Williams2019) for classifying and identifying the subset of their sources that are large, bright, and otherwise complex in morphology. Hence, visual inspection is the approach that we use for cross-identifying the G4Jy Sample, with 1 863 being a feasible number of sources to consider.
1.1. Paper outline
The previous G4Jy paper, Paper I, explains how the G4Jy Sample is constructed and presents the value-added catalogue for these bright radio sources. In this paper, Paper II, we provide an outline of the multi-wavelength data used for defining and inspecting the sample (Section 2), as well as a guide to the labels/flags recorded in the catalogue that are most relevant for host galaxy identification (Section 3). Further details can be found in Paper I, and we emphasise that all overlays/images for the full sample are available online.Footnote bSection 4 shows the wide variety of radio sources in the sample (not all of which are AGN), and additional literature checks are documented in Section 5. A summary of the findings presented in this paper is in Section 6.
Unless otherwise specified, we use integrated flux densities (as opposed to peak surface brightnesses). In addition, we use a  $\Lambda$
CDM cosmology, with
$\Lambda$
CDM cosmology, with  $H_{0} = 70$
km s–1 Mpc–1,
$H_{0} = 70$
km s–1 Mpc–1,  $\Omega_{m}=0.3$
,
$\Omega_{m}=0.3$
,  $\Omega_{\Lambda}=0.7$
. Source names that are based on B1950 coordinates are indicated via the prefix ‘B’, whilst all other position-derived names refer to J2000 coordinates. The sign convention that we use for a spectral index,
$\Omega_{\Lambda}=0.7$
. Source names that are based on B1950 coordinates are indicated via the prefix ‘B’, whilst all other position-derived names refer to J2000 coordinates. The sign convention that we use for a spectral index,  $\alpha$
, is as defined by
$\alpha$
, is as defined by  $S_{\nu} \propto \nu^{\alpha}$
.
$S_{\nu} \propto \nu^{\alpha}$
.
2. An overview of the data
Identifying the host galaxy of a radio source goes hand in hand with understanding its radio morphology. Although the GLEAM Survey (Dec.  $<30^{\circ}$
) provides excellent spectral coverage and sensitivity to diffuse emission at low frequencies, it has poor spatial resolution (
$<30^{\circ}$
) provides excellent spectral coverage and sensitivity to diffuse emission at low frequencies, it has poor spatial resolution ( $\sim$
2 arcmin). Therefore, we need to consider information from other radio surveys (with better spatial resolution) in order to pinpoint where the radio emission originates. In many cases, the positional distribution of candidate host galaxies, with respect to the radio emission, is also informative. For assessing these candidates, optical images have historically been used (e.g. Jones & McAdam Reference Jones and McAdam1992), but these introduce a bias against galaxies that are dust-obscured. Therefore, we choose to identify host galaxies in the mid-infrared instead, since warm dust (heated by either star formation or an AGN) radiates at these wavelengths.
$\sim$
2 arcmin). Therefore, we need to consider information from other radio surveys (with better spatial resolution) in order to pinpoint where the radio emission originates. In many cases, the positional distribution of candidate host galaxies, with respect to the radio emission, is also informative. For assessing these candidates, optical images have historically been used (e.g. Jones & McAdam Reference Jones and McAdam1992), but these introduce a bias against galaxies that are dust-obscured. Therefore, we choose to identify host galaxies in the mid-infrared instead, since warm dust (heated by either star formation or an AGN) radiates at these wavelengths.
For our visual inspection of the brightest radio sources in GLEAM, we overlay multiple sets of radio contours onto mid-infrared images. We create one set of overlays that are 1° across, for considering large scale, extended radio emission, and another set of overlays that are 10 arcmin across, for identifying the host galaxy in the mid-infrared. For both sets, we use each of the following datasets:
• The EGC of the GLEAM Survey (Hurley-Walker et al. Reference Hurley-Walker2017), which includes measurements over 72–231 MHz. For visual inspection, we use the wide band (170–231 MHz) images, which have a spatial resolution of $\sim$
2 arcmin.
$\sim$
2 arcmin.• The TIFR GMRT Sky Survey (TGSS) first alternative data release (ADR1) catalogue and images (Intema et al. Reference Intema, Jagannathan, Mooley and Frail2017), at 150 MHz. This survey provides 25 arcsec resolution for sources at Dec.
$>-53^{\circ}$
.• The Sydney University Molonglo Sky Survey (SUMSS) catalogue and images (Mauch et al. Reference Mauch, Murphy, Buttery, Curran, Hunstead, Piestrzynski, Robertson and Sadler2003; Murphy et al. Reference Murphy, Mauch, Green, Hunstead, Piestrzynska, Kels and Sztajer2007), at 843 MHz. These radio images have a spatial resolution of 45 arcsec
$\times$
45 arcsec
$\mathrm{cosec} |\delta|$
, at position angle = 0.• The NRAO (National Radio Astronomy Observatory) Very Large Array (VLA) Sky Survey (NVSS; Condon et al. Reference Condon, Cotton, Greisen, Yin, Perley, Taylor and Broderick1998) catalogue and images, at 1.4 GHz. The resolution of these images is 45 arcsec.
• Positions from the Australia Telescope 20-GHz (AT20G) catalogue (Murphy et al. Reference Murphy2010).
• The All-sky Wide-field Infrared Survey Explorer (AllWISE) catalogue (Cutri et al. Reference Cutri2013), with mid-infrared data at 3.4, 4.6, 12, and 22
$\mu$
m. We use the 3.4-
$\mu$
m (‘W1’ band) images for visual inspection, which have a resolution of 6.1 arcsec.• Positions from the 6-degree Field Galaxy Survey (6dFGS) optical catalogue (Jones et al. Reference Jones2004).


Note that NVSS is used for sources at Dec.  $\geq-39.5^{\circ}$
, whilst SUMSS is used for sources below this declination. For further details regarding each of the above surveys and how we use them, see Sections 2, 4, and 5 of Paper I.
$\geq-39.5^{\circ}$
, whilst SUMSS is used for sources below this declination. For further details regarding each of the above surveys and how we use them, see Sections 2, 4, and 5 of Paper I.
3. Morphology labels and flags related to visual inspection
Full details regarding our visual inspection are presented in Section 5 of Paper I, so here (for quick reference) we provide a reminder of labels and flags that we assign to the G4Jy sources during this process. Specifically, those concerning radio morphology, potential source confusion, and the host galaxy itself, as these are the most pertinent for host galaxy identification.
3.1. Morphology classification
When inspecting each GLEAM component considered for the G4Jy Sample, we use the radio contours in TGSS and/or NVSS/SUMSS for classifying the morphology. The four categories that we use are
• ‘single’—the source has a simple (typically compact) morphology in TGSS and NVSS/SUMSS;
• ‘double’—the source has two lobes evident in TGSS or NVSS/SUMSS, but there is no distinct detection of a core; or it has an elongated structure that is suggestive of lobes, but is accompanied by a single, catalogued detection;
• ‘triple’—the source has two lobes evident in TGSS or NVSS/SUMSS, and there is a distinct detection of a core in the same survey;
• ‘complex’—the source has a complicated morphology that does not clearly belong to any of the above categories.
We find that the G4Jy Sample contains 1 245 ‘single’ sources, 479 ‘doubles’, 77 ‘triples’, and 62 sources with ‘complex’ morphology.
3.2. Flag to indicate source confusion
The low-frequency flux densities for a G4Jy source will be overestimates if there are other, unrelated sources that are blended together by the MWA beam. This becomes apparent if we find that multiple NVSS/SUMSS sources coincide with the G4Jy source being inspected. We note such cases by updating a ‘confusion flag’ to ‘1’ (from a default value of ‘0’) if the following criteria are satisfied:
1. An unrelated source is detected above 6
$\sigma$
in NVSS/ SUMSS.2. The position of the peak NVSS/SUMSS emission for the unrelated source is within the 3-
$\sigma$
GLEAM contour for the G4Jy source.


One reason we do not also consider TGSS for this is that we wish the confusion flag to be consistent (i.e. based upon the same spatial resolution) across the full sample, whereas TGSS is only available above Dec.  $=-53^{\circ}$
. Furthermore, we have noticed artefacts in TGSS images surrounding bright sources (Section 5.2.1 of Paper I) and wish to avoid these being interpreted as real emission. Doing so would lead to the G4Jy source being incorrectly labelled as ‘confused’.
$=-53^{\circ}$
. Furthermore, we have noticed artefacts in TGSS images surrounding bright sources (Section 5.2.1 of Paper I) and wish to avoid these being interpreted as real emission. Doing so would lead to the G4Jy source being incorrectly labelled as ‘confused’.
Of the 1 863 sources in the sample, 383 (21%) have their confusion flag set to ‘1’.
3.3. Host galaxy identification flags
Assessing the radio morphology (Section 3.1) in conjunction with the distribution of mid-infrared (AllWISE) sources allows us to consider which galaxy is most likely hosting the radio emission. For each G4Jy source, we then assign one of the following four characters as the ‘host flag’:
• ‘i’—a host galaxy has been identified in the AllWISE catalogue, with the position and mid-infrared magnitudes (W1, W2, W3, and W4) recorded as part of the G4Jy catalogue (Paper I),
• ‘u’—it is unclear which AllWISE source is the most likely host galaxy, due to the complexity of the radio morphology and/or the spatial distribution of mid-infrared sources (leading to ambiguity),
• ‘m’—identification of the host galaxy is limited by the mid-infrared data, with the relevant source either being too faint to be detected in AllWISE, or affected by bright mid-infrared emission nearby,
• ‘n’—no AllWISE source should be specified, given the type of radio emission involved.
The above assessment is done alongside consultation of the literature, with our considerations summarised in Section 5.5.1 of Paper I. In the next two sections (Sections 4 and 5), we present our findings for individual sources, having performed these further checks. Considering the full sample, 1,606 sources have host flag ‘i’, 129 sources are labelled ‘u’, 126 are labelled ‘m’, and the remaining two sources are labelled ‘n’.
An overlay (1º across) for G4Jy 571, the Flame Nebula, centred on the component GLEAM J054141–015331 (Section 4.1). Radio contours from TGSS (150 MHz; yellow), GLEAM (170–231 MHz; red), and NVSS (1.4 GHz; blue), are overlaid on a mid-infrared image from WISE (3.4  $\mu$
m; inverted greyscale). For each set of contours, the lowest contour is at the 3
$\mu$
m; inverted greyscale). For each set of contours, the lowest contour is at the 3  $\sigma$
level (where
$\sigma$
level (where  $\sigma$
is the local rms), with the number of
$\sigma$
is the local rms), with the number of  $\sigma$
doubling with each subsequent contour (i.e. 3, 6, 12
$\sigma$
doubling with each subsequent contour (i.e. 3, 6, 12  $\sigma$
). Also plotted, in the bottom left-hand corner, are ellipses to indicate the beam sizes for TGSS (yellow with ‘+’ hatching), GLEAM (red with ‘/’ hatching), and NVSS (blue with ‘\’ hatching). The centroid position is indicated by a purple hexagon, and also plotted are catalogue positions from TGSS (yellow diamonds), GLEAM (red squares), NVSS (blue crosses), AT20G (cyan squares), and 6dFGS (magenta diamonds).
$\sigma$
). Also plotted, in the bottom left-hand corner, are ellipses to indicate the beam sizes for TGSS (yellow with ‘+’ hatching), GLEAM (red with ‘/’ hatching), and NVSS (blue with ‘\’ hatching). The centroid position is indicated by a purple hexagon, and also plotted are catalogue positions from TGSS (yellow diamonds), GLEAM (red squares), NVSS (blue crosses), AT20G (cyan squares), and 6dFGS (magenta diamonds).

4. A variety of radio sources
A consequence of the high flux density threshold that used to define the G4Jy Sample is that the sample is dominated by powerful radio galaxies. These come in a variety of shapes and sizes, as we will show in this section. However, the sample also contains sources where the bright radio emission is the result of star formation or merging halos, which we also highlight below.
4.1. The Flame Nebula, a H ii region
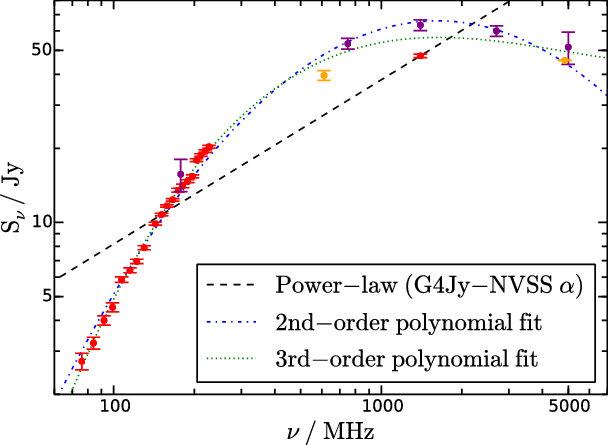
One of the few non-AGN sources in the G4Jy Sample is the Flame Nebula (G4Jy 571; GLEAM J054141–015331; Figure 1). This is a H ii region found in the constellation of Orion and is also referred to as Orion B, NGC 2024, PKS B0539–019, and 3C 147.1. It is at a distance of  $363\,\pm\,75$
pc (Bik et al. Reference Bik, Lenorzer, Kaper, Comerón, Waters, de Koter and Hanson2003), and we present the radio spectrum for this star-forming region in Figure 2. Below
$363\,\pm\,75$
pc (Bik et al. Reference Bik, Lenorzer, Kaper, Comerón, Waters, de Koter and Hanson2003), and we present the radio spectrum for this star-forming region in Figure 2. Below  $\sim$
1 GHz, the thermal emission for this source becomes optically thick, hence the turnover in the spectrum. [The reason we still plot a power-law function is to demonstrate that spectral indices associated with such descriptions (Section 6.6 of Paper I) need to be used with due consideration of spectral curvature.] Since the associated mid-infrared emission is nearby and extended, we do not specify an AllWISE position for this source.
$\sim$
1 GHz, the thermal emission for this source becomes optically thick, hence the turnover in the spectrum. [The reason we still plot a power-law function is to demonstrate that spectral indices associated with such descriptions (Section 6.6 of Paper I) need to be used with due consideration of spectral curvature.] Since the associated mid-infrared emission is nearby and extended, we do not specify an AllWISE position for this source.
The radio spectrum, from 72 to 5 000 MHz, for G4Jy 571 (the Flame Nebula; Section 4.1). Red data points represent measurements in the G4Jy catalogue, from GLEAM and NVSS (over 72–231 MHz and at 1 400 MHz, respectively). Purple data points represent measurements from Kellermann, Pauliny-Toth, & Williams (Reference Kellermann, Pauliny-Toth and Williams1969), at 178, 750, 1 400, 2 695, and 5 000 MHz. Orange data points represent measurements by Durdin et al. (Reference Durdin, Pleticha, Condon, Yerbury, Jauncey and Hazard2000) at 611 MHz, and Griffith et al. (Reference Griffith, Wright, Burke and Ekers1995) at 4850 MHz. We also plot a power law (black, dashed line) that uses the spectral index calculated between 151 and 1 400 MHz (G4Jy_NVSS_alpha in the G4Jy catalogue), in addition to second-order (blue, dash-dotted line) and third-order (green, dotted line) polynomial fits to the data in log–log space.
4.2. Star-forming galaxies
G4Jy 86 (GLEAM J004733–251710) is NGC 253, also known as the Sculptor Galaxy [Figure 3(a)]. This is an intermediate spiral galaxy, whose proximity has enabled numerous detailed studies of its intense star formation (e.g. Rieke et al. Reference Rieke, Lebofsky, Thompson, Low and Tokunaga1980; Ulvestad & Antonucci Reference Ulvestad and Antonucci1997; Lenc & Tingay Reference Lenc and Tingay2006). Recently, Kapińska et al. (Reference Kapińska2017) studied the broadband radio spectrum for this source (from 76 MHz to 11 GHz), where the emission is described as a central starburst region in combination with an extended radio halo. TGSS misses some of the total flux density for nearby sources, but thanks to the tight constraints provided by GLEAM measurements, Kapińska et al. (Reference Kapińska2017) find that the central component is best-modelled as synchrotron plasma that exhibits free–free absorption at frequencies below  $\sim$
230 MHz.
$\sim$
230 MHz.
Another star-forming spiral galaxy in the G4Jy Sample is G4Jy 1081 (GLEAM J133659–295147). This is more commonly known as M83 (NGC 5236) and is nicknamed the Southern Pinwheel Galaxy [Figure 3(b)]. Like G4Jy 86, this nearby starburst is well studied at multiple wavelengths. For example, sub-arcsecond resolution images in the near-infrared (Gallais et al. Reference Gallais, Rouan, Lacombe, Tiphene and Vauglin1991) revealed that the double nucleus at the centre of the galaxy consists of an arc of star clusters offset from the old stellar nucleus. At radio wavelengths, Heald et al. (Reference Heald2016) present the extent of neutral hydrogen surrounding the galaxy, as well as its large-scale magnetic field.
4.3. Radio emission near Minkowski’s object
‘Minkowski’s object’, originally identified by Minkowski (Reference Minkowski1958), is a well-known starburst whose star formation appears to have been triggered by a radio jet emanating from NGC 541 (van Breugel et al. Reference van Breugel, Filippenko, Heckman and Miley1985; Croft et al. Reference Croft2006). NGC 541 is listed in the G4Jy Sample as G4Jy 150 (GLEAM J012548–012157), and along with the dumb-bell galaxy NGC 545/NGC 547, resides in cluster Abell 194. NGC 547 is the host of G4Jy 151 (GLEAM J012603–012356 and GLEAM J012604–011802), as confirmed by archival VLA data at 1.5 GHz (Jetha, Hardcastle, & Sakelliou Reference Jetha, Hardcastle and Sakelliou2006; Sakelliou, Hardcastle, & Jetha Reference Sakelliou, Hardcastle and Jetha2008). Together, G4Jy 150 and G4Jy 151 make up the (confused) radio source known as 3C 40 [Figure 3(c)]. Being at  $z=0.018$
, the 26 arcmin angular extent of G4Jy 151 corresponds to a projected, linear size of 540 kpc. Interestingly, the GLEAM contours (for GLEAM J012627–012017) suggest the presence of an ‘extra’ lobe in the system, towards the east and possibly associated with NGC 541 or NGC 545. We note that this feature has been observed previously by Sakelliou et al. (Reference Sakelliou, Hardcastle and Jetha2008) and Govoni et al. (Reference Govoni2017), but no conclusive interpretation has been made.
$z=0.018$
, the 26 arcmin angular extent of G4Jy 151 corresponds to a projected, linear size of 540 kpc. Interestingly, the GLEAM contours (for GLEAM J012627–012017) suggest the presence of an ‘extra’ lobe in the system, towards the east and possibly associated with NGC 541 or NGC 545. We note that this feature has been observed previously by Sakelliou et al. (Reference Sakelliou, Hardcastle and Jetha2008) and Govoni et al. (Reference Govoni2017), but no conclusive interpretation has been made.
4.4. ‘X-’ and ‘S-’/‘Z-shaped’ sources
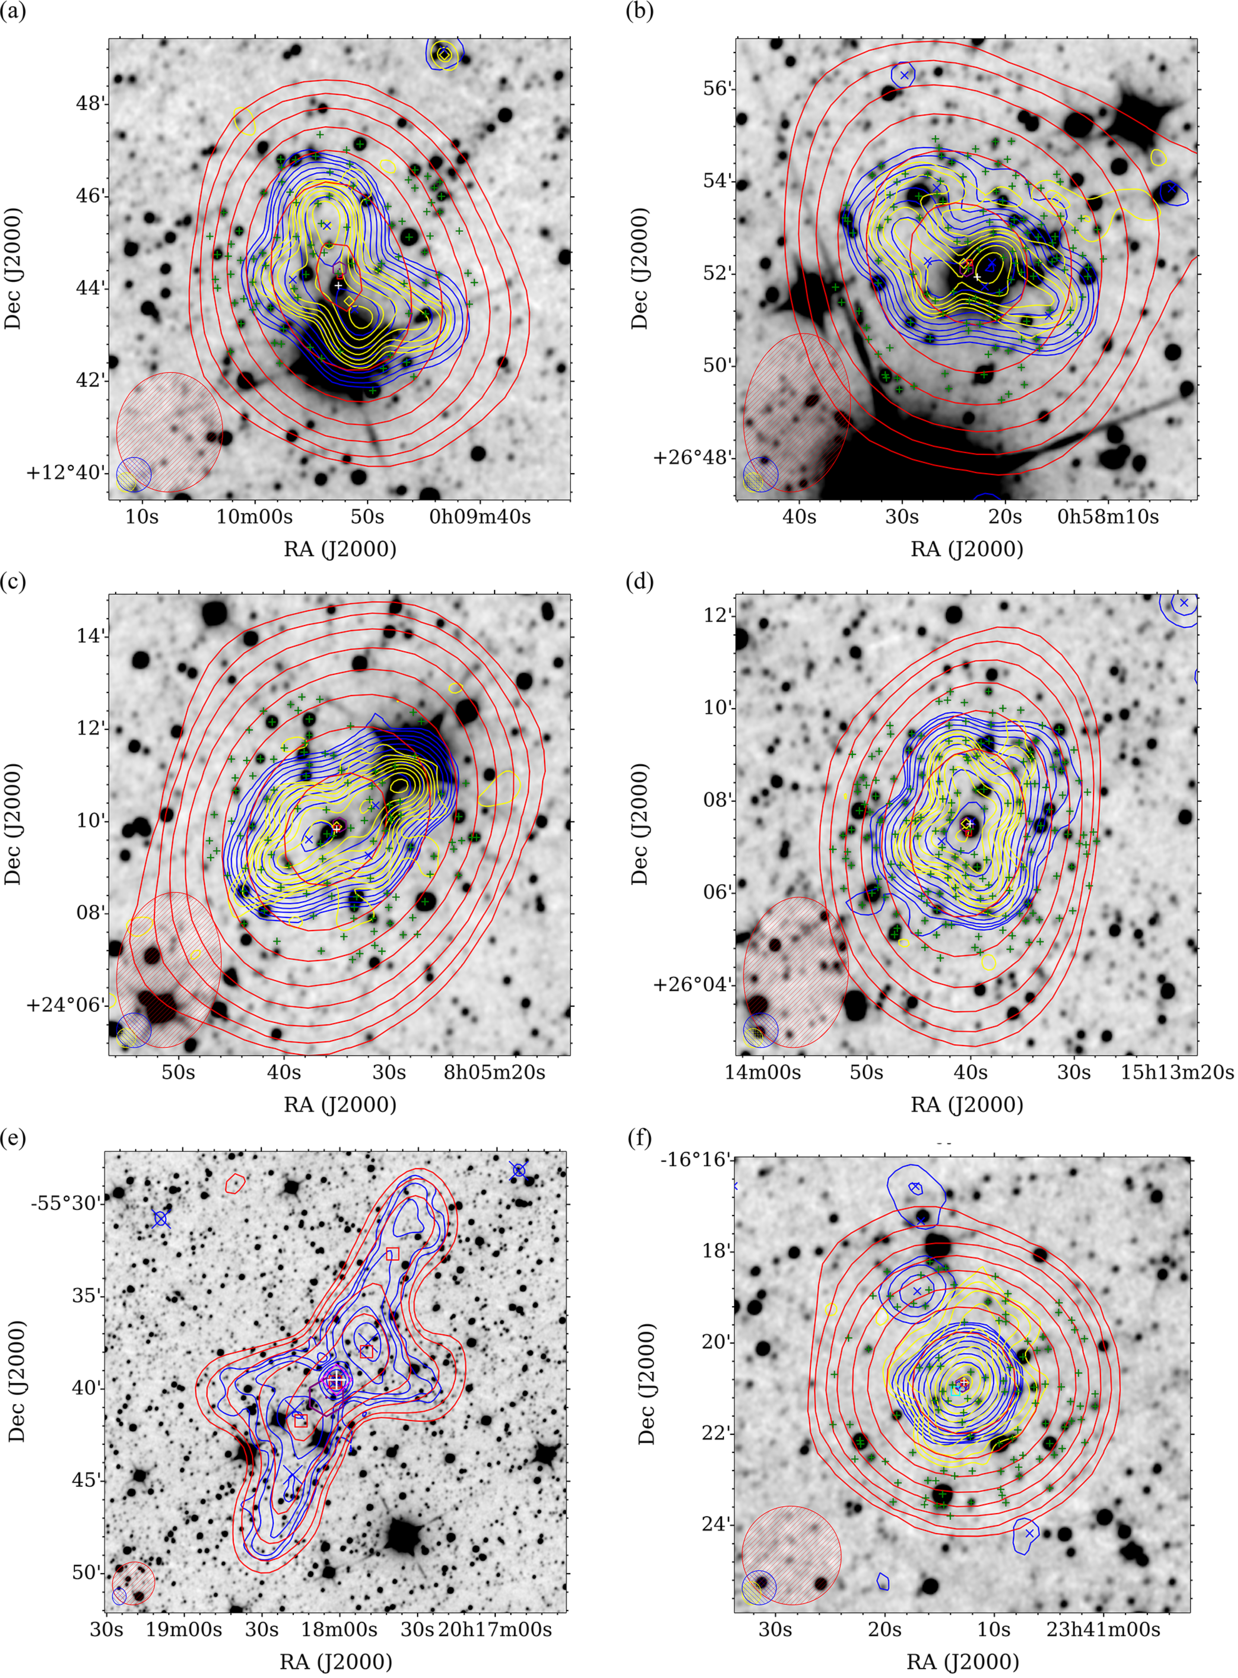
Rare sources picked up by the GLEAM Survey include those showing possible intermittent jet activity. In some cases, the orientation of the jet may have changed between, or during, episodes of jet production. For the former scenario, the radio source may exhibit an ‘X-shaped’ appearance (e.g. Capetti et al. Reference Capetti, Zamfir, Rossi, Bodo, Zanni and Massaglia2002; Saripalli & Subrahmanyan Reference Saripalli and Subrahmanyan2009). Using the spectral information provided by the MWA, in combination with data of higher spatial resolution at low frequencies, it is possible to calculate the ages of the two sets of lobes and thereby estimate the duty cycle of the AGN. However, an alternative explanation for X-shaped morphology is that the source is in an ongoing group or cluster merger, with hydrodynamical effects and the surrounding medium influencing the radio structure (e.g. Hardcastle et al. Reference Hardcastle2019). Whatever the origin or subsequent processing of the emission, there are eight G4Jy sources with X-shaped morphology (Section 4.4.1), six of which are shown in Figure 4.
Overlays for (a) the Sculptor Galaxy, G4Jy 86, (b) the Southern Pinwheel Galaxy, G4Jy 1081, (c) 3C 40, G4Jy 150 (white plus sign towards the west) and G4Jy 151 (white plus sign towards the east), and (d) G4Jy 1110 (Sections 4.2–4.3 and appendix A of G4Jy Paper III; White et al., in prep.). The datasets, contours, symbols, and beams are the same as those used for Figure 1. In addition, white plus signs indicate the host galaxy positions for G4Jy sources, and we use a logarithmic scale for the inverted, mid-infrared images in the first two panels. For panels (c) and (d), the usual inverted, linear greyscale is used.

Six of the eight X-shaped radio sources in the G4Jy Sample (Section 4.4.1). The datasets, contours, symbols, and beams are the same as those used for Figure 1, but where blue contours, crosses, and ellipses correspond to NVSS or SUMSS. Host galaxies are highlighted with a white plus, and for the 10 arcmin overlays, all AllWISE positions within 3 arcmin of the centroid are also shown (green plus signs). (a) A 10 arcmin overlay of G4Jy 18. (b) A 10 arcmin overlay of G4Jy 105. (c) A 10 arcmin overlay of G4Jy 683. (d) A 10 arcmin overlay of G4Jy 1233. (e) A 1 deg overlay of G4Jy 1613. (f) A 10 arcmin overlay of G4Jy 1846.
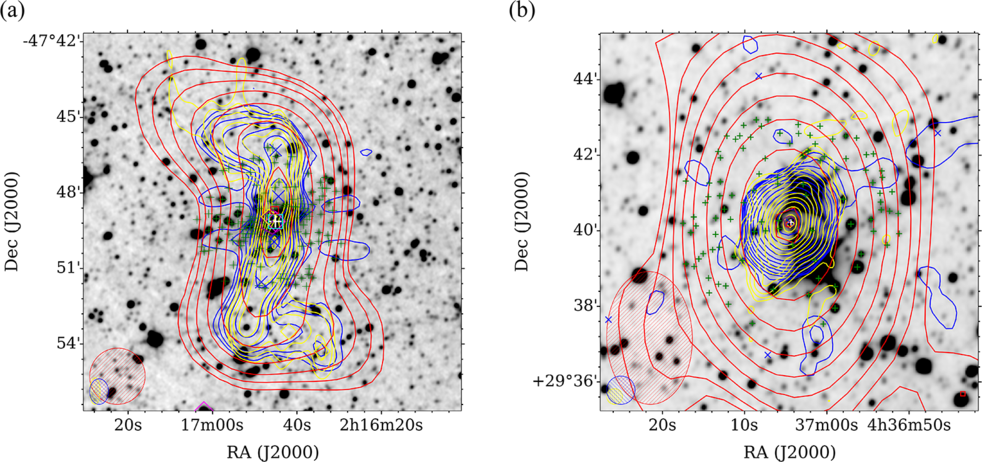
Meanwhile, it has been suggested that a less abrupt change in the jet axis is what leads to ‘S-shaped’ or ‘Z-shaped’ radio sources [Figure 5(a)]. We find six such sources in the G4Jy Sample, which we detail in Section 4.4.2. For these cases, we see (clearer) evidence of precession of the radio jets, which is thought to be caused by two supermassive black holes orbiting one another (e.g. Hunstead et al. Reference Hunstead, Murdoch, Condon and Phillips1984; Merritt & Ekers Reference Merritt and Ekers2002).
Two of the six S-/Z-shaped radio sources in the G4Jy Sample (Section 4.4.2), where the Z-shaped morphology of G4Jy 480 is revealed at 1.7 GHz (see Cox, Gull, & Scheuer Reference Cox, Gull and Scheuer1991). The datasets, contours, symbols, and beams are the same as those used for Figure 1, but where blue contours, crosses, and ellipses correspond to NVSS or SUMSS. In addition, positions from AllWISE are indicated by green plus signs, with that corresponding to the host galaxy highlighted in white. (a) G4Jy 241. (b) G4Jy 480.
A 1º overlay of cluster Abell 3667, where G4Jy 1605 is the cluster relic in the north-west (Section 4.5), and G4Jy 1606 is the head-tail radio galaxy at the centre (Section 4.7.2). The host galaxy for G4Jy 1606 is highlighted with a white plus sign. Radio contours from GLEAM (170–231 MHz; red) and SUMSS (843 MHz; blue) are overlaid on a mid-infrared image from WISE (3.4  $\mu$
m; inverted greyscale). For each set of contours, the lowest contour is at the 3
$\mu$
m; inverted greyscale). For each set of contours, the lowest contour is at the 3  $\sigma$
level (where
$\sigma$
level (where  $\sigma$
is the local rms), with the number of
$\sigma$
is the local rms), with the number of  $\sigma$
doubling with each subsequent contour (i.e. 3, 6, 12
$\sigma$
doubling with each subsequent contour (i.e. 3, 6, 12  $\sigma$
). Also plotted, in the bottom left-hand corner, are ellipses to indicate the beam sizes for GLEAM (red with ‘/’ hatching) and SUMSS (blue with ‘\’ hatching). The centroid position for G4Jy 1606 is indicated by a purple hexagon, and also plotted are catalogue positions from GLEAM (red squares), SUMSS (blue crosses), AT20G (cyan squares), and 6dFGS (magenta diamonds).
$\sigma$
). Also plotted, in the bottom left-hand corner, are ellipses to indicate the beam sizes for GLEAM (red with ‘/’ hatching) and SUMSS (blue with ‘\’ hatching). The centroid position for G4Jy 1606 is indicated by a purple hexagon, and also plotted are catalogue positions from GLEAM (red squares), SUMSS (blue crosses), AT20G (cyan squares), and 6dFGS (magenta diamonds).
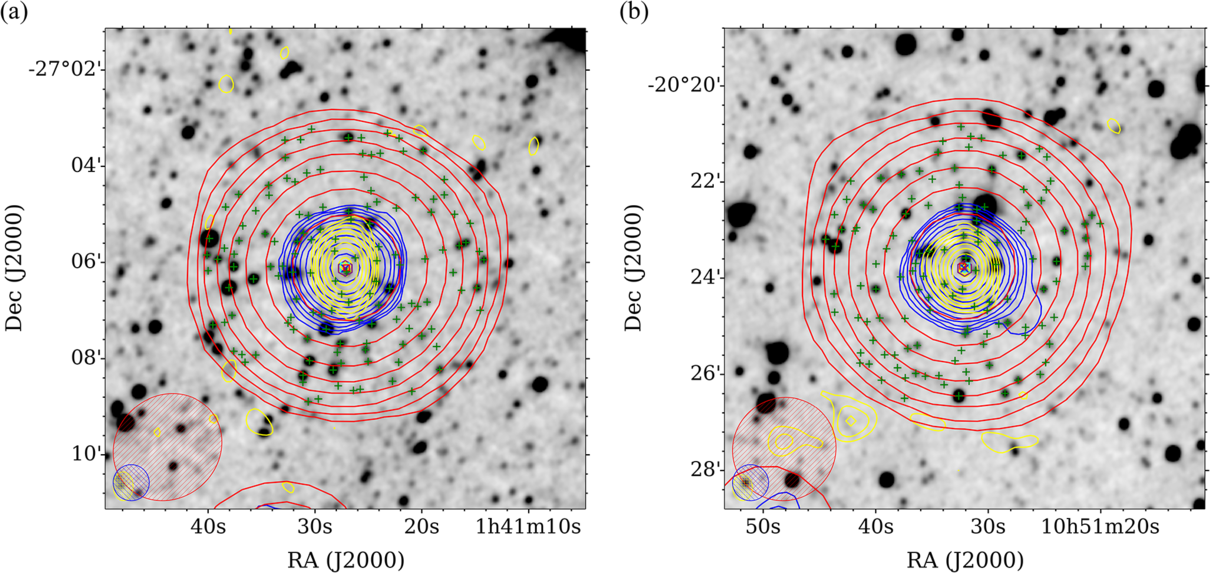
Two 10 arcmin overlays, of (a) G4Jy 77 in cluster Abell 85 (Section 4.5), and (b) the lensing cluster MACS J1931.8–2634, which contains G4Jy 1550 (Section 4.6). The datasets, contours, symbols, and beams are the same as those used for Figure 1, with positions from AllWISE indicated by green plus signs. For G4Jy 1550, the host galaxy is highlighted in white.

4.4.1. X-shaped sources
The first X-shaped source in the G4Jy Sample, G4Jy 18 [GLEAM J000952+124416; Figure 4(a)], also appears in the 3CRR catalogue and is known as 4C +12.03. Observations of the radio core (Leahy & Perley Reference Leahy and Perley1991; Kuźmicz et al. Reference Kuźmicz, Jamrozy, Kozieł-Wierzbowska and Weżgowiec2017) allow us to confirm that we have correctly (manually) identified the host galaxy.
NGC 326 (4C +26.03) is listed as G4Jy 105 [GLEAM J005823+265214; Figure 4(b)]. This source has been observed by Murgia et al. (Reference Murgia, Parma, de Ruiter, Bondi, Ekers, Fanti and Fomalont2001) at multiple frequencies using the VLA, and their Figure 9 clearly shows that the radio core is associated with the northern member of the dumb-bell galaxy. We dismiss the AllWISE position closest to the centroid position and confirm that the newly chosen host galaxy position is in agreement with the core position (subject to the resolution of AllWISE). A new LOw-Frequency ARray (LOFAR) image of this source reveals that the northernmost tip of the ‘X’ extends into a long plume (Hardcastle et al. Reference Hardcastle2019), a hint of which is seen in the TGSS contours.
G4Jy 683 (GLEAM J080535+240951) is also in the 3CRR catalogue, as 3C 192 [Figure 4(c)]. The density of several mid-infrared sources close to the centroid again prompts us to check against observations of the core (Baum et al. Reference Baum, Heckman, Bridle, van Breugel and Miley1988; Leahy et al. 1997). Doing so confirms that the original candidate—the AllWISE source closest to the centroid—is correct.
Also overlapping with 3CRR is G4Jy 1233 (GLEAM J151340+260718; 3C 315). This source has two AllWISE positions close to the centroid [Figure 4(d)], but the clear image of the core presented by Leahy, Pooley, & Riley (Reference Leahy, Pooley and Riley1986) allows the host galaxy to be confirmed.
G4Jy 1581 (GLEAM J195215+023032) can be found in the Revised Third Cambridge Catalogue (3CR; Bennett Reference Bennett1962; Spinrad et al. Reference Spinrad, Djorgovski, Marr and Aguilar1985) as 3C 403. Its X-shaped morphology is evident in the TGSS contours, and a VLA image by Black et al. (Reference Black, Baum, Leahy, Perley, Riley and Scheuer1992) confirms that the AllWISE source closest to the centroid is the host galaxy.
G4Jy 1613 (B2014–558/J2018–556) is perhaps the best studied X-shaped source in the southern hemisphere, thanks to its large spatial extent ( $\sim$
20 arcmin along the longer-lobe axisFootnote c). Its low-frequency emission is characterised by four GLEAM components (GLEAM J201739–553242, GLEAM J201749–553800, GLEAM J201801–553938, and GLEAM J201814–554145) and the host galaxy is easily identified as g2018013–553932 in 6dFGS [Figure 4(e)]. This provides the redshift (
$\sim$
20 arcmin along the longer-lobe axisFootnote c). Its low-frequency emission is characterised by four GLEAM components (GLEAM J201739–553242, GLEAM J201749–553800, GLEAM J201801–553938, and GLEAM J201814–554145) and the host galaxy is easily identified as g2018013–553932 in 6dFGS [Figure 4(e)]. This provides the redshift ( $z=0.0606$
), from which we estimate the physical size of the radio source at 1.4 Mpc. This means that G4Jy 1613 also falls under the category of ‘giant radio galaxy’ (GRG) (see Section 4.8).
$z=0.0606$
), from which we estimate the physical size of the radio source at 1.4 Mpc. This means that G4Jy 1613 also falls under the category of ‘giant radio galaxy’ (GRG) (see Section 4.8).
Whilst G4Jy 1846 (GLEAM J234112–162052; PKS B2338–166) appears to show X-shaped contours in TGSS [Figure 4(f)], we are unable to find another radio image in the literature to support this. However, the coincidence of three radio positions suggests that the chosen host galaxy is robust, with the nearby AT20G detection likely being the result of hotspot emission.
Another X-shaped source in the sample is G4Jy 1122 (GLEAM J140649–015417). Being unresolved in TGSS, its morphology is only revealed by the 5 arcsec resolution of FIRST (Faint Images of the Radio Sky at Twenty-Centimeters; White et al. Reference White, Becker, Helfand and Gregg1997). Hence, we expect follow-up, high-resolution observations of the remainder of the G4Jy Sample to uncover additional sources such as these.
4.4.2. S-/Z-shaped sources
G4Jy 241 (GLEAM J021645–474842) is the brightest cluster galaxy (BCG) of cluster AS 239 (Abell, Corwin, & Olowin Reference Abell, Corwin and Olowin1989). The radio morphology in the inner region, alongside the coincidence of 6dFGS and AT20G detections [Figure 5(a)], allow us to confidently identify the host galaxy (ESO 198-1). At  $z=0.064$
(g0216451–474909), the angular size of the radio emission (
$z=0.064$
(g0216451–474909), the angular size of the radio emission ( ${\sim}8$
arcmin) corresponds to a physical size of 590 kpc.
${\sim}8$
arcmin) corresponds to a physical size of 590 kpc.
The S-shaped radio source, G4Jy 447 (GLEAM J042220+140742, GLEAM J042233+140733), became a member of the G4Jy Sample following an internal match of the EGC (see Section 7.2.1 of Paper I). It is also known as 4C +14.12 (PKS B0419+14) and we select the bright mid-infrared source, coinciding with the narrowing of the TGSS contours [Figure 8(d) of Paper I], as the host galaxy.
G4Jy 543 (GLEAM J052522–324121 and GLEAM J052531–324357) is PKS B0523–32 in cluster AS 527 (Abell et al. Reference Abell, Corwin and Olowin1989). It was added to the G4Jy Sample following a comparison with the sample of Jones & McAdam (Reference Jones and McAdam1992) (see Section 7.1.1 of Paper I), and we follow their host galaxy identification. This is on account of its 6dFGS detection (g0525272–324216) being positioned at the ‘pinch’ of the TGSS contours [Figure 4(b) of Paper I]. G4Jy 543 is  ${\sim}7$
arcmin across, which corresponds to a physical size of 610 kpc at
${\sim}7$
arcmin across, which corresponds to a physical size of 610 kpc at  $z=0.077$
.
$z=0.077$
.
For G4Jy 1523 (GLEAM J191757–243917), a nearby star (J19175653–2438509) leads to obscuration in the mid-infrared image. This means that we are unable to identify the host galaxy in AllWISE, and so we set the host flag to ‘m’ in the G4Jy catalogue.
Of course, radio images of better resolution would allow additional S-/Z-shaped sources to be identified. For example, G4Jy 480 (GLEAM J043704+294009) is 3C 123 in 3CRR. It shows Z-shaped symmetry at 1.7 GHz (observations by Laing, published by Cox et al. Reference Cox, Gull and Scheuer1991), but only has rhombus-shaped contours at the 25 arcsec resolution provided by TGSS [Figure 5(b)].
Similarly, G4Jy 1802 (GLEAM J230303–184129) shows extended emission in NVSS and TGSS, but its S-shaped morphology is revealed in 1.5-GHz images by Hunstead et al. (Reference Hunstead, Murdoch, Condon and Phillips1984). They note an optically faint companion galaxy at the same redshift as the host of G4Jy 1802 ( $z = 0.129$
), but its separation of 6.8 arcsec on the sky (and the size of the host in the W1 image) means that it is not distinguished in AllWISE. However, our host galaxy identification (AllWISE J230302.97–184125.8) is reliable, with its position coinciding with both a detection in AT20G and in 6dFGS.
$z = 0.129$
), but its separation of 6.8 arcsec on the sky (and the size of the host in the W1 image) means that it is not distinguished in AllWISE. However, our host galaxy identification (AllWISE J230302.97–184125.8) is reliable, with its position coinciding with both a detection in AT20G and in 6dFGS.
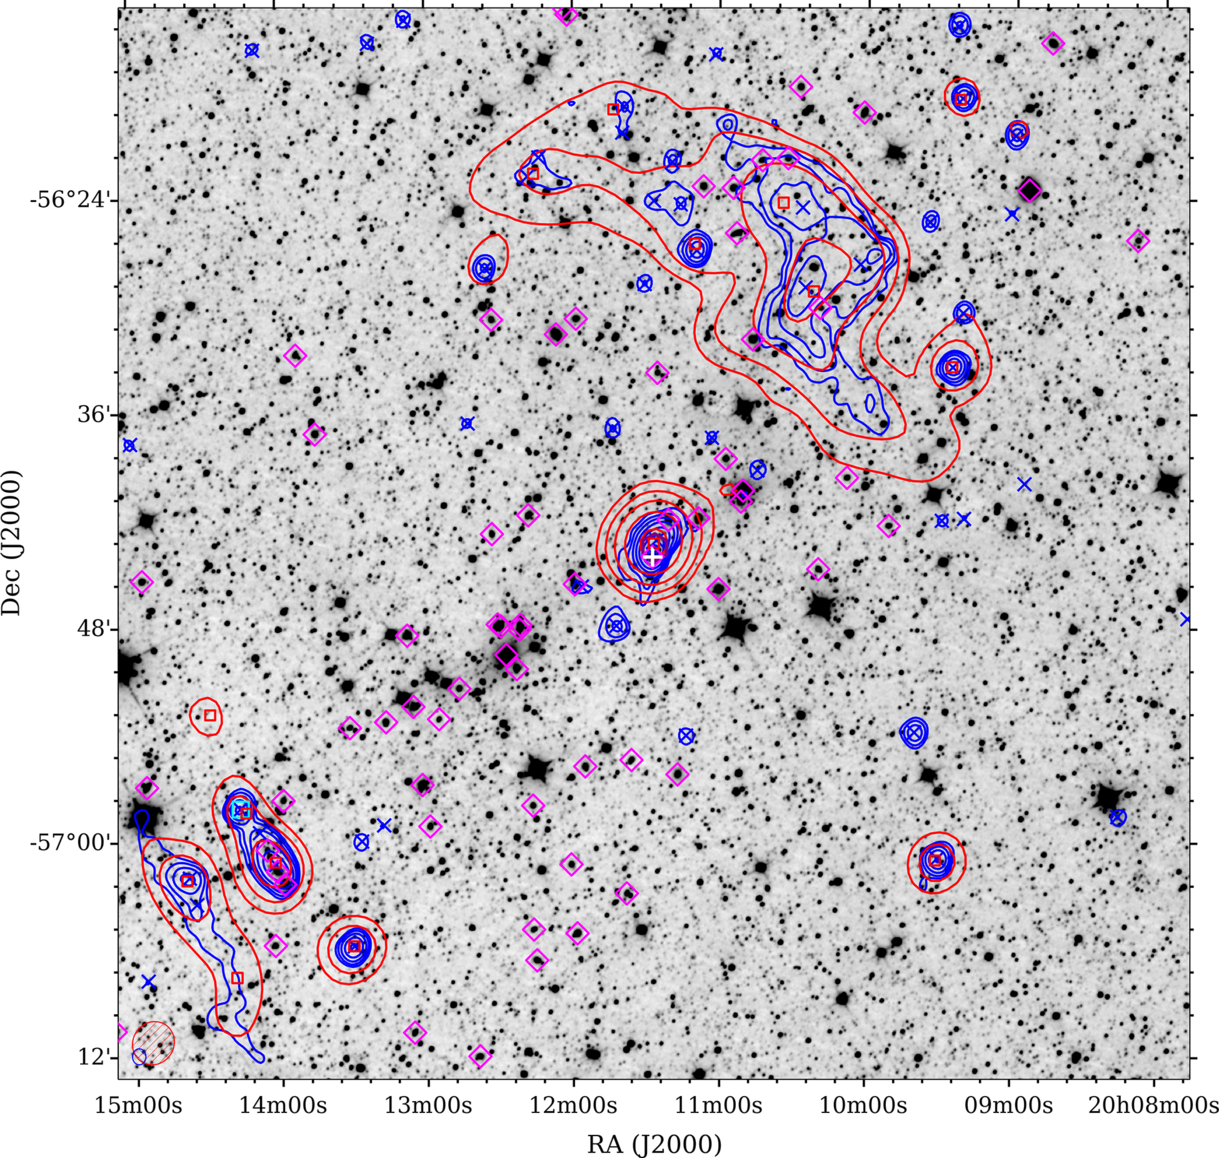
4.5. A cluster relic and a halo
The G4Jy Sample contains several examples of radio emission associated with galaxy clusters, including the extended radio emission from cluster Abell 3667 (Rottgering et al. Reference Rottgering, Wieringa, Hunstead and Ekers1997; Hindson et al. Reference Hindson2014). This emission is thought to be a consequence of two halos merging (e.g. Ensslin et al. Reference Ensslin, Biermann, Klein and Kohle1998), with shock waves having propagated outwards, resulting in a radio relic on opposite sides of the cluster (Figure 6). As five GLEAM components are associated with each other, we update the centroid position for the northern relic and list this source as G4Jy 1605. (The southern relic is composed of GLEAM J201418–570734 and GLEAM J201438–570209, whose summed flux-density at 151 MHz is below 4 Jy. As such, this relic is not included in the G4Jy Sample.) Since it is inappropriate to cross-identify the relic with a mid-infrared source, we set the host flag to ‘n’ and label the morphology ‘complex’. With cluster members at an average redshift of  $z = 0.055$
(Johnston-Hollitt, Hunstead, & Corbett Reference Johnston-Hollitt, Hunstead and Corbett2008; Owers, Couch, & Nulsen Reference Owers, Couch and Nulsen2009), the 1º separation of the two relics equates to a physical extent of 3.9 Mpc.
$z = 0.055$
(Johnston-Hollitt, Hunstead, & Corbett Reference Johnston-Hollitt, Hunstead and Corbett2008; Owers, Couch, & Nulsen Reference Owers, Couch and Nulsen2009), the 1º separation of the two relics equates to a physical extent of 3.9 Mpc.
Our attention is also drawn to the unusual morphology, and very steep spectrum emission ( $\alpha = -2.64 \pm 0.04$
, measured between 151 and 1 400 MHz), of G4Jy 77 [GLEAM J004130–092221; Figure 7(a)]. It is B0038–096 in cluster Abell 85, with Bagchi, Pislar, & Lima Neto (Reference Bagchi, Pislar and Lima Neto1998) interpreting it as a radio halo. It is unclear whether this plasma was energised during a cluster merger, or by a radio galaxy that has long ago ‘switched off’, so we leave the host flag as ‘u’ (rather than ‘n’). For the morphology, we label this source ‘complex’.
$\alpha = -2.64 \pm 0.04$
, measured between 151 and 1 400 MHz), of G4Jy 77 [GLEAM J004130–092221; Figure 7(a)]. It is B0038–096 in cluster Abell 85, with Bagchi, Pislar, & Lima Neto (Reference Bagchi, Pislar and Lima Neto1998) interpreting it as a radio halo. It is unclear whether this plasma was energised during a cluster merger, or by a radio galaxy that has long ago ‘switched off’, so we leave the host flag as ‘u’ (rather than ‘n’). For the morphology, we label this source ‘complex’.
4.6. A lensing cluster
The TGSS and NVSS contours (and positions) for GLEAM J193149–263450 suggest that there are two unrelated radio sources close together, with different spectral indices [Figure 7(b)]. The GLEAM integrated flux density at 151 MHz is 6.16 Jy, with TGSS indicating that the northern source (i.e. the northern TGSS component) accounts for 81% of the low-frequency emission. Its flux density is greater than 4 Jy and so GLEAM J193149–263450 remains in the G4Jy Sample (with its confusion flag already set to ‘1’ on account of the NVSS point source towards the north-west). We refer to this northern source as G4Jy 1550, which has a spectral index (between 151 MHz and 1.4 GHz) of approximately  $-2.3$
. The southern source (i.e. the southern TGSS component) has a spectral index of approximately
$-2.3$
. The southern source (i.e. the southern TGSS component) has a spectral index of approximately  $-1.9$
and is suggested to be a mini halo [although Giacintucci et al. (Reference Giacintucci, Markevitch, Venturi, Clarke, Cassano and Mazzotta2014) caution that such a classification is very uncertain]. These sources belong to the known lensing cluster MACS J1931.8–2634, and G4Jy 1550 (the BCG) is found to have equal AGN and starburst contributions to its ultra-luminous far-infrared emission (Santos et al. Reference Santos2016). As we do not have sufficient resolution at
$-1.9$
and is suggested to be a mini halo [although Giacintucci et al. (Reference Giacintucci, Markevitch, Venturi, Clarke, Cassano and Mazzotta2014) caution that such a classification is very uncertain]. These sources belong to the known lensing cluster MACS J1931.8–2634, and G4Jy 1550 (the BCG) is found to have equal AGN and starburst contributions to its ultra-luminous far-infrared emission (Santos et al. Reference Santos2016). As we do not have sufficient resolution at  ${\sim}1$
GHz to update the centroid position—and we wish to maintain consistency across the sample—it remains determined by the single NVSS component that we consider as associated with G4Jy 1550. The 1.4-GHz flux density quoted in the G4Jy catalogue is therefore an overestimate. As for the host galaxy of G4Jy 1550, this is the AllWISE source coincident with the northern TGSS position.
${\sim}1$
GHz to update the centroid position—and we wish to maintain consistency across the sample—it remains determined by the single NVSS component that we consider as associated with G4Jy 1550. The 1.4-GHz flux density quoted in the G4Jy catalogue is therefore an overestimate. As for the host galaxy of G4Jy 1550, this is the AllWISE source coincident with the northern TGSS position.
4.7. Bent- and head-tail radio galaxies
Other radio sources connected with clusters are radio galaxies with ‘bent’ lobes or ‘twin tails’. These are also referred to as wide-angle tail (WAT) and narrow-angle tail (NAT) radio galaxies (see Miley Reference Miley1980, and references therein). This morphology is indicative of the radio galaxy falling into a cluster, with its radio lobes getting pushed backwards by ram pressure from the surrounding medium. As a result, a ‘double’ may no longer be axisymmetric, and so we need to search for the host galaxy near the apex of the radio emission. Furthermore, the projection of the radio lobes (or ‘tails’) with respect to the line of sight may give the appearance that they are overlapping. This means that the host galaxy is now at the ‘head’ of the radio emission (hence, the term ‘head-tail’ galaxy; e.g. Miley Reference Miley1973), rather than being located between two distinct radio lobes. As such, we describe the morphology of head-tail galaxies as ‘complex’. We find a total of 41 bent-/head-tail radio galaxies in the G4Jy Sample and list them in Tables 1 and 2.
4.7.1. Bent-tail radio galaxies
G4Jy 315 (GLEAM J025738+060352 and GLEAM J025748+060201) is a particularly interesting source, with checks against the literature showing that this is 3C 75 (NGC 1128) in cluster Abell 400. Owen et al. (Reference Owen, O’Dea, Inoue and Eilek1985) present 1.4 arcsec resolution images at 4.9 GHz that reveal that the radio emission is produced by two WAT radio galaxies. Not having the resolution to disentangle these two sources at low frequencies [Figure 8(a)], we proceed with updating the confusion flag to ‘1’. Also, we select the AllWISE position that is consistent with the northern radio core—the brighter of the two nuclei (Liuzzo et al. Reference Liuzzo, Giovannini, Giroletti and Taylor2010)—following existing convention.
Our host galaxy identification for G4Jy 367 (GLEAM J033414–011121; 3C 89) is confirmed by a clear radio core, and ‘triple’ morphology, in FIRST. Therefore, somewhat unusually, the AT20G position [see Figure 8(b)] possibly indicates where the inner part of the southward jet is colliding into the dense medium of cluster RXJ0334.2-0111 (Dasadia et al. Reference Dasadia2016).
G4Jy 462 (GLEAM J042839–535020 and GLEAM J042907–534919) is IC 2082 (B0427–539) in cluster AS 463 (Abell et al. Reference Abell, Corwin and Olowin1989). We agree with the host galaxy identification of Jones & McAdam (Reference Jones and McAdam1992) but interpret this source as a WAT radio galaxy rather than a head-tail source, due to the extended SUMSS emission seen towards the north-east.
A list of G4Jy sources that have bent-tail morphology, which we label as ‘double’ or ‘triple’ in the G4Jy catalogue (see Sections 3.1 and 4.7.1).

Such interpretation of the morphology informs our identification of the host galaxy in the AllWISE image.
A list of G4Jy sources that have head-tail morphology, which we label as ‘complex’ in the G4Jy catalogue (see Sections 3.1 and 4.7.2).
For these sources, the host galaxy identification is at the ‘head’ of the radio emission.
G4Jy 637 (GLEAM J070130+231313) has a WAT morphology, as shown by the trailing TGSS contours [Figure 8(c)]. This source appears in the literature as 4C +23.18 but we cannot find a high-resolution image to help distinguish between host galaxy candidates. We therefore leave the host flag as ‘u’.
G4Jy 949 (GLEAM J114507+193718) is 3C 264 (NGC 3862) in the 3CRR sample. In addition to Hubble Space Telescope images of the optical/radio jet, Baum et al. (Reference Baum1997) present MERLIN observations that allow us to select the correct AllWISE position for this NAT radio galaxy [Figure 8(d)].
The WAT radio galaxy, G4Jy 1004 (GLEAM J122950+114015), is in cluster Abell 1552. Due to sidelobes caused by M87 (Virgo A) in earlier radio surveys, it is listed in the 3CRR catalogue as ‘A1552’ (rather than having a ‘3C’/‘4C’ name). Our host galaxy identification is in agreement with Owen, White, & Burns (Reference Owen, White and Burns1992).
G4Jy 1034 (GLEAM J125437–123333; 3C 278) may not be as extended as other sources, but the high density of mid-infrared positions makes it difficult to identify the correct host galaxy by eye. This WAT radio galaxy is also known as NGC 4782, in a common envelope with NGC 4783, and the 5-GHz image presented by Baum et al. (Reference Baum, Heckman, Bridle, van Breugel and Miley1988) allows us to identify the radio core. As such, we update the AllWISE position to that of the 6dFGS source, g1254357–123407, in agreement with the literature (e.g. Morganti, Killeen, & Tadhunter Reference Morganti, Killeen and Tadhunter1993).
The WAT radio galaxy, G4Jy 1067 (GLEAM J132606–272641, GLEAM J132616–272632), is PKS B1323–271 in cluster Abell 1736. Whilst the identification provided by van Velzen et al. (Reference van Velzen, Falcke, Schellart, Nierstenhöfer and Kampert2012) is the likely host galaxy, we cannot find a high-resolution radio image to confirm the core position. Therefore, we leave the host flag as ‘u’.
G4Jy 1094 (GLEAM J134855–252700) is a WAT radio galaxy in cluster Abell 1791 [Figure 8(e)]. We use a 4.9-GHz image (Gregorini et al. Reference Gregorini, de Ruiter, Parma, Sadler, Vettolani and Ekers1994) to confirm that the correct host galaxy is the AllWISE source that is also in 6dFGS (g1348542–252724).
TGSS contours show that G4Jy 1245 (GLEAM J152007–283411; PKS 1517–283), in Abell 3618, is a WAT radio galaxy. Based upon the 4.9-GHz contours presented by Gregorini et al. (Reference Gregorini, de Ruiter, Parma, Sadler, Vettolani and Ekers1994), we identify the 6dFGS source (g1520060–283420) as the host galaxy, lying at the midpoint between the two TGSS detections [Figure 8(f)].
G4Jy 1496 (GLEAM J183626+193946, GLEAM J183640+ 194318, GLEAM J183649+194105) is the WAT radio galaxy, PKS B1834+19 [Figure 6(e) of Paper I]. It has an unambiguous mid-infrared source coinciding with the peak emission in SUMSS (which marks the core), with our host-galaxy identification in agreement with van Velzen et al. (Reference van Velzen, Falcke, Schellart, Nierstenhöfer and Kampert2012).
The last bent-tail galaxies that we identify in the G4Jy Sample are G4Jy 1704 and G4Jy 1705. These are discussed and shown in Appendix D.3 of Paper I.
4.7.2. Head-tail radio galaxies
In proximity (and parallel) to one another are the head-tail galaxies G4Jy 100 (GLEAM J005559–012139) and G4Jy 101 (GLEAM J005623–011742), shown in Figure 9(a). Their hosts are confirmed by FIRST images, which also begin to resolve the radio emission, showing NAT morphology.
G4Jy 150 [Section 4.3; Figure 3(c)] is the next head-tail galaxy in our sample, followed by G4Jy 204 (GLEAM J015620+053724). The latter is NGC 742, in a common halo with NGC 741. We interpret the trail of low-frequency emission as associated with G4Jy 204, based on a 5-GHz image by Schellenberger et al. (Reference Schellenberger, Vrtilek, David, O’Sullivan, Giacintucci, Johnston-Hollitt, Duchesne and Raychaudhury2017). This shows two radio jets emanating from the source and being strongly bent in a westward direction. In addition, the well-defined radio core allows us to select the correct mid-infrared position in a dense field [Figure 3(b)].
G4Jy 325 (GLEAM J030653–120627) is within cluster Abell 415, and van Velzen et al. (Reference van Velzen, Falcke, Schellart, Nierstenhöfer and Kampert2012) identify this radio emission as PKS B0304–12. However, PKS B0304–12 is a blend of two radio sources: G4Jy 325 and an unrelated point source (GLEAM J030702–120539) towards the east and detected in AT20G [Figure 9(c)]. These are not distinguished in the catalogue of van Velzen et al. (Reference van Velzen, Falcke, Schellart, Nierstenhöfer and Kampert2012), which explains why our total 1.4-GHz flux density is less than half the value they calculate (where their automated algorithm sums over three, rather than two, NVSS components). High-resolution radio images by O’Dea & Owen (Reference O’Dea and Owen1985) and Owen & Ledlow (Reference Owen and Ledlow1997) support our ‘head-tail’ label, but despite our conflicting interpretation of the morphology, we agree with van Velzen et al. (Reference van Velzen, Falcke, Schellart, Nierstenhöfer and Kampert2012) as to the host galaxy identification (g0306527–120624 at  $z=0.079$
). The difference is that we refer to G4Jy 325 alone (B0304–123A in O’Dea & Owen Reference O’Dea and Owen1985), whilst they incorrectly associate G4Jy 325 with B0304–123B (whose host galaxy is AllWISE J030703.13–120536.8).
$z=0.079$
). The difference is that we refer to G4Jy 325 alone (B0304–123A in O’Dea & Owen Reference O’Dea and Owen1985), whilst they incorrectly associate G4Jy 325 with B0304–123B (whose host galaxy is AllWISE J030703.13–120536.8).
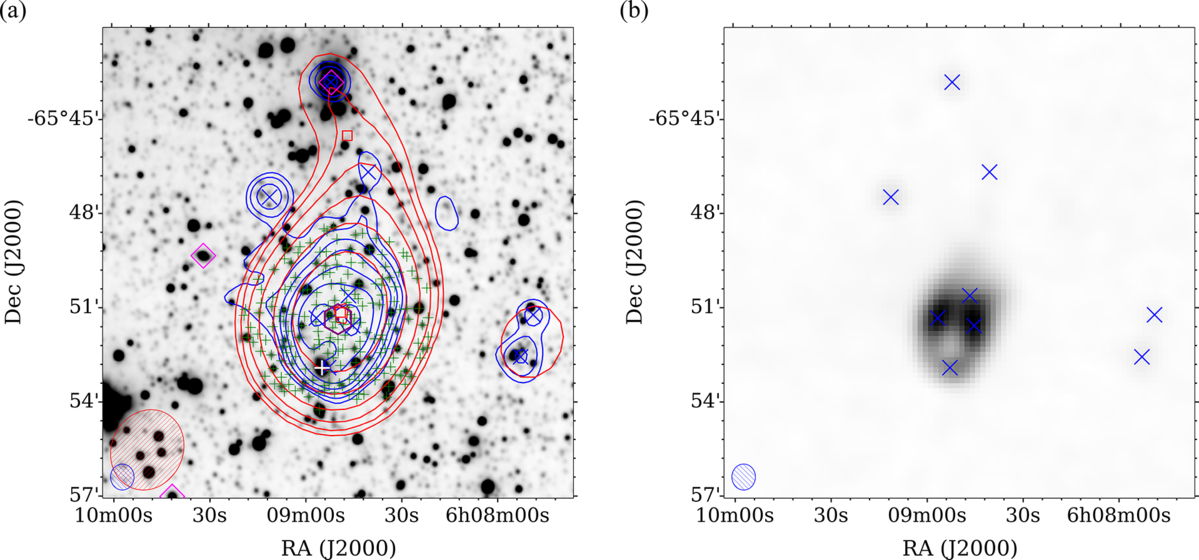
For G4Jy 466 (GLEAM J043014–613244), also known as B0429–616 in cluster Abell 3266, we agree with Burgess & Hunstead (Reference Burgess and Hunstead2006b) as to the location of the radio core. This is at the position of the detections in AT20G and 6dFGS (g0430220–613201 at  $z=0.055$
) and confirmed by an ATCA image (in the thesis of Reid Reference Reid1999), which we publish for the first time in Figure 10. At this higher resolution, G4Jy 466 appears as a WAT radio galaxy, but we continue to refer to its morphology as ‘complex’, in keeping with other (unresolved) head-tail galaxies in the sample.
$z=0.055$
) and confirmed by an ATCA image (in the thesis of Reid Reference Reid1999), which we publish for the first time in Figure 10. At this higher resolution, G4Jy 466 appears as a WAT radio galaxy, but we continue to refer to its morphology as ‘complex’, in keeping with other (unresolved) head-tail galaxies in the sample.
Examples of bent-tail radio galaxies in the G4Jy Sample (Section 4.7.1). The datasets, contours, symbols, and beams are the same as those used for Figure 1, but where blue contours, crosses, and ellipses correspond to NVSS or SUMSS. Host galaxies are highlighted with a white plus, and all AllWISE positions within 3 arcmin of the centroid are also shown (green plus signs). (a) G4Jy 315. (b) G4Jy 367. (c) G4Jy 637. (d) G4Jy 949. (e) G4Jy 1094. (f) G4Jy 1245.
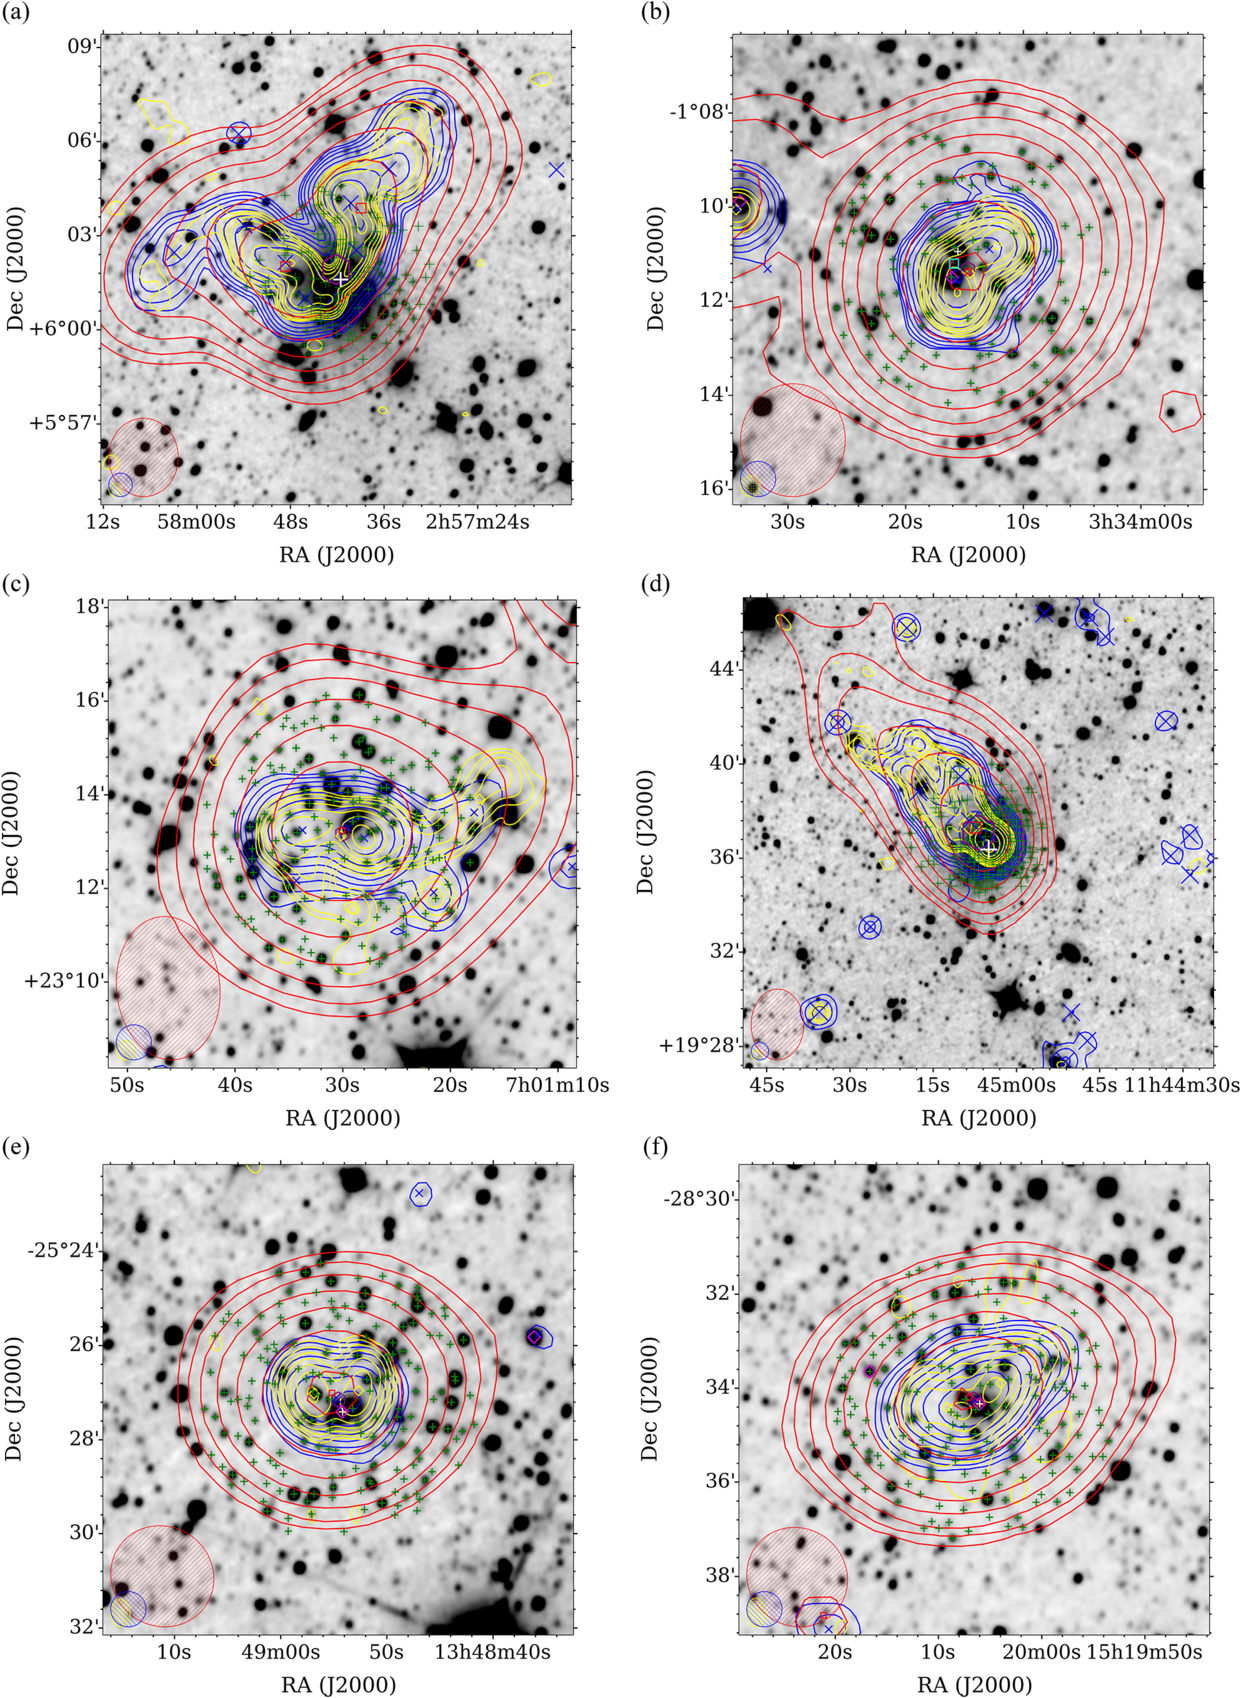
Examples of head-tail radio galaxies in the G4Jy Sample (Section 4.7.2). The datasets, contours, symbols, and beams are the same as those used for Figure 1. Host galaxies are highlighted with a white plus, and for the 10 arcmin overlays, all AllWISE positions within 3 arcmin of the centroid are also shown (green plus signs). (a) G4Jy 100 and G4Jy 101. (b) G4Jy 204. (c) G4Jy 325. (d) G4Jy 1638.

Two overlays for G4Jy 466, which is B0429–616 (Section 4.7.2). The first overlay, (a), uses the same datasets, contours, symbols, and beams as those used for Figure 6 (with the exception of TGSS, which is unavailable at this declination). The second overlay, (b), uses an optical image from SuperCOSMOS (Hambly et al. Reference Hambly2001; inverted greyscale) and a 1.3-GHz image (cyan contours) from Reid (Reference Reid1999) that was provided courtesy of Richard Hunstead. The latter was obtained using ATCA in its 6C configuration, resulting in a beam of 12.9 arcsec  $\times$
8.8 arcsec (cyan ellipse in the right-hand panel). Also overlaid are the same blue contours (using SUMSS) as in panel (a), for reference. For each set of contours in this figure, the lowest contour is at the 3
$\times$
8.8 arcsec (cyan ellipse in the right-hand panel). Also overlaid are the same blue contours (using SUMSS) as in panel (a), for reference. For each set of contours in this figure, the lowest contour is at the 3  $\sigma$
level (where
$\sigma$
level (where  $\sigma$
is the local rms), with the number of
$\sigma$
is the local rms), with the number of  $\sigma$
doubling with each subsequent contour (i.e. 3, 6, 12
$\sigma$
doubling with each subsequent contour (i.e. 3, 6, 12  $\sigma$
). Positions from AllWISE are indicated by green plus signs, with the host galaxy highlighted in white.
$\sigma$
). Positions from AllWISE are indicated by green plus signs, with the host galaxy highlighted in white.

G4Jy 475 (GLEAM J043409–132250 and GLEAM J043415–132717) is B0431–134 in cluster Abell 496. A second ‘tail’ is not clearly distinguished in our overlay [Figure 6(b) of Paper I], so we describe this as a head-tail galaxy and label its morphology ‘complex’. Our host galaxy identification is in agreement with the core position, shown in a 4.9-GHz image by O’Dea & Owen (Reference O’Dea and Owen1985).
The SUMSS contours for G4Jy 595 (GLEAM J060849–655110; B0608–658) show a strange morphology, with peaks in the radio emission along the east-west direction but extension in the north-south direction. It is only upon inspecting the SUMSS image alone [Figure 11(b)] that we can appreciate that this is actually a NAT radio galaxy, with a ‘hollow’ in the radio emission near the core. Consequently, we update the mid-infrared host galaxy in agreement with Jones & McAdam (Reference Jones and McAdam1992), but leave the morphology label as ‘complex’ (since a ‘triple’ morphology is not clear from the G4Jy overlay). In addition, the extended low-frequency emission towards the north suggests that GLEAM J060847–654532 may be associated with G4Jy 595. However, it is unclear by how much the point source that is further north (coincident with a 6dFGS position) is potentially contributing towards this GLEAM component. Therefore, we continue with our conservative approach in listing G4Jy 595 as single-component in GLEAM.
G4Jy 595 (Section 4.7.2), as it appears (a) in the overlay used for visual inspection, and (b) in SUMSS (inverted greyscale). The overlay uses the same datasets, contours, symbols, and beams as those used for Figure 1, but where blue contours and crosses represent SUMSS emission. Positions from AllWISE are indicated by green plus signs, with that corresponding to the host galaxy highlighted in white.
G4Jy 935 (GLEAM J113943–464032 and GLEAM J113956–463743) is PKS B1137–463 [Figure 4(d) of Paper I]. Whilst the likely host galaxy for this head-tail source is AllWISE J113954.66–463749.3, we cannot find a high-resolution radio image to confirm this identification. Hence, we leave the host flag as ‘u’.
G4Jy 1504 (GLEAM J184315–483638; PKS B1839–48) is shown by Morganti et al. (Reference Morganti, Killeen and Tadhunter1993) to have WAT morphology. However, this is not clear in our overlay (with SUMSS artefacts causing distortion), so we label the morphology as ‘complex’ (i.e. showing head-tail morphology). Morganti et al. (Reference Morganti, Killeen and Tadhunter1993) also quote the core position, which agrees with our AllWISE identification (coincident with both the AT20G and 6dFGS positions).
The BCG of Abell 3667 is another head-tail galaxy (Goss et al. Reference Goss, Ekers, Skellern and Smith1982), appearing in the G4Jy Sample as G4Jy 1606 (GLEAM J201126–564322; Figure 6). ATCA observations of this source (B2007–568) at 1.4 GHz (Riseley et al. Reference Riseley, Scaife, Oozeer, Magnus and Wise2015) corroborate our identification of the host galaxy.
G4Jy 1638 (GLEAM J203444–354849) is B2031–359 and appears as a head-tail galaxy in our overlay [Figure 9(d)], hence our morphology label of ‘complex’. However, this source is shown to have NAT/WAT morphology in a 4.9-GHz image presented by Ekers et al. (Reference Ekers1989), which we use to confirm that g2034447–354902, in 6dFGS, is the host galaxy.
Finally, it is unclear whether G4Jy 1410 (GLEAM J172437–024246; see Appendix D.3 of Paper I) is a ‘double’ or a head-tail galaxy (given the relative compactness of the TGSS contours, compared to what we see for other head-tails). Whilst the presence of a bright mid-infrared source (AllWISE J172437.79–024305.6) at one end of the radio emission appears to support the ‘head-tail’ interpretation, it could also be obscuring a host galaxy that is coincident with the TGSS/NVSS detection (which would lend credence to this source being a ‘double’). Therefore, we err on the side of caution by setting the morphology label to ‘complex’ and leaving the host galaxy flag as ‘u’.
A list of G4Jy sources that are already known to be GRGs (Section 4.8).
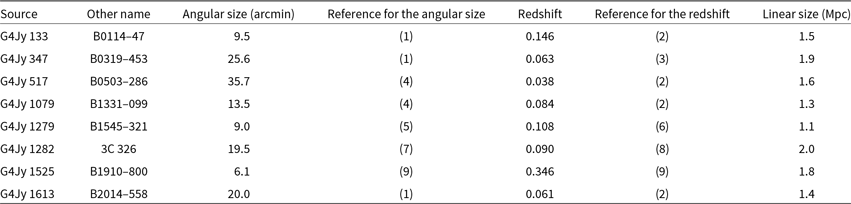
Linear sizes are calculated using the angular sizes and redshifts below in conjunction with the online cosmology calculator, CosmoCalc (Wright Reference Wright2006) (http://www.astro.ucla.edu/wright/CosmoCalc.html). References: (1) Jones & McAdam (Reference Jones and McAdam1992), (2) Jones et al. (Reference Jones2009), (3) Jones (Reference Jones1989), (4) Paper I (White et al. 2020a) alongside this work, (5) Saripalli et al. (Reference Saripalli, Subrahmanyan and Udaya Shankar2003), (6) Simpson et al. (Reference Simpson, Clements, Rawlings and Ward1993), (7) Willis & Strom (Reference Willis and Strom1978), (8) Smith, Spinrad, & Smith (Reference Smith, Spinrad and Smith1976), and (9) Subrahmanyan, Saripalli, & Hunstead (Reference Subrahmanyan, Saripalli and Hunstead1996).
4.8. Known, giant radio galaxies
We follow the definition of a ‘giant radio galaxy’ (GRG; e.g. Willis & Strom Reference Willis and Strom1978) as being a radio galaxy that has a projected, linear size of  ${\geq}1$
Mpc. A summary of the properties of the GRGs described in this subsection can be found in Table 3. We emphasise that these are radio sources that are already known to be GRGs, as an extensive search for new GRGs is beyond the scope of this paper.
${\geq}1$
Mpc. A summary of the properties of the GRGs described in this subsection can be found in Table 3. We emphasise that these are radio sources that are already known to be GRGs, as an extensive search for new GRGs is beyond the scope of this paper.
The SUMSS contours for G4Jy 133 [GLEAM J011609–471816, GLEAM J011630–472542; Figure 12(a)] suggest the presence of inner jets, which simplifies the identification of the host galaxy. Although the 6dFGS detection (g0116251–472241) appears to be the obvious candidate, we note the density of mid-infrared sources nearby. We therefore check against the literature (Danziger & Goss Reference Danziger and Goss1983; Jones & McAdam Reference Jones and McAdam1992), where this source is also referred to as PKS B0114–47. This confirms that the 6dFGS position is correct, and that the radio source is at  $z=0.146$
. Its angular extent of 9
$z=0.146$
. Its angular extent of 9 $\mbox{\ensuremath{.^\prime}}$
5 therefore corresponds to a physical size of 1.5 Mpc, hence its qualification as a GRG.
$\mbox{\ensuremath{.^\prime}}$
5 therefore corresponds to a physical size of 1.5 Mpc, hence its qualification as a GRG.
Five of eight known GRGs in the G4Jy Sample (Section 4.8). The datasets, contours, symbols, and beams are the same as those used for Figure 1, but where blue contours, crosses, and ellipses correspond to NVSS or SUMSS. Host galaxies are highlighted with a white plus, and for the 10 arcmin overlay, all AllWISE positions within 3 arcmin of the centroid are also shown (green plus signs). (a) G4Jy 133. (b) G4Jy 347. (c) G4Jy 517. (d) G4Jy 1079. (e) G4Jy 1279.

From Figure 12(b), it may be thought that the 6dFGS detection (g0320261–452029), near the midpoint between the two lobes, marks the host galaxy for G4Jy 347 (GLEAM J031939–452649 and GLEAM J032123–451021). However, we note from the literature (B0319–453 in Jones & McAdam Reference Jones and McAdam1992; Saripalli, Subrahmanyan, & Hunstead Reference Saripalli, Subrahmanyan and Hunstead1994) that the host galaxy is actually ESO 248-G10, 3.1 arcmin from the centroid position. This is beyond our search radius in the AllWISE catalogue, and so (for re-inspection) we also include mid-infrared sources within 3 ${\mathop .\limits^' }$
0 of the host galaxy position. A spectral index map by Safouris et al. (Reference Safouris, Subrahmanyan, Bicknell and Saripalli2009) shows flat spectrum radio emission associated with the core and so provides further confirmation that the host galaxy has been identified correctly. Being at
${\mathop .\limits^' }$
0 of the host galaxy position. A spectral index map by Safouris et al. (Reference Safouris, Subrahmanyan, Bicknell and Saripalli2009) shows flat spectrum radio emission associated with the core and so provides further confirmation that the host galaxy has been identified correctly. Being at  $z=0.063$
(Jones Reference Jones1989), the 25
$z=0.063$
(Jones Reference Jones1989), the 25 ${\mathop .\limits^' }$
6 separation of the radio lobes corresponds to a projected size of 1.9 Mpc, making this source another GRG.
${\mathop .\limits^' }$
6 separation of the radio lobes corresponds to a projected size of 1.9 Mpc, making this source another GRG.
The lobes of G4Jy 517 (GLEAM J050535–285648, GLEAM J050539–282627, and GLEAM J050544–282236) show distinct polarised morphology between 216 and 1400 MHz (Riseley et al. Reference Riseley2018; Riseley et al., submitted), and are  ${\sim}36$
arcmin apart. Such a large spatial separation means that identifying the host galaxy can become more difficult, owing to the substantial number of potential candidates [Figure 12(c)]. To help resolve this, we again consult the literature, where ‘B0503–286’ has previously been used to refer to both the entire radio galaxy and, individually, its southern lobe. Saripalli et al. (Reference Saripalli, Gopal-Krishna and Kuehr1986) reveal that the host galaxy (ESO 422-G028; g0505492–283519 in 6dFGS) is a
${\sim}36$
arcmin apart. Such a large spatial separation means that identifying the host galaxy can become more difficult, owing to the substantial number of potential candidates [Figure 12(c)]. To help resolve this, we again consult the literature, where ‘B0503–286’ has previously been used to refer to both the entire radio galaxy and, individually, its southern lobe. Saripalli et al. (Reference Saripalli, Gopal-Krishna and Kuehr1986) reveal that the host galaxy (ESO 422-G028; g0505492–283519 in 6dFGS) is a  $B = 15$
mag elliptical at
$B = 15$
mag elliptical at  $z=0.038$
. This means that this radio source is another GRG, having a physical size of 1.6 Mpc. As shown in Figure 12(c), the combination of large angular size and asymmetric radio lobes results in a host galaxy that is 10.9 arcmin from the centroid position. Therefore, like for G4Jy 347, we supplement our subset of the AllWISE catalogue by adding mid-infrared sources in the vicinity of the optical position (again using a search radius of 3
$z=0.038$
. This means that this radio source is another GRG, having a physical size of 1.6 Mpc. As shown in Figure 12(c), the combination of large angular size and asymmetric radio lobes results in a host galaxy that is 10.9 arcmin from the centroid position. Therefore, like for G4Jy 347, we supplement our subset of the AllWISE catalogue by adding mid-infrared sources in the vicinity of the optical position (again using a search radius of 3 ${\mathop .\limits^' }$
0 for consistency). After adding these positions to the 10 arcmin overlay, this source is ready for re-inspection regarding mid-infrared identification. Follow-up radio observations at higher frequencies (Subrahmanyan et al. Reference Subrahmanyan, Saripalli, Safouris and Hunstead2008) confirm the position of the core, and so we are satisfied that identification of the host galaxy is correct.
${\mathop .\limits^' }$
0 for consistency). After adding these positions to the 10 arcmin overlay, this source is ready for re-inspection regarding mid-infrared identification. Follow-up radio observations at higher frequencies (Subrahmanyan et al. Reference Subrahmanyan, Saripalli, Safouris and Hunstead2008) confirm the position of the core, and so we are satisfied that identification of the host galaxy is correct.
G4Jy 1079 is an archetypal ‘triple’, with three distinct components in GLEAM (GLEAM J133351–100740, GLEAM J133419–100937, and GLEAM J133442–101114). It has an obvious core (Saripalli et al. Reference Saripalli, Mack, Klein, Strom and Singal1996), but this still coincides with two positions in the AllWISE catalogue [Figure 12(d)]. However, we find no reference to two galaxies in the literature (nor evidence in SuperCOSMOS), but Schilizzi (Reference Schilizzi1975) notes that the elliptical host resides in ‘a very red irregularly shaped envelope’. Therefore, the two AllWISE positions may be a consequence of fitting the host galaxy’s extended structure. Proceeding with the corresponding identification in 6dFGS (g1334186–100929, with  $z=0.084$
), we determine a physical size of 1.3 Mpc for G4Jy 1079.
$z=0.084$
), we determine a physical size of 1.3 Mpc for G4Jy 1079.
G4Jy 1279 (GLEAM J154851–321431 and GLEAM J154902–321811) is the re-started GRG also known as B1545–321 [Figure 12(e)]. Evidence for renewed AGN activity is provided by high-resolution ATCA images (Saripalli et al. Reference Saripalli, Subrahmanyan and Udaya Shankar2003), which show a pair of inner jets embedded within the older, outer radio lobes. They also show that neither of the two AllWISE sources closest to the centroid are correct and instead confirm the existing optical identification that we find in the literature (Jones & McAdam Reference Jones and McAdam1992; Simpson et al. Reference Simpson, Clements, Rawlings and Ward1993). We therefore manually update our choice of the host galaxy position accordingly.
Having cross-identified G4Jy 1282 (GLEAM J155120+200312, GLEAM J155147+200424, and GLEAM J155226+200556) as 3C 326 (Section 5.4 of Paper I), we refer to the literature for the host galaxy identification. Multi-frequency observations by Willis & Strom (Reference Willis and Strom1978) show evidence of a weak core between the two radio lobes, coincident with the southern memberFootnote d of a pair of galaxies at  $z = 0.0895$
(Smith et al. Reference Smith, Spinrad and Smith1976). With lobes separated by 19
$z = 0.0895$
(Smith et al. Reference Smith, Spinrad and Smith1976). With lobes separated by 19 ${\mathop .\limits^' }$
5, this means that G4Jy 1282 is 2 Mpc in size.
${\mathop .\limits^' }$
5, this means that G4Jy 1282 is 2 Mpc in size.
G4Jy 1525 (GLEAM J191905–795737 and GLEAM J191931–800128) is B1910–800. We agree with Subrahmanyan et al. (Reference Subrahmanyan, Saripalli and Hunstead1996) that the optical identification of Jones & McAdam (Reference Jones and McAdam1992) is incorrect, and that it should be the optically faint galaxy that is on-axis at the ‘neck’ of the SUMSS contours (connecting the two lobes). This host appears quite bright in the AllWISE image [Figure 4(e) of Paper I], and our host galaxy position agrees with the core position (Saripalli et al. Reference Saripalli, Hunstead, Subrahmanyan and Boyce2005). The source is at  $z=0.346$
(Subrahmanyan et al. Reference Subrahmanyan, Saripalli and Hunstead1996), meaning that this extended ‘double’ is 1.8 Mpc across.
$z=0.346$
(Subrahmanyan et al. Reference Subrahmanyan, Saripalli and Hunstead1996), meaning that this extended ‘double’ is 1.8 Mpc across.
The final GRG listed in Table 3 is G4Jy 1613, with distinct X-shaped morphology [Figure 4(e)], and so previously described in Section 4.4.1.
4.9. Unclassified, extended radio sources
In this section, we describe three sources that are difficult to classify, on account of their unusual morphology. To investigate further, they (along with 137 other G4Jy sources) will be followed up with MeerKAT (PI: White). This instrument has excellent sensitivity to diffuse emission at 1.3 GHz and will provide  ${\sim}5$
arcsec resolution images.
${\sim}5$
arcsec resolution images.
4.9.1. A radio lobe or cluster-related emission?
We note extended low-frequency emission near to GLEAM J140421–340018 [Figure 13(a)] that suggests that this is another case of identifying just one of the lobes of a powerful radio galaxy (cf. Appendix D.1 of Paper I). Whilst exploration of the surrounding region (using the full GLEAM mosaic, rather than a 1º cutout) shows no sign of a second radio lobe, there are hints of such a counterpart in a deep MWA observation. Further observations are needed to confirm this. Meanwhile, SUMSS emission for this GLEAM component appears in the catalogue of van Velzen et al. (Reference van Velzen, Falcke, Schellart, Nierstenhöfer and Kampert2012), where it has been associated with NGC 5419 (GLEAM J140338-335848,  $S_{\mathrm{151\,MHz}}=1.4$
Jy). However, the direction of the suggested lobe (with respect to NGC 5419) then appears to be incongruous with the extended emission in GLEAM.
$S_{\mathrm{151\,MHz}}=1.4$
Jy). However, the direction of the suggested lobe (with respect to NGC 5419) then appears to be incongruous with the extended emission in GLEAM.
Overlays for three G4Jy sources whose morphology we are unable to classify (Section 4.9). The datasets, contours, symbols, and beams are the same as those used for Figure 1. (a) G4Jy 1117. (b) G4Jy 113. (c) G4Jy 513.

Examples of G4Jy sources that have (relatively) faint mid-infrared hosts (Section 4.10). The datasets, contours, symbols, and beams are the same as those used for Figure 1, with AllWISE positions within 3 arcmin of the centroid (purple hexagon) indicated by green plus signs. (a) G4Jy 180. (b) G4Jy 877.
An alternative explanation is that GLEAM J140421–340018 is dominated by emission from a cluster relic, with nearby GLEAM components (GLEAM J140323–341020, GLEAM J140339–340430, GLEAM J140356–341616, GLEAM J140403–341304, and GLEAM J140420–340904) being associated emission from a cluster radio halo. See Subrahmanyan et al. (Reference Subrahmanyan, Beasley, Goss, Golap and Hunstead2003) for further discussion of this source (B1400–33) and an image of the radio emission at 330 MHz using the VLA.
Due to the difficulty in classifying GLEAM J140421–340018 (Johnston–Hollitt et al., in preparation), we label it as ‘complex’ (Section 3.1), treat it as single component in GLEAM (going by the source name G4Jy 1117), and do not provide a mid-infrared identification.
4.9.2. A possible GRG with ‘triple’ morphology
We treat G4Jy 113 (GLEAM J010241–215227) in the same way as G4Jy 1117, since understanding its morphology is also not straightforward [Figure 13(b)]. We find that it is located in cluster Abell 133, with Slee et al. (Reference Slee, Roy, Murgia, Andernach and Ehle2001) interpreting the steep spectrum radio emission as a cluster relic—like G4Jy 1605 (Section 4.5)—generated via merger shocks. They dismiss the suggestion by Rizza et al. (Reference Rizza, Loken, Bliton, Roettiger, Burns and Owen2000) that it is a remnant radio lobe, although this second interpretation is supported by Fujita et al. (Reference Fujita, Sarazin, Kempner, Rudnick, Slee, Roy, Andernach and Ehle2002), who use a combination of radio and X-ray observations to infer the energetics of the system.
Pursuing the idea that the radio emission originated from a radio galaxy, the next question concerns the location of the host. At the centre of Abell 133 is ESO 541-G013 (g0102418–215256 at  $z = 0.057$
), which coincides with compact radio emission. Rizza et al. (Reference Rizza, Loken, Bliton, Roettiger, Burns and Owen2000) see a bridge of emission that connects it with the extended emission (i.e. ‘lobe’) in the north, implying that ESO 541-G013 may be the former host galaxy. Meanwhile, Slee et al. (Reference Slee, Roy, Murgia, Andernach and Ehle2001) do not see this bridge in their observations.
$z = 0.057$
), which coincides with compact radio emission. Rizza et al. (Reference Rizza, Loken, Bliton, Roettiger, Burns and Owen2000) see a bridge of emission that connects it with the extended emission (i.e. ‘lobe’) in the north, implying that ESO 541-G013 may be the former host galaxy. Meanwhile, Slee et al. (Reference Slee, Roy, Murgia, Andernach and Ehle2001) do not see this bridge in their observations.
However, the radio images presented by Rizza et al. (Reference Rizza, Loken, Bliton, Roettiger, Burns and Owen2000) and Slee et al. (Reference Slee, Roy, Murgia, Andernach and Ehle2001) are at 1.4 GHz. The picture becomes more unusual when we consider the low-frequency morphology, as shown by the TGSS contours [Figure 1(b)]. If ‘triple’ is now the correct interpretation of this radio emission, then the radio galaxy is much more extended than previously thought, spanning 6 arcmin. In this scenario, GLEAM J010247–215651 (the southern lobe) is associated with GLEAM J010241–215227, and the host is likely the compact radio source, g0102453–215414 at  $z = 0.293$
[referred to as galaxy ‘J’ by Slee et al. (Reference Slee, Roy, Murgia, Andernach and Ehle2001) in their Figure 6]. This redshift corresponds to a linear scale of 263 kpc/arcmin (which would make G4Jy 113 a GRG), whilst the linear scale for the cluster in the foreground is 66 kpc/arcmin. The next question is why the southern lobe has a steeper spectral index than the northern lobe (as implied by the lack of NVSS emission for the southern lobe). Alternatively, each of the ‘segments’ of low-frequency emission could be connected to unrelated sources.
$z = 0.293$
[referred to as galaxy ‘J’ by Slee et al. (Reference Slee, Roy, Murgia, Andernach and Ehle2001) in their Figure 6]. This redshift corresponds to a linear scale of 263 kpc/arcmin (which would make G4Jy 113 a GRG), whilst the linear scale for the cluster in the foreground is 66 kpc/arcmin. The next question is why the southern lobe has a steeper spectral index than the northern lobe (as implied by the lack of NVSS emission for the southern lobe). Alternatively, each of the ‘segments’ of low-frequency emission could be connected to unrelated sources.
4.9.3. Cluster halo or a remnant radio galaxy?
The amorphous appearance of G4Jy 513 (GLEAM J045826–300717; PKS B0456–30), in cluster Abell 3297, leads us to label the morphology as ‘complex’ and the host flag as ‘u’ [Figure 13(c)]. Jones & McAdam (Reference Jones and McAdam1992) suggest that the extended emission could be a cluster halo, but they also report an identification (which we are unable to verify). Meanwhile, Yuan & Wang (Reference Yuan and Wang2012) estimate an upper limit for the core flux density ( ${<}6.7$
mJy at 5 GHz), so it is possible that the radio emission is associated with a radio galaxy that has become inactive. Also, we note the uniformity of the TGSS and NVSS contours and calculate that the spectral index between 151 and 1 400 MHz (‘G4Jy_NVSS_alpha’; see Section 6.6 of Paper I) is
${<}6.7$
mJy at 5 GHz), so it is possible that the radio emission is associated with a radio galaxy that has become inactive. Also, we note the uniformity of the TGSS and NVSS contours and calculate that the spectral index between 151 and 1 400 MHz (‘G4Jy_NVSS_alpha’; see Section 6.6 of Paper I) is  $-0.68\pm0.01$
.
$-0.68\pm0.01$
.
4.10. Sources with faint mid-infrared hosts
Hundred twenty-six G4Jy sources have been assigned ‘m’ for their host flag (Section 3.3), indicating that their radio position looks secure but no appropriate identification can be made using AllWISE. For example, 14 of these are sources where an AT20G detection indicates the location of the radio core, but the host galaxy is too faint in the mid-infrared to be characterised for the AllWISE catalogue (Figure 14). These radio sources are likely to be at high redshift, and we confirm that this is the case for, at least, G4Jy 180 (GLEAM J014127–270606; PKS B0139–273) at  $z = 1.440$
and G4Jy 877 (GLEAM J105132–202344; PKS B1049–201) at
$z = 1.440$
and G4Jy 877 (GLEAM J105132–202344; PKS B1049–201) at  $z = 1.116$
(McCarthy et al. Reference McCarthy, Kapahi, van Breugel, Persson, Athreya and Subrahmanya1996; Mahony et al. Reference Mahony2011).
$z = 1.116$
(McCarthy et al. Reference McCarthy, Kapahi, van Breugel, Persson, Athreya and Subrahmanya1996; Mahony et al. Reference Mahony2011).
As shown by Mahony et al. (Reference Mahony2011), the fraction of radio sources with an optical identification falls as the spectral index (which they measure between 5 and 20 GHz) steepens. This is thought to indicate the presence of a high-redshift population of ultra-steep spectrum sources ( $\alpha < -1.3$
), with numerous candidates (e.g. De Breuck et al. Reference De Breuck, van Breugel, Röttgering and Miley2000) being followed up spectroscopically to confirm this. Indeed, this is the method exploited by Saxena et al. (Reference Saxena2018), who use the combination of TGSS (150 MHz) and the VLA (1.4 GHz) to identify the highest redshift powerful radio galaxy known, at
$\alpha < -1.3$
), with numerous candidates (e.g. De Breuck et al. Reference De Breuck, van Breugel, Röttgering and Miley2000) being followed up spectroscopically to confirm this. Indeed, this is the method exploited by Saxena et al. (Reference Saxena2018), who use the combination of TGSS (150 MHz) and the VLA (1.4 GHz) to identify the highest redshift powerful radio galaxy known, at  $z = 5.72$
.
$z = 5.72$
.
In the search for high-redshift galaxies, an alternative to the method above (which relies on the radio spectral index) is to identify infrared-faint radio sources (IFRSs). These were first classified by Norris et al. (Reference Norris2006), with formal criteria for their selection put forward by Zinn, Middelberg, & Ibar (Reference Zinn, Middelberg and Ibar2011). The first of these criteria isolates sources with a high ratio of radio to mid-infrared flux density, whilst the second criterion aims to remove low-redshift, radio-loud AGN via a mid-infrared flux density cut. Most recently, Orenstein, Collier, & Norris (Reference Orenstein, Collier and Norris2019) have applied this method to the Unified Radio Catalogue (Kimball & Ivezić Reference Kimball and Ivezić2008, Reference Kimball, Ivezić, Mickaelian and D. B.2014), in combination with data from AllWISE (Cutri et al. Reference Cutri2013) and SDSS DR12 (Alam et al. Reference Alam2015). This allowed them to spectroscopically confirm 108 IFRSs, with the highest redshift IFRS being found at  $z = 4.387$
.
$z = 4.387$
.
Regarding the G4Jy Sample, we will provide existing redshift information, and analysis of multi-wavelength data, in the next paper (Paper III; White et al., in preparation). This will later be supplemented by new measurements from the Taipan Galaxy Survey (da Cunha et al. Reference da Cunha2017), which will provide optical spectroscopy over the entire southern hemisphere. In addition, we will use the Southern African Large Telescope to observe the optically fainter sources.
5. Additional literature checks
In the previous section, we highlighted some of the more unusual radio sources in the G4Jy Sample, some of which fall into multiple categories of interest. In this section, we record similar cross-checking against the literature, but for ‘normal’ radio galaxies, which compose the bulk of the sample. These checks have been the most time-consuming and labour-intensive step in our host galaxy identification but will hopefully prove to make the G4Jy catalogue (Section 6 of Paper I) a valuable resource for: (i) multi-wavelength studies of AGN across the southern sky and (ii) assessing the performance of automated/machine learning algorithms for cross-identification.
5.1. Radio galaxies requiring further work
G4Jy 14 (GLEAM J000707+053607) has two mid-infrared sources at a similar distance from the centroid position, both of which are plausible candidates for hosting the ‘double’ radio emission. The radio lobes appear in FIRST but there is no detection of the core. Therefore, we are unable to resolve the ambiguity as to the host and so set the host flag to ‘u’ (Section 3.3).
We use FIRST to confirm that G4Jy 22 (GLEAM J001310+ 005139) is a ‘double’ and that we have correctly identified the host galaxy. However, the morphology is unresolved in our overlays, so we label the source as a ‘single’ for consistency.
An overlay for G4Jy 40 (Section 5.1). The datasets, contours, symbols, and beams are the same as those used for Figure 1. In addition, positions from AllWISE are indicated by green plus signs, with that corresponding to the host galaxy highlighted in white. The cyan contours are from a 4.7-GHz image (Reid et al. Reference Reid, Kronberg and Perley1999) that is believed to have incorrect coordinates (see footnote e).

‘Double’ morphology is evident in the TGSS contours for G4Jy 23 (GLEAM J001356–091952), which is also known as PKS B0011–096. Reid, Kronberg, & Perley (Reference Reid, Kronberg and Perley1999) present a 4.7-GHz image that distinguishes the lobes, but it is a FIRST image that confirms that the bright mid-infrared source nearest to the GLEAM position is the host.
Our radio contours for GLEAM J002056–190853 and GLEAM J002112–191041, in combination with the optically bright source (g0021075–191006 in 6dFGS) lying between them, give the impression that these two GLEAM components are the lobes of an extended radio galaxy. This is the interpretation of, for example, Nilsson (Reference Nilsson1998), who base their largest angular size measurement (of 252 arcsec) on the radio map of Schilizzi & McAdam (Reference Schilizzi and McAdam1975). However, this source (G4Jy 40; PKS B0018–19) is shown at 4.7 GHz (Reid et al. Reference Reid, Kronberg and Perley1999) to have ‘triple’ morphology that spans  ${\sim}160$
arcsec from lobe to lobe (Figure 15). Our investigation is complicated by some of the images from Reid et al. (Reference Reid, Kronberg and Perley1999) (the one for PKS B0018–19 included) appearing to have incorrect coordinates, offset in different directions with respect to the J2000 reference frame.Footnote e We assume that the south-eastern hotspot at 4.7 GHz should actually coincide with the NVSS component 002113–191043, which is supported by the location of polarised emission shown for ‘01-04’ in Appendix A of Riseley et al. (Reference Riseley2018). On this basis, the core then aligns with the 6dFGS source and so we provide AllWISE J002107.53–191005.4 as the mid-infrared identification in AllWISE. This is in agreement with the host galaxy identification for PKS B0018–19 in the literature (see SIMBADFootnote f). In addition, until a high-resolution radio image with a large field of view becomes available, we regard GLEAM J002056–190853 as unassociated with G4Jy 40.
${\sim}160$
arcsec from lobe to lobe (Figure 15). Our investigation is complicated by some of the images from Reid et al. (Reference Reid, Kronberg and Perley1999) (the one for PKS B0018–19 included) appearing to have incorrect coordinates, offset in different directions with respect to the J2000 reference frame.Footnote e We assume that the south-eastern hotspot at 4.7 GHz should actually coincide with the NVSS component 002113–191043, which is supported by the location of polarised emission shown for ‘01-04’ in Appendix A of Riseley et al. (Reference Riseley2018). On this basis, the core then aligns with the 6dFGS source and so we provide AllWISE J002107.53–191005.4 as the mid-infrared identification in AllWISE. This is in agreement with the host galaxy identification for PKS B0018–19 in the literature (see SIMBADFootnote f). In addition, until a high-resolution radio image with a large field of view becomes available, we regard GLEAM J002056–190853 as unassociated with G4Jy 40.
G4Jy 61 (GLEAM J003354–073019) is PKS B0031–07, and we update our choice of AllWISE host in agreement with Sadler et al. (Reference Sadler, Chhetri, Morgan, Mahony, Jarrett and Tingay2019). Although further from the centroid (which may be influenced by Doppler boosting), this host galaxy is closer to the midpoint between the two NVSS components.
A ‘triple’ morphology in FIRST confirms that, for G4Jy 62 (GLEAM J003419+011851), the mid-infrared source closest to the centroid is the host galaxy. However, the FIRST image also reveals that the northernmost TGSS position marks the host of an unrelated ‘double’. As such, we update the confusion flag for G4Jy 62 to ‘1’.
The spatial resolution of the radio images makes it difficult to determine whether G4Jy 68 (GLEAM J003744+131953) should be labelled ‘single’ or ‘double’. As a result, there is ambiguity as to which mid-infrared source is the correct host galaxy. However, this source appears in the 3CRR catalogue as 3C 16 (a ‘double’) and was observed at 0.75 arcsec resolution by Gilbert et al. (Reference Gilbert, Riley, Hardcastle, Croston, Pooley and Alexander2004). They show the position of the radio core, allowing us to identify the appropriate mid-infrared host.
The radio core is visible in the FIRST image for G4Jy 72 (GLEAM J003918+031947) and confirms that the AllWISE position closest to the centroid is the correct selection.
The 6dFGS source (g0046050–633319) appears to be the host galaxy of G4Jy 84 (GLEAM J004601–633348) but there is another AllWISE candidate, which is on the radio axis of the ‘double’ and a similar distance from the centroid. As we cannot find a high-resolution image in the literature to confirm the host, we leave the host flag as ‘u’.
G4Jy 121 (GLEAM J010556+062814) is 4C +06.06, and we update the AllWISE position to that lying on-axis between the two TGSS and NVSS detections.
A radio map at 4.9 GHz (Bondi et al. Reference Bondi, Gregorini, Padrielli and Parma1993) allows us to identify the host galaxy for G4Jy 224 (GLEAM J020704+293059). This source is 3C 59 (4C +29.06), with very asymmetric morphology [Figure 16(a)] and a pronounced hotspot where the eastern lobe terminates.
G4Jy 285 (GLEAM J024103+084523 and GLEAM J024107+084452) is NGC 1044 (4C +08.11). We use a 1.4-GHz radio image by Croston et al. (Reference Croston, Hardcastle, Birkinshaw, Worrall and Laing2008) to confirm that we have correctly identified the host galaxy (Figure 17), which is in agreement with van Velzen et al. (Reference van Velzen, Falcke, Schellart, Nierstenhöfer and Kampert2012). We also note the interesting ‘zig-zag’ of emission seen in the southern jet/lobe and how the GLEAM contours trace trailing emission towards both the south and the north. In particular, there is fainter low-frequency emission (GLEAM J024133+084940) towards the north-east. It is unclear whether or not this is associated with G4Jy 285, so we do not consider it further.
G4Jy 287 (GLEAM J024236-420133) appears in the Molonglo Southern 4-Jy sample (MS4; Burgess & Hunstead Reference Burgess and Hunstead2006a) as B0240–422, and we agree with Burgess & Hunstead (Reference Burgess and Hunstead2006b) as to the host galaxy identification. We therefore update the chosen AllWISE source to the one lying roughly midway between the two TGSS detections.
TGSS indicates that G4Jy 298 (GLEAM J025102+061207) is a double, and we update the AllWISE position appropriately.
There are two good mid-infrared candidates for the host galaxy of G4Jy 311 (GLEAM J025552–202743), which is PKS B0253–206. Reid et al. (Reference Reid, Kronberg and Perley1999) present an image at 4.7 GHz, but it only shows the terminals of two lobes, and not the radio core. Being unable to resolve the ambiguity, we set the host flag to ‘u’.
We cannot find a high-resolution radio image of G4Jy 318 (GLEAM J030115–250538 and GLEAM J030127–250354) in the literature, and so are uncertain as to the host galaxy identification [Figure 8(c) of Paper I]. Hence, we use ‘u’ for the host flag.
G4Jy 338 (GLEAM J031605–265906) coincides with a crowded field in the mid-infrared. We could find no confirmation of the host in the literature, so set the host flag to ‘u’.
There is a trail of mid-infrared sources along the radio axis for G4Jy 350 (GLEAM J032318–881613). With no high-resolution radio image to discriminate between them, we use ‘u’ for the host flag. Like for G4Jy 311, the image of G4Jy 376 (GLEAM J034048–340851) by Reid et al. (Reference Reid, Kronberg and Perley1999) shows the hotspots but no detection of the core (see footnote e). We leave the host flag as ‘u’, as there are two good candidates for the host galaxy in the AllWISE image.
G4Jy 392 (GLEAM J035231–071103) is 3C 94, with Reid et al. (Reference Reid, Kronberg and Perley1999) confirming (see footnote e) that the AT20G detection is of a hotspot (belonging to a ‘double’) and not of a core (belonging to a head-tail galaxy). We therefore update the host galaxy position to that of the bright mid-infrared source located between the two NVSS detections [Figure 16(b)].
Overlays for a few of the G4Jy sources that are subject to further checks against the literature (Section 5.1). The datasets, contours, symbols, and beams are the same as those used for Figure 1, but where blue contours, crosses, and ellipses correspond to NVSS or SUMSS. In addition, positions from AllWISE are indicated by green plus signs, with that corresponding to the host galaxy highlighted in white. (a) G4Jy 224. (b) G4Jy 392. (c) G4Jy 499. (d) G4Jy 680. (e) G4Jy 886. (f) G4Jy 1003.
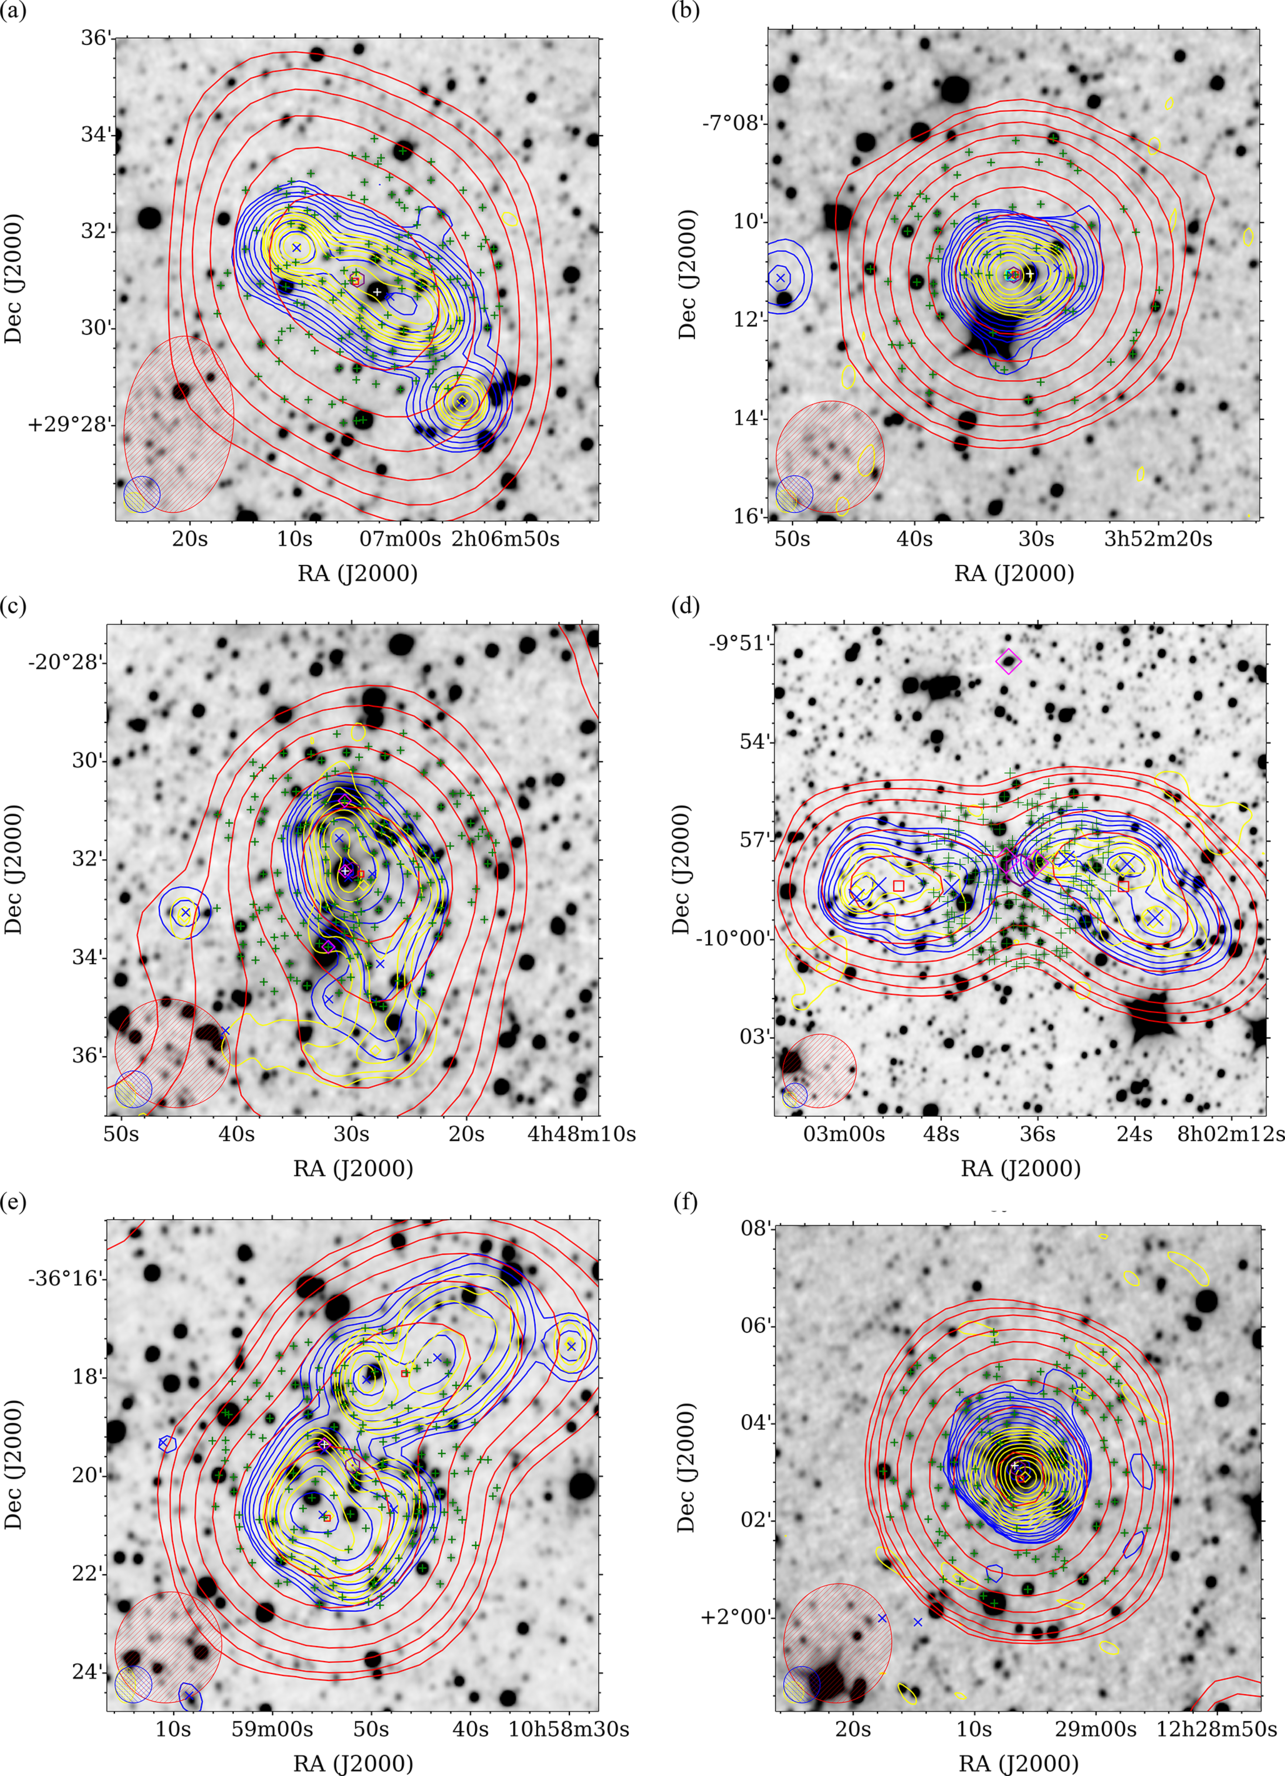
Two overlays for G4Jy 285, which is NGC 1044 (Section 5.1). The first overlay, (a), uses the same datasets, contours, symbols, and beams as those used for Figure 1. The second overlay, (b), uses an optical image from SuperCOSMOS (inverted greyscale) and a 1.4-GHz image (cyan contours) from Croston et al. (Reference Croston, Hardcastle, Birkinshaw, Worrall and Laing2008), provided courtesy of Judith Croston. TGSS contours (in yellow) are shown for both overlays, and positions from AllWISE are indicated by green plus signs, with that corresponding to the host galaxy highlighted in white.

The AllWISE source at the centroid position and the one slightly south of the TGSS position are both good host galaxy candidates for G4Jy 413 (GLEAM J040700–315210). This is PKS B0405–320, but no high-resolution image is available so that we can check the core position.
G4Jy 414 (GLEAM J040712+034318 and GLEAM J040724+034049) has several candidate host galaxies in the mid-infrared image. However, it is also known as 3C 105, which leads us to previous observations of the core (Baum et al. Reference Baum, Heckman, Bridle, van Breugel and Miley1988; Leahy et al. 1997). These allow us to manually select the correct host galaxy and so update the mid-infrared position for this source.
G4Jy 434 (GLEAM J041508–292901) is PKS B0413–296, and a 4.9-GHz image by Kapahi et al. (Reference Kapahi, Athreya, Subrahmanya, Baker, Hunstead, McCarthy and van Breugel1998) shows that this is a very asymmetric ‘double’. We update our host galaxy position, selecting the AllWISE source that is consistent with the core position.
G4Jy 441 (GLEAM J042020+151659) is 4C +15.13, but no high-resolution image is available. Extension in the TGSS contours could be because this is a head-tail galaxy, in which case the AllWISE source coincident with the TGSS position is the host. Alternatively, G4Jy 441 could be a ‘double’, with a host galaxy lying between the two NVSS detections but too faint to appear in AllWISE. Hence, we set the host flag to ‘u’.
A 1.4-GHz image by Kapahi et al. (Reference Kapahi, Athreya, Subrahmanya, Baker, Hunstead, McCarthy and van Breugel1998) allows us to confirm that the host galaxy of G4Jy 448 (GLEAM J042234–261700; PKS B0420–26) is the AllWISE source closest to the centroid position.
G4Jy 488 (GLEAM J044111+251845) is 4C +25.15, but we did not find a high-resolution radio image in the literature. Although AllWISE J044111.01+251839.6 is the likely host, it is blended with another AllWISE source, so we use ‘u’ for the host flag.
A 4.8-GHz image by Antonucci (Reference Antonucci1985) and a core position quoted by Ekers et al. (Reference Ekers1989) allow us to confirm that the central 6dFGS source (g0448306–203214) is the host of G4Jy 499 (GLEAM J044829–203217; PKS B0446–20). It is unclear how much of the extended emission is associated with the ‘double’ [Figure 16(c)], so we leave the morphology label as ‘complex’.
G4Jy 530 (GLEAM J051250–482358) is PKS B0511–48. Whilst Smith & Robertson (Reference Smith and Robertson1985) are likely correct in their optical identification, their radio image is not of sufficient resolution to rule out another mid-infrared source that is also on-axis. We could not find a better image in the literature and so set the host flag to ‘u’.
For G4Jy 570 (GLEAM J054049–614233; B0540–617), the nearest AllWISE detection to the centroid appears to be incorrect. Given the ‘pinching’ of the radio contours associated with the southern lobe, we are happy to update the host galaxy position so that it is in agreement with the optical identification provided by Jones & McAdam (Reference Jones and McAdam1992).
G4Jy 580 (GLEAM J054924–405110) is in the MS4 sample (Burgess & Hunstead Reference Burgess and Hunstead2006a, Reference Burgess and Hunstead2006b) and we agree with their identification. The latter is supported by an ATCA image, indicating that the AT20G detection corresponds to a hotspot in the north-west lobe.
The extended radio galaxy G4Jy 680 (GLEAM J080225–095823 and GLEAM J080253–095822) has several mid-infrared sources that could be interpreted as the host galaxy [Figure 4(d)]. Previous identifications for this source—referred to as B0800–09—focus on optical data at the two positions indicated by 6dFGS detections (immediately east and west of the centroid). Namely, Danziger & Goss (Reference Danziger and Goss1983) quote both the identification favoured by Schilizzi (Reference Schilizzi1975)—g0802363–095740 in 6dFGS, at  $z = 0.0699$
—and the alternative host galaxy at
$z = 0.0699$
—and the alternative host galaxy at  $z = 0.0865$
(g0802400–095735 in 6dFGS, at
$z = 0.0865$
(g0802400–095735 in 6dFGS, at  $z = 0.0858$
). There is no obvious core in NVSS nor coverage by FIRST which may have allowed us to resolve the ambiguity or indeed reveal that an obscured galaxy is the true host. As such, we retain the ‘u’ host flag, as originally assigned.
$z = 0.0858$
). There is no obvious core in NVSS nor coverage by FIRST which may have allowed us to resolve the ambiguity or indeed reveal that an obscured galaxy is the true host. As such, we retain the ‘u’ host flag, as originally assigned.
A FIRST image suggests that G4Jy 727 (GLEAM J084356+154738) is a compact ‘double’, with a host position that is offset from the nearest AllWISE source. As the host is not seen in the mid-infrared image, we set the host flag to ‘m’.
We use a 4.9-GHz image (Morganti et al. Reference Morganti, Killeen and Tadhunter1993) to confirm the host galaxy for G4Jy 747 (GLEAM J090147–255516; B0859–25). Their image also indicates that the AT20G detection (seen in our overlay) is the result of a hotspot.
G4Jy 767 (GLEAM J092158+082850) and G4Jy 810 (GLEAM J100028+140134) both have a ‘double’ morphology in FIRST, with these FIRST images supporting our host galaxy identifications.
At 4.7 GHz (Reid et al. Reference Reid, Kronberg and Perley1999) (see footnote e), we see that the 6dFGS source, g1013297–283126, is indeed the host galaxy of G4Jy 829 (GLEAM J101329–283118). This source is also known as PKS B1011–282, and we suggest that it is a ‘double-double’ radio galaxy, with inner jets and only the southern outer lobe seen in the 4.7-GHz image (Figure 18). The northern outer lobe may be resolved out or simply too faint to be detected at this high frequency.
G4Jy 844 (GLEAM J102529–021739) has two host galaxy candidates very close to the centroid position. However, this source has a ‘double’ morphology in FIRST, which allows us to select the western AllWISE source.
An overlay for G4Jy 829 (Section 5.1), where the datasets, contours, and symbols are the same as those used for Figure 1. In addition, positions from AllWISE are indicated by green plus signs (with the host galaxy highlighted in white) and the cyan contours are from a 4.7-GHz image (Reid et al. Reference Reid, Kronberg and Perley1999).

Two overlays for G4Jy 990, using the same datasets, contours, symbols, and beams as those used for Figure 1. In (a), the mirrored, blue contours either side of the source are believed to be artefacts in NVSS (1 deg overlay for G4Jy 990; Section 5.1). In (b), positions from AllWISE are indicated by green plus signs, with that corresponding to the host galaxy highlighted in white (12 arcmin overlay for G4Jy 990).

Similarly, ‘triple’ morphology in FIRST allows us to confirm the host galaxy for G4Jy 884 (GLEAM J105817+195203).
Further investigation was also carried out for G4Jy 886 (GLEAM J105846–361754 and GLEAM J105854–362051), in order to check that the 6dFGS source close to the centroid [Figure 16(e)] is the correct host galaxy. The position for this optical identification (g1058548–361921 at  $z = 0.0705$
) is confirmed by the coincidence of the elliptical galaxy with a weak radio core (B1056–360 in Ekers et al. Reference Ekers1989). FIRST shows that G4Jy 888 (GLEAM J110203–011619) has a ‘double’ morphology, allowing us to confirm that the AllWISE source closest to the centroid position is the host galaxy. The AT20G detection coincides with a neighbouring AllWISE source, so it likely marks either the core of an unrelated radio source or a hotspot belonging to G4Jy 888.
$z = 0.0705$
) is confirmed by the coincidence of the elliptical galaxy with a weak radio core (B1056–360 in Ekers et al. Reference Ekers1989). FIRST shows that G4Jy 888 (GLEAM J110203–011619) has a ‘double’ morphology, allowing us to confirm that the AllWISE source closest to the centroid position is the host galaxy. The AT20G detection coincides with a neighbouring AllWISE source, so it likely marks either the core of an unrelated radio source or a hotspot belonging to G4Jy 888.
G4Jy 917 (GLEAM J112554–352321; B1123–351) has a dense field of mid-infrared sources, and this being cluster AS 665. We confirm the position of the radio core based upon a 4.9-GHz image presented by Ekers et al. (Reference Ekers1989). As a result, we agree that the host galaxy of this radio source is ESO 377–G046 (g1125529–352340), and that the identification by van Velzen et al. (Reference van Velzen, Falcke, Schellart, Nierstenhöfer and Kampert2012) is consistent with the original optical identification (Bolton, Clarke, & Ekers Reference Bolton, Clarke and Ekers1965).
For G4Jy 934 (GLEAM J113917–322237; PKS B1136–32), we dismiss the AllWISE source that is coincident with the centroid position and instead select the AllWISE source that is further north along the radio axis. This host galaxy identification is in agreement with the MS4 identification (Burgess & Hunstead Reference Burgess and Hunstead2006b), which itself is based upon imaging of the possible core (Duncan & Sproats Reference Duncan and Sproats1992).
We set ‘u’ as the host flag for G4Jy 939 (GLEAM J114134–285050) as we are unable to find a high-resolution image to distinguish between multiple mid-infrared candidates close to the centroid.
The 1º overlay for G4Jy 990 (GLEAM J121915+054929 and GLEAM J121933+054944) shows mirrored, extended, NVSS emission, which we deem to be artefacts [Figure 19(a)]. This source is 3C 270 (NGC 4261), for which our AllWISE identification [Figure 19(b)] is in agreement with the core position (Morganti et al. Reference Morganti, Killeen and Tadhunter1993).
G4Jy 1001 (GLEAM J122811+202321) shows ‘triple’ morphology in FIRST and we update the AllWISE position to that coincident with the radio core.
The AllWISE source nearest to the centroid position for G4Jy 1003 (GLEAM J122906+020251) may appear to be a star—given the strong diffraction spikes in the mid-infrared image [Figure 16(f)]—but it is actually the optically brightest quasar in the sky, 3C 273. This AllWISE position is in agreement with abundant literature (see NED) as to the radio core/host galaxy location.
G4Jy 1021 (GLEAM J124602+255359 and GLEAM J124612+255337) shows ‘triple’ morphology in FIRST. As such, despite the density of mid-infrared sources [Figure 8(f) of Paper I], we are able to identify the host galaxy.
G4Jy 1040 (GLEAM J125722–302142) is in the cluster Abell 3532 (of the A3528-A3530-A3532 merging complex), and the 2.4-GHz image provided by Venturi et al. (Reference Venturi, Bardelli, Zambelli, Morganti and Hunstead2001) allows us to confirm that g1257219–302149 is the host galaxy (Figure 20).
Two overlays for G4Jy 1040 (Section 5.1), the first of which, (a), uses the same datasets, contours, symbols, and beams as those used for Figure 1. The second overlay, (b), is a zoomed-in version that also uses a 2.4-GHz image (Venturi et al. Reference Venturi, Bardelli, Zambelli, Morganti and Hunstead2001; cyan contours) provided courtesy of Tiziana Venturi. Positions from AllWISE are indicated by green plus signs, with that corresponding to the host galaxy highlighted in white.

Overlays for two more G4Jy sources that are subject to further checks against the literature (Section 5.1). The datasets, contours, symbols, and beams are the same as those used for Figure 1. In addition, positions from AllWISE are indicated by green plus signs, with that corresponding to the host galaxy highlighted in white. (a) G4Jy 1216. (b) G4Jy 1265.

FIRST reveals a ‘double’ morphology for G4Jy 1099 (GLEAM J135209–054345) and so we can confirm that we have correctly identified the host galaxy in AllWISE.
For G4Jy 1158 (GLEAM J142432–491344; PKS B1421–490), there are two candidate mid-infrared hosts close to the centroid position. We resolve this ambiguity by consulting Godfrey et al. (Reference Godfrey2009), whose 20.2-GHz image confirms the position of the core, and therefore the host galaxy. Their image also suggests that the AT20G detection marks a hotspot.
G4Jy 1539 (Section 5.1), as it appears (a) in the overlay used for visual inspection, and (b) in NVSS (inverted greyscale). The overlay uses the same datasets, contours, symbols, and beams as those used for Figure 1.

We set ‘m’ as the host flag for G4Jy 1160 (GLEAM J142457+200021) as the nearest AllWISE detection appears to be a blend in the mid-infrared image, with a 4 arcsec offset between the AllWISE position and the coincident radio positions from multiple surveys. A similar scenario is seen for G4Jy 1167 (GLEAM J142740+283327), but in this case the offset is 7 arcsec. Again, the host flag is ‘m’.
G4Jy 1180 (GLEAM J143719–075339) is PKS B1434–076. A 4.7-GHz image (Reid et al. Reference Reid, Kronberg and Perley1999) shows ‘triple’ morphology (see footnote e) and confirms that the AllWISE position between the two TGSS detections is the host of the radio emission.
G4Jy 1190 (GLEAM J144635–084544) is PKS B1443–085 in cluster Abell 1964. We consult Owen et al. (Reference Owen, White and Burns1992) but the morphology and host galaxy are still unclear in their 1.5-GHz image. We therefore assign the source the ‘complex’ morphology label and ‘u’ as the host flag.
‘Triple’ morphology is seen at 4.7 GHz (Reid et al. Reference Reid, Kronberg and Perley1999) for G4Jy 1209 (GLEAM J145555–110856; PKS B1453–10). This allows us to update our host galaxy identification, which is in agreement with the core position (see footnote e). The image also indicates that AT20G has detected a hotspot in the southern lobe.
There are several mid-infrared sources close to the centroid position for G4Jy 1216 [GLEAM J150459+260027; Figure 21(a)] and so we originally assigned this object ‘u’ for the host flag. However, previous observations of this source (also known as 3C 310 in 3CRR) allow us to identify the correct mid-infrared host. That is, Burns & Owen (Reference Burns and Owen1979) show that the radio core coincides with the western source of a galaxy pair, at  $z=0.054$
. Therefore, the lobe-to-lobe separation of 5
$z=0.054$
. Therefore, the lobe-to-lobe separation of 5 ${\mathop .\limits^' }$
1 corresponds to a physical size of 322 kpc.
${\mathop .\limits^' }$
1 corresponds to a physical size of 322 kpc.
In the case of G4Jy 1265 (GLEAM J153137+240542 and GLEAM J153150+240244), the candidate host galaxies are relatively far from the centroid position [Figure 21(b)]. As to which one is the correct cross-identification, we note that this radio source (3C 321 in 3CRR) has an optical position provided by Jenkins, Pooley, & Riley (Reference Jenkins, Pooley and Riley1977). This is spectroscopically confirmed by de Grijp et al. (Reference de Grijp, Keel, Miley, Goudfrooij and Lub1992), and the acquired redshift of  $z=0.096$
means that G4Jy 1265 (spanning 5
$z=0.096$
means that G4Jy 1265 (spanning 5 ${\mathop .\limits^' }$
1 in angular size) extends over 544 kpc.
${\mathop .\limits^' }$
1 in angular size) extends over 544 kpc.
G4Jy 1323 (GLEAM J162021+173623) is in the 3CRR sample, as 3C 334, and has ‘triple’ morphology at the resolution provided by FIRST. The bright mid-infrared source near the centroid is its host galaxy, as confirmed by the location of the core.
We set the host flag for G4Jy 1324 (GLEAM J162033–710017) to ‘u’, as there are two good candidates for the host galaxy but no high-resolution image to confirm the correct one.
G4Jy 1332 (GLEAM J162439+234512) has ‘double’ morphology in FIRST that supports our host galaxy identification.
A FIRST image confirms that G4Jy 1338 (GLEAM J162732+211224) is a point source that unrelated to the faint ‘double’ towards the north-west.
G4Jy 1365 (GLEAM J164604–222756) is PKS B1643–22 and it is unclear which of two AllWISE positions marks the host galaxy. We have checked against the literature but cannot find a high-resolution image to resolve the ambiguity (hence, setting ‘u’ as the host flag). The AT20G detection could be the radio core of the northern candidate or a hotspot associated with the southern candidate.
For G4Jy 1377 (GLEAM J165712–134911), the AllWISE position nearest to the centroid may be the host galaxy, but its offset from the radio axis prompts further investigation. It is PKS B1654–137 and we find no high-resolution image in the literature. Due to the possibility that there is a faint mid-infrared host that is on-axis, we set the host flag to ‘u’.
G4Jy 1402 (GLEAM J172031–005845) is 3C 353 (B1717–00). We use the image presented by Morganti et al. (Reference Morganti, Killeen and Tadhunter1993) to confirm that the 6dFGS source is the host galaxy.
G4Jy 1438 (GLEAM J174630+234252) is 4C +23.45. Although AllWISE J174631.15+234325.9 is likely the host galaxy, midway between the two NVSS detections, we have no better resolution radio image to confirm this. The host flag is therefore set to ‘u’.
Our host galaxy identification for G4Jy 1478 (GLEAM J182220–554148) is updated to the AllWISE source midway between the two SUMSS components of this ‘double’. This source is also known as PKS B1818–557, and our selection is in agreement with Burgess & Hunstead (Reference Burgess and Hunstead2006b).
It is unclear whether G4Jy 1491 (GLEAM J183356–394023; PKS B1830–39) has head-tail, ‘double’ or core-jet morphology. With no better resolution radio image available in the literature, we label the morphology ‘complex’ and use ‘u’ for the host flag.
G4Jy 1499 (GLEAM J183825+171154) is 3C 386 in the 3CRR sample. We use an image of the core presented by Leahy & Perley (Reference Leahy and Perley1991) to confirm our identification in AllWISE.
G4Jy 1537 (GLEAM J192606–573954) is B1921–577. The nearest AllWISE source to the centroid is AllWISE J192608.47–574004.1, which is the  $b_J = 19$
mag galaxy mentioned by Jones & McAdam (Reference Jones and McAdam1992). However, they also note a
$b_J = 19$
mag galaxy mentioned by Jones & McAdam (Reference Jones and McAdam1992). However, they also note a  $b_J = 16.5$
mag galaxy further to the west, and observations at 1.4 GHz (Jones Reference Jones1992) show that the radio lobes are emanating from this position. Therefore, we update the mid-infrared identification accordingly (to AllWISE J192605.75–574016.4) and note that it coincides with a detection in 6dFGS.
$b_J = 16.5$
mag galaxy further to the west, and observations at 1.4 GHz (Jones Reference Jones1992) show that the radio lobes are emanating from this position. Therefore, we update the mid-infrared identification accordingly (to AllWISE J192605.75–574016.4) and note that it coincides with a detection in 6dFGS.
It is unclear whether the host for G4Jy 1539 (GLEAM J192655–391741) is significantly offset from the centroid position or too faint to be seen in the mid-infrared image. We therefore set the host flag to ‘u’. For the morphology label we use ‘complex’, as we cannot determine whether nearby extended emission is associated with the source or connected to artefacts in NVSS. Due to some of these artefacts having negative flux density, their unusual chromosome-like morphology is only seen in the full NVSS image rather than the contours (Figure 22).
G4Jy 1540 (GLEAM J192724–225842) has two host galaxy candidates close to the centroid that are both approximately on the radio axis. We check this source against the literature but cannot find a radio image to resolve the ambiguity, so leave the host flag as ‘u’.
An ATCA image by Burgess & Hunstead (Reference Burgess and Hunstead2006b) indicates that the AT20G detection associated with G4Jy 1558 (GLEAM J193557–462040; B1932–464) is due to a hotspot, and not the core. We update the AllWISE host galaxy accordingly, where it is now further from the centroid and in agreement with the MS4 identification.
G4Jy 1590 (GLEAM J195817–550934) is B1954–55, for which Morganti et al. (Reference Morganti, Oosterloo, Tadhunter, Aiudi, Jones and Villar-Martin1999) present a 8.6-GHz ATCA image that clearly distinguishes two lobes and a core (i.e. ‘triple’ morphology). The nearest AllWISE position (AllWISE J195816.66–550934.9) to the core is offset by  ${\sim}3$
arcsec and, as we discover via SIMBAD, is a star (UCAC2 7908216). As this star is obscuring the mid-infrared host of G4Jy 1590, we set the host flag to ‘m’.
${\sim}3$
arcsec and, as we discover via SIMBAD, is a star (UCAC2 7908216). As this star is obscuring the mid-infrared host of G4Jy 1590, we set the host flag to ‘m’.
G4Jy 1617 (GLEAM J202336+170057 and GLEAM J202343+170549) is 4C +16.68. There is no high-resolution radio image in the literature to confirm the host galaxy, so we leave the host flag as ‘u’.
We use 1.4-GHz observations by Worrall & Birkinshaw (Reference Worrall and Birkinshaw2014) to confirm the host galaxies for G4Jy 1677 and G4Jy 1678, which were re-fitted for the G4Jy catalogue (Appendix D.3 of Paper I). They are both in cluster Abell 3744 and also known as NGC 7016 and NGC 7018, respectively. At the high resolution provided by the VLA in ‘A’-array configuration, the northern jet of G4Jy 1677 is seen to loop back onto itself. Meanwhile, observations in ‘C’-array configuration (Bicknell, Cameron, & Gingold Reference Bicknell, Cameron and Gingold1990) allow more extended emission to be detected, which reveals long ‘tendrils’ associated with both G4Jy 1677 and G4Jy 1678. The tendrils of the northern source are also seen in the GLEAM contours, thanks to the MWA’s sensitivity to diffuse emission.
G4Jy 1694 (GLEAM J212616–552112) appears in the MS4 sample as B2122–555, with ‘triple’ morphology seen in an ATCA image (Burgess & Hunstead Reference Burgess and Hunstead2006b). The AT20G position in our overlay coincides with the northern lobe, implying that it marks a hotspot. Meanwhile, the core position allows us to distinguish between two host galaxy candidates in AllWISE that lie between the two SUMSS positions. As ‘double’ morphology is not clear in the SUMSS contours, we label G4Jy 1694 as ‘single’.
The ‘double’ radio galaxy, G4Jy 1773 (GLEAM J222106–501818), is B2217–505. We update the AllWISE identification to a source that is slightly further from the centroid position, but coincident with the TGSS detection and on the SUMSS radio axis. This source is also consistent with the optical identification provided by McAdam (1992).
Another MS4 source is G4Jy 1795 (GLEAM J225303–405744; B2250–412), which shows ‘double’ morphology when observed with ATCA (Burgess & Hunstead Reference Burgess and Hunstead2006b). Again, AT20G marks a hotspot, and our AllWISE host galaxy is in agreement with the MS4 identification.
5.2. Possible disagreement with the existing host galaxy identification
G4Jy 453 (GLEAM J042358–724601) appears in the literature as B0424–728, and the nearest mid-infrared source to its centroid (AllWISE J042357.45–724602.0) is coincident with the optical identification noted by Jones & McAdam (Reference Jones and McAdam1992). The interpretation of this source as a GRG (e.g. Subrahmanyan et al. Reference Subrahmanyan, Saripalli and Hunstead1996) relies on the corresponding redshift. However, a third SUMSS detection suggests that the core of this radio galaxy may actually be at/near R.A. = 04:24:00.42, Dec. =–72:45:31.8 (J2000), north-east of the previous identification [see Figure 23(a)]. Due to this inconsistency, and the density of mid-infrared candidates, we are uncertain as to the true host galaxy position and so specify ‘u’ for the host flag.
Overlays for G4Jy sources for which there is doubt (Section 5.2) over the existing host galaxy identification in the literature (orange plus signs). The datasets, contours, symbols, and beams are the same as those used for Figure 1, but where blue contours, crosses, and ellipses correspond to NVSS or SUMSS. AllWISE positions within 3 arcmin of the centroid (purple hexagon) are indicated by green plus signs, and for G4Jy 700 and G4Jy 1582 we plot (in cyan) 4.9-GHz and 300-MHz contours, respectively, using VLA images provided courtesy of Francesco Massaro (Massaro et al. Reference Massaro2012). (a) G4Jy 453. (b) G4Jy 641. (c) G4Jy 700. (d) G4Jy 1582.
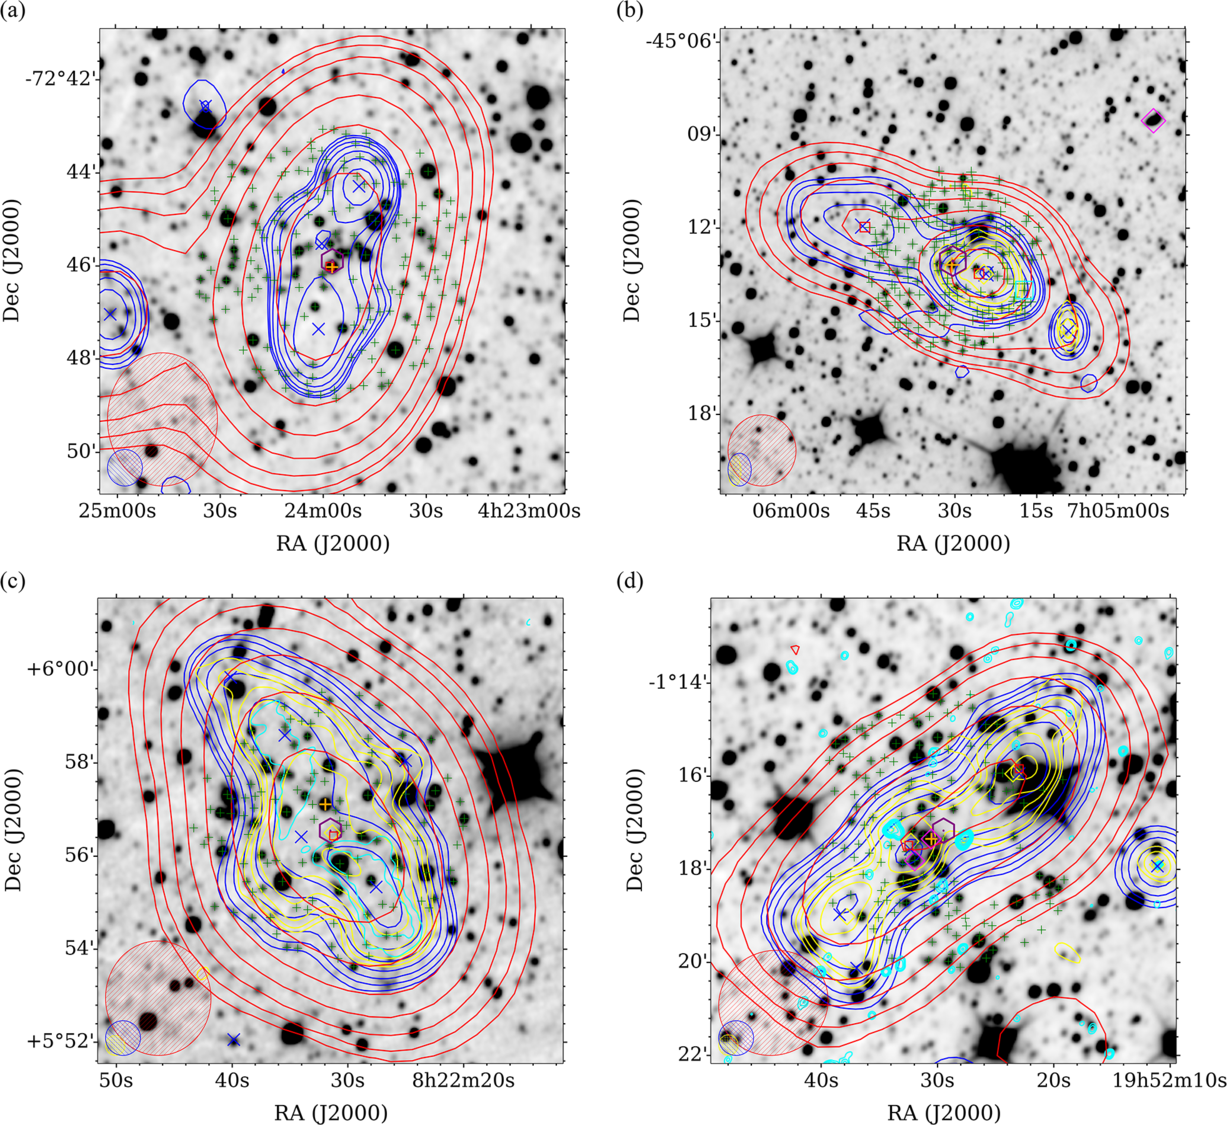
G4Jy 641 (GLEAM J070525–451328 and GLEAM J070546–451158) is B0703–451. This source is also believed to be a GRG, although Malarecki et al. (Reference Malarecki, Jones, Saripalli, Staveley-Smith and Subrahmanyan2015) acknowledge that ‘the host galaxy of B0703–451 is in doubt’. We can see in Figure 23(b) why this is the case, with multiple mid-infrared candidates for the host. The current identification is AllWISE J070530.57–451311.1, which is the AllWISE source nearest to the centroid position. This is in agreement with the optical identification by Jones & McAdam (Reference Jones and McAdam1992) but a high-resolution radio image to confirm this is unavailable. Hence, we do not list this source in Table 3 and instead set the host flag to ‘u’, for prompting follow-up observations.
G4Jy 700 (GLEAM J082231+055626) can be found in the 3CR catalogue, where it is listed as 3C 198. It is in cluster Abell 115, and the cross-identification provided is a  $V = 17$
mag galaxy (Wyndham Reference Wyndham1966) corresponding to AllWISE J082231.95+055706.8. However, we are wary of historical identifications that may be biased towards the optically brightest galaxies, hence our use of mid-infrared images (which also show dust-obscured galaxies). During our reassessment of this particular source, we find 4.9-GHz radio contours in the literature, presented by Massaro et al. (Reference Massaro2012). They are unable to locate the core in the X-ray and nor is it detected in the radio. However, the radio image reveals that the lobes of this extended radio galaxy are bent [Figure 23(c)]. This could be due to backflow of plasma towards the south-east, in a similar way as seen for 3C 28Footnote g (G4Jy 99; GLEAM J005550+262436). Alternatively, the narrowing of the radio emission could be the inner parts of the lobes, with the host galaxy being nearby and therefore not in line with the major axis of the radio galaxy. If so, this could explain why Buttiglione et al. (Reference Buttiglione, Capetti, Celotti, Axon, Chiaberge, Macchetto and Sparks2010)—who use the existing identification—find 3C 198 to be the only object (out of 113 3CR sources considered) to have optical emission lines consistent with star-forming galaxies rather than AGN. In any case, and in keeping with other extended radio galaxies in our sample that have ambiguous hosts, we use ‘u’ for the host flag until further evidence becomes available.
$V = 17$
mag galaxy (Wyndham Reference Wyndham1966) corresponding to AllWISE J082231.95+055706.8. However, we are wary of historical identifications that may be biased towards the optically brightest galaxies, hence our use of mid-infrared images (which also show dust-obscured galaxies). During our reassessment of this particular source, we find 4.9-GHz radio contours in the literature, presented by Massaro et al. (Reference Massaro2012). They are unable to locate the core in the X-ray and nor is it detected in the radio. However, the radio image reveals that the lobes of this extended radio galaxy are bent [Figure 23(c)]. This could be due to backflow of plasma towards the south-east, in a similar way as seen for 3C 28Footnote g (G4Jy 99; GLEAM J005550+262436). Alternatively, the narrowing of the radio emission could be the inner parts of the lobes, with the host galaxy being nearby and therefore not in line with the major axis of the radio galaxy. If so, this could explain why Buttiglione et al. (Reference Buttiglione, Capetti, Celotti, Axon, Chiaberge, Macchetto and Sparks2010)—who use the existing identification—find 3C 198 to be the only object (out of 113 3CR sources considered) to have optical emission lines consistent with star-forming galaxies rather than AGN. In any case, and in keeping with other extended radio galaxies in our sample that have ambiguous hosts, we use ‘u’ for the host flag until further evidence becomes available.
Another 3CR source for which we question the existing host galaxy identification is 3C 403.1. This appears in the G4Jy Sample as G4Jy 1582 (GLEAM J195222–011550 and GLEAM J195232–011729), with its current identification coinciding with AllWISE J195230.53–011720.7 and g1952305–011721 (in 6dFGS). There is weak (0.5–7 keV) X-ray emission at this position (Massaro et al. Reference Massaro2012), but the same can be said for the nearby source, AllWISE J195231.25–011716.6. Hence, there are two AGN candidates for G4Jy 1582, and the VLA image at 300 MHz does not allow this ambiguity to be resolved. However, interestingly, the orientation of the radio axis at 300 MHz [cyan contours in Figure 23(d)] appears to be at  ${\sim}45$
º with respect to the radio axis at 150 MHz [yellow contours in Figure 23(d)] and so is suggestive of radio jet precession (see Section 4.4).
${\sim}45$
º with respect to the radio axis at 150 MHz [yellow contours in Figure 23(d)] and so is suggestive of radio jet precession (see Section 4.4).
Like the ‘unclassifiable’ sources described in Section 4.9, each of the above four sources are being followed up using MeerKAT (PI: White).
6. Summary
The multi-component nature and complex morphology of many radio sources means that their host galaxies need to be carefully identified before we can combine radio datasets with information at other wavelengths. We have completed this important step for the brightest radio sources ( $S_{\mathrm{151\,MHz}}>4$
Jy) in the GLEAM EGC, which we refer to as the GLEAM 4-Jy (G4Jy) Sample. Here, we summarise the work done as part of cross-identifying this sample, and in doing so, we provide added value through the G4Jy catalogue (see Paper I for details):
$S_{\mathrm{151\,MHz}}>4$
Jy) in the GLEAM EGC, which we refer to as the GLEAM 4-Jy (G4Jy) Sample. Here, we summarise the work done as part of cross-identifying this sample, and in doing so, we provide added value through the G4Jy catalogue (see Paper I for details):
1. We visually inspect each of the G4Jy sources (as defined in Paper I) by overlaying multiple sets of radio contours onto mid-infrared images, with candidate host galaxies marked by AllWISE catalogue positions. All of the overlays that we use for this work, as well as the images from which they are made, are accessible online (see https://github.com/svw26/G4Jy for details).
2. Based upon our visual inspection and numerous literature checks, we highlight the wide variety of bright radio sources in the sample. This includes 2 nearby star-forming galaxies, 8 known GRGs, and 14 S-/Z-/X-shaped sources. We also create lists of 23 bent-tail radio galaxies and 18 head-tail radio galaxies (subject to the resolution of our radio images), whose morphology may be used to probe the surrounding cluster medium.
3. For 1 606 of the 1 863 sources in the G4Jy Sample, we are able to identify the host galaxy in AllWISE, supported by higher-resolution (i.e.
$<$
25–45 arcsec) images in the literature, where available. Meanwhile, another 126 sources are deemed to have a host galaxy that is too faint to appear in the AllWISE catalogue (which includes those affected by nearby, bright, mid-infrared emission). Many of these sources are likely to be at high redshift and require follow-up to confirm this. The two radio sources for which a host-galaxy identification is inappropriate (and so not specified) is the Flame Nebula (G4Jy 571) and the northern cluster relic of Abell 3667 (G4Jy 1605).4. We flag the remaining 129 G4Jy sources as having a cross-identification that is ‘uncertain’ (i.e. host_flag = ‘u’). This includes our wariness over existing identifications for B0424–728 (G4Jy 453), B0703–451 (G4Jy 641), 3C 198 (G4Jy 700), and 3C 403.1 (G4Jy 1582), as we do not find sufficient evidence for the current host galaxy position. In addition, there are three sources (G4Jy 113, G4Jy 513, and G4Jy 1117) for which we are unable to infer the mechanism giving rise to the low-frequency emission, and therefore it is unclear whether or not a host galaxy should be identified. Hence, each of these 129 sources are being followed up with MeerKAT (PI: White) to aid investigation.
5. Our fresh assessment of these bright radio sources, coupled with attention to detail, allow us to identify (i) discrepancies in the literature regarding the interpretation of morphology (e.g. for G4Jy 325, also known as B0304–123A) and (ii) inconsistent coordinates for existing high-resolution radio images (e.g. for G4Jy 40; PKS B0018–19).
6. Of course, our interpretations and identifications are themselves limited by the spatial resolution of the radio images at hand. Whilst NVSS/SUMSS allows us to identify which sources likely have their low-frequency flux densities affected by confusion (relevant for
$\sim$
20% of the sample), images of 45 arcsec resolution may still be concealing: (i) multiple, unrelated sources, (ii) the presence of distinct/asymmetric radio jets/lobes (which includes core-jet systems), or (iii) bent-/head-tail morphology. It is expected, therefore, that many morphology labels provided in the G4Jy catalogue will need to be revised in the future.


Finally, for the sources being followed up with MeerKAT at  $\sim$
5 arcsec resolution, we will use the same methods for host galaxy identification (outlined in Section 5.5 of Paper I) and update the G4Jy catalogue accordingly.
$\sim$
5 arcsec resolution, we will use the same methods for host galaxy identification (outlined in Section 5.5 of Paper I) and update the G4Jy catalogue accordingly.
7. Dedication
Papers I and II are dedicated to the memory of Richard Hunstead, who was very helpful with the assessment of the sources presented in this work, and provided hitherto unpublished radio images.
Acknowledgements
We thank the anonymous referee for their careful review and very positive feedback. S.V.W. would like to thank Chris Jordan, for his help with installing and running the cross-matching software (https://github.com/kasekun/MCVCM), as well as Dave Pallot and the ICRAR Data Intensive Astronomy team, for their help with fixing and updating the G4Jy Sample Server. In addition, S.V.W. thanks Ron Ekers, Elaine Sadler, Guillaume Drouart, and Gulay Gürkan for useful discussions, and Francesco Massaro, Judith Croston, and Tiziana Venturi for sharing images. We acknowledge the International Centre for Radio Astronomy Research (ICRAR), which is a joint venture between Curtin University and The University of Western Australia, funded by the Western Australian State government. We acknowledge the Pawsey Supercomputing Centre which is supported by the Western Australian and Australian Governments. The financial assistance of the South African Radio Astronomy Observatory (SARAO) towards this research is hereby acknowledged (www.ska.ac.za). This scientific work makes use of the Murchison Radio-astronomy Observatory, operated by CSIRO. We acknowledge the Wajarri Yamatji people as the traditional owners of the Observatory site. Support for the operation of the MWA is provided by the Australian Government (NCRIS), under a contract to Curtin University administered by Astronomy Australia Limited. GMRT is run by the National Centre for Radio Astrophysics of the Tata Institute of Fundamental Research (TIFR). The Australia Telescope Compact Array (ATCA) is part of the Australia Telescope National Facility which is funded by the Australian Government for operation as a National Facility managed by CSIRO. This publication made use of data products from the Wide-field Infrared Survey Explorer, which is a joint project of the University of California, Los Angeles, and the Jet Propulsion Laboratory/California Institute of Technology, funded by the National Aeronautics and Space Administration (NASA). This research has made use of the NASA/IPAC Extragalactic Database (NED), which is operated by the Jet Propulsion Laboratory, California Institute of Technology, under contract with the National Aeronautics and Space Administration. We also acknowledge the use of NASA’s SkyView facility (http://skyview.gsfc.nasa.gov) located at NASA Goddard Space Flight Center. This research has made use of the SIMBAD astronomical database (Wenger et al. Reference Wenger2000), operated at CDS, Strasbourg, France. This research has made use of the VizieR catalogue access tool, CDS, Strasbourg, France (DOI: 10.26093/cds/vizier). The original description of the VizieR service was published in A&AS 143, 23 (Ochsenbein, Bauer, & Marcout Reference Ochsenbein, Bauer and Marcout2000). This research made use of Montage. It is funded by the National Science Foundation under Grant Number ACI-1440620, and was previously funded by the National Aeronautics and Space Administration’s Earth Science Technology Office, Computation Technologies Project, under Cooperative Agreement Number NCC5-626 between NASA and the California Institute of Technology. The authors made use of the database ‘astrophysical CATalogues Support system’ (CATS; Verkhodanov et al. Reference Verkhodanov, Trushkin, Andernach and Chernenkov2005) of the Special Astrophysical Observatory. Finally, the following open source software was used for data visualisation and processing: topcat (Taylor 2005), SAOImage DS9 (Smithsonian Astrophysical Observatory 2000; Joye & Mandel 2003), NumPy (Oliphant Reference Oliphant2006), Astropy (Astropy Collaboration et al. 2013), APLpy (Robitaille & Bressert, Reference Robitaille and Bressert2012), Matplotlib (Hunter Reference Hunter2007), and SciPy (Jones et al. Reference Jones2001).


