


Introduction
Top-ranked CEOs are a rare breed. By definition, only 500 CEOs run the Fortune 500 firms, and 1,200 CEOs run S&P 1200 firms. Focusing on even more highly rarefied CEOs for this study, we analyzed CEOs honored in the Harvard Business Review top 100 global CEOs, Forbes Next Billion-Dollar Startups, and Fortune Most Powerful Women listings. Upper echelons theory research notes the importance of CEOs to firm success, driving strategy (Hambrick, Reference Hambrick2007), and impacting corporate policies and performance (Graham, Harvey & Manju, Reference Graham, Harvey and Manju2013).
CEOs have an oversized impact on firm outcomes relative to other TMT members. Bolinger, Brookman and Thistle (Reference Bolinger, Brookman and Thistle2023) utilized variance decomposition techniques to ascribe outcome variances to CEOs and their TMT members. CEO effects were found to be significantly higher than those for TMT members.
A central premise of upper echelons theory was that values and personality influenced CEO’s interpretation of and response to firm needs (Hambrick, Reference Hambrick2007), and thus firm outcomes, with a call for more nuanced linkages between CEO characteristics and firm behavior and performance (Melis & Nawaz, Reference Melis and Nawaz2024). Through a Linguistic Inquiry & Word Count, LIWC, text analysis of 49 top-ranked CEO Twitter (X) postings, multiple psychological characteristics were identified for each CEO, allowing for a unique and holistic analysis of the data. Given the impact of CEOs on firm outcomes, this paper considers the following research question: Do top-performing CEO psychological characteristics load onto a limited number of psychological profiles that manifest to different degrees based on gender and firm-stage differences? The following theory section considers prior research on CEO psychological characteristics and profiling to inform the paper’s hypotheses.
Theoretical framework and hypotheses
CEOs were shown to be influenced by their psychological characteristics, with cognitive biases and personal values directly impacting behavior and indirectly informing perceptual screening (Finkelstein, Hambrick & Cannella, Reference Finkelstein, Hambrick, Cannella, Hitt, Ireland and Hoskisson2009; Hambrick & Brandon, Reference Hambrick, Brandon and Hambrick1988). Watton, Lichtenstein and Aitken (Reference Watton, Lichtenstein and Aitken2019) noted a relationship between personal values and a leader’s firm-level purpose, behavior, and decisions. Personal values were observed to influence perceptions, affect solutions considered, impact interpersonal relationships, guide perceptions of success, and provide a basis for ethical decision-making. Mumford, Marks, Connelly, Zaccaro and Reiter-Palmo (Reference Mumford, Marks, Connelly, Zaccaro and Reiter-Palmon2000) suggested leaders are promoted and effective in their roles because of how they approach solving problems. Other studies show that a leader’s attributes, such as career background and age, influence performance (Datta, Rajagopalan & Zhang Reference Datta, Rajagopalan and Zhang2003; Wiersema & Bantel, Reference Wiersema and Bantel1992).
CEO psychological characteristics
Psychological characteristics shape an individual’s attention, selection, and interpretation of stimuli, directly impacting CEO decision-making (Hambrick & Mason, Reference Hambrick and Mason1984). Petrenko, Aime, Ridge and Hill (Reference Petrenko, Aime, Ridge and Hill2016) noted that CEO psychological characteristics, such as narcissism, could negatively impact firm financial performance due to agency issues, while CEO values could drive firm-level corporate social responsibility decisions. Additional research studies noted correlations between leadership effectiveness and personality attributes (Judge, Bono, Ilies & Gerhardt, Reference Judge, Bono, Ilies and Gerhardt2002; Peterson, Smith, Martorana & Owens, Reference Peterson, Smith, Martorana and Owens2003). Bray, Campbell and Grant (Reference Bray, Campbell and Grant1974) observed that interpersonal skills and achievement motivation in leaders assisted in their future promotions. Studies also noted correlations between leadership effectiveness and personality attributes (Judge et al., Reference Judge, Bono, Ilies and Gerhardt2002; Peterson et al., Reference Peterson, Smith, Martorana and Owens2003).
Drivers
Leadership is represented through behavior patterns influenced by personal attributes and values (Zaccaro, Reference Zaccaro, Peterson and Seligman2004). Personal values function as motivational guides for individuals (Higgins, Reference Higgins, Kruglanski and Higgins2007). These motivational guides focus on personal goals and goal-oriented actions, influencing a leader’s behavior. McClelland and Boyatzis (Reference McClelland and Boyatzis1982) illustrated linkages between motivational traits, executive advancement, and effectiveness. Previously, McClelland (Reference McClelland1961) proposed that a high-achievement driver would not be effective for executives, given the cooperative nature of organizational environments. Other drivers, such as affiliation and power, were posited and evaluated in the research literature (Brown, Reference Brown1965; Conte & Plutchik, Reference Conte and Plutchik1981). For example, power was correlated with garnering formal social power and impulsive actions such as risk-taking (Winter, Reference Winter1973; Winter & Stewart, Reference Winter, Stewart, London and Exner1978).
Risk
As upper echelons theory suggests (Hambrick & Mason, Reference Hambrick and Mason1984), the effect of a CEO’s personality on strategic risk-taking has been well examined. Some researchers have focused on outcome probabilities (Hambrick, Reference Hambrick2007), while others have focused on the cognitive limitations that may affect rational risk perceptions (Weber & Milliman, Reference Weber and Milliman1997) and ultimately influence risk assessment when making decisions on behalf of the firm (Sitkin & Pablo, Reference Sitkin and Pablo1992). Through such subjective judgments, CEOs perceive firm outcomes and their associated risks as correlated with personal losses and gains (Wiseman & Gomez-Mejia, Reference Wiseman and Gomez-Mejia1998). However, the more unpredictable the outcome given firm context, the more conscientious the CEO may be about the risks and the effort involved (Miller & Toulouse, Reference Miller and Toulouse1986).
Emotions
A CEO’s emotional state reflects their ability to adapt to the demands of various situations, even when stressful (McCrae & Costa, Reference McCrae, Costa, Hogan, Johnson and Briggs1997). Positive emotions are experienced more frequently by emotionally stable individuals, which benefits the CEO. For instance, Fredrickson (Reference Fredrickson2001) noted that positive emotions, such as love and joy, expand an individual’s range of attention, cognition, Kocsis (Reference Kocsis2003) and action. Further research has shown that this enhancement of attention and cognition correlates with complex problem-solving (Judge, Erez & Bono, Reference Judge, Erez and Bono1998). On the contrary, negative emotions (e.g., fear, anxiety, and stress) correlate with reduced receptivity and acceptance of change (Huy, Reference Huy2011; Teece, Reference Teece2007). CEOs who maintain emotional stability promote both cooperation within the firm and a more substantial commitment to firm goals (Peterson et al., Reference Peterson, Smith, Martorana and Owens2003).
Temporal focus
Prior research has shown that a CEO’s temporal focus impacts critical firm operational and strategic approaches and outcomes. Impacts analyzed included the firm’s strategic novelty, dynamism and distinctiveness (Agnihotri, Bhattacharya & Prasad, Reference Agnihotri, Bhattacharya and Prasad2025), rate of new product development (Nadkarni & Chen, Reference Nadkarni and Chen2014), and strategic focus (causation vs. effectuation) (Kozachenko, Shirokova & Bodolica, Reference Kozachenko, Shirokova and Bodolica2024).
Psychological profiling and screening
Historically, upper echelons theory research had to proxy psychological characteristics with demographic indicators, termed the ‘black box problem’ for such studies, given the difficulty of CEO data collection (Lawrence, Reference Lawrence1997). A better understanding of the psychological characteristics of TMTs was theorized to provide deeper insight into explanations of firm outcomes (Hambrick, Reference Hambrick2007), a need enabled in this study by a unique data set for each top-ranked CEO subject with measures for emotions, drivers, risk, and temporal focus, each individually noted as impactful psychological characteristics informing CEO performance as noted earlier.
Combining psychological characteristics for profiling, assessment, and screening is a widely used technique in psychological research and practice. As an example, the California Psychological Inventory (CPI) assessment, available from the Myers-Briggs Company, has been used to ‘find and develop leaders and high-potential employees’ (The Myers-Briggs Company, 2025). A Web of Science search for the ‘CPI’ returned 587 publications. CPI and other profiling vehicles are used to both pre-screen candidates and assess existing employees (Kelley, Jacobs & Farr, Reference Kelley, Jacobs and Farr1994; Roberts, Tarescavage, Ben-Porath & Roberts, Reference Roberts, Tarescavage, Ben-Porath and Roberts2019). Psychological profiling, also known as personality profiling, has been applied to assess individuals for optimal ‘fit’ with specific environments or roles; one such example is the Entrepreneurial Mindset Profile (Davis, Hall, & Mayers, Reference Davis, Hall and Mayer2016). Psychological profiling of criminals (Kocsis, Reference Kocsis2003), athletes (Ruiz-Esteban, Olmedilla, Méndez & Tobal, Reference Ruiz-Esteban, Olmedilla, Méndez and Tobal2020), patients (Lykouras, Reference Lykouras2007), and doctors (Foster, Neidert, Brubaker-Rimmer, Artalejo & Caruso, Reference Foster, Neidert, Brubaker-Rimmer, Artalejo and Caruso2010) provides examples of the span of existing psychological profiling research.
The prior research on the impact of CEO psychological characteristics on firm performance and the research literature on psychological profiling and screening suggest the following hypothesis:
Hypothesis 1: Top-ranked CEOs will cluster into a small number of psychological profiles.
Firm context
CEO characteristics, such as drive, risk, and entrepreneurial orientation, impact firm outcomes differently based on firm context (Zhao, Seibert & Lumpkin, Reference Zhao, Seibert and Lumpkin2009; Busenitz & Barney, Reference Busenitz and Barney1997). For example, Najar and Dhaouadi (Reference Najar and Dhaouadi2020) note the importance of a CEO’s entrepreneurial orientation to promoting a firm’s climate of innovation and pursuing open innovation strategies. In a study focused on the impact of CEO personality characteristics on small and medium enterprises’ entrepreneurial orientation, Verdú-Jover, Estrada-Cruz, Rodríguez-Hernández and Gómez-Gras (Reference Verdú-Jover, Estrada-Cruz, Rodríguez-Hernández and Gómez-Gras2013) found strong correlations with CEO extraversion (40.68% of variance explained), openness to experience (18.64% of variance explained), conscientiousness, agreeableness, and neuroticism (latter three each at 13.56% of variance explained). A study of large publicly traded Indian software firms observed that entrepreneurial orientation had an inverted U-shaped relation to firm performance, with greater CEO power exacerbating negative outcomes (Saiyed, Tatoglu, Ali & Dutta, Reference Saiyed, Tatoglu, Ali and Dutta2023). These studies suggest that differing firm contexts require CEOs with distinctive psychological profiles to maximize their respective outcomes, as noted in the following hypothesis:
Hypothesis 2: Dominant CEO psychological profiles will vary across differing firm contexts.
Gender
To better understand the impact of increased female leadership on companies, researchers have examined psychological differences between women and men (Croson & Gneezy, Reference Croson and Gneezy2009). For example, studies have shown that women are more risk-averse than males (Faccio, Marchica & Mura, Reference Faccio, Marchica and Mura2016; Sapienza, Zingales & Maestripieri, Reference Sapienza, Zingales and Maestripieri2009). Within the psychology literature, males and females exhibit differences in core values, for example, self-transcendent values versus self-enhancement values (Schwartz & Rubel, Reference Schwartz and Rubel2005). Consistent with Schwartz and Rubel’s findings, when examining the differences between female and male leaders, Graham et al. (Reference Graham, Harvey and Manju2013) found significant gender differences regarding attitudes toward risks and values.
Despite these differences, other studies that have examined female leaders have indicated that female leaders will adopt behaviors that allow access or acceptance in male-dominated groups with the intent to benefit career advancement and pursue top management positions (Davies-Netzley, Reference Davies-Netzley1998; Ferree & Purkayastha, Reference Ferree and Purkayastha2000). However, although studies such as these have focused on differences between female and male leaders, as well as on the differences in their psychological characteristics, it is unclear if top-performing female CEOs will exhibit psychological profiles distinctive from their male counterparts. Given this prior research, we posit the following hypothesis:
Hypothesis 3: CEO psychological profiles will vary with gender.
Methodology
Scholars have called for a more holistic perspective when analyzing CEO values and personality (Wowak, Gomez-Mejia & Steinbach, Reference Wowak, Gomez-Mejia and Steinbach2017); however, gathering such information has historically been difficult. Responding to this call, this study sought to identify a set of psychological profiles of top-ranked CEOs by analyzing a corpus of top-ranked CEO Twitter postings and studying them utilizing linguistic analysis software (LIWC), principal component analysis (PCA), binary logistic regressions, and t-tests.
Top CEO subject identification and data collection
This study analyzed top-ranked CEOs as recognized by business trade press rankings (Harvard Business Review, 2018; Forbes, 2018; Fortune, 2018). By definition, top-ranked CEOs are a rare breed. For instance, the S&P Global 1200 index of global equities accounts for approximately 70% of total global stock capitalizations. This index, by definition, represents 1,200 CEOs and is the original source for the Harvard Business Review (HBR) top 100 CEO listing, one of the sources for this study (Harvard Business Review, 2018).
Numerous business trade publications provide top CEO rankings with criteria varying from personal earnings, employee feedback, reputation, and firm performance (Barron’s, 2018; Bastone, Reference Bastone2018; Glassdoor, 2019; Melin & Sam, Reference Melin and Sam2020; Valet, Reference Valet2018). The publications highlight CEOs in top 10 to top 200 rankings, with CEOs overlapping between different listings. Top-ranked CEO analyses are thus highly focused studies, which, in our case, are further reduced based on the CEO’s personal Twitter use.
Starting with the initial top-ranked CEOs identified in the business trade publication listings, a search was conducted to identify the CEO’s personal Twitter account, versus a corporate account that mentioned the CEO. If a personal Twitter account was not identified, the CEO was dropped from the analysis. CEO tweets were downloaded from the Twitter website. Given software constraints, only the latest 3,200 tweets could be downloaded per CEO. All words containing ‘@’ (indicating proper name references), all words containing ‘HTTP’ (links), and all retweets were removed from the resulting data set prior to the textual analysis to ensure only CEO generated text was analyzed. If the CEO’s cumulative personal tweet content did not exceed 250 words, the CEO record was dropped from the analysis given LIWC guidance on minimal corpus size for an effective linguistic analysis. Accounts were also dropped if tweets were not in English. The accounts studied are personal CEO Twitter accounts, which are more likely to be directly managed by the CEO or, at a minimum, receive their direct oversight and approval of content given the personal nature of the channel. However, to further judge personal versus for-hire tweeting activity, the data were checked to ensure the CEO was the only member listed, analyzed for the use of replies, and reviewed for personal content, all useful indicators of authentic CEO engagement. If this screening suggested the CEO had outsourced their postings, the CEO was dropped from the data set.
These filters significantly reduced the data set available for analysis. For example, the CEOs sourced from the Harvard Business Review’s top 100 global CEOs were reduced to 16 available for analysis in the final CEO data set. These cumulative screening steps resulted in a final data set of 49 CEOs. Ten of the 49 CEOs were female, and 21 of the firms were classified as small and medium enterprises (SMEs) based on source (Forbes Next Billion-Dollar Startups listing) and a review of available revenue and funding data. Demographic data on the CEOs and their companies were also collected. This included CEO age, years at the firm, and years as CEO.
Text analysis to identify psychological characteristics by subject
The LIWC software extracted features from the CEO’s Twitter postings (all pre-July 2020), similar to analyses in other studies leveraging linguistic analysis software (Akstinaite, Robinson & Sadler-Smith, Reference Akstinaite, Robinson and Sadler-Smith2020; Pennebaker, Boyd, Jordan & Blackburn, Reference Pennebaker, Boyd, Jordan and Blackburn2015; Schultheiss, Reference Schultheiss2013). LIWC-extracted features include summary language variables, linguistic dimensions (including grammar), and psychological characteristics (Pennebaker et al., Reference Pennebaker, Boyd, Jordan and Blackburn2015). The psychological characteristics considered in this analysis are measures available from the LIWC software and noted as impactful in prior upper echelons theory research. They include emotionality (positive and negative), temporal focus (present and future), risk tolerance, and drivers (affiliation, achievement, power, and reward). LIWC analytics have been utilized in recent research literature, with more than 802 LIWC references found on the Web of Science with 92 of those including a Twitter reference. Several LIWC studies have focused on top leaders by analyzing political leaders (Kangas, Reference Kangas2014) and Chief Marketing Officers’ communications to extract psychological characteristics and evaluate performance impacts (Winkler, Rieger & Engelen, Reference Winkler, Rieger and Engelen2020), serving as exemplars for this paper’s CEO focus.
Combining the psychological characteristics identified into CEO psychological profiles via a factor analysis (PCA) provides a path to address the endogeneity problem inherent in upper echelons theory studies and an opportunity to utilize CEO psychological profiles to ‘… turn upper echelons theory on its head. … By [being able to treat] … executive characteristics as dependent variables, we will not only open up new avenues for thinking about organizational adaptation and intra-organizational power struggles but will almost certainly gain insights that will … sharpen our predictions of how and why executives’ characteristics become manifested in organizational outcomes’ (Hambrick, Reference Hambrick2007: 338). The CEO psychological profiles identified are a result of board or investor selection criteria and CEO appointment.
PCA to identify psychological profiles
The LIWC-derived psychological characteristics were next analyzed via a PCA extraction method to combine, and thus reduce, the variables, identifying unique components, termed here as CEO psychological profiles. The unique psychological profiles (components) were required to have eigenvalues greater than 1, indicating that the component explained more variance than any single variable in the data set. The components were rotated using a Varimax with Kaiser normalization that identified and reduced the number of critical variables per component, facilitating interpretation of results and cross-component comparisons.
Measures for the psychological characteristics included in the PCA were relative measures to the study’s overall top-ranked CEO sample (Z-values). These Z-values were used to normalize measures across variables.
Binary logistic regressions and t-tests to consider gender and firm size differences
The rotated and extracted variables (psychological characteristics) for each component (psychological profile) were included as independent variables in binary logistic regression models where gender and firm size served as dependent variables. The binary logistic regressions were conducted for each psychological profile derived from the PCA analysis, with the psychological characteristics included in the profile serving as the model’s independent variables. Overall model fit (Cox & Snell R 2 values) and classification results were considered to determine if psychological profile differences were supported. Box and whisker plots were next used to visualize and compare the overlap of the binary subject (male–female and large firm–SME) psychological characteristics data included in the profiles. Psychological characteristics were next analyzed using t-tests to confirm statistical differences in the data.
Results
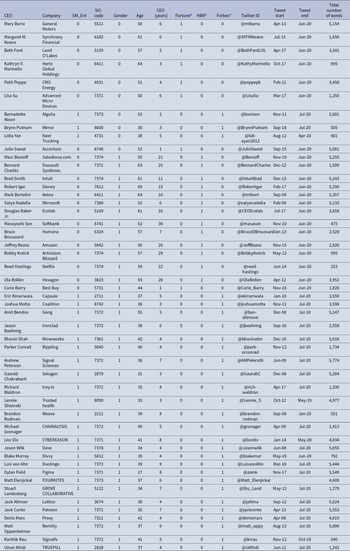
Table 1 provides a list of the final CEOs in the data set, company information, and details on the CEO Twitter data used in this analysis. The LIWC text analysis was used to derive values for the nine psychological characteristics analyzed in this study: drivers (affiliation, achievement, power, and reward), risk tolerance, temporal focus (present and future), and emotionality (positive and negative) via an analysis of text corpora from the Twitter (X) postings of the CEO subjects. The average corpus had 3,916 words with a word range per subject of 296–9,000 words (minimum word count needed for an LIWC analysis is 250).
CEO subject data

a Listings: Fortune Most Powerful Women (CEOs), HBR Top Global CEOs, and Forbes Next Billion-Dollar Startups.
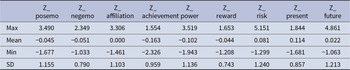
The LIWC text corpora analysis identified subject values for the nine different psychological characteristics with the resulting data converted to Z-values as noted in Table 2.
LIWC psychological characteristic output Z-values (all subject data)

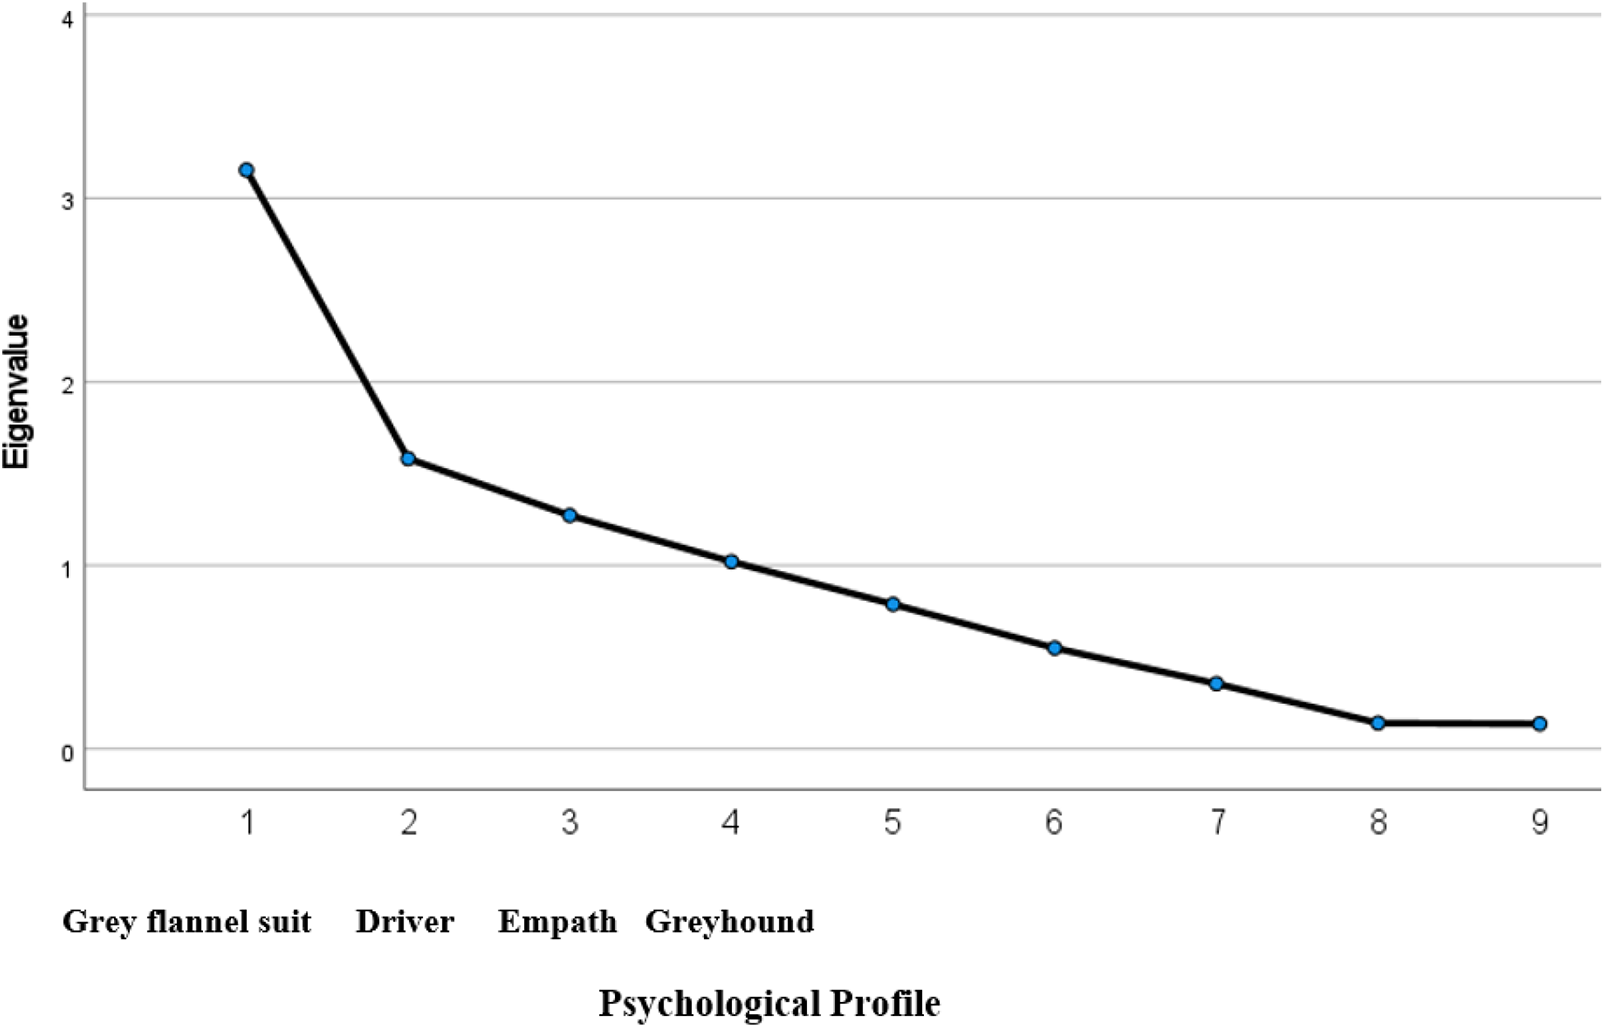
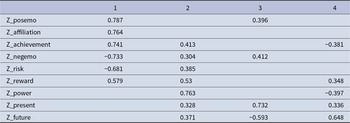
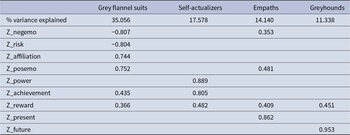
A Kaiser–Meyer–Olkin measure of 0.503 found the data set to be acceptable for factor analysis (a minimum value of 0.5 or above required). A Bartlett’s test of sphericity was found to be significant at <0.001 (a maximum value of 0.05 acceptable), indicating no significant correlation between variables, a requirement when conducting a factor analysis. The PCA reduced the nine initial psychological characteristics into four psychological profiles (all with eigenvalues > 1.0) that collectively explained 78.11% of total sample variance. The results of the unrotated and rotated factor solutions based on eigenvalues greater than 1 and a maximum iteration of 25 (rotation converged in five iterations) are presented in Tables 3 and 4. Table 4 also lists the % variance explained by each psychological profile derived from this analysis. Figure 1 provides a scree plot mapping the psychological profiles to their eigenvalues.
Scree plot.

PCA component (psychological characteristics) matrix

PCA-rotated psychological characteristics matrix with % variance explained

Based on the differences noted in the underlying psychological characteristics, the authors assigned names to the psychological profile to represent them and to assist in distinguishing between them. This naming was arbitrary; however, they were selected to represent the underlying psychological characteristics, noted in Table 4, most strongly associated with each profile. These naming choices utilized a literary technique, termed aptronym, to capture each psychological profile’s distinctiveness.
The ‘grey flannel suits’ profile represented 35.06% of variance explained, the most popular profile identified. These CEOs exhibited higher positive emotionality, lower negative emotionality, a lower risk tolerance, and a high affiliation driver. The ‘self-actualizers’ profile represented 17.58% of variance explained. These CEOs exhibited high power and achievement drivers. The ‘empaths’ profile represented 14.14% of variance explained. These CEOs exhibited high emotions (both positive and negative) and a strong present focus. The ‘greyhound’ profile represented 11.34% of variance explained. These CEOs exhibited a high future focus. Note that a high reward driver was found across all four profiles.
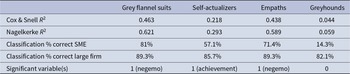
Next, binary logistic regression analyses were conducted to evaluate the psychological profile’s relationship to firm size (large and SME) and CEO gender (male and female) differences, the dependent variables in the respective analyses. For firm size, the model fit R 2 values were strong (Cox & Snell R 2 ranging from 0.438 to 0.463) for the ‘grey flannel suits’ and ‘empaths’ profiles, moderate for the self-actualizers profile (Cox & Snell R 2 of 0.218), and low for the ‘greyhounds’ profile (Cox & Snell R 2 of 0.044). High levels of classification accuracy for SME CEOs were observed for the ‘gray flannel suit’ and ‘empaths’ profiles (81% and 71.4% accuracy, respectively). ‘Self-actualizers’ classification accuracy of 57.1% was a bit better than a coin toss, while ‘greyhounds’ classification accuracy was a poor 14.3%. The strong model fits and classification accuracy noted were suggestive of discernible differences in CEO profiles sorted on firm size. Table 5 provides the results of the firm size’s binary logistic regression analysis.
Binary logistic regression firm size Dependent Variables (DVs) and psychological profile characteristic Independent Variabless (IVs)

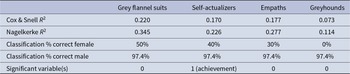
The model fit and classification accuracy for the gender analysis demonstrated poorer model fit and limited classification discernment, with the best classification accuracy for female CEOs at 50% for the ‘grey flannel suits’ profile. Table 6 provides the results of the gender differences’ binary logistic regression analysis.
Binary logistic regression gender DVs & psychological profile characteristic IVs

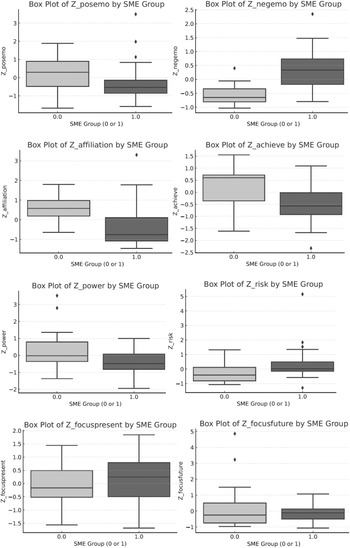
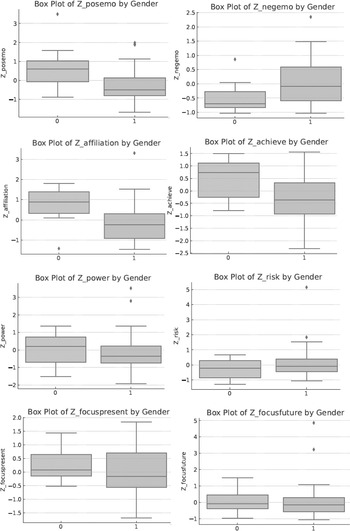
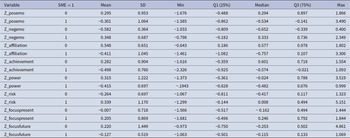
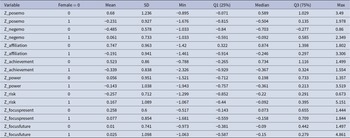
To further investigate the strong firm size distinctness suggested across three of the profiles and potential gender differences for the ‘grey flannel suits’ profile, the individual psychological characteristic data contributing to the psychological profile models were visualized using box and whisker plots to discern differences, followed by t-test analyses to confirm statistical significance. Figure 2 provides the box plots for firm size differences, and Fig. 3 provides the box plots for gender differences with the respective input data noted in Tables 7 and 8.
Firm size psychological characteristic box and whisker comparisons (SME = 1).

Gender psychological characteristic box and whisker comparisons (female = 0).

LIWC psychological characteristics by firm size with quartiles for box plots

LIWC psychological characteristics by gender with quartiles for box plots

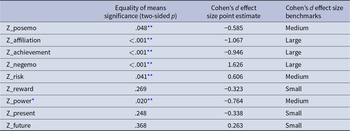
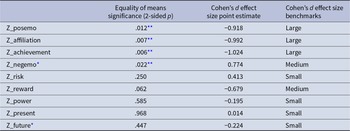
The visual analysis of the box plots suggested likely differences in the emotionality and affiliation driver psychological characteristics for both the gender- and firm size-differentiated samples; however, the t-test results did not find these characteristic differences to be statistically distinct. The t-test results did however find statistically significant differences in the temporal focus and reward drivers for both the gender and firm size analyses. In addition, risk tolerance and power driver differences were identified for the gender delineated data. The t-test results are noted in Tables 9 and 10.
Firm size (large and SME) psychological characteristic t-test comparisons

* Equal variances not assumed.
** Significance at the 0.05 level.
Gender (female and male) psychological characteristic t-test comparisons

* Equal variances not assumed.
** Significance at the 0.05 level.
Discussion
Although the psychological profile embodying the ‘man’ in the grey flannel suit profile appears alive and well among top-ranked CEOs, there was significant diversity between the four psychological profiles observed. The binary logistic regression analysis noted variation in profile occurrences across firm sizes, supporting previous studies indicating CEO variations related to firm differences (Zhao & Seibert, 2006; Busenitz & Barney, Reference Busenitz and Barney1997). These findings support Hypotheses 1 and 2 with the existence of several distinct CEO psychological profiles and their varying prevalence in CEOs leading large versus SME firms.
This study suggests that CEO psychological profiles are not gender distinct, failing to provide support for Hypothesis 3. However, the box plot and t-test evaluations provided support for gender distinctions at the psychological characteristic level of analysis. The psychological characteristic gender differences noted in the t-tests included temporal focus, risk tolerance, and power/reward drivers; however, Cohen’s d effect size measures suggested small to medium impacts from these differences that were apparently ‘lost’ at the aggregated psychological profile level.
Contributions
This study identifies the presence of a diverse but limited set of psychological profiles represented within the rarefied world of top-ranked CEOs. The research suggests that while there is no single, winner-take-all CEO psychological profile, there is a limited repertoire. The variations noted based on firm size suggest that certain psychological profiles may have a ‘Darwinian’ advantage in varying firm contexts. The lack of support for gender-based psychological profile differences noted suggests that, after climbing to the summit of top-ranked CEO leaders, psychological profile conformity may be the norm (within the limits of the repertoires noted). Gender differences were detected for certain psychological characteristics underlying the profiles; however, this distinctiveness was lost in the aggregated measure results.
The confluence of automated linguistic analysis tools, such as LIWC, with the ability to source large corpora of CEO data from social media and other electronic platforms enabled this study and its ability to conduct a more holistic analysis of top-ranked CEO psychological characteristics and profiles, providing a unique contribution to upper echelon theory research.
Limitations
While social media, subject postings, and linguistic analysis tools enabled this research, collecting the data and conducting data ‘hygiene’ tasks remains a non-trivial task, explaining the modest sample size of this study and the need to enlarge the sample in further research. In addition, the efficacy of the psychological characteristics available via the LIWC textual analysis approach may be questioned. Even highly studied psychological characteristics, such as CEO narcissism, remain in a state of further ongoing validation (Koch-Bayram & Biemann, Reference Koch-Bayram and Biemann2020).
As linguistic analysis methods become more applied, subjects such as CEOs may increasingly manage their publicly accessible content to manipulate perceptions and outcomes through such analytic methods. Data accessibility from software platforms such as Twitter (X) can also be easily limited based on social media company objectives or regulatory pressures.
When it comes to CEO decision-making and performance, psychological characteristics and profiles are just one ‘piece of the puzzle’. For instance, studies have indicated that a new CEO’s lack of technological expertise was linked to a significant decline in firm innovation (Cummings & Knott, Reference Cummings and Knott2017). Moreover, there are other psychological characteristics beyond those accessible through LIWC that are important. For example, a substantial body of literature exists on CEO narcissism and its influence on decision-making (O’Reilly and Hall, Reference O’Reilly and Hall2021)
Our top-rated CEO data sourcing presents the potential for selection bias. Business trade press listings were utilized to highlight the top-rated CEOs analyzed in this study. The goal of using these lists to source the CEOs was to identify independently recognized exceptional performers in the already exclusive world of CEOs, perhaps increasing the signal from our subject data. However, the press listings had different selection criteria, and firm size was bifurcated between the trade press listings. On the small/medium company side, the listings were primarily sourced from the Forbes Next Billion-Dollar Startup list. For these companies, many of the CEOs are firm founders and are active in the technology space. This presents potentially confounding industry and start-up experience moderating variables not controlled for in this analysis.
Research agenda
This paper concludes with a broad call for continued CEO and TMT research leveraging linguistic analysis software and C-suite corpora to further inform upper echelons theory. Suggestions for ongoing research include studies of TMT homophily, global differences, and more diverse leadership contexts.
Relevant to TMT homophily, Rivera (Reference Rivera2012) observed the importance of cultural matching in hiring decisions from a corporate case study informed by 120 employee interviews and hiring committee observations. Cultural matching of candidates and reviewers was signaled by a candidate’s leisure pursuits, career, social experiences, and presentation style. While overall job competence was ‘table stakes’ for consideration, cultural matching versus productivity optimization was the next most important selection criterion. Greenberg and Mollick (Reference Greenberg and Mollick2017) observed three distinctive homophily forms impacting funding decisions in a study of crowdfunding campaigns: ‘induced homophily’ (social category affiliation), ‘interpersonal choice homophily’ (similarity of individuals), and ‘activist choice homophily’ (shared social barrier experiences). In combination, these studies suggest that homophily is important in selection decisions and that homophily considerations are stratified across various dimensions. Homophily across psychological characteristics and profiles as a consideration in CEO and TMT selection would not be unexpected given these findings. Control variables would be needed, such as firm size, industry, CEO tenure, CEO gender, CEO as founder, TMT members hired by the CEO, and firm financial performance, for such analyses to consider the following question for consideration: Do TMT members hired by the CEO reflect the CEO’s psychological profile?
Do CEO psychological profiles vary by industry?
Enabling the study of global CEO psychological profiles, linguistic analysis tools, such as LIWC, have expanded their global coverage with dictionaries in German and French, as examples (LIWC, 2024). This study can be replicated using multi-language corpora allowing for cross-country analyses. Varying global contexts can be quite distinct requiring different skills to navigate. Mersland and Strom (Reference Mersland and Strom2009) found microfinance institution performance improved with local versus international directors. US versus U.K. CEOs are paid differently, with US CEOs receiving significantly larger ‘at risk’ compensation (Conyon, Core & Guay, Reference Conyon, Core and Guay2011). Even the instantiation of capitalism varies across Western countries as noted in a study by Schmidt (Reference Schmidt2003) comparing the market capitalism of the United Kingdom to the managed and state capitalism of Germany and France. These observations suggest the following question for consideration: Do variations in CEO psychological profiles correlate with variations in firm geographic headquarters for otherwise similarly situated firms?
Moving beyond the traditional corporate C-suite, leaders work in numerous alternative contexts such as academia, non-profits, and politics. Leaders in these diverse contexts can be similarly analyzed and compared to those highlighted in this corporate-focused study. For example, LIWC has been used to investigate US Presidential and Vice-Presidential candidates (Kangas, Reference Kangas2014), suggesting the following research question: Do top leader psychological profiles vary across leadership contexts?
The methodological approach taken in this paper informs critiques levied against upper echelons theory research (Brett, Neely, Lovelace, Cowen & Hiller, Reference Brett, Neely, Lovelace, Cowen and Hiller2020). For this study, the ‘black box’ that this approach sought to unpack was visibility to individual top-ranked CEO’s multi-faceted psychological characteristics, transformed into more holistic leadership psychological profiles. The black box problem for upper echelons theory in general has historically been a data collection and access problem. As Hambrick (Reference Hambrick2007) noted, access to upper echelon individuals is difficult; however, new technologies and analytic tools reduce these barriers for future research. Brett et al. (Reference Brett, Neely, Lovelace, Cowen and Hiller2020) categorized the black box issues noted in prior studies as cognitive and relational in nature. While relational considerations are not addressed in this paper, electronic records and social network analysis tools and techniques may similarly provide novel paths to advance this relational-focused research and further inform upper echelons theory in a TMT context.
This paper responds to Brett et al.’s (Reference Brett, Neely, Lovelace, Cowen and Hiller2020) metacritiques of upper echelons theory beyond the black box issues already discussed. A second metacritique raised was the incongruence of constructs and measures with a recommendation to ‘shift focus toward better understanding how distal a proxy/unobtrusive variable is from the focal variable’ (Brett et al., Reference Brett, Neely, Lovelace, Cowen and Hiller2020: 1034). By focusing on CEO psychological profiles, this paper suggests a path forward to address this ‘focal variables’ concern in future research.
Supplementary material
The supplementary material for this article can be found at https://doi.org/10.1017/jmo.2025.10041.
Conflicts of interest
The authors declare that they have no competing interests.
Dr. McHugh is an experienced manager, teacher, researcher, venture founder/executive, and investor informed by an award-winning technology industry career focused on intrapreneurial and entrepreneurial endeavors and by more recent roles as a professor and academic administrator at the Brown University School of Engineering (SoE). Dr. McHugh is a highly rated professor of finance and entrepreneurship at the undergraduate, graduate, and executive levels. He is a former Director of the Brown SoE Innovation Management & Design Engineering Group, Academic and Administrative Director of the Master Program in Innovation Management & Entrepreneurship (PRIME), and Academic and Administrative Director of the IE Brown Executive MBA. He is a faculty affiliate of the Institute at Brown for Environment & Society. Research interests focus on decision science, primarily in innovative and sustainability contexts. His work has been published in journals such as Journal of Management & Organization, Behaviour & Information Technology, MIS Quarterly Executive, and The Journal of Prediction Markets. Research measures per Google Scholar as of April 2024: h-index = 8; i10-index = 7; total citations = 1,942. Dr. McHugh is a former member of the Cherrystone Angel Group and current board member of Fractal Antenna Systems and STED Ltd.
Dr. Ja-Naé Duane is a four-time entrepreneur and angel investor with over 13 years of innovation experience in various domains, including future forecasting, digital transformation, innovation strategy, product development, and consumer experience. She has worked with a portfolio of over 50 brands and empowers leaders to prepare their organizations and clients for the future by harnessing the potential of emerging technologies. Her unique perspective and expertise have made her a sought-after consultant for senior executives and governmental leaders, who rely on her to think exponentially, foster resilience, and identify trends that pave the way for the future. Dr. Duane’s research focuses on the intersection of behavioral sciences and design within computer information systems. Her work has been published in journals such as Behaviour & Information Technology, Virtual Reality, Big Data & Society, and the Association for Computing Machinery. She teaches entrepreneurship, innovation, and decision-making courses at the undergraduate, graduate, and executive levels. Dr. Duane is a member of the Loomis Council at the Stimson Center, a collaborator with the National Institute of Health, and holds an appointment as an academic research fellow at MIT’s Center for Information Systems Research, as well as a Lecturer and Academic Program Director at Brown University. Her next book, published by Wiley, is due in 2025.


 Open access

