


Introduction
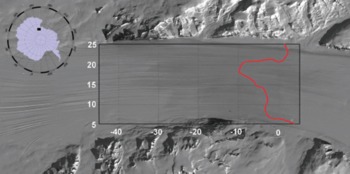
Byrd Glacier, named after Rear Admiral Richard E. Byrd, is the largest of a dozen outlet glaciers draining ice originating on the East Antarctic plateau into the Ross Ice Shelf. Its catchment basin covers an area of ~1070400 km2 and this ice is funneled into a ~20 km wide and ~100 km long fjord before diverging onto the ice shelf (Fig. 1). Byrd, as well as other glaciers transecting the Transantarctic Mountains, represents the transition from sheet-style flow in East Antarctica to ice-shelf spreading, but the nature of this transition remains poorly understood. Reference Scofield, Fastook and HughesScofield and others (1991) argue that the glacier bed is frozen and the driving stress is primarily balanced by basal drag. Reference Reusch and HughesReusch and Hughes (2003), on the other hand, model the flow transition by introducing a basal buoyancy factor that ranges from 0 in the interior to 1 on a floating ice shelf. Reference Truffer and EchelmeyerTruffer and Echelmeyer (2003) classify Byrd Glacier as an outlet glacier, rather than falling somewhere in the spectrum ranging from ice stream (high speeds and low driving stress, narrow lateral shear margins; e.g. Whillans Ice Stream, West Antarctica) to isbræ (high speeds achieved under high driving stress, wide lateral shear margins; e.g. Jakobshavn Isbræ, West Greenland). By their definition, an outlet glacier drains an ice sheet through a deep bedrock channel.
Byrd Glacier has a comparatively long history of quantitative glaciological investigations, starting with surface-based velocity measurements during the years 1960–62 (Reference SwithinbankSwithinbank, 1963). Seven glaciers draining into the Ross Ice Shelf were surveyed during that campaign. Of these, Byrd was found to be the fastest-moving, with a speed near its center line of 840 ± 80 m a–1. Based on the measured velocity transect across the mouth of Byrd Glacier, Reference SwithinbankSwithinbank (1963) estimated an annual discharge of 19 km3 a–1, which is remarkably close to the more recent estimate of 22.32 ± 1.72 km3 a–1 (Reference StearnsStearns, 2011). Reference Hughes and FastookHughes and Fastook (1981) present surface speeds and elevations obtained from ground surveys in 1978–79. Their along-flow velocity profile shows velocity increasing down the fjord, reaching a maximum of ~880 m a–1 close to where the grounding line was estimated to be located, and slowing down as the ice diverges onto the ice shelf.
In 1978–79, repeat aerial photogrammetry was conducted to measure ice velocity and surface elevation (Reference BrecherBrecher, 1982, Reference Brecher1986). These data were used by Reference Whillans, Chen, Van der Veen and HughesWhillans and others (1989) to conduct a force-balance assessment, and are also used in the present study. The advent of satellite remote sensing greatly expanded the possibilities of determining ice velocities cost-effectively and without the need for elaborate field campaigns. The first study using Landsat imagery to measure glacier velocity on Byrd Glacier was Reference Lucchitta and FergusonLucchitta and Ferguson (1986). By measuring displacements of visible surface features on two images taken nearly 10 years apart, that study found velocities ranging from 750 to 800 m a–1 on the floating part beyond the grounding line, comparable to earlier studies. Since then, satellite remote sensing has become nearly routine and provided greater temporal coverage of ice velocity (Reference Stearns, Smith and HamiltonStearns and others, 2008; Reference StearnsStearns, 2011).
Over the half-century of velocity measurements on Byrd Glacier, no important changes have been observed, with the exception of a comparatively short-lived speed up of ~10% between December 2005 and February 2007, following drainage of two subglacial lakes in the catchment area (Reference Stearns, Smith and HamiltonStearns and others, 2008). Similar drainage events and consequent glacier accelerations may have occurred earlier but gone unnoticed. However, given that deceleration of Byrd Glacier coincided with the termination of the flood and refilling of the lakes by mid-2007, it is not clear what role such events play in the overall dynamics and stability of this glacier.
Location map of the lower trunk of Byrd Glacier. The rectangular box shows the region for which force balance is calculated with labels corresponding to the local coordinates (km). The red line represents the grounding line as determined from flotation. Ice flow is from left to right. The inset map shows the location of Byrd Glacier.
Several previous studies have addressed the dynamics of Byrd Glacier, including the comprehensive map-view assessment of balance of forces on the lower trunk by Reference Whillans, Chen, Van der Veen and HughesWhillans and others (1989) and Reference StearnsStearns (2007). Those studies, as well as subsequent studies, were limited by lack of detailed bed topography, relying on a single radar-derived profile along the glacier (Reference McIntyreMcIntyre, 1985).
During the 2011/12 austral summer, the Center for Remote Sensing of Ice Sheets (CReSIS) at the University of Kansas conducted extensive airborne radar sounding for mapping the bed under Byrd Glacier. The resulting bed map allows re-evaluation of results from earlier studies and an investigation into the bed topographic controls on ice flow; this is the primary objective of the present paper. To allow for comparison with the earlier study of Reference Whillans, Chen, Van der Veen and HughesWhillans and others (1989), the same velocity and elevation data derived from the late-1970s aerial photogrammetry are initially used to evaluate and interpret the various terms in the balance of forces. A secondary objective is to evaluate temporal changes in the balance of forces and, in particular, whether surface ‘waves’ identified by Reference Reusch and HughesReusch and Hughes (2003) are stationary or migrating along the glacier. For this, time series of velocity and surface elevation are used.
Force Balance
The force-balance technique was developed to evaluate forces controlling the flow of glaciers. The steps involved in the calculations are detailed in Reference Whillans, Chen, Van der Veen and HughesWhillans and others (1989) and Reference Van der VeenVan der Veen (2013, section 11.2). Below, only a brief summary is given.
In a map-view Cartesian (x, y) coordinate system, balance of forces requires that


The terms on the left-hand sides represent the driving stress, defined as
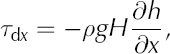

where ρ represents the ice density, g the gravitational acceleration, H the ice thickness, and h the elevation of the upper ice surface. This stress is responsible for making ice flow in the downslope direction and is resisted by drag at the glacier base τ bx, τ by, by gradients in longitudinal stress, and by friction at lateral margins (terms on the right-hand side of Eqns (1) and (2)).
Resistive stresses are calculated from strain rates using Glen’s flow law. In the hydrostatic approximation, bridging effects are neglected and the vertical resistive stress, Rzz , is set to zero. Then



with the strain rates, ε˙ ij, obtained from velocity gradients (Reference Van der VeenVan der Veen, 2013, section 3.3). Invoking incompressibility and omitting vertical shear strain rates, the effective strain rate is

The assumption is made that resistive stresses are constant through the ice thickness, which is tantamount to assuming ice flow is due to basal sliding or that vertical shear is concentrated in the basal ice layers. The value B = 600 kPa a⅓ is used for the viscosity parameter, corresponding to an ice temperature of –20°C. This value is slightly smaller than that used by Reference Whillans, Chen, Van der Veen and HughesWhillans and others (1989) and is appropriate for the upper colder and stiffer ice layers.
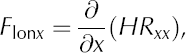
In previous studies, resistance to flow from gradients in longitudinal stress was defined as
and lateral drag as
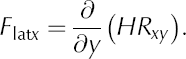
These definitions are somewhat confusing as they imply negative values where these terms provide resistance to flow (as opposed to positive values for basal drag). To be more consistent in the discussion of results, and for ease of interpretation, both terms are defined here as

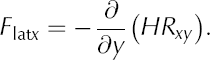
Force-balance calculations are performed using data gridded to a 1 km × 1 km grid with the x-axis directed in the approximate direction of ice flow. To minimize errors, spatial gradients are calculated over four grid spacings. Results are presented in a local flow-following coordinate system, defined at each gridpoint by the direction of the velocity vector. Because the geometry of the lower part of Byrd Glacier is relatively simple without important flowline turning, these results are very similar to those in the (x, y) coordinate system (Reference Van der VeenVan der Veen, 2013, section 11.2).
We follow the local coordinate system first used by Reference BrecherBrecher (1986) and adopted by Reference Whillans, Chen, Van der Veen and HughesWhillans and others (1989). The x-axis is horizontal and down-flow, with the origin near the grounding line; the y-axis is perpendicular to flow and positive grid-north. Data inputs for velocity, topography and elevation, which were originally in a Universal Transverse Mercator (UTM) projection (57° S), were rotated 35° west, with an origin of 80.5° S, 159° E.
Uncertainties in inferred basal drag can be estimated using the procedure outlined in Reference Van der VeenVan der Veen (2013, section 1.3). While these errors vary spatially, the maximum error is about ±75 kPa. For this reason, results for the floating part of the glacier are not discussed here because these errors dominate, with driving stress being small and basal drag zero. Some of the variations on the grounded part may be associated with measurement errors but we are confident that the general pattern is robust and real. Moreover, by considering force budget averaged over the width of the glacier, the error in basal drag is reduced to ±20 kPa or less.
Input Data
Surface elevation
In the 1978/79 austral summer, two aerial photogrammetric surveys were conducted over Byrd Glacier with the objective of determining surface elevations and ice displacements. Here we use 810 elevation measurements from the second survey to reconstruct the surface topography shown in Figure 2a. The estimated standard deviation of the gridded elevations is 9 m (Reference Whillans, Chen, Van der Veen and HughesWhillans and others, 1989).
For subsequent epochs, surface elevations are estimated using the rates of elevation change derived by Reference Schenk, Csatho, Van der Veen, Brecher, Ahn and YoonSchenk and others (2005) by comparing 2005 ICESat elevations with the 1978 topographic map from photogrammetry. Assuming these rates also apply to the period 2005–11, elevations at intermediate times (1988, 2006 and 2011) are obtained from linear interpolation.
Surface and bed elevation (standard deviation 9 m and 50 m respectively) and surface speed (standard deviation 50 m a−1) on the trunk of Byrd Glacier. The red line across the width of the glacier represents the estimated position of the grounding line based on the flotation criterion. The dark green line is the dynamic center line where the lateral shear stress is zero. Axis labels as in Figure 1.

Bed elevation
The bed topography used in this study (Fig. 2b) is the gridded bed map produced in early 2013 by CReSIS, based on airborne radar sounding conducted in 2011–12 (Reference GogineniGogineni and others, 2014). The fjord topography is dominated by a deep and relatively narrow trench that becomes shallower towards the grounding line. This trench may have resulted from preferential erosion along the Byrd Glacier discontinuity marking a major crustal-scale boundary in the Byrd depositional basin crossing the Ross Orogen (Reference StumpStump and others, 2004; Reference Carosi, Giacomini, Talarico and StumpCarosi and others, 2007).
From the ice thickness and bed topography, the height above buoyancy can be calculated. The grounding line is defined as the location where this quantity reaches zero, and is shown by the red line in all maps. This position agrees well with that determined by Reference HughesHughes (1979), Reference Rignot and JacobsRignot and Jacobs (2002), Reference Brunt, Fricker, Padman, Scambos and O’NeelBrunt and others (2010) and Reference Floricioiu, Jezek, Baessler and Abdel JaberFloricioiu and others (2012).
Surface velocity
Surface velocities were derived from repeat aerial photo-grammetry taken during the 1978/79 austral summer and spaced 56 days apart. Displacements of 601 common points were measured with an accuracy of 5 m (Reference BrecherBrecher, 1986), giving an estimated velocity error of 50 m a–1. The magnitude of surface velocity gridded to a 1 km grid is shown in Figure 2c.
To conduct force-balance assessments for more recent epochs, additional velocities are used from 1988, 2006 and 2011. To obtain ice velocities in 1988 and 2006, we apply a cross-correlation technique (Reference Scambos, Dutkiewicz, Wilson and BindschadlerScambos and others, 1992) to sequential visible images to track the displacement of surface features such as crevasses. Cloud-free, co-registered and orthorectified image pairs are input into the cross-correlation software, and operator-controlled settings allow for a range of displacement patterns. The technique is described in detail by Reference Stearns, Smith and HamiltonStearns and others (2008). In this study, we use Landsat Thematic Mapper (TM) scenes from 22 February 1988 and 8 February 1989; the velocity error for this epoch is 43 m a–1. Advanced Spaceborne Thermal Emission and Reflection Radiometer (ASTER) scenes from 5 December 2005 and 28 January 2007 are used to derive velocities for 2006, with an error of 20 m a–1. Velocities for the 2011 epoch are interferometric synthetic aperture radar (InSAR) velocities with an error of ~6 m a–1 (Rignot and others, 2011).
The dark green line in all map views represents the dynamic center line defined as where the lateral shear stress is zero. This line closely follows the basal trench but is somewhat displaced from the velocity maxima.
Force Balance: Along-Flow Direction
Basal drag
Results for the along-flow force-balance terms using the 1978 photogrammetric data are shown in Figure 3. As found by Reference Whillans, Chen, Van der Veen and HughesWhillans and others (1989), large variations in driving stress are reduced by gradients in longitudinal stress such that basal drag is spatially less variable. There are isolated regions of high basal drag, most notably in the middle of the glacier at x = –15 km, upstream of the grounding line. Adjacent to this sticky spot, basal drag becomes slightly negative. However, this negative value falls within the estimated uncertainty of ±75 kPa. The spatial pattern in basal drag is explored in more detail below.
Terms in the along-flow balance of forces: (a) driving stress, (b) basal drag, (c) lateral drag and (d) gradients in longitudinal stress. Axis labels as in Figure 1.

Lateral drag
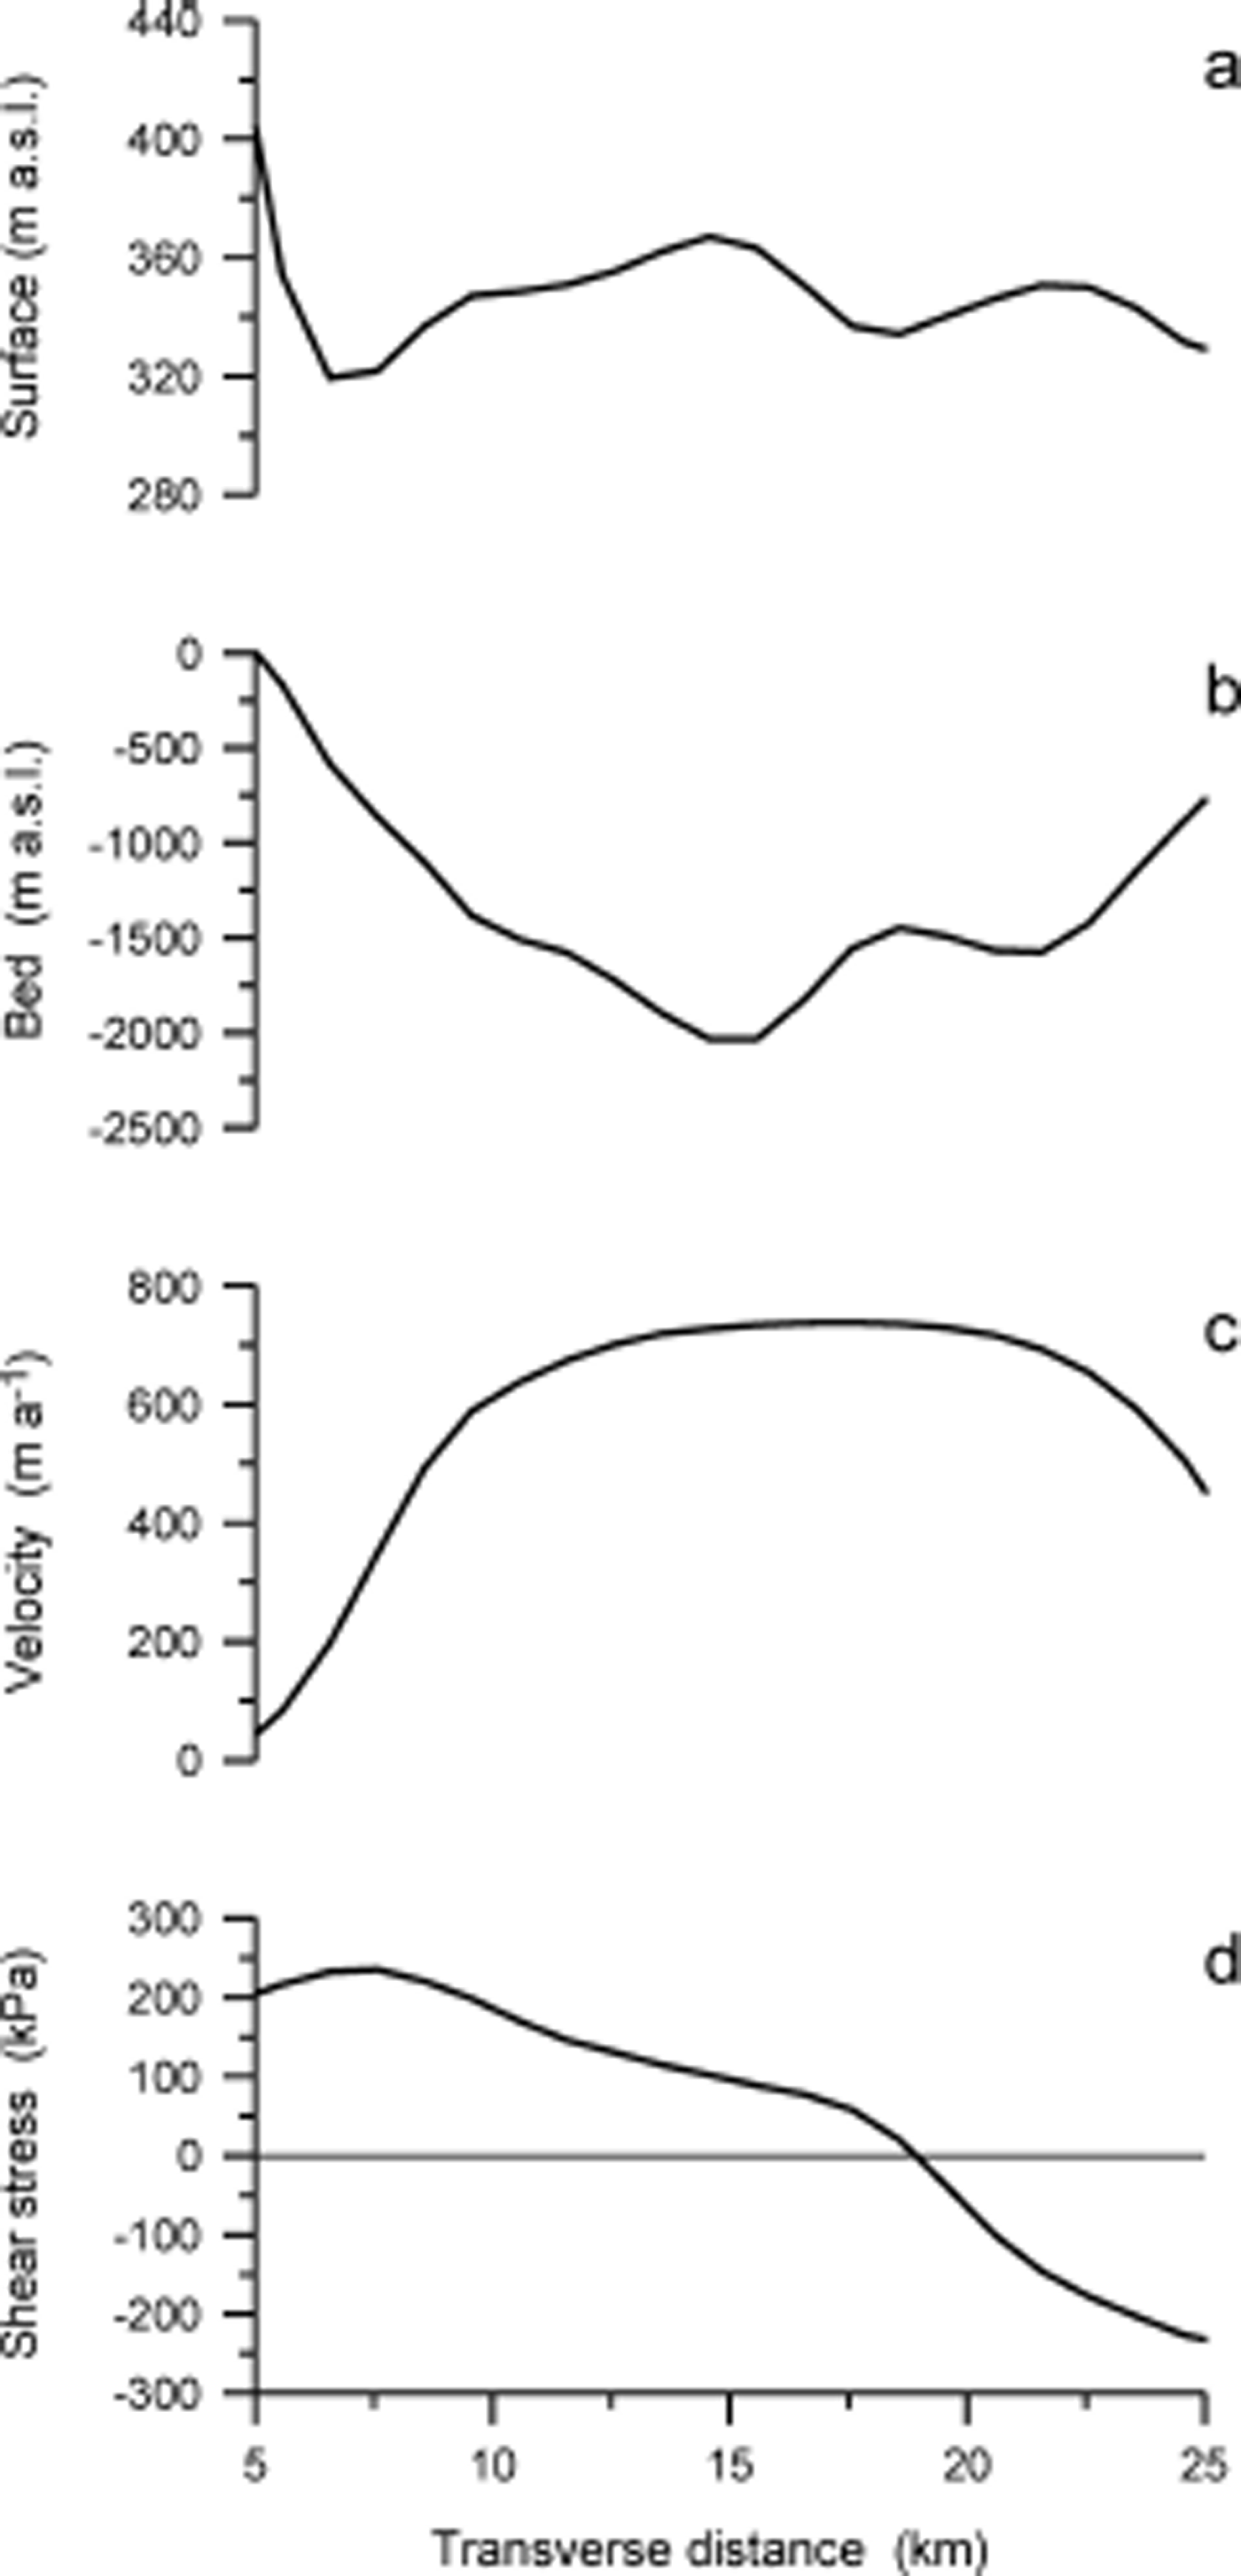
Flow resistance from lateral drag is greatest near the center of the glacier (Fig. 3c). A similar result was found by Reference Whillans, Chen, Van der Veen and HughesWhillans and others (1989) but those authors failed to provide an adequate explanation for this phenomenon. For a bed topography that varies little in the transverse direction, lateral drag would be expected to be equally important across the width of the glacier. However, as revealed by the new bed topography map, there are important variations in bed elevation (and thus in ice thickness) that cause lateral drag to be non-uniform. To investigate this issue in more detail, consider the transect at x = –20 km.
Figure 4 shows surface and bed elevation across the transect, as well as surface speed from which the lateral shear stress is derived. The shear stress decreases nearly linearly from +200 kPa at the right margin to –200 kPa at the opposite margin. Such a linear decrease would be expected if resistance to flow from lateral drag was equally important across the glacier. The width-averaged lateral drag can be estimated from (Reference Van der VeenVan der Veen, 2013, section 4.4)
(a) Surface elevation, (b) bed elevation, (c) surface velocity and (d) shear stress, Rxy , across the transect at x = –20 km.

where y = ±W denotes the positions of the two lateral margins. For this transect, this gives  kPa.
kPa.
Expanding the definition in Eqn (12) of lateral drag as

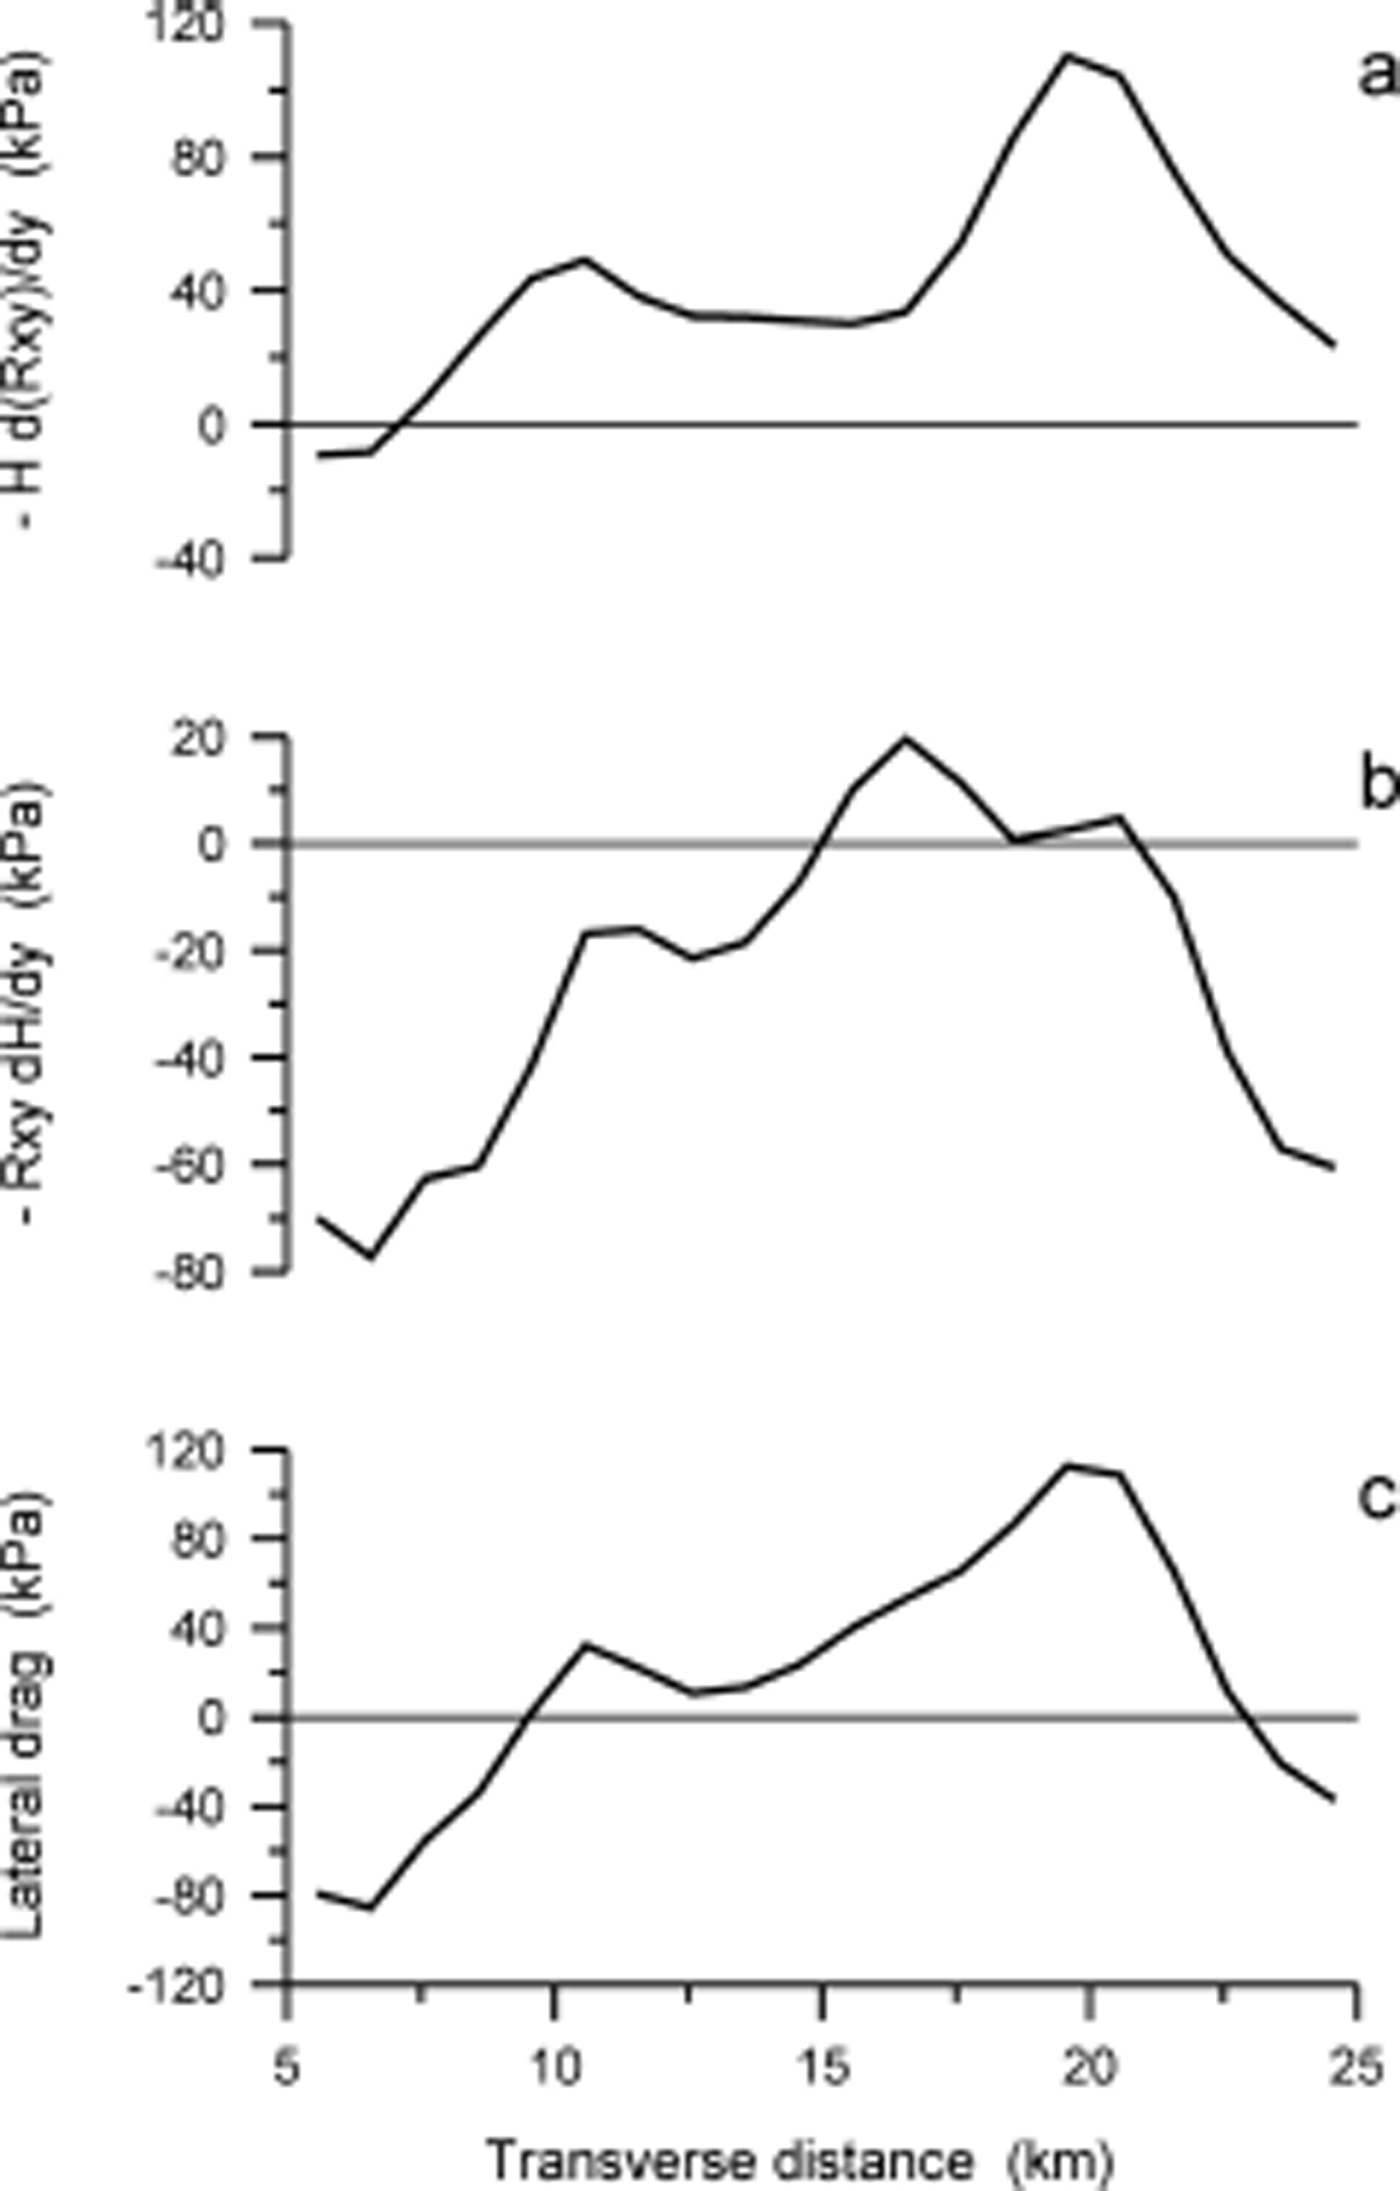
shows that two processes contribute to this resistive term, namely transverse gradients in the shear stress (first term on the right-hand side) and a geometric effect caused by pronounced bed topography. Both terms are shown in Figure 5. The shearing term is positive except close to the right margin, indicating resistance to flow. The geometry term, on the other hand, is mostly negative and thus acting in cooperation with the driving stress. In essence, the thicker ice in the channel is dragging thinner outboard ice along. As a result, the sum of both terms becomes negative close to both margins.
Lateral drag across the transect at x = –23 km. (a) Contribution from transverse gradients in the shear stress; (b) geometric contribution; and (c) net resistance to flow from lateral drag at each location along the transect.
Gradients in longitudinal stress
The role of gradients in longitudinal stress is limited to small areas where this term counters large variations in driving stress such that basal drag is more uniform (Fig. 3). This becomes apparent when considering force balance averaged over the width of the glacier. Figure 6 shows the width-averaged geometry and Figure 7 the force-balance terms.
Width-averaged (a) surface elevation, (b) bed elevation and (c) surface velocity along the trunk of Byrd Glacier.

Terms in the width-averaged along-flow balance of forces: (a) driving stress, (b) gradients in longitudinal stress, (c) lateral drag and (d) basal drag.
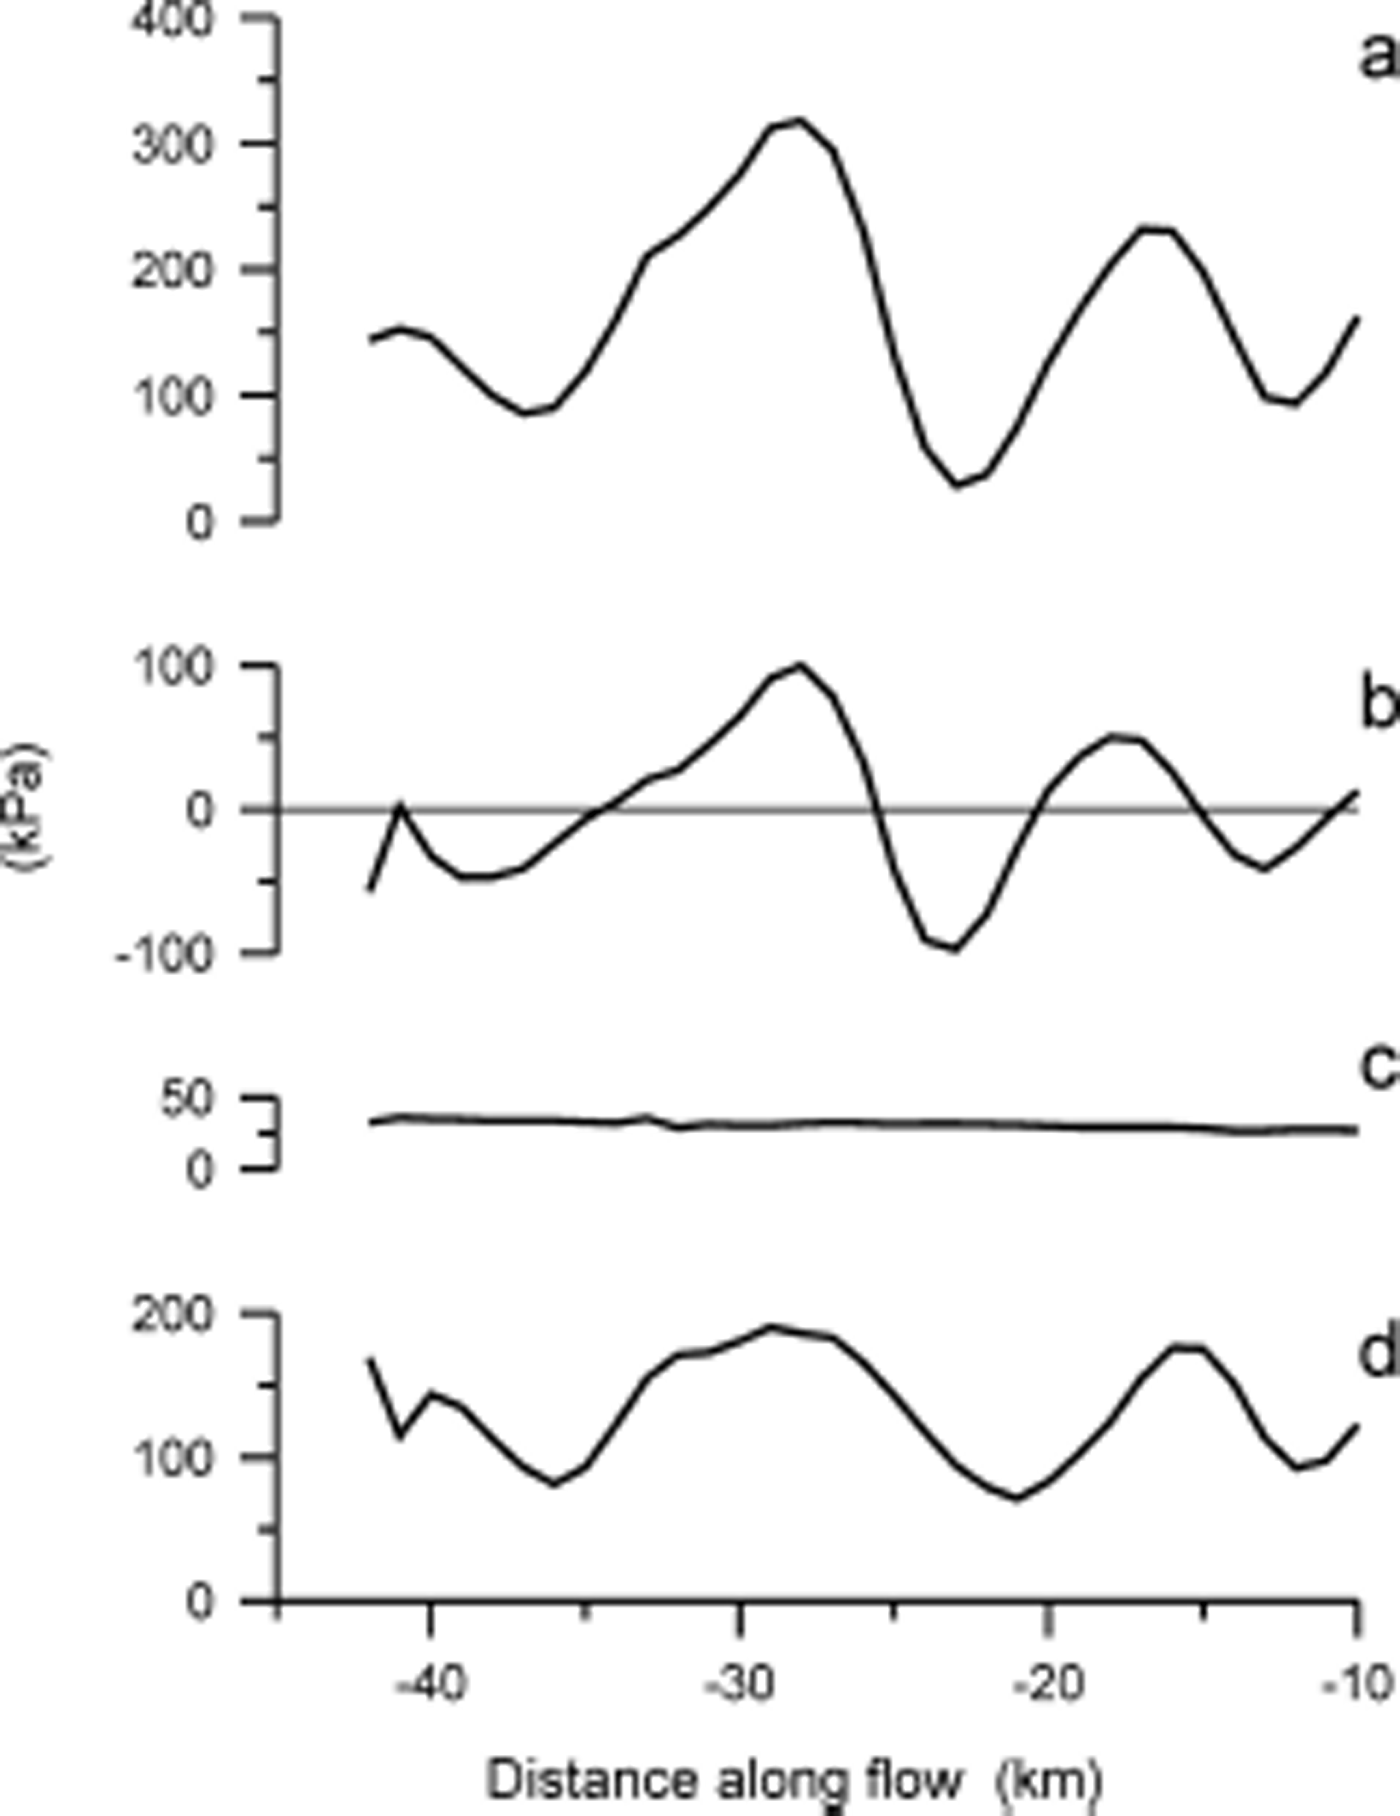
From x = –28 km to x = –23 km the driving stress varies by ~300 kPa over a distance of ~5 km. At x > –23 km the driving stress is near zero, at the down-flow end of a plateau in bed topography. The curve for gradients in longitudinal stress closely follows that of driving stress, alternating between negative (acting in the same sense as the driving stress) and positive (resisting the driving stress) values, partly compensating for variations in driving stress. Averaged over the length of the lower trunk, however, these positive and negative values largely cancel and longitudinal stress gradients do not contribute greatly to the large-scale balance of forces. Lateral drag decreases slightly in the direction of flow, from 36 kPa at –42 km to 27 kPa in the grounding zone (–10 km) and on average provides ~20% of flow resistance; the remainder (~80%) of flow resistance along the segment is associated with basal drag.
Temporal changes
To investigate whether the pronounced peaks in driving stress and corresponding variations in basal resistance are stationary or migrating, force balance is evaluated for three additional times (1988, 2006 and 2011). As shown in Figure 8 the minimum in driving stress at –23 km increased as the local surface flattened over the period 1978–2011. Otherwise, the pattern of driving stress remained stationary. Given the grid spacing used in the calculations (1 km), the small shift in basal drag maxima and minima is not very significant.
Width-averaged (a) driving stress and (b) basal drag along the trunk of Byrd Glacier, calculated for four epochs.
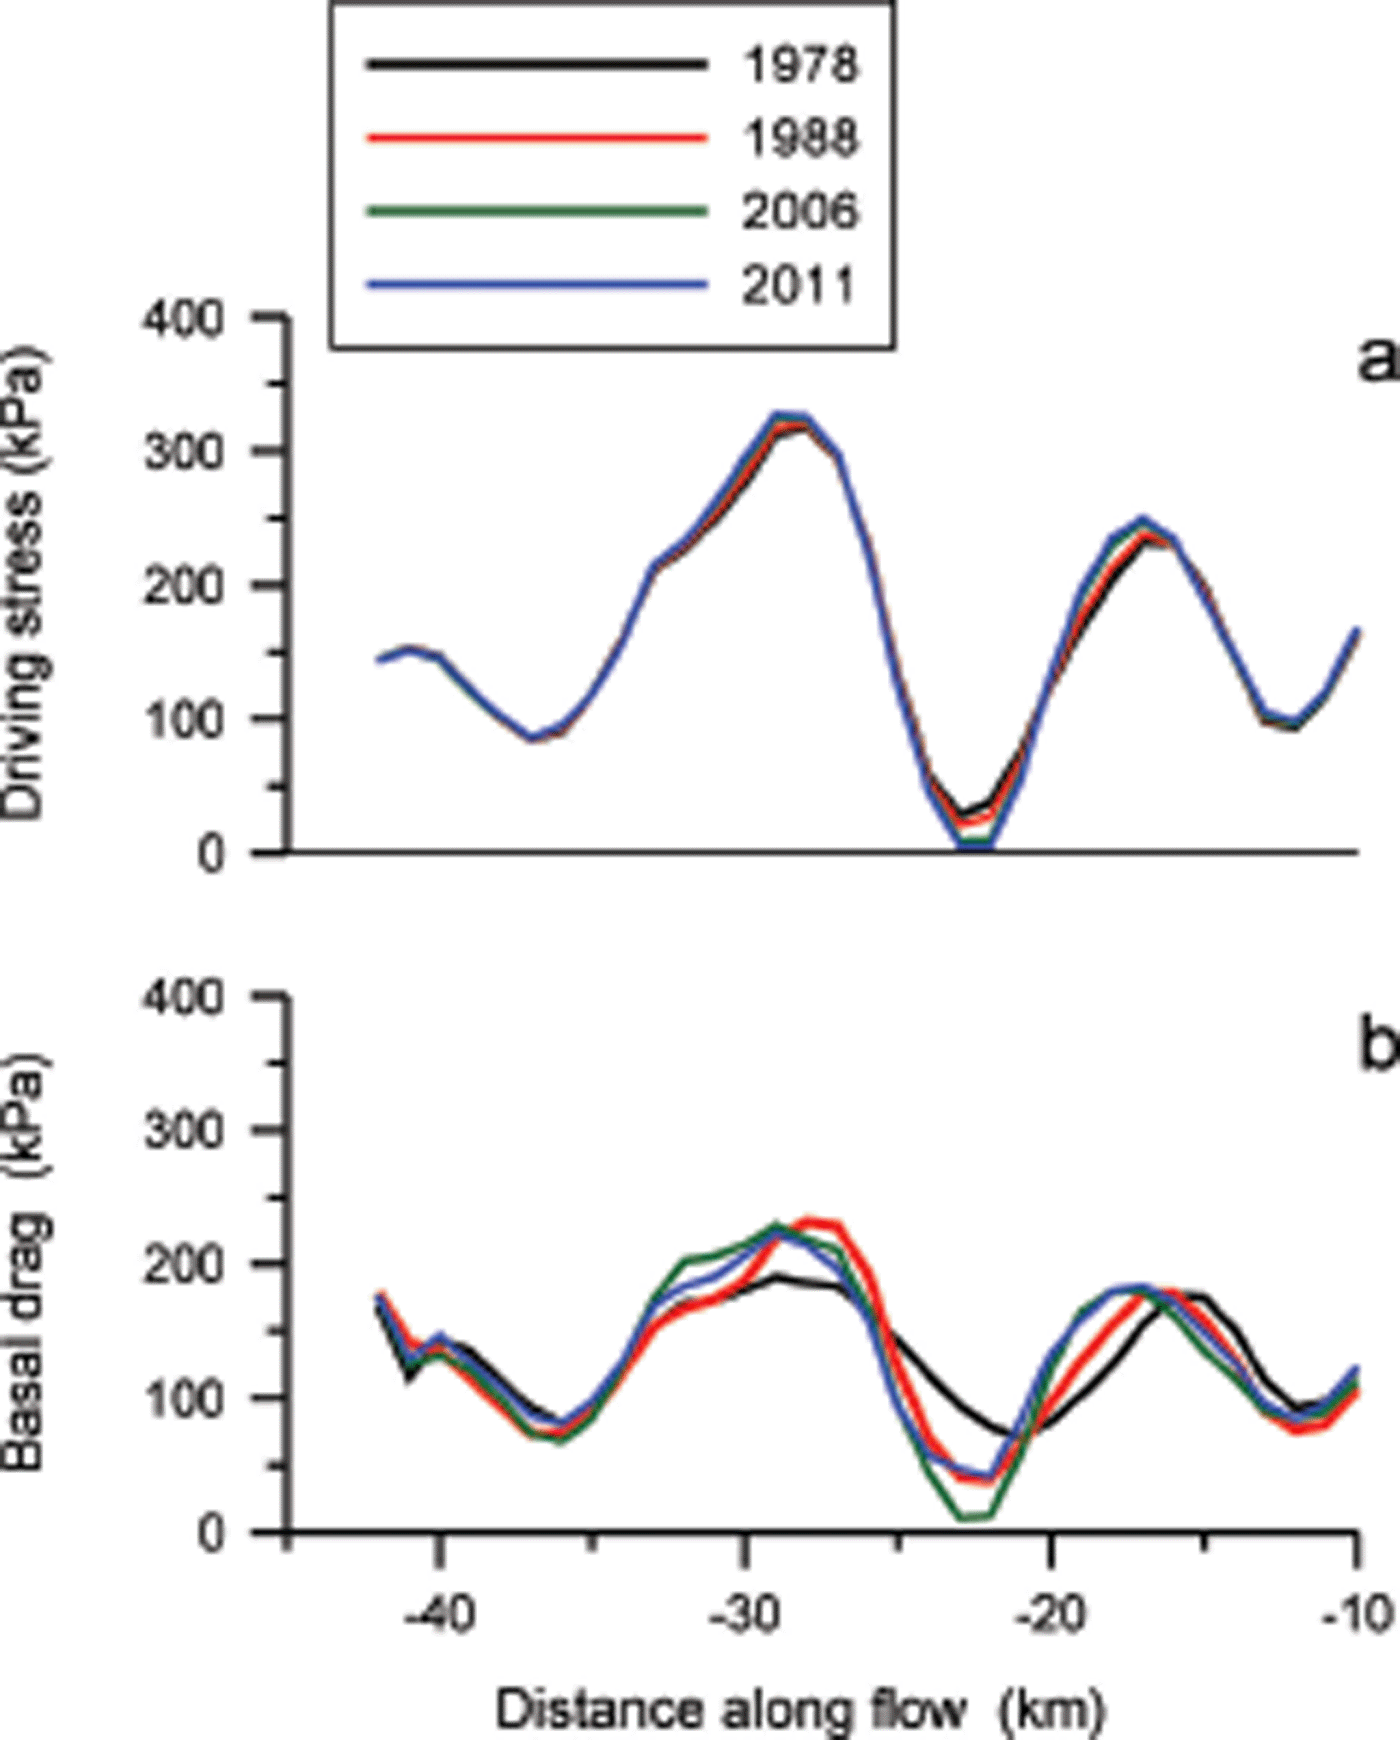
Reference Reusch and HughesReusch and Hughes (2003) propose that the variations in driving stress – which they term surface ‘waves’ – reflect variations in bed coupling rather than being caused by bed topography. Reference Sergienko and HindmarshSergienko and Hindmarsh (2013) observed similar ribbed-like patterns in basal resistance on Pine Island and Thwaites Glaciers, West Antarctica, co-located with local highs and lows in the hydraulic potential gradient, leading these authors to suggest that drainage of subglacial water may control the location and evolution of regions’ high basal drag. To explore whether the basal drag variations on Byrd Glacier are similarly related to subglacial water drainage, consider the pressure gradient driving discharge of water under the glacier.
Following Reference Sergienko and HindmarshSergienko and Hindmarsh (2013) the hydraulic pressure gradient is calculated from
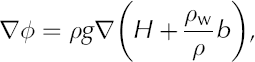
where b represents the elevation of the bed (b < 0 if below sea level) and ρ w the density of water. The term in parentheses represents the height above buoyancy, and the assumption is made that a full and easy drainage connection to the adjacent ocean exists (Reference Van der VeenVan der Veen, 2013, section 7.4). As shown in Figure 9a, maxima in driving stress coincide with maxima in the hydraulic gradient, supporting the hypothesis that basal drag variations are associated with subglacial drainage. It should be noted, however, that it remains unresolved whether subglacial drainage patterns and associated spatial variations in effective basal pressure are the cause of the pattern in basal resistance, or vice versa.
(a) Width-averaged driving stress (black curve, scale on left) and gradient in hydraulic pressure (red curve, scale on right) along the trunk of Byrd Glacier; both quantities are normalized by dividing by their respective average values. (b) Normalized width-averaged surface slope (black curve) and bed slope (red curve).
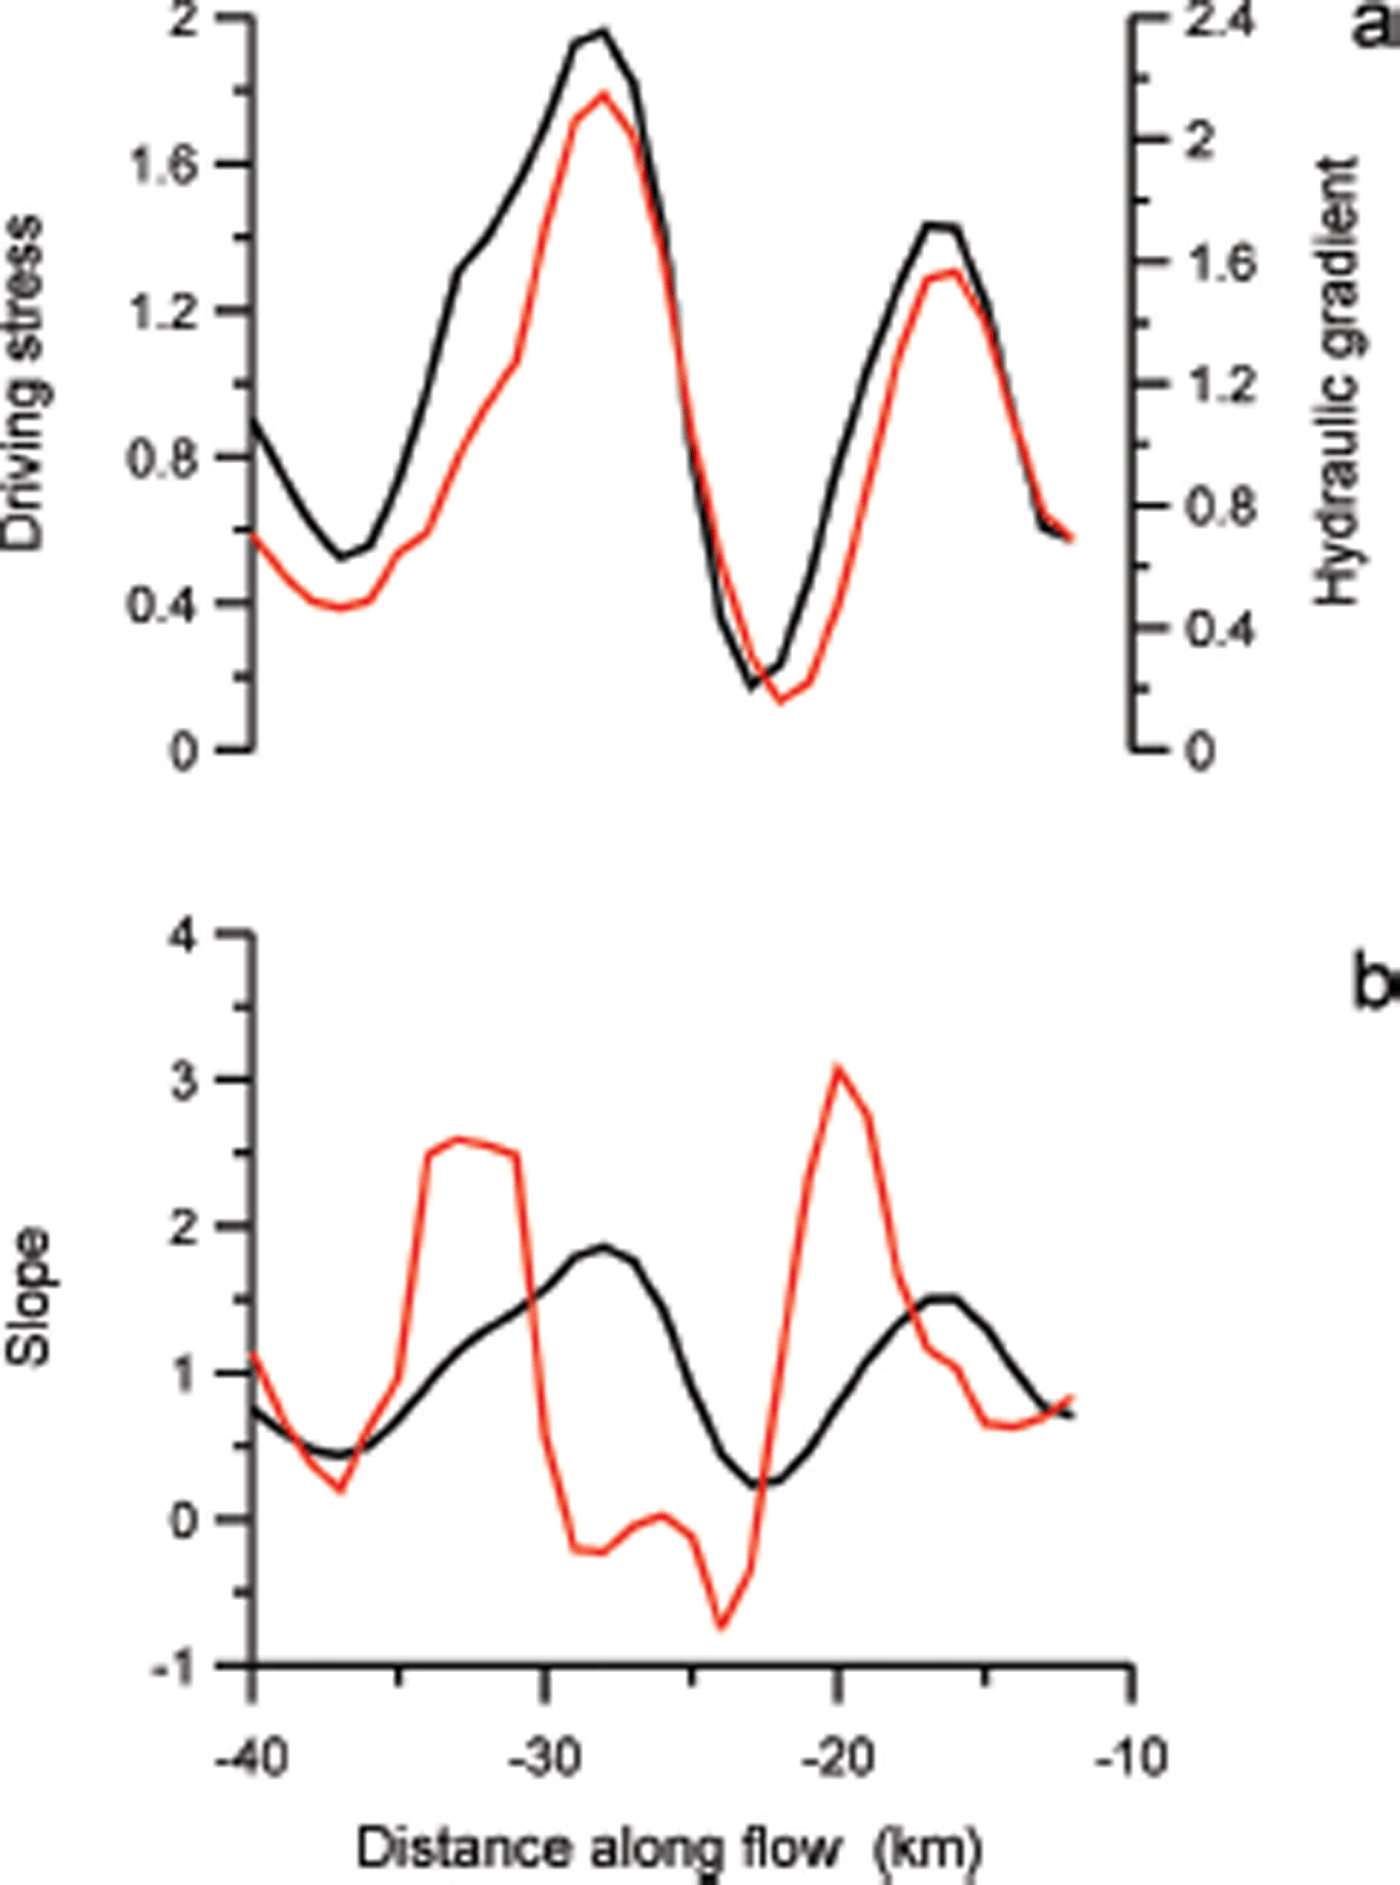
As noted by Reference Sergienko and HindmarshSergienko and Hindmarsh (2013), the co-location of highs and lows in hydraulic potential gradient and in basal resistance was to be expected because the contribution of surface slope to gradient in hydraulic potential is about ten times the contribution associated with bed slope (Reference ShreveShreve, 1972; Reference Cuffey and PatersonCuffey and Paterson, 2010, p. 196). Thus, a high gradient will occur where the driving stress – and consequently basal drag – is large, and the spatial commonality between the two patterns may not reflect causality. To investigate whether variations in driving stress are linked to bed topography, Figure 9b shows surface and bed slopes. These graphs suggest that a correlation exists with highs in surface slope displaced several kilometers down-flow of a corresponding peak in bed slope. Regression of the surface slope shifted over 5 km against the bed slope yields a correlation coefficient R 2 = 0.51.
Basal sliding
In calculating the force-balance terms, the assumption is made that the horizontal resistive stresses, Rxx and Rxy , are constant throughout the ice thickness and can be estimated from surface velocities. This would be correct if all motion was associated with basal sliding, or vertical velocity shear was concentrated in a comparatively shallow basal layer. If depth variation is important, these stresses will be smaller at depth, and flow resistance associated with gradients in longitudinal stress and lateral drag will be less as well, and basal drag closer to the driving stress. To investigate whether there is significant velocity variation with depth, consider the velocity component due to internal deformation.
In first approximation, the deformational component of velocity can be estimated using the lamellar flow model (Reference Van der VeenVan der Veen, 2013, section 4.2) giving
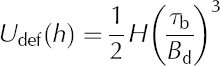
for the surface velocity. Because most vertical shear is concentrated in the deeper ice layers, a smaller value corresponding to warmer ice should be used for the viscosity parameter, B d, than used in the force-balance equations. The value B d = 270 kPa a⅓ corresponding to a temperature of ~–5°C is used here, this being the smallest value allowable as dictated by the requirement that the surface speed estimated from Eqn (16) cannot exceed the measured surface speed.
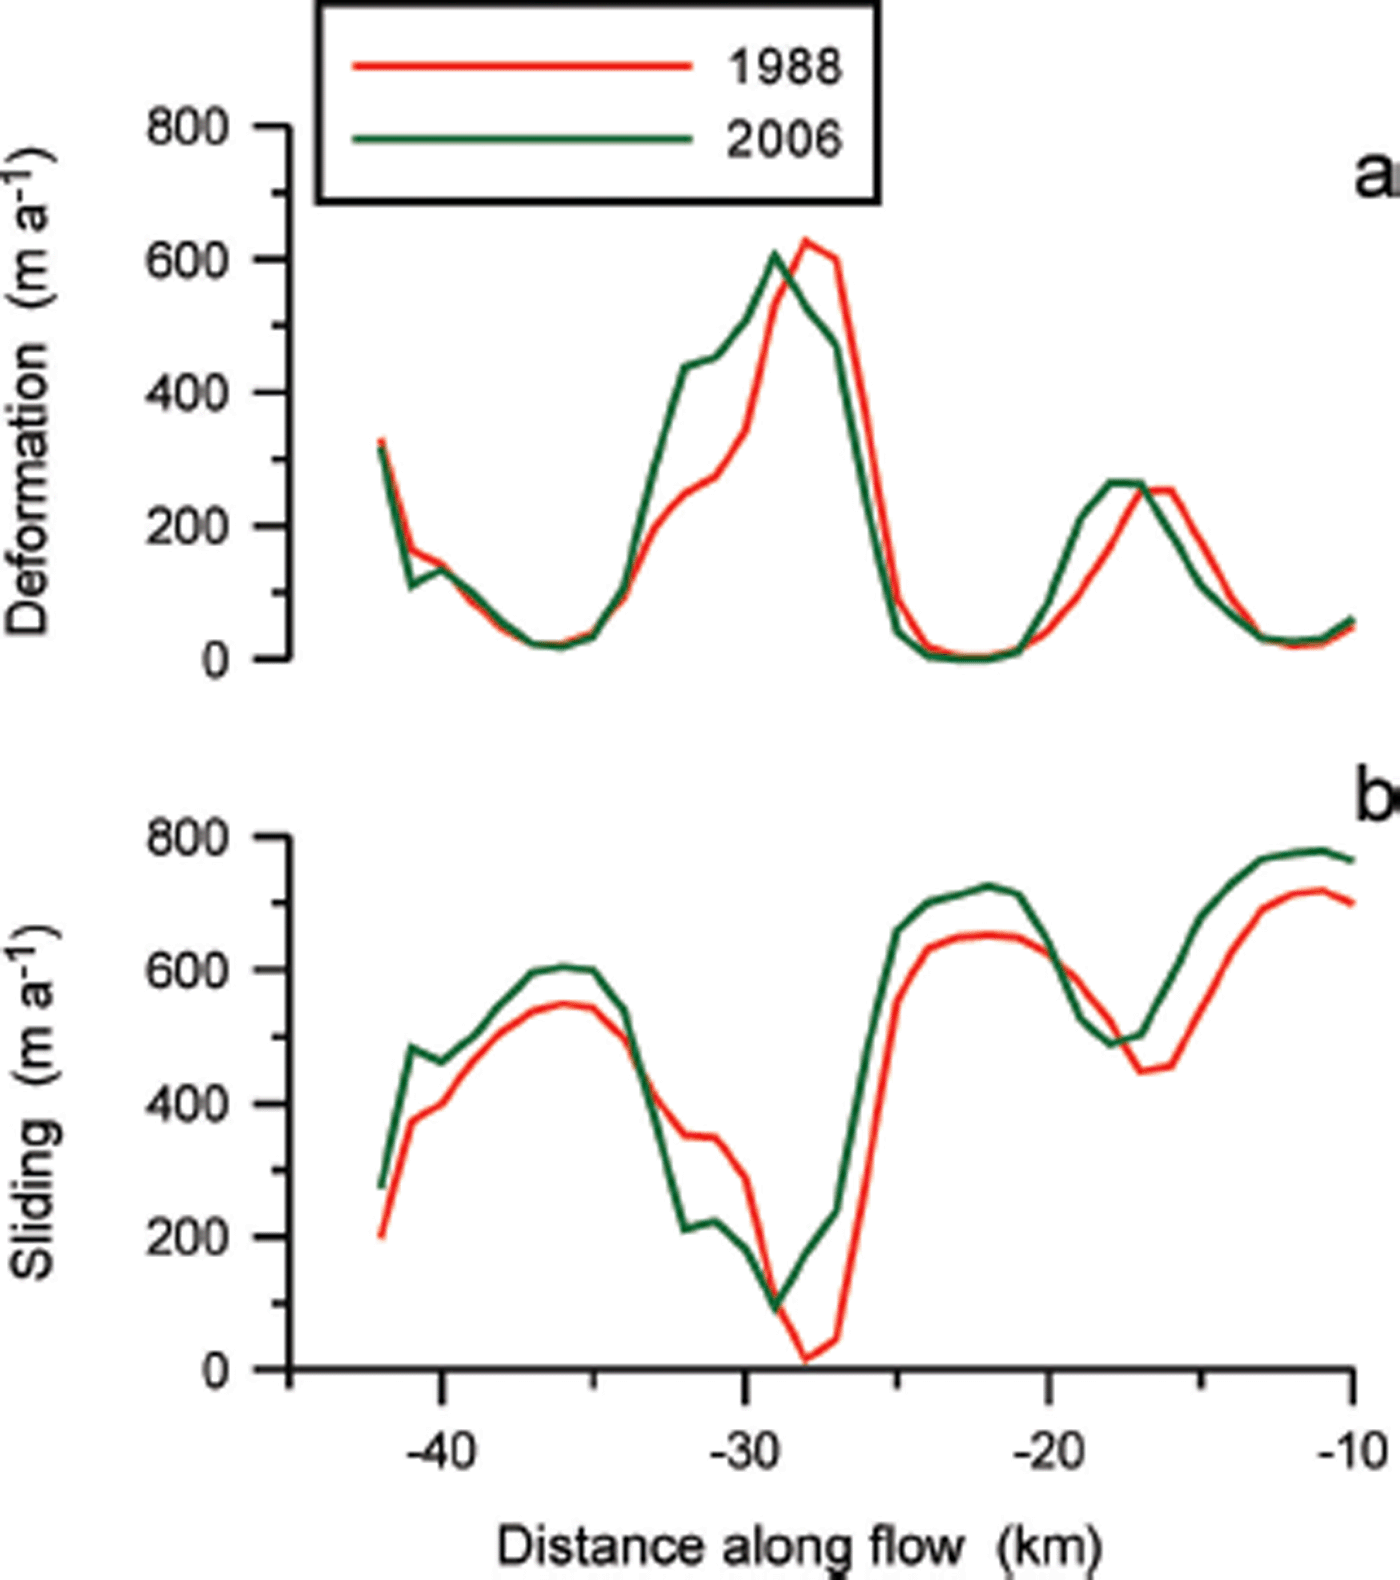
Partitioning of flow between deformation and sliding is shown in Figure 10. As expected, the curve of deformational velocity closely reflects that of basal drag, with maxima at the locations of the sticky spots. Because the observed surface velocity varies smoothly in the flow direction, there are large concomitant spatial variations in the sliding velocity. These large fluctuations in partitioning of sliding and internal deformation seem to be unrealistic and can be significantly reduced by choosing a greater value for B d. For example, B d = 600 kPa a⅓ yields a maximum deformational velocity of 57 m a–1 (at –28 km) and almost all discharge is due to basal sliding. Such a large value for the viscosity parameter corresponds to very cold basal ice, which appears to be irreconcilable with a large sliding component. Nevertheless, continuity considerations also suggest that internal deformation is rather small, even at the locations of large basal drag.
Partitioning of surface velocity between internal deformation calculated from (a) lamellar-flow theory and (b) basal sliding.
Averaged over the width, W, of the glacier, the continuity equation reads

with Q = HUW the ice flux and M the surface mass balance (Reference Van der VeenVan der Veen, 2013, section 9.4). This equation can be solved for the balance velocity using the width-averaged rates of elevation change from Reference Schenk, Csatho, Van der Veen, Brecher, Ahn and YoonSchenk and others (2005) and M = –0.25 m a–1 (Reference Ligtenberg, Lenaerts, Van den Broeke and ScambosLigtenberg and others, 2014). At the upstream end of the flowline (x = –42 km) the ice flux is calculated making the assumption that all flow is due to basal sliding and the sliding velocity equals the measured surface speed. Figure 11a shows the measured surface speed (1988) and the depth-averaged balance velocity.
(a) Measured surface velocity (black curve) and depth-averaged balance velocity (red curve). (b) Depth-averaged deformational velocity (red curve) and sliding velocity (blue curve) inferred from continuity and measured surface velocity.

The balance velocity,  , is the sum of basal sliding, U
s, and the depth-averaged velocity from internal deformation,
, is the sum of basal sliding, U
s, and the depth-averaged velocity from internal deformation,  :
:

For lamellar flow, the depth-averaged velocity equals 4/5 of the surface velocity. Denoting the measured surface velocity as U m(h), this gives a second equation,

The set of two equations (18) and (19) contains two unknowns and thus can be solved to find the deformational and sliding components of the total ice velocity. The result is shown in Figure 11b and indicates that the deformational component is small compared with the sliding speed. Thus, flow of Byrd Glacier is accommodated mostly by basal sliding. This finding justifies a posteriori neglecting vertical variation in the horizontal resistive stresses in the force-balance calculations.
Force Balance: Across-Flow Direction
Force-balance terms in the local across-flow direction are shown in Figure 12. There is a significant surface slope in the across-flow direction, resulting in regions where the component of basal drag in this direction is nonzero, most notably at the location of the sticky spot upstream of the grounding line identified in Figure 3b. In the absence of a velocity in this direction (by definition of the local flow-following coordinate system), this result is difficult to understand.
Terms in the across-flow balance of forces: (a) driving stress, (b) basal drag, (c) lateral drag and (d) gradients in longitudinal stress. Axis labels as in Figure 1.

Formally, basal drag is defined to include all basal resistance, and

where z = b denotes the bed elevation (Reference Van der VeenVan der Veen, 2013, p. 49). Thus, it could be that transverse basal drag is induced by basal topography through the form drag terms (last two terms on the right-hand side). This is not the case, however, as illustrated in Figure 13, which shows the contributions to the across-flow component of basal drag associated with the transverse and along-flow bed slope. The magnitude of both terms is too small to explain the large inferred values of basal drag shown in Figure 12d.
Contributions to the across-flow component of basal drag associated with (a) transverse bed slope and (b) along-flow bed slope. Axis labels as in Figure 1.

It could be that the nonzero component of basal drag in the across-flow direction points to spatial variations in ice strength. In the calculations, the viscosity parameter is taken constant on the glacier (B = 600 kPa a1/3). There may be localized regions where the ice is softer or stronger than elsewhere. To be fully correct, investigating this procedure would involve iteratively solving for the viscosity parameter as was done by Reference Larour, Rignot, Joughin and AubryLarour and others (2005) on the Ronne Ice Shelf. As a start, we seek an enhancement factor that reduces the cross-flow basal drag to near zero, using the results obtained above. This approximation excludes the effect of a spatially varying viscosity parameter on stress gradients but is sufficient for exploratory purposes. For the region of high transverse basal drag just upstream of the grounding line the viscosity parameter is too large by a factor of ~4 where basal drag is most negative, and too small by a factor of ~2 where basal drag is most positive.
A counter-argument to the model invoking spatial variations in ice strength is that the anomalous pattern is stationary. Basal drag in the transverse direction is primarily due to corresponding variations in the driving stress. Figure 14 shows maps of the across-flow component of driving stress for three different times covering the period 1988–2011. While there are small variations between the maps, which may be partly attributed to different techniques used to reconstruct the various surface elevation maps, the general pattern remained the same. Over the 33 year interval, the ice near the center moved a distance of ~23 km. It is difficult to comprehend how ice can undergo sequential softening and hardening as it advects down-glacier, while the overall pattern of strength variations remains spatially stationary.
Across-flow component of driving stress in (a) 1988, (b) 2006 and (c) 2011. Axis labels as in Figure 1.

Based on force-balance calculations that account for vertical variations in ice velocity, Reference Whillans, Chen, Van der Veen and HughesWhillans and others (1989) conclude that the isotropic flow law is inadequate as it leads to unreasonable velocities at depth and velocity variations. Constitutive relations other than Glen’s flow law have been proposed (Reference Man and SunMan and Sun, 1987; Reference Goldsby and KohlstedtGoldsby and Kohlstedt, 2001). Changing the exponent in Glen’s law to n = 1 (which in first order approximates the Goldsby–Kohlstedt flow law) has no important effect on calculated basal drag, and the general pattern shown in Figures 3 and 12 persists. Similarly, including normal-stress effects in the flow law following the approach adopted by Van der Veen and Whillans (1990) for flow along the Dye-3 strain network has minimal effect on the calculated patterns of basal drag.
Thus, it must be concluded that across-flow variations in driving stress are linked with spatially varying conditions at the glacier bed, either resulting from small-scale topography or from changes in basal slipperiness. This situation is not unique to Byrd Glacier; for example, we find similar small-scale variations on Helheim and Kangerlussuaq glaciers in East Greenland.
Discussion
The force-balance results obtained in this study raise several interesting questions about the flow of Byrd Glacier. First, the across-flow component of basal drag is perplexing, yet appears not to be an isolated phenomenon; similar patterns are observed on other glaciers. This transverse basal resistance is associated with transverse variations in surface elevation, resulting in a significant component of basal drag in that direction. The stationarity of these elevations strongly suggests that these are not caused by spatial variations in ice strength but, rather, are linked to basal conditions.
Reference Hulbe and WhillansHulbe and Whillans (1994) discuss deformation patterns within a 25 km × 10 km strain grid on Whillans Ice Stream (former Ice Stream B), and surveyed using kinematic GPS. While that study did not include an assessment of forces and, in particular, of basal drag, the map of surface topography shows topographic highs and lows aligned approximately in the direction of flow, resulting in surface slopes in the direction perpendicular to flow. As these authors note, any disturbance in the surface would be expected to relax towards a state of constant gravitational potential, which should be reflected in the patterns of surface strain rates, with tensile horizontal strain rates in the vicinity of topographic highs and more compressive strain rates near topographic valleys. Because the surface features are predominantly in the along-flow direction, surface relaxation should be expressed mostly in the transverse normal strain rates (Reference Hulbe and WhillansHulbe and Whillans, 1994), or, equivalently, lead to gradients in longitudinal stress in the transverse direction. For the strain grid considered, this is not the case, however, and there is a significant topographic residual, i.e. topographic relief that is not relaxing (Reference Hulbe and WhillansHulbe and Whillans, 1994, Fig. 4), associated with stationary bed features causing small-scale flow disturbances.
The surface topographic features on Byrd Glacier (as well as on other glaciers) are similar to those described by Reference Hulbe and WhillansHulbe and Whillans (1994) in that they are mostly aligned with the direction of ice flow and of limited extent in the transverse direction. Their stationarity indicates that these features reflect flow disturbances caused by stationary bed features. Reference Hulbe and WhillansHulbe and Whillans (1994) draw an analogy with a submerged boulder in a river: while some of the water will flow over the boulder, most water will be deflected to the sides and converge in the lee of the boulder.
Theory (Reference ReehReeh, 1987) as well as numerical modeling experiments (Reference SergienkoSergienko, 2012) suggest that isolated basal protuberances distort the flow pattern, resulting in transverse elevation variations and velocity perturbations. Investigating this possibility would require high-resolution velocity maps. The spatial resolution of the velocity data available for this study is insufficient to investigate the occurrence of small-scale velocity perturbations on Byrd Glacier. Moreover, the estimated uncertainty in derived velocities ranges from 6 m a–1 for the InSAR-derived velocities, to 43 m a–1 for the 1988/89 ASTER-derived velocities. Together, these limitations preclude examination of velocity perturbations on spatial scales smaller than a few kilometers.
Localized flow disturbances could also be associated with regions of the bed with greater than average friction (a ‘sandpaper patch’: Reference Hulbe and WhillansHulbe and Whillans, 1994). This model is not supported by the results of the force-balance calculations. A scatter plot (not shown here) of the across-flow component of basal drag against the component in the flow direction does not show any correlation, thus the regions of significant transverse basal resistance do not coincide with locations where the basal resistance in the flow direction is large.
Considering balance of forces in the flow direction, a striking feature is the wave-like pattern in basal drag, caused by variations in the driving stress. This pattern is stationary over the time period considered in this study, and bears close resemblance to the rib-like pattern in basal resistance found by Reference Sergienko and HindmarshSergienko and Hindmarsh (2013) on Pine Island and Thwaites Glaciers. Those authors suggest that the ribbing may result from an instability in the coupling between the glacier and its basal environment. In essence, they suggest that these ribs or waves are initiated where coupling between the ice and the bed is low, and the effective basal pressure is low. Over time, the instability evolves, leading to an increased gradient in effective pressure. The difficulty with this model is that, on Byrd Glacier, the pattern of basal drag remained spatially fixed, despite a subglacial flooding event following sudden drainage of two subglacial lakes in the catchment area.
From a mass continuity perspective, variations in the along-flow velocity are readily explained. Referring to Figures 6 and 7, as the ice enters the lower trunk, the bed slopes upward and, to maintain discharge, the velocity must increase. At x = –30 km, the ice encounters a 10 km-long plateau in bed topography, and the velocity remains level over this distance. Approaching the grounding line, the bed again slopes upward, resulting in a further increase in velocity. These along-flow variations in velocity are achieved through local adjustments in surface slope and driving stress.
Modeling experiments we conducted with a flowband model that includes calculation of gradients in longitudinal stress indicate that highs and lows in driving stress required to maintain flux continuity over an irregular bed topography are balanced locally by gradients in longitudinal stress, such that basal drag remains fairly uniform. On Byrd Glacier, small-scale variations in driving stress are only partially balanced by longitudinal stress gradients, resulting in the wave-like pattern in basal drag. This indicates that there must be spatial variations in basal conditions, such as local fluctuations in effective basal pressure, as suggested by Reference Sergienko and HindmarshSergienko and Hindmarsh (2013), or local variations in bed roughness possibly resulting from differential erosion rates. There are insufficient data available to test either of these hypotheses.
Using continuity arguments to estimate the partitioning of ice flow between sliding and internal deformation shows that basal sliding is the main contributor to ice flow. Surprisingly, internal deformation must be relatively small even in the regions where basal drag is large. This suggests that the basal ice must be very stiff with respect to the vertical shear stress. This could indicate a preferred crystal-orientation fabric. Alternatively, the basal ice could be debris-laden, although experiments are ambiguous as to how debris content affects the strength of ice (Reference Hooke, Dahlin and KauperHooke and others, 1972; Reference Fitzsimons, McManus and LorrainFitzsimons and others, 1999; Reference IversonIverson and others, 2003; Reference Jacka, Donoghue, Li, Budd and AndersenJacka and others, 2003).
It is tempting to speculate about the stability of the grounding line of Byrd Glacier, especially considering the region of high basal resistance just up-glacier of the grounding line (Fig. 3) and the reverse bed slope (sloping down towards the interior). It is generally accepted that such a geometry is inherently unstable, and a perturbation at the grounding line will result in unstable advance or retreat (Church and others, 2013). The argument is based on mass-balance considerations: an increase in ice flux will cause local thinning, resulting in grounding-line retreat into deeper water. Because the ice flux is proportional to the local thickness raised to some power (Reference SchoofSchoof, 2007), retreat will cause the discharge flux to increase, resulting in further retreat. Byrd Glacier did not exhibit such behavior following the 10% increase in ice flux between December 2005 and February 2007, in response to drainage of two subglacial lakes in the catchment area (Reference Stearns, Smith and HamiltonStearns and others, 2008). Instead, this event appeared to have been short-lived with no consequences for the glacier. Because balance of forces did not change appreciably during the speed-up event (Fig. 8) we surmise that the temporary velocity increase was driven by changes in subglacial drainage and effective basal pressure associated with the sudden influx of lake water. Once the excess water was evacuated, the glacier settled back in its ‘normal’ flow regime. Gradients in longitudinal stress remained small during flow acceleration, and driving stress at the grounding line continued to be balanced by basal and lateral drags. This scenario is in agreement with the modeling results of Reference Gudmundsson, Krug, Durand, Favier and GagliardiniGudmundsson and others (2012) and Reference GudmundssonGudmundsson (2013), highlighting the stabilizing effect of lateral drag on grounding-line stability.
Conclusions
The updated assessment of forces acting on Byrd Glacier presented in this study broadly confirms the earlier results of Whillans and others (1989). Force balance in the along-flow direction shows important variations in driving stress that are partially balanced by gradients in longitudinal stress such that basal drag is more uniform. Nevertheless, there are spatial variations in basal drag (‘sticky spots’) that are stationary. Averaged over the lower trunk, basal drag provides ~80% (130 kPa) of flow resistance; lateral drag resists the remaining 20% (32 kPa) of the average driving stress.
Balance of forces in the across-flow direction is more complicated and suggests important small-scale flow disturbances related to either bed topography or variations in bed friction, leading to surface slopes in the transverse direction, although the spatial extent of these slope variations is small (2–3 km). Observations on other glaciers suggest such topographic features are widespread. Without more detailed modeling, the nature of these flow disturbances cannot be addressed quantitatively, but it appears unlikely that they have an important effect on large-scale flow dynamics of glaciers.
The grounding line of Byrd Glacier is located in a region where the bed slopes upward. Such a configuration is generally believed to be unstable, with small perturbations at the grounding line leading to irreversible retreat of the grounding line. This scenario is not supported by the present results. Despite a 10% increase in ice discharge between December 2005 and February 2007, following drainage of two subglacial lakes in the catchment area, the position of the grounding line has not retreated significantly and the glacier has decelerated since then. During the speed-up event, partitioning of flow resistance did not change, suggesting the increase in velocity was caused by a temporary decrease in basal effective pressure.
Acknowledgements
This research was supported through US National Science Foundation (NSF) grant ANT-0944597 and NASA grant NNX11AR23G. We acknowledge the use of data and/or data products from CReSIS generated with support from NSF grant ANT-0424589 and NASA grant NNX10AT68G. Comments by Jim Fastook and an anonymous reviewer helped improve the text and figures.



