





1. Introduction
Understanding the spatial characteristics of a snowpack in mountainous regions, particularly parameters like Snow Water Equivalent (SWE), is crucial for several critical aspects, including the assessment and forecasting of snow-free periods, estimation of snow-melt volume, and evaluation of avalanche hazards (e.g., Deems and others, Reference Deems, Painter and Finnegan2013). This knowledge is relevant for climatological studies (Marty, Reference Marty2013), tourism (e.g., Robert and others, Reference Robert, Daniel, Bruno, Marc and Carlo2019), hydro-power, water supply (Beniston and others, Reference Beniston2018), and ecological aspects (Rixen and others, Reference Rixen2022). The intricate interplay between snowfall, wind, terrain, and vegetation, compounded by the process of snow metamorphism, presents a challenge for accurate measurement of the snowpack. Manual assessment of snow depth is not only costly, time-intensive, and potentially hazardous, but also disrupts the snowpack. Automatic snow depth monitoring, combined with an automatic weather station, addresses these challenges, but is limited to delivering point-based observations. Furthermore, relying solely on point measurements proves inadequate in capturing the variability inherent in the depth of snow on diverse terrains (Bühler and others, Reference Bühler2015).
Light Detection and Ranging (lidar) is able to acquire high-resolution 3D point cloud data, ranging from a few millimeters to a few dozen millimeters between adjacent points, depending on the range (e.g., Pesci and others, Reference Pesci, Teza and Bonali2011). This point data is typically acquired from the ground using Terrestrial Laser Scanners (TLSs) or from the air using Unmanned Aircraft System (UAS) or common aircraft. Calculating the spatial or temporal distribution of the snow thickness requires two co-registered point clouds, by subtracting the dataset without snow from the one with snow. Therefore, to study the temporal evolution of the snow cover, one dataset without snow is sufficient, while the current snow cover needs to be monitored at the desired time intervals. In recent years, semi-permanent installations of TLSs to monitor glaciers have been erected (Voordendag and others, Reference Voordendag, Goger, Klug, Prinz, Rutzinger and Kaser2022; Reference Voordendag, Prinz, Schuster and Kaser2023), but they come at a high cost since a housing with a power supply needs to be built or adapted, and the TLS itself costs more than € 150,000. An alternative to a static, long-range mounted lidar is the deployment of multiple mobile or stationary short-range lidars.
UAS surveys offer another promising approach to snowpack monitoring, providing high-resolution spatial data collection over large areas. Recent studies highlight the effectiveness of UAS-lidar for high-resolution topographic mapping. For instance, Lassiter and others (Reference Lassiter, Wilkinson, Gonzalez Perez and Kelly2021) achieved horizontal accuracies within a few centimeters using UAS-lidar, noting that vertical accuracy depends significantly on ground control quality. UAS-lidar systems offer advantages in penetrating dense vegetation and creating detailed Digital Terrain Models (DTMs), making them valuable for various applications (Oniga and others, Reference Oniga, Loghin, Macovei, Lazar, Boroianu and Sestras2024). However, there are several drawbacks to consider. UAS operations are often limited by weather conditions, flight time, and battery life, which can restrict the areas and timescales over which data can be collected. Additionally, regulatory restrictions and the need for skilled operators can pose significant challenges.
Terrestrial lidar systems can be broadly classified into three categories: (1) high-end, high-cost systems such as the Riegl VZ-6000, which cost approximately € 150,000 and offer ranges of up to 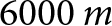 $6000 \,m$; (2) low-cost systems from manufacturers like Livox and Ouster, priced between a few hundred euros and € 20,000, with ranges of up to $600 \,m$ (RoboSense Technology Co. Ltd., 2025); and (3) consumer-grade lidar, costing a few euros, with ranges of only a few meters, such as the lidar integrated into the iPhone 15 Pro (e.g.,
King and others, Reference King, Kelly and Fletcher2023). This classification reflects the current state of the market; however, there are overlaps between the categories and consumer-grade lidars may reach the capabilities of low-cost systems in the coming years as technology evolves. In this study, we focus on low-cost sensors, specifically those from Ouster, as they are both affordable enough for permanent installation on a gondola and capable of providing sufficient range to measure the snow surface and cover several hundred meters on either side of the cable line. The reduction in price and size of lidar sensors over the past decade has led to an increase in their popularity. Initially, their main market was the automotive industry, but many new applications have emerged. The wavelength of most automotive lidar systems, typically ranging between 850 and 940 nm (Velodyne, 2018; Ouster, Reference Ouster2021; Livox Technology, 2024; RoboSense Technology Co. Ltd., 2025), is well-suited for snow and ice applications due to the high reflectivity of these surfaces at these wavelengths (e.g.,
Deems and others, Reference Deems, Painter and Finnegan2013; Hotaling and others, Reference Hotaling, Lutz and Dial2021).
$600 \,m$ (RoboSense Technology Co. Ltd., 2025); and (3) consumer-grade lidar, costing a few euros, with ranges of only a few meters, such as the lidar integrated into the iPhone 15 Pro (e.g.,
King and others, Reference King, Kelly and Fletcher2023). This classification reflects the current state of the market; however, there are overlaps between the categories and consumer-grade lidars may reach the capabilities of low-cost systems in the coming years as technology evolves. In this study, we focus on low-cost sensors, specifically those from Ouster, as they are both affordable enough for permanent installation on a gondola and capable of providing sufficient range to measure the snow surface and cover several hundred meters on either side of the cable line. The reduction in price and size of lidar sensors over the past decade has led to an increase in their popularity. Initially, their main market was the automotive industry, but many new applications have emerged. The wavelength of most automotive lidar systems, typically ranging between 850 and 940 nm (Velodyne, 2018; Ouster, Reference Ouster2021; Livox Technology, 2024; RoboSense Technology Co. Ltd., 2025), is well-suited for snow and ice applications due to the high reflectivity of these surfaces at these wavelengths (e.g.,
Deems and others, Reference Deems, Painter and Finnegan2013; Hotaling and others, Reference Hotaling, Lutz and Dial2021).
These low-cost lidars perform a full scan up to 20 times per second. To merge successive scans of a moving sensor into a cumulative point cloud, a Simultaneous Localization And Mapping (SLAM) algorithm is required. We use SLAM offline, focusing only on mapping terrain below the gondola. Methods range from lidar-only to multi-sensor fusion with Inertial Measurement Unit (IMU) and Global Navigation Satellite System (GNSS) (Yarovoi and Cho, Reference Yarovoi and Cho2024). A key limitation is error accumulation, or drift, which can be reduced by loop closure, i.e., recognizing when a trajectory revisits the same area. In aerial lift, loop closure occurs naturally on each round trip, strongly constraining drift. SLAM also benefits from accurate GNSS (Chen and others, Reference Chen, Sun, Cheng, Yin, Zhou and Ochieng2024), but Real-Time Kinematics (RTK) requires mobile network or base-station access, often unavailable in alpine terrain. We therefore assess whether SLAM with only uncorrected stand-alone GNSS and IMU is sufficient.
Recently, low-cost lidars have been used statically for snow monitoring (Kapper and others, Reference Kapper2023; RSnowAUT-Konsortium, 2023; Ruttner and others, Reference Ruttner, Voordendag, Hartmann, Glaus, Wieser and Bühler2025) and monitoring of a river bank (Perks and others, Reference Perks, Pitman, Bainbridge, Díaz-Moreno and Dunning2024). Building on these successes, this study investigates the potential of deploying low-cost lidars on aerial lifts to enhance spatial and temporal monitoring coverage. Previously, other sensors have been used on aerial lifts to detect avalanche victims (Fruehauf and others, Reference Fruehauf, Heilig, Schneebeli, Fellin and Scherzer2009), measure vertical profiles of cloud microphysics (Beck and others, Reference Beck, Henneberger, Schöpfer, Fugal and Lohmann2017), measure stream discharge (Costa and others, Reference Costa2000) and conduct radar-based ice and water classification using a Doppler-capable X-band radar (Ponur and others, Reference Ponur2023). Yankielun and others (Reference Yankielun, Rosenthal and Davis2004) demonstrated the feasibility of using Frequency-Modulated Continuous Wave (FMCW) radar for large-scale snowpack measurements and obtained multiple 2D snow depth profiles. Globally, more than 24,000 ski lifts operate in over 6,000 ski resorts, providing recreational opportunities and serving critical roles in urban transport and logistics, such as delivering essential supplies to remote Alpine huts (skiresort.at, 2023). They consistently operate along fixed routes, some of which pass over avalanche-prone terrain.
We follow the definitions provided by the European Avalanche Warning Services (EAWS), using snow depth to refer to vertical measurements and snow thickness to describe distances measured perpendicular to the terrain surface. This distinction is particularly important in areas with steep slopes (European Avalanche Warning Services, 2023). Throughout this work, we refer specifically to the seasonal snow cover, rather than the total snow thickness, as the study area also contains perennial snow and dead ice, which may underlie the seasonal snow layer.
In this feasibility study, we assess the practical viability of regular snow monitoring using a lidar mounted on an aerial lift. Specifically, this work focuses on:
(1) Evaluating the repeatability of snow surface detection and comparing it to UAS-photogrammetry data.
(2) Assessing the robustness of the SLAM algorithm in generating a cumulative point cloud from the moving lidar using only standalone GNSS and IMU
2. Study area
We performed the proof of concept measurements at Hoher Sonnblick in the Hohen Tauern mountain range in Salzburg, Austria. The Sonnblick Observatory, which is operated by GeoSphere Austria, is located on its summit at around 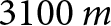 $3100\,m$ Above Sea Level (ASL). It stands out as a key site of several international atmospheric monitoring networks and has a continuous measurement series since 1886 (sonnblick.net, 2024). In 2018, the aerial lift from Kolm Saigurn (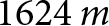 $1624\,m$ ASL) to the observatory was rebuilt. The lift has only one gondola and travels on two fixed cables, making it possible to safely transport people and equipment, even at high winds. The lift runs along the north-east side of the mountain over the length of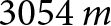 $3054 \,m$, with a maximum speed of $6 \mathrm{m/s}$. As the gondola is not open for public use, it provided us with the perfect opportunity for a field test. The measurement campaign took place on March 21, 2023, when the survey area was completely covered with snow, with a snow thickness in the valley of about $85 \mathrm{cm}$ (see Fig. 1).
Survey location: (a) Overview map of the Hoher Sonnblick area with topography; weather/snow conditions on the day of the survey: (b) view from the valley towards the Hoher Sonnblick summit; (c) view from the gondola towards the valley.

3. Instrumentation
3.1. Sensor system and mounting position
The primary measurement setup for this study used our custom MObile LIdar SENsor System (MOLISENS) system, a modular and versatile platform designed for integration of different perception sensors (Goelles and others, Reference Goelles2022). As shown in Fig. 2, MOLISENS is capable of being rigidly mounted on moving components of an aerial lift, such as gondolas or chairs, enabling consistent data acquisition during both ascent and descent. This setup allows the collection of point cloud data, which is post-processed using a SLAM algorithm to create a high-resolution cumulative point cloud. Snow thickness is subsequently determined by subtracting a snow-free reference point cloud. MOLISENS integrates an Ouster OS2-64 Gen6 lidar, an Xsens MTi-630 IMU for accurate motion sensing, and an ANN-MB series Ublox GNSS antenna for georeferencing. These components are connected to a data logger and powered by external batteries, creating a system capable of operating effectively in alpine environments. The total cost of the system components is approximately € 23,300, consisting of the following: IMU: € 1,000, GNSS antenna: € 100, lidar: € 21,000, battery: € 200, data logger: € 1,000. The MOLISENS system runs on Ubuntu 20.04 and uses Robot Operating System (ROS) for time-synchronous logging of sensor data into a standardized database file (rosbag), simplifying storage and analysis. Time synchronization between the sensors is handled using the Chrony software, achieving an accuracy in the range of tens of microseconds (Lichvar and Curnow, Reference Lichvar and Curnow2025). The OS2 lidar has laser class 1, making it eye-safe, weighs 5.5 kg and consumes approximately 1 A. Power is provided by two parallel LiFePO4 batteries with a combined capacity of 7.2 Ah, allowing up to 7.2 h of continuous operation.
Sensor system mounted on the gondola, with the GNSS antenna on the roof and the IMU and lidar at the front of the gondola. The axes represent the orientation of the coordinate system, with the  $X$-axis aligned with the gondola’s forward direction. During the gondola’s ascent and/or descent, point cloud data is collected and subsequently post-processed.

In this study, the Sonnblick gondola was used as the sensor carrier. The lift, with only one support pillar, ascends at a steep 47° angle near the summit (sonnblick.net, 2024). To maximize the field of view of the lidar, the sensor was rigidly mounted on the outside of the gondola, angled obliquely downward at approximately 37°. The GNSS antenna was mounted flat on the roof of the gondola, with all cables routed into the cabin (see Fig. S1 in the supplementary materials). The Ouster OS2-64 Gen6 lidar was operated at a 10 Hz rotation rate for this study, providing a horizontal resolution of 1024 points across 360° and a vertical resolution of 64 points across 22.5°, achieved through its 64 vertically aligned receivers. Offsets and fixed angle misalignments between the lidar, IMU, and GNSS antenna were measured and used in processing via rotation and translation matrices. The lift’s movement, combined with the SLAM algorithm, allows for the continuous mapping of the environment along its trajectory.
For this deployment, standalone GNSS position was fused by SLAM, yielding meter-level absolute accuracy consistent with the receiver specifications (u-blox AG, 2022). Satellite coverage can be unreliable in narrow mountain valleys (Kunisada and Premachandra, Reference Kunisada and Premachandra2022), although mounting on an aerial lift can reduce multipath by raising the antenna several meters above ground (Brach and Zasada, Reference Brach and Zasada2014; Groves and others, Reference Groves, Adjrad and Selbie2017; Zheng and Chai, Reference Zheng and Chai2023).
3.2. UAS-photogrammetry survey
On August 23, 2023, the survey area was mapped using a DJI Phantom 4 Pro UAS equipped with a 1-inch 20 MP CMOS camera sensor and a Post-Processed Kinematic (PPK) GNSS extension. Due to the challenging topography of the study area, two different starting points were selected: one east of the Sonnblick Observatory and another at the base of the Sonnblick north face. To precisely reference the UAS images, ten Ground Control Points (GCPs) were installed at the base of the wall and in the ridge area prior to the UAS flight. The overall mission was based on six flight plans covering a total distance of approximately 30 km. Each plan included dozens of profiles in vertical and horizontal directions to ensure comprehensive data acquisition. To avoid shadowing and ensure a complete model of the entire flank under investigation, images were captured both at nadir and at right angles to the (mean) terrain slope. The target resolution was 6.5 cm, and the data assessment covered a wall area of around 3.8 km2 at elevations between 2200 and 3100 m ASL. Over 700 images were taken in raw data format during the mission, with uniform lighting conditions throughout the flight ensuring very high data quality. Georeferencing was conducted using 10 Ground Control Points (GCPs), achieving a mean Root Mean Square (RMS) error at the GCPs of ±3.5 cm in each direction.
4. Molisens Data Processing
4.1. SLAM algorithm and 3D point cloud
The SLAM algorithm LIO-SAM (Shan and others, Reference Shan, Englot, Meyers, Wang, Ratti and Rus2020) was employed to generate a high-resolution 3D cumulative point cloud of the entire survey area. This decision for this particular algorithm was based on the findings of Dikic (Reference Dikic2023), which benchmarked several lidar SLAM algorithms across various environmental conditions and sensor configurations. Among the evaluated methods, LIO-SAM demonstrated superior robustness and mapping accuracy, particularly in snow-covered and complex terrains where other algorithms exhibited significant performance degradation. Its effective fusion of lidar, IMU, and GNSS data via a factor graph framework allows for accurate trajectory estimation, reducing drift, noise, and bias while supporting long-range consistency through GNSS integration.
To address the intricacy and scale of the survey area—especially in regions with sparse or irregular features—the mapping was divided into nine segments, each generating an individual 3D point cloud. These segments were later merged during post-processing to produce a unified map (see Fig. S5 in the Supplementary Material). This stitching process, while essential, was labor-intensive and introduced challenges such as subtle artefacts in the form of dark arcs, which reflect lower point densities (Fig. 3). These artifacts are particularly noticeable around areas with minimal structural detail.
DTM of the entire survey area, featuring two detailed views: the valley area of Kolm Saigurn (highlighted in red) and the Left North Face Couloir (Linke Nordwandrinne) directly below the Sonnblick summit (highlighted in blue). The map is composed of 9 segments, and the dark arcs visible on the map are artefacts resulting from the merging of individual 3D SLAM generated point clouds. These artifacts are particularly evident halfway up the profile, where distinct features crucial for accurate SLAM calculations are absent. Segment 1, extending from the valley just beyond the support pillar, and Segment 9 at the summit, are utilized for detailed analysis (for more details on the segments, see Figure S5 in the supplementary materials.

To ensure stable algorithm performance, the rosbag playback speed was set to 0.25, enabling smoother data synchronization and processing. The final combined 3D point cloud encompasses over 43 million points. This resolution clearly surpasses that of alternative methods tested in Dikic (Reference Dikic2023), validating LIO-SAM as the most suitable choice for this challenging alpine survey.
4.2. Vegetation removal algorithm
The 3D point cloud produced by the SLAM algorithm represents a Digital Surface Model (DSM), capturing all environmental features scanned by the lidar sensor. However, vegetation can increase errors in lidar scans due to laser pulse scattering (Su and Bork, Reference Su and Bork2006) and cause alignment issues between 3D point clouds of the same area due to movement (Dikic, Reference Dikic2023). Measuring snow thickness is easier with a DTM instead of a DSM. To address this, a Cloth Simulation Filter (CSF) (Zhang and others, Reference Zhang2020) is used to remove vegetation from the SLAM-generated 3D point clouds. The CSF method, based on “Cloth simulation-based construction of pit-free Canopy Height Models (CHMs)” developed by Reference ZhangZhang and others, simulates interactions between a virtual cloth and lidar data points to estimate canopy heights. This process produces two distinct point clouds: one that captures only the vegetation and another that represents the DTM. The latter is utilized for our snow thickness estimation.
4.3. Scan quality and sources of uncertainty
To evaluate the overall quality of the generated DSM and DTM, we assess aspects of point cloud precision and compare snow-free patches to the Structure from motion (SfM)-derived data. Due to the lack of GCP in the difficult-to-access study area during winter, these comparisons rely on analyzing differences between pairs of point clouds. As mentioned earlier, the scans produced by SLAM are not georeferenced and therefore must be registered during post-processing. A rough alignment was performed using manual point picking, followed by fine registration using the well-established Iterative Closest Point (ICP) algorithm (Chen and Medioni, Reference Chen and Medioni1992), both of which are implemented in the open-source point cloud processing software CloudCompare (CC). Subsequently, the cloud-to-cloud distance was calculated to measure differences between the datasets.
Precision, or repeatability, was investigated by comparing MOLISENS measurements from two distinct uphill or downhill rides conducted on the same day using the same setup. While a complete map covering the entire gondola route was successfully generated using MOLISENS data (see Figs S5 and S6), this full map—although useful for qualitative inspection and gaining an initial impression of the survey area—proved unsuitable for detailed investigations due to inaccuracies introduced during the manual stitching process. Consequently, the analysis focused on individual segments where SLAM successfully produced continuous maps.
Direct estimation of accuracy, as deviation from a known reference, was not possible without high-quality georeferenced TLS scans. Instead, we compared the snow-free patches generated by MOLISENS to those derived from SfM data to evaluate consistency. This approach highlights differences due to sensor performance, uncertainties in the SLAM calculation, point cloud registration, and alignment with the SfM dataset.
As described in Table 1, the range accuracy of the lidar sensor falls within the centimeter range. This means the two largest sources of uncertainty are the LIO-SAM SLAM algorithm and the registration process. ICP outputs a single RMS value that provides at least some information on the quality of the alignment, while LIO-SAM does not come with any inherent confidence measure.
Instrument Overview.

1 80% Lambertian refl., 90% detection probability; 100 klx sunlight.
2 For Lambertian targets (Ouster, Reference Ouster2021).
3 Structure from Motion is a photogrammetric technique used to reconstruct 3D structures from a series of 2D images captured from varying viewpoints.
Aligning two scans using ICP proves highly effective when minimal changes are present between them. However, the alignment process becomes significantly more challenging when comparing a scan devoid of snow with one that includes snow coverage. One strategy involves excluding snow-covered areas from the MOLISENS scan and aligning the remaining snow-free areas (see Fig. 4) with the SfM data. The resulting transformation matrix can then be applied to align the full scan. However, achieving a good fit becomes increasingly challenging as snow-free areas diminish in size. Vegetation presents another challenge; while it can be removed from the snow-free scan by generating a DTM, this is not feasible in the snow-covered case, where vegetation becomes increasingly compressed under heavier snow loads. To address these challenges, a steep area with minimal vegetation and predominantly rocks near the summit was selected for the comparison to the SfM data (segment 9 in Fig. S5). Initially, areas interspersed with rock were visually separated from uniform snow patches in the MOLISENS scan, enabling registration of the MOLISENS and UAS-photogrammetry data with a low registration error (RMS of ICP at 0.474 m). Subsequently, three individual rock faces with minimal snow were extracted and used for further analysis with Multiscale Model to Model Cloud Comparison (M3C2). The transformation matrix from the cropped and registered scan can then be applied to the entire scan segment to visualize snow accumulation zones.
UAS-photogrammetry data of the steep rock face (23.08.2023) located in the Left North Face Couloir of Hoher Sonnblick used for comparison with MOLISENS data. The three red circled areas are generally snow-free in the MOLISENS scans and are compared in more detail to the UAS-photogrammetry data.

4.4. Comparison of 3D point clouds
To compare two point clouds and calculate the deviations between them, the M3C2 algorithm (Lague and others, Reference Lague, Brodu and Leroux2013) of CC is used. It focuses on specific points known as core points, which are sub-sampled versions of the original reference point cloud and represent regions of interest. M3C2 operates in two essential steps: first, it calculates normal vectors for each core point (by fitting a plane to the points in its neighborhood), and then it projects a cylinder along the normal direction. From the points encompassed in the projected cylinder a distance distribution between the two clouds can be calculated that provide valuable insights into point cloud roughness and average positions. The final distance between the two point clouds is determined based on these distributions. Registration uncertainty from the ICP step contributes to the M3C2 distance uncertainty (LoD95); parameters (normal scale, projection diameter) were selected to maintain sufficient point counts in sparse regions, but low texture and density still increase uncertainty. M3C2 is specifically designed for dense point clouds and proves especially useful for analyzing complex topographies (e.g. Lague and others, Reference Lague, Brodu and Leroux2013; Iglseder, Reference Iglseder2018). It provides two key metrics: (1) the cloud-to-cloud distance, called M3C2 distance in CC, representing the signed distance between two point clouds Positive values indicate a displacement in the direction of the normal, while negative values indicate a displacement in the opposite direction. (2) the uncertainty in cloud distance, called M3C2 distance uncertainty in CC which reflects the 95% confidence interval or reliability of the calculated cloud-to-cloud distance, accounting for factors such as point cloud noise, point density, and surface roughness. High uncertainty values indicate low reliability of the corresponding distance measurement.
For comparison to the SfM data using the approach described above, several steps are involved. Initially, the reference point cloud is manually aligned with the SLAM 3D point cloud, followed by precise alignment using the ICP algorithm with customizable constraints. Subsequently, M3C2 calculates distances between the two point clouds (Lague and others, Reference Lague, Brodu and Leroux2013). Finally, we visually inspect the distribution of cloud-to-cloud distances and aggregate these values to quantify the overall fit. For aggregation we use the weighted mean of distances:
 \begin{equation}
\bar{d}_{\text{weighted}} = \frac{\sum_{i=1}^n w_i \cdot d_i}{\sum_{i=1}^n w_i},
\end{equation}
\begin{equation}
\bar{d}_{\text{weighted}} = \frac{\sum_{i=1}^n w_i \cdot d_i}{\sum_{i=1}^n w_i},
\end{equation} where  $d_i$ represents the cloud-to-cloud distance per point and the weights $w_i$ are defined as the inverse of the uncertainty in cloud distance,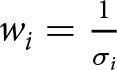 $w_i = \frac{1}{\sigma_i}$. This method effectively down-weights contributions from noisier or sparser regions, thereby providing a robust estimate of alignment quality by accounting for the varying uncertainty across the dataset. The smaller this value, the better the co-registration of the two clouds.
To estimate the variability between the two point clouds, we calculate a measure of the spread of cloud-to-cloud distances; here, the weighted standard deviation is calculated as follows:
 \begin{equation}
\text{Var}_{\text{weighted}} = \frac{\sum_{i=1}^n w_i \cdot (d_i - \bar{d}_{\text{weighted}})^2}{\sum_{i=1}^n w_i},
\end{equation}
\begin{equation}
\text{Var}_{\text{weighted}} = \frac{\sum_{i=1}^n w_i \cdot (d_i - \bar{d}_{\text{weighted}})^2}{\sum_{i=1}^n w_i},
\end{equation} \begin{equation}
\text{StdDev}_{\text{weighted}} = \sqrt{\text{Var}_{\text{weighted}}}.
\end{equation}
\begin{equation}
\text{StdDev}_{\text{weighted}} = \sqrt{\text{Var}_{\text{weighted}}}.
\end{equation}The weighted mean cloud-to-cloud distance provides a robust estimate of the alignment quality, and the weighted standard deviation reflects the consistency of the scanning process. This analysis ensures that the repeatability assessment is not unduly influenced by noise or sparse regions in the scans.
5. Results
In this study, six measurement runs were conducted during winter on March 21, 2023, using the MOLISENS system, complemented by the snow-free UAS-photogrammetry data. A detailed summary of the six MOLISENS runs is presented in Table 2. Among these, the horizontal mounting of the lidar proved to be the most effective configuration, providing a wider field of view that significantly improved the performance of the SLAM algorithm.
Summary of measurements conducted on 21 March 2023, showing instrument orientation, movement direction, passenger presence, time, and wind speed for each run.

5.1. IMU and GNSS data analysis
As outlined in Section 4.1, both IMU and GNSS data are integral to the SLAM algorithm and serve additional analytical purposes. The GNSS data demonstrate consistent altitude, latitude, and longitude values, aligning well with the known coordinates of the summit and valley stations (Fig. S2). A Fast Fourier Transformation (FFT) applied to the IMU data reveals spectral components of acceleration, with a recurring peak at  $10 \mathrm{Hz}$ in the $x$-,
$x$-,  $y$-, and $z$-directions (Fig. S3), likely due to the rotation frequency of the OS2-64 lidar’s mirror. Time-resolved frequency characteristics are further illustrated in spectrograms for each axis (Fig. S4).
Figure 5 focuses on the  $x$-axis spectrogram for measurements M5 and M6, covering one ascent and descent. A stationary period at the summit station is seen between 600 and $800 \mathrm{s}$, while similar pauses near 250 and $1250 \mathrm{s}$ correspond to the gondola reaching the support pillar during ascent and descent. Frequency components that appear only during motion likely reflect cable vibrations and wind-induced movement. The persistent $10 \mathrm{Hz}$ signal throughout confirms its origin in the continuously rotating lidar mirror.
Spectrogram of the linear acceleration for the  $x$-axis with the lidar mounted horizontally. As shown inFigure 2, the $x$-axis was aligned with the gondola’s forward direction.

5.2. Quality assessment
This section presents the results of the quality assessment, focusing on the two largest and most feature-rich segments: Segment 1 in the valley and Segment 9 at the summit. These segments were selected for a detailed precision analysis and comparison with UAS-photogrammetry data to evaluate whether the precision of the SLAM-generated 3D point cloud is sufficient for the intended applications outlined in the introduction.
5.2.1. Precision
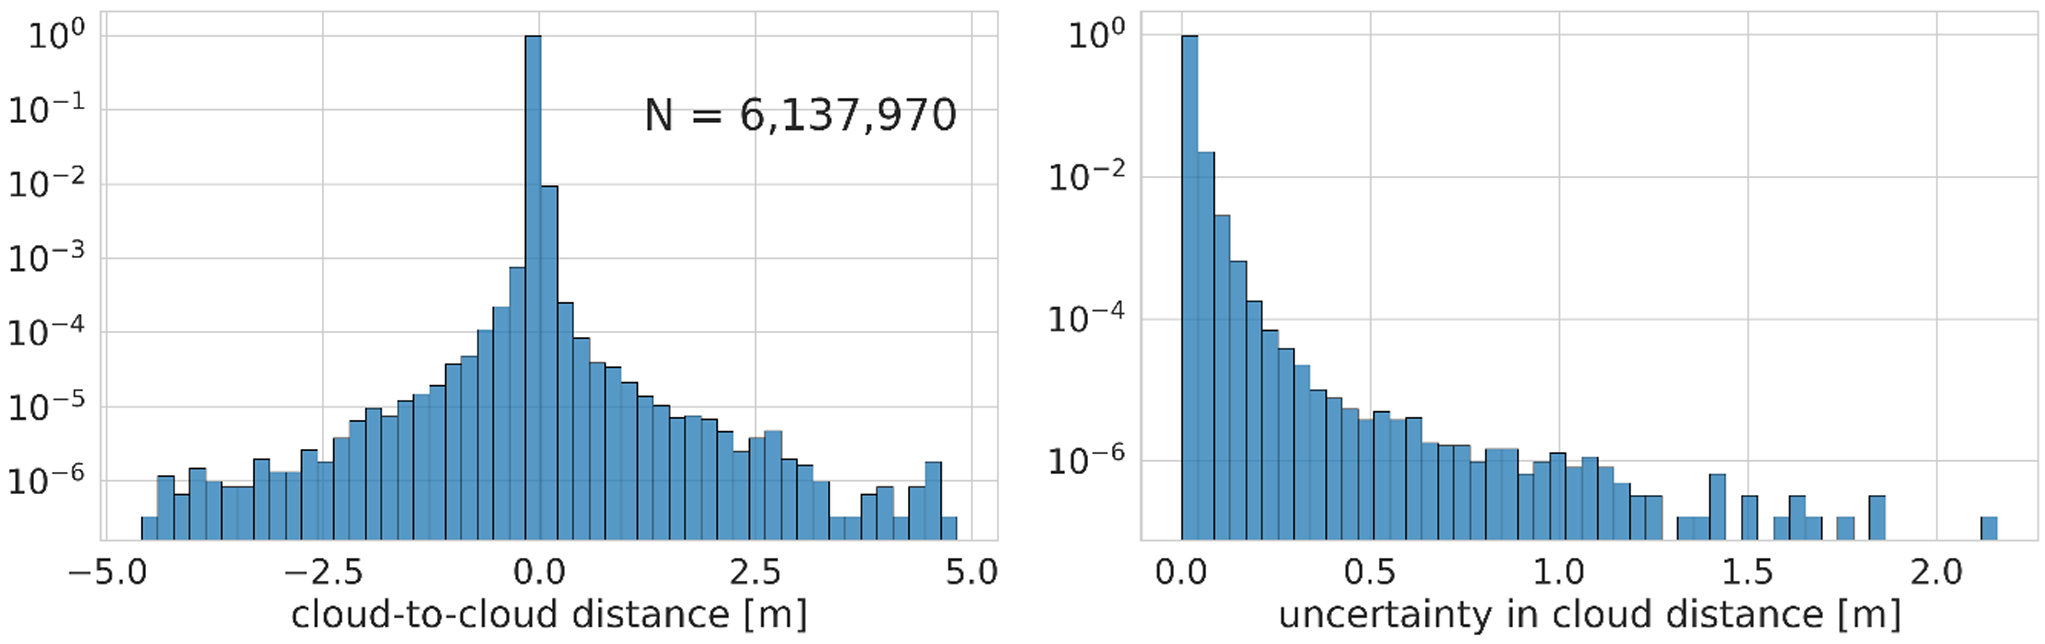
Segment 1 from the MOLISENS scan, extending from the valley station to the gondola support pillar, was selected to evaluate the repeatability of our methodology. For measurements M3 and M6, SLAM successfully generated a continuous 3D point cloud for this area, which includes both complex terrain—featuring cliffs, vegetation, and buildings—and uniform sections covered in snow. For point cloud registration using ICP, the entire segment was used. The registration performed well due to the abundance of distinct features, resulting in a final RMS error of 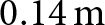 $0.14\,\mathrm{m}$. In contrast, for segments consisting solely of uniform snow cover, registration could not be achieved. For the majority of the resulting 3D point cloud from the comparison, cloud-to-cloud distance values are within the centimeter range, consistent with the sensor’s accuracy. Larger values are predominantly observed in areas with vegetation and on surfaces experiencing a high incidence angle as observed from the lidar sensor, yet these remain significantly below $10 \,cm$ in most instances. The distribution of cloud-to-cloud distances (Mean: $-0.0002 \,m$, STD: $0.033 \,m$) along with the associated uncertainty in cloud distance (Mean: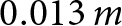 $0.013 \,m$, STD: $0.013 \,m$) are presented in Fig. 7. Figure 6 illustrates a portion of the resulting 3D point cloud, colored according to uncertainty in cloud distance. Notably, uncertainty values (as well as cloud-to-cloud distances) begin to increase towards the scan’s periphery at the left and right of the gondola track, a phenomenon attributable to the increased distance, high incidence angle and decrease in density of the 3D point cloud in these regions. A statistically significant but weak negative correlation was observed between uncertainty in cloud distance and cloud-to-cloud distance (Pearson’s $r=-0.066, \,p \lt 0.001$), as well as between uncertainty and the distance-from-center-line ( $r=-0.176, \,p \lt 0.001$), defined as the normal (perpendicular) distance from a point to a vertical plane aligned with the gondola cable. However, a slight and anticipated increase in uncertainty is noted with greater distance-from-center-line, as well as with increased cloud-to-cloud distance (compare Fig. 6 and S8). The weighted mean cloud-to-cloud distance value, $\bar{d}_{\text{weighted}}$, is $0.0001\,m$, indicating good alignment. The weighted standard deviation, $\text{StdDev}_{\text{weighted}}$, is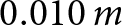 $0.010\,m$, suggesting that approximately 68% of points have a distance value of less than 1 cm. Additionally, 95% of the cloud-to-cloud distances, when ranked by normalized cumulative weights, fall below $\pm0.006\,m$ and 99% of the points are below $\pm0.017\,m$.
Uncertainty in cloud distance (M3C2) in meters between two MOLISENS scans (measurements M3 and M6) of Segment 1 (Valley). The increased uncertainty is clearly visible in areas with greater surface roughness, as indicated by the red trees. Uncertainty also rises with distance and angle relative to the sensor. This is evident when comparing the bluish areas in the bottom right to the green areas in the top left, and when contrasting the center of the scan with the margins where points become sparse. Highest uncertainty values reach around 0.3 m.

Distribution of cloud-to-cloud distance (left) and associated uncertainty in cloud distance (right) in meter when comparing Segment 1 (Valley) of MOLISENS measurement M3 and M6. Note that the  $y$-scale is normalized and logarithmic.

5.2.2. Comparison to the UAS-photogrammetry data
While precision is crucial for detecting changes between different passes, we also compared our scans to SfM-derived data to evaluate differences. For this analysis, we utilized Segment 9 from MOLISENS measurement M6 and the UAS-photogrammetry data described in Section 4.3. Figure 8 shows the distributions of cloud-to-cloud distances and uncertainties for three selected rock walls (Fig. 4). Although the distributions vary slightly between the rock walls, uncertainties are notably higher in this comparison. The unweighted standard deviation of cloud-to-cloud distances ranges from  $0.326 \,m$ for rock wall 02 to $0.566 \,m$ for rock wall 03. While the mean values for rock walls 02 and 03 were smaller ( $0.061$ and $0.004 \,m$, respectively), rock wall 01 exhibited a mean of $-0.227 \,m$, indicating a misalignment between MOLISENS and the UAS-photogrammetry data in this area. Distance uncertainty, starting at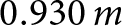 $0.930 \,m$, is attributed to the propagated registration error, as accounted for by the M3C2 algorithm (see Eq. 1 in Lague and others (Reference Lague, Brodu and Leroux2013)). These results indicate that differences vary across the compared areas and likely increase with larger scans. The substantial standard deviation further suggests that differences are not uniformly distributed. These spreads are dominated by registration error and the standalone GNSS absolute positioning, rather than sensor range noise, and will be reduced by enabling raw GNSS logging with PPK.
Distribution of cloud-to-cloud distances (left) and associated uncertainties in cloud distance (right), measured in meters, between MOLISENS (measurement M6) and the UAS-photogrammetry data. The comparison focuses on three snow-free rock faces in Segment 9. Note that the  $y$-axis is normalized (such that bar heights sum to 1) and on a logarithmic scale.

When calculating the mean and standard deviation of cloud-to-cloud distances weighted by uncertainty for rock walls 01, 02, and 03 (Eqs. 1 and 3), we obtained values of  $0.351 \pm 0.685 \,m$, $0.263 \pm 0.456 \,m$, and $0.419 \pm 0.685 \,m$, respectively. These weighted results present a more uniform distribution across all three rock walls, but the high values highlight the limitations of this comparison. Upon closer examination of the resulting difference point clouds, at least some of the variability appears to stem from small snow patches still present in the test areas. As noted, it remains challenging to attribute the uncertainty values specifically to the registration process or the SLAM algorithm.
5.3. Snow thickness map
The resulting snow thickness estimate for the top area of the Sonnblick (Segment 9) is depicted in Fig. 9. This map was created using two different data sources (MOLISENS and the snow-free UAS-photogrammetry data), which introduces considerable inaccuracies as discussed in the preceding sections. Nevertheless, it presents a generally realistic depiction and provides a good impression of what could be achieved with a permanent scanning setup monitoring daily snow thickness changes. As shown, the highest snow thicknesses are found in the large snow patch at the base of the cliff and in the couloir, reaching up to 5 meters. The realism of the snow thickness map is supported by several factors. The vertical and horizontal lineations visible in the map correspond to gullies, cracks, and joints in the underlying perennial snow, ice, and rock surfaces, as illustrated in the supplementary Fig. S7. Furthermore, high snow thicknesses observed in the snow patch at the base of the steep cliff and within the couloir, align well with expected snow accumulation patterns resulting from frequent wind and avalanche deposition from the cliffs above. Additionally, areas depicted as snow-free in the calculated snow depth map coincide closely with areas identified as snow-free in both the MOLISENS point cloud from March 2023 and the UAS data collected in the summer. The complex surface features present in the UAS reference scan, contrast with the smoother snow-covered surface captured by the winter MOLISENS scan. Consequently, these underlying geomorphological and structural features naturally appear in the resulting snow thickness map, representing the difference between the two datasets.
Snow thickness in the Left North Face Couloir of Hoher Sonnblick, in meters, calculated by comparing the MOLISENS scan from 21 March 2023 with UAS photogrammetry data from 23 August 2023. The true-color 3D point cloud in the background represents the UAS photogrammetry data, while the green-to-red colored point cloud shows the calculated snow thickness. Red circles mark the snow-free areas used for co-registration. Depths of up to 5 meters are observed at the base of the cliffs and within the couloir. For a version without the snow thickness overlay, see Figure S7 in the supplementary materials.

6. Discussion and conclusions
Our initial tests demonstrate that the proposed method produces high-resolution 3D point clouds of the study area with consistent results across repeated acquisitions. While some implementation challenges were encountered, the segmented outputs exhibit repeatability sufficient for follow-on analysis and prospective long-term monitoring. Because differencing requires tightly co-registered scans, we quantified same-day repeatability at  $\sim$1 cm (weighted SD 0.010 m; 95% within $\pm$0.006 m), which supports centimeter-scale snow-thickness change detection along the lift corridor.
Since our study (early 2023), DJI has introduced the Zenmuse L2, which integrates a Livox Avia lidar, an RGB camera, an IMU, and an onboard data logger (DJI Enterprise, 2023). The sensor costs approximately € 14,000; generating a cumulative point cloud requires DJI Terra, a proprietary application with a perpetual license priced at around € 12,000. Compared with MOLISENS, this solution has higher entry costs and is more closed—as the raw 4D point cloud data are not directly accessible. In contrast, with MOLISENS the lidar constitutes most of the system cost and, when using the Livox Avia, the hardware budget can be reduced to about € 2,500 (not available at the time of our study). Despite reduced openness, the DJI solution appears attractive for practice due to its turnkey integration and ease of use.
This study demonstrates the feasibility of gondola-mounted, low-cost lidar for snow monitoring in an RTK-denied alpine environment. For continuous operations, we recommend recording raw GNSS data and implementing an automated PPK workflow, ideally with a base station. Additionally, progress toward operational monitoring will benefit from: (1) more robust SLAM, for example GsLINS (Liu and others, Reference Liu, Qin, Chi, Zhang, Zhang, Sun and Zhan2025) or commercial offerings such as Exwayz and Kudan (Kudan Inc., 2024; exwayz.fr, 2024) to enable full automation; (2) evaluating the use and placement of GCPs; (3) adopting solid-state lidar to mitigate vibration-induced errors from rotating sensors; (4) integrating the hardware seamlessly into the gondola with a reliable power supply; (5) hardening the system against harsh conditions with reliable recovery mechanisms (Goelles and others, Reference Goelles, Schlager and Muckenhuber2020); and (6) automating registration and processing in a scalable backend (Goelles and others, Reference Goelles, Dikic, Gaisberger, Schlager, Muckenhuber and Wallner2024) to deliver accurate snow-thickness values.
If these developments are realized, in principle every aerial lift could host a gondola or chair equipped with a lidar transmitting raw sensor data to a central server. This would enable the generation of a complete scan after each round trip allowing differencing against any previous scan. Depending on the speed and length of the lift temporal resolutions of less than one hour are feasible during operating times. Such a system would generate substantial amounts of data and our measurements yielded approximately 1.5 GB per minute of runtime. While this volume is not prohibitive, efficient data management (Goelles and others, Reference Goelles, Dikic, Gaisberger, Schlager, Muckenhuber and Wallner2024) will be essential since for operational and most scientific applications coarser resolution in space and time is sufficient particularly during periods of minimal change. Overall aerial lifts represent a compelling platform for sensor deployment as they repeatedly traverse the same corridor with spacing on the order of a few to tens of meters.
Supplementary material
The supplementary material for this article can be found at https://doi.org/10.1017/jog.2025.10105.
Acknowledgements
The project RSnowAUT was funded by the program “Austrian Space Applications Programme (ASAP)” of the Austrian Federal Ministry for Climate Action (BMK). The Austrian Research Promotion Agency (FFG) has been authorised for the programme management. The publication was partly written at Virtual Vehicle Research GmbH in Graz and partially funded within the COMET K2 Competence Centers for Excellent Technologies from the Austrian Federal Ministry for Climate Action (BMK), the Austrian Federal Ministry for Labour and Economy (BMAW), the Province of Styria (Dept. 12) and the Styrian Business Promotion Agency (SFG). The authors acknowledge the financial support by the University of Graz and the Virtual Vehicle Research GmbH. We acknowledge the Sonnblick Observatory of GeoSphere Austria for providing Access to the Research Infrastructure. The work of Pedro Batista was supported by LARSyS FCT funding (doi: 10.54499/LA/P/0083/2020, 10.54499/UIDP/50009/2020, and 10.54499/UIDB/50009/2020). The authors also thank the editor and the reviewers for their constructive comments and valuable contributions to improving the manuscript.




 Open access

