


Introduction
The extent of continental ice plays a large role in environmental systems, from the direct effect on sea level to changes in surface albedo, to controlling fresh water resources in mountain communities. With only medium confidence at present in predicting ice discharge (Vaughan and others, Reference Vaughan, Stocker, Qin, Plattner, Tignor, Allen, Boschung, Nauels, Xia, Bex and Midgley2013), due in large part to the uncertainty in the viscous constitutive laws, improvement in describing ice dynamics can have a strong impact on overall predictions of the mass balance of ice sheets and glaciers. Such improvement requires a better understanding of ice rheology in the viscous regime.
Since the 1950s (Nye, Reference Nye1953; Glen, Reference Glen1955) the glaciology community has had reasonable constraints on the bulk flow of effectively isotropic ice. Flow laws developed then, with some modification (e.g., Barnes and others, Reference Barnes, Tabor and Walker1971; Ashby and Duval, Reference Ashby and Duval1985; Goldsby and Kohlstedt, Reference Goldsby and Kohlstedt2001; Treverrow and others, Reference Treverrow, Budd, Jacka and Warner2012), have approximated the kinematics that prevail over much of the ice sheets. However, these flow laws lose accuracy in regions of streaming flow, which are responsible for draining the major ice sheets and alpine regions. Glen's flow law, which is valid for low-strain, isotropic ice, falls short of representing flow changes in regions of high strain (Alley, Reference Alley1992; Thorsteinsson and others, Reference Thorsteinsson, Waddington and Fletcher2003; Martín and others, Reference Martín, Gudmundsson, Pritchard and Gagliardini2009, Reference Martín, Gudmundsson and King2014; Ma and others, Reference Ma2010; Budd and others, Reference Budd, Warner, Jacka, Li and Treverrow2013; Minchew and others, Reference Minchew, Meyer, Robel, Gudmundsson and Simons2018).
The dynamics that differentiate streaming flow and sheet flow also produce different 3-D distributions of microstructures and temperature. The term microstructure incorporates many factors, including grain geometry (size distribution, shape), grain boundary geometry, crystallographic orientations (fabric) and features such as bubbles and impurities. Together, fabric and temperature arguably have the largest impact on rheology (cf. Minchew and others, Reference Minchew, Meyer, Robel, Gudmundsson and Simons2018) and are the focus of our study. Other factors, such as water content, can have a significant rheological effect (Duval, Reference Duval1977), but are outside the scope of this work.
Although the exact value for the activation energy in viscous flow laws has some uncertainty, particularly above −10°C (Barnes and others, Reference Barnes, Tabor and Walker1971; Weertman, Reference Weertman1983; Goldsby and Kohlstedt, Reference Goldsby and Kohlstedt2001), widespread agreement exists that ice is highly sensitive to temperature. Using typical flow law parameters (Cuffey and Paterson, Reference Cuffey and Paterson2010), a temperature increase of 10°C raises strain rate by nearly a factor of three for the same applied stress. Vertical temperature variation on this order exists in many glaciers. Although less information exists about lateral gradients (e.g., Clark and others, Reference Clarke, Nitsan and Paterson1977; Yuen and others, Reference Yuen, Saari and Schubert1986), we are not aware of measured horizontal variation of this magnitude. Harrison and others (Reference Harrison, Echelmeyer and Larsen1998) report a ~4°C increase at the margin of Whillans ice stream, which equates to softening by approximately a factor of 1.5.
Alignment of c-axes in polycrystalline ice (e.g., Fig. 1) can weaken or strengthen ice due to the strong mechanical anisotropy of the slip systems (e.g., Lile, Reference Lile1978; Duval and others, Reference Duval, Ashby and Anderman1983; Azuma and Higashi, Reference Azuma and Higashi1985; Duval, Reference Duval, Gudipati and Castillo-Rogers2013), the crystallographic planes and directions along which deformation occurs. This enhancement or reduction of strain rate depends on the fabric concentration and the stress orientation relative to the crystallographic fabric (Lile, Reference Lile1978; Shoji and Langway, Reference Shoji and Langway1984, Reference Shoji and Langway1988; Hooke and Hanson, Reference Hooke and Hanson1986; Pimienta and others, Reference Pimienta, Duval and Lipenkov1987; van Der Veen and Whillans, Reference van der Veen and Whillans1996; Thorsteinsson and others, Reference Thorsteinsson, Waddington and Fletcher2003; Ma and others, Reference Ma2010; Hudleston, Reference Hudleston2015; Llorens and others, Reference Llorens2017). For example, in the experiments of Castelnau and others (Reference Castelnau1998), the strain rate varied by up to two orders of magnitude between soft and hard orientations, and Budd and Jacka (Reference Budd and Jacka1989) reported weakening of a factor of 3–10. Martín and Gudmundsson (Reference Martín and Gudmundsson2012) describe how mechanical anisotropy is a critical factor in reproducing stratigraphic patterns at ice divides. Other experiments and models (Pimienta and others, Reference Pimienta, Duval and Lipenkov1987; Jackson and Kamb, Reference Jackson and Kamb1997; Thorsteinsson and others, Reference Thorsteinsson, Kipfstuhl and Miller1997; Wilson, Reference Wilson2000; Duval, Reference Duval1977; Wilson and Peternell, Reference Wilson and Peternell2012) report similar results. Using observational data as a basis for numerical models, Minchew and others (Reference Minchew, Meyer, Robel, Gudmundsson and Simons2018) infer a strong fabric control on softening ice at the margin of Rutford ice stream. Although many studies point to the importance of fabric on viscous strength in general, that relationship in streaming ice, particularly relative to temperature, remains incompletely established.
Example distributions of c-axis fabrics and their corresponding terms used in this study. Stereographic plots represent c-axis orientation, with glacier flow out of the page in the longitudinal direction. LSM, TSM, VSM = orientations of concentrated longitudinal, transverse and vertical single maxima. C-axis distribution shown in the upper right is transverse single maximum. Cone angles in our experiments range from 0 to 90°, where an angle of 0° is equivalent to single crystal behavior and 90° to isotropic behavior.

In this project, we explore the role fabric and temperature distributions play in controlling the flow of streaming ice. One factor that differentiates streaming ice from sheet or shelf flow is the role of lateral boundaries. For locations with a frozen bed, the englacial viscosity controls nearly the entire velocity field; for sites with basal sliding or weak, deforming till, the lateral margins can support the majority of the resisting stress and therefore control the velocity field (Raymond and others, Reference Raymond2001). Because of the mechanical importance of the margins, we pay particular attention to the role of fabric and temperature in these zones. One of the motivations for this study is to ascertain whether the value of measuring the 3-D distribution of temperature and fabric in natural settings outweighed the technical challenges of acquiring the data. Our numerical experiments suggest that the spatial patterns of both temperature and fabric have the potential to substantially effect reconstructions and predictions of streaming ice kinematics and therefore are worth the effort to measure accurately.
Model description
Geometry and theory
This study explores the effect of fabric and temperature on streaming ice flow using geometries derived from natural cases of a mountain glacier and an ice stream (Fig. 2). Our first geometry represents the lower half of a nearly-cylindrical, smooth-sided channel, with spatial dimensions ~8.5 km × 0.5 km × 0.3 km and a ~4° surface slope. Second, we developed a more realistic mountain glacier geometry using bed elevation data collected on Jarvis glacier, located south of Delta Junction, Alaska (S. Bernsen and S. Campbell, unpublished data). The model glacier is ~9 km × 1 km with a maximum depth of ~500 m. For simplicity, we will refer to the smooth-sided geometry as the ‘half-cylinder’ and the more realistic bed geometry as the ‘glacier’. We base our third geometry, an ice stream, on the general structure of Rutford Ice Stream, at 120 km long, 30 km wide and ~2 km deep, with a 0.2° surface slope. To avoid numerical artifacts when calculating the enhancement factor in the margin of the ice stream, we also built a finer mesh version of the ice stream; to reduce computational time, the finer mesh ice stream is only 40 km long. Except where stated otherwise, ice stream results represent the 120 km geometry. All geometries were meshed in COMSOL Multiphysics version 5.2 or newer.
The three ice body geometries used in this study. We model two after a small mountain glacier: (a) smooth geometry of approximately half-cylinder form (239 551 elements), and (b) rough bed similar to natural glacier interfaces (42 925 elements). (c) For the ice stream (60 730 elements), we use dimensions similar to those Rutford Ice Stream in West Antarctica. We employed a finer mesh on a 40 km-long version of the ice stream (34 268 elements) to calculate the enhancement factors shown in Figure 8. Dotted lines mark the flux gate locations for results in this study. Cross sections from those locations, at right, illustrate distribution of temperature and fabric assignments for interior and border regions. Ice body boundaries highlighted in blue are kept at a velocity of 0, or no-slip, throughout all models. Non-highlighted boundaries are prescribed as either slipping or frozen for each model run.

We employ diagnostic (stationary) mechanical modeling, varying temperature, fabric, and slip/no-slip boundary conditions (Fig. 2). Unless otherwise stated, all reference to fabric and temperature refers to englacial properties rather than bed or other conditions. Static model parameters include gravity, density and flow law constants (Table 1). In the diagnostic framework, we do not run the numerical experiments to a certain strain, but rather calculate the velocity field necessary to maintain the prescribed geometry, given the rheological constraints.
Symbols and model constants

We use the open-source, finite-element solver Elmer/Ice (elmerice.elmerfem.org) to perform the numerical experiments (Gagliardini and others, Reference Gagliardini2013). Elmer/Ice extends and specializes the capability of the more general multiphysics code Elmer developed by CSC – IT Center for Science in Finland (http://www.csc.fi/elmer/). Thus, any changes to the Elmer base code also update in Elmer/Ice. We utilize Elmer/Ice's nonlinear (strain-rate dependent) anisotropic flow solver, AIFlow, which uses the fabric orientation to modulate the 3-D flow of the ice (Gillet-Chaulet and others, Reference Gillet-Chaulet, Gagliardini, Meyssonnier, Montagnat and Castelnau2005; Gillet-Chaulet, Reference Gillet-Chaulet2006; Durand and others, Reference Durand2007; Martín and others, Reference Martín, Gudmundsson, Pritchard and Gagliardini2009; Ma and others, Reference Ma2010). Elmer/Ice is one of several models whose results were evaluated through the Ice Sheet Model Intercomparison Project – Higher-Order Models (Pattyn and others, Reference Pattyn2008). The anisotropic flow module has been validated against self-consistent methods (Gillet-Chaulet and others, Reference Gillet-Chaulet, Gagliardini, Meyssonnier, Montagnat and Castelnau2005) and tested against observational data (Martín and others, Reference Martín, Gudmundsson, Pritchard and Gagliardini2009, Reference Martín, Gudmundsson and King2014).
The underlying constitutive relationship relating strain rate $\lpar \dot{\epsilon }\rpar$ and stress (σ) (Gillet-Chaulet and others, Reference Gillet-Chaulet, Gagliardini, Meyssonnier, Montagnat and Castelnau2005) is valid for a transversely isotropic material experiencing a uniform stress distribution within the polycrystal (e.g., Gödert, Reference Gödert2003):

where

See Table 1 for the explanation of variables and symbols. We choose β = 0.04 and γ = 1, (cf. Gillet-Chaulet and others, Reference Gillet-Chaulet, Gagliardini, Meyssonnier, Montagnat and Castelnau2005), recognizing that although parameter choices affect the absolute values of the results, the relative output values and patterns are not highly sensitive to the values of these parameters. Effective viscosity depends on temperature, utilizing the activation energies in Cuffey and Paterson (Reference Cuffey and Paterson2010). We extend Eq. 1 to nonlinear dependence on strain-rate, as in Martín and others (Reference Martín, Gudmundsson, Pritchard and Gagliardini2009):

We define the fabric using the components of the second-order orientation tensor describing the distribution of c-axes in the model's Cartesian reference system:

The orientation tensor requires a 11 + a 22 + a 33 = 1. A concentrated single maximum will have one of the principle values, or eigenvalues of the tensor, much greater than the other two. A girdle will have two co-equal principle values much greater than the third.
Initial and boundary conditions
To avoid additional uncertainties related to calculating the influence of factors such as shear heating and the rate and style of fabric development, we prescribe temperatures and fabrics at the node level, rather than incorporate their evolution into the experiments. In assigning fabric and temperature, we focus on the margin because of its mechanical importance on overall ice kinematics. For the glacier geometries, we define the margin as the zone within l meters above the base of the ice. Unless otherwise stated, glacier and half-cylinder experiments use l = 100 and have no-slip boundaries (Fig. 2). For the slip experiments, we employ a linear Weertman law (friction parameter of 0.01 MPa m−1 year). For experiments with slip at the boundaries, the upper face of the glacier or half-cylinder is kept fixed (Fig. 2). For the ice stream geometry, we define the margins as 2 km thick, laterally, with the transition from fixed to slipping base halfway across the margin (Fig. 2). These experiments take neither water content nor deformable till into account. Although we recognize the influence both factors can have on ice kinematics, here we restrict our analysis to temperature and fabric.
Sensitivity analysis
Here, we examine how two model framework choices affect ice flux. The absolute values of the flux results are sensitive to the position of the flux gate (Table S2). However, the ratios of flux in a perturbed experiment relative to the reference are relatively constant, indicating that the exact position of the flux gate does not substantively affect the interpretations. The story is similar for mesh density: the absolute values of flux vary between the relatively coarse meshes we used for most of our experiments and much finer meshes (Table S3). Results from the finer mesh experiments are uniformly higher flux than the coarser mesh. However, as with the flux gate position, the choice of meshes used for the majority of the experiments does not impact the conceptual interpretations presented at the conclusion of this contribution.
Results
Parameter ranges and reference experiments
For different experiment suites, we assign end-member and more realistic parameters based on natural observations (Tables 2–5 and Table S1). Temperatures represent values typical for these glaciological settings, from −10 to 0°C in the glacier and −30 to 0°C in the ice stream. For fabric, we independently vary the magnitude and direction of the anisotropy for different experiment runs. Natural fabrics exhibit a range of distributions with varying degrees of concentration and structure (Gow and Williamson, Reference Gow and Williamson1976; Hudleston, Reference Hudleston, Saxena and Bhattacharji1977; Hooke and Hudleston, Reference Hooke and Hudleston1981; Herron and Langway, Reference Herron and Langway1982; Alley, Reference Alley1988; Jackson and Kamb, Reference Jackson and Kamb1997; Thorsteinsson and others, Reference Thorsteinsson, Kipfstuhl and Miller1997; Wang and others, Reference Wang2002; Faria and others, Reference Faria, Weikusat and Azuma2014; Smith and others, Reference Smith2017). Most measurements from natural ice come from ice divide or other nonstreaming sites, so we have few datasets from shear margins. One study from the Whillans ice stream margin found a multiple maximum fabric varying to a single maximum with a cone angle ~40° (Jackson, Reference Jackson1999). Hudleston (Reference Hudleston, Saxena and Bhattacharji1977) found a cone angle ~10° for a cm-scale shear zone on Barnes Ice Cap. Our analyses used single maximum fabrics of varying cone angle, with the goal of covering the range expected in natural settings. We calculate the orientation tensor from a random distribution of c-axes that lie within a prescribed angle from a prescribed direction. A cone angle of 0° is equivalent to a single crystal whereas a cone angle of 90° yields isotropic conditions. We describe crystallographic fabric as oriented transverse, longitudinal, or vertical relative to flow.
Effect of temperature on ice flux

The reference models for runs marked with * are isotropic with −10°C ice throughout. The reference models for runs marked with ** are isotropic with −30°C ice throughout. Margins of the half-cylinder and glacier models are a 100 m border along the bed, with no-slip conditions. Margins of the ice stream are 2 km thick on either side of the ice stream, encompassing the frozen-slip transition.
a Details of model runs are in Table S1.
Effect of fabric on ice flux

The reference models are isotropic with −10°C ice throughout. Margins of the half-cylinder and glacier models are a 100 m border along the bed, with no-slip conditions. Margins of the ice stream are 2 km thick on either side of the ice stream, encompassing the frozen-slip transition. LSM, TSM and VSM refer to concentrated single maximum fabrics in the longitudinal, transverse, and vertical directions; numbers represent cone angles.
a Details of model runs are in Table S1.
Ice flux for additional parameter combinations using the glacier geometry

The reference models are isotropic with −10°C ice throughout. Margins of the glacier models are a 100 m border along the bed. LSM refers to a concentrated single maximum fabric in the longitudinal direction.
a Details of model runs are in Table S1.
Ice flux for additional parameter combinations in the ice stream

The reference model is isotropic with −10°C ice throughout. Margins of the ice stream are 2 km thick on either side of the ice stream, encompassing the frozen-slip transition. LSM, TSM and VSM refer to concentrated single maximum fabrics in the longitudinal, transverse, and vertical directions. The number following TSM, VSM and LSM is the cone angle.
a Details of model runs are in Table S1.
Each experiment produces the 3-D velocity field within the ice body. With our primary goal to evaluate the importance of crystallographic fabric on ice kinematics, we present much of our output as flux, representing the volumetric rate of ice passing through a fixed cross-sectional surface approximately perpendicular to flow and located away from the head and terminus of the ice body (Fig. 2). In this stationary model, the geometry remains constant, and the velocity structure, including the surface flux, varies between experiments. Although flux does not capture the full picture of 3-D kinematics, it serves as a worthwhile proxy in assessing overall ice kinematics. To complement the flux values, we also review velocity, strain rate and stress distributions when relevant.
Because the absolute values of the flux are not important to the question at hand, we relate our calculations to reference experiments that are isothermal with isotropic fabric. For the glacier and half-cylinder experiments, the reference temperature is −10°C. For the ice stream, we use −10 and −30°C reference experiments for different comparisons. In subsequent sections, we describe representative results, with experimental sets listed in Tables 2–5. The full suite of numerical experiments related to this study, including the reference experiments, are listed in Table S1.
Temperature variation
In the suite of experiments varying temperature conditions alone (Table 2, Fig. 3), we considered scenarios with uniform temperature, vertical temperature gradients and temperature anomalies in the margins. For this experiment suite, fabric was isotropic. For the half-cylinder and glacier geometries, we explored in most detail the effect of a 10°C temperature variation, between −10 and 0°C. The flux in experiments with warmer ice in either the margin or throughout the ice body ranged mainly between 120 and 130% of the reference (uniformly −10°C) case. For the ice stream, we explored the same −10 to 0°C variation as well as uniformly −30°C ice and ice with a vertically varying temperature (−30°C at the surface and 0°C at the bed). Experiments with warmer ice produced fluxes between 107% and 198% of the reference cases, with the higher values when the whole ice body is warmer.
Ice flux under varying temperature conditions, with embedded cross sections indicating temperature distribution used for that model run, labeled at top of columns. All percentages are relative to the respective reference models with −10°C, isotropic ice. See Table S1 for absolute values.

Additional exploration of parameter space, such as with colder ice and different patterns of temperature distributions, produced results consistent with the values above (Table 2, Table S1).
Fabric variation
For the suite of experiments varying only fabric, we considered three factors: (1) orientation (e.g., vertical, transverse, longitudinal), (2) concentration (cone angle) and (3) position (whole ice body or only in margins). For these experiments, temperature is uniformly −10°C. We consider a wide range of fabrics for completeness, recognizing that several, in particular longitudinal single maximum fabrics, are glaciologically infeasible. Longitudinal c-axes are infeasible because with increasing strain, c-axes rotate toward the normal to the maximum finite shortening direction (e.g., Llorens and others, Reference Llorens2017). Near the center of ice streams and glaciers, where lateral shear is negligible, vertical single maximum fabrics are likely (cf. Faria and others, Reference Faria, Weikusat and Azuma2014). At streaming ice margins, c-axes will concentrate approximately normal to the shear plane.
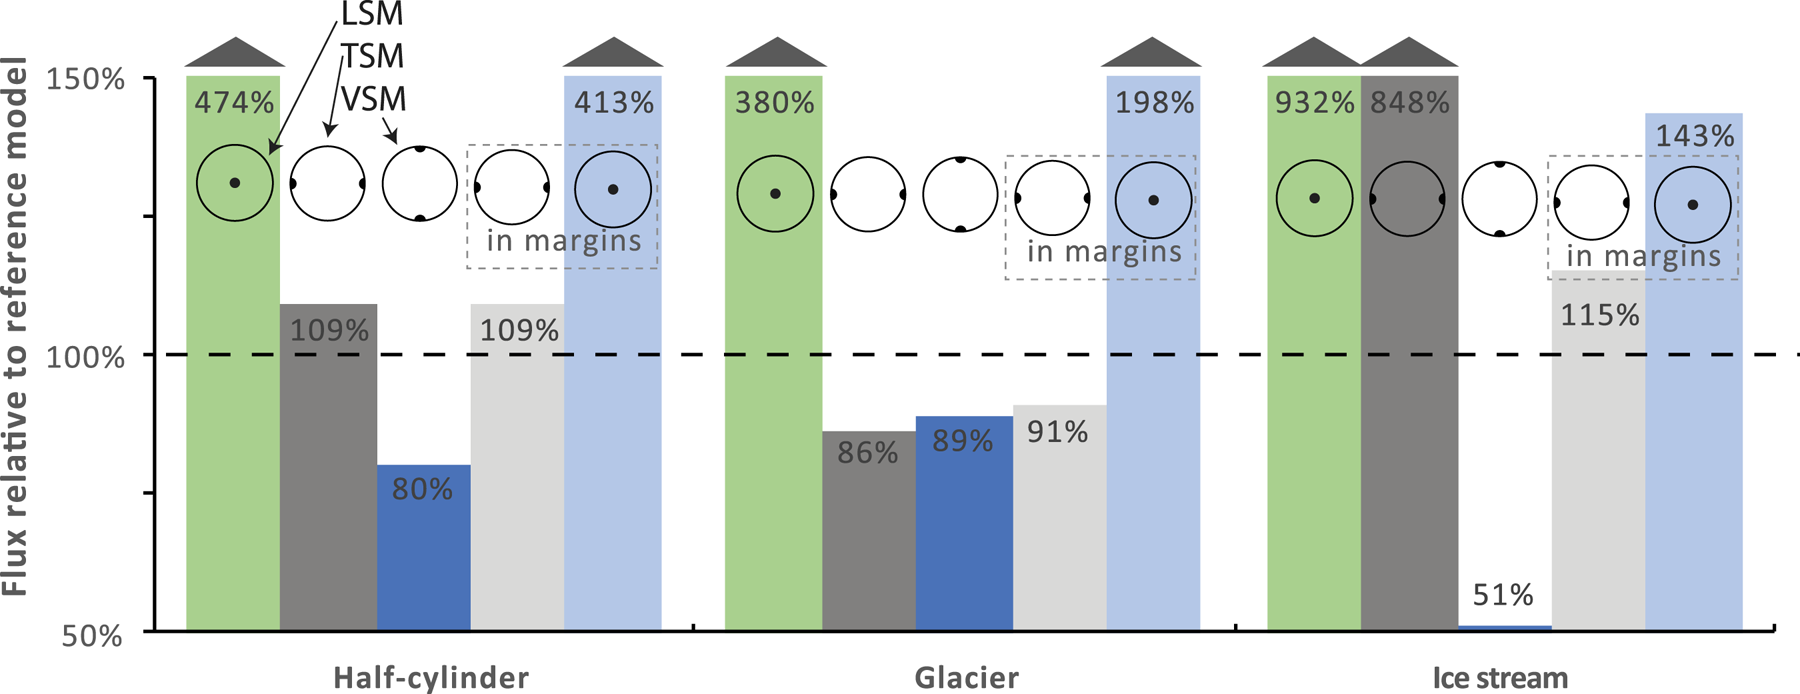
The orientation of c-axes has a marked effect on ice flux. For the whole ice body, longitudinal, vertical and transverse c-axes in the three different geometries yield fluxes 380–932%, 51–89% and 86–848% of the reference experiments (Fig. 4, Table 3). When the concentrated fabrics are restricted to the margins (Fig. 2), the flux values become 143–413%, 96–99% and 91–115% of the reference experiments (Table 3). A concentrated single maximum fabric that rotates normal to the 100 m-wide margin in the half-cylinder – i.e., transverse on the sides and vertical in the center – yields a flux 317% of the reference experiment.
Ice flux under varying fabric conditions. LSM, TSM, VSM = concentrated longitudinal, transverse, and vertical single maximum fabrics (see Figs. 1 and 2). All percentages are relative to the respective reference models with −10°C, isotropic ice, marked by the dotted line. See Table S1 for absolute values; run numbers labeled at bottom of columns.
The cone angle also affects flux. For the half-cylinder geometry, bed-normal c-axes with cone angles of 15° and 45° produce fluxes of 316 and 147% relative to the reference experiment (Table S1, runs 18 and 153). In the ice stream, transverse c-axes with cone angles of 10°, 30° and 60° in the margins, with isotropic ice elsewhere, produces fluxes 115, 110 and 102% relative to the reference experiment (Table 3). Results from additional fabrics, such as with girdles and varying cone angles, are consistent with the results presented here (Table S1).
Glacier boundary conditions
Separate from temperature and fabric, we explored the effect of whether the ice was frozen to the bed or slipped. Many glaciers, particularly those in the −10 to 0°C temperature range, exhibit basal slip. We ran a small suite of end-member experiments in which all but the uppermost face of the glacier or half-cylinder was free to slide, with a friction parameter of 0.01 MPa m−1 year. Because of the reduced resistance, flux increased in all of these experiments relative to the reference. However, both fabric and temperature have a significantly diminished impact. For the half-cylinder, an isotropic experiment with a 0°C margin (−10°C elsewhere) is 101% of the reference slipping experiment (Table S1, run 54), compared with 123% in the no-slip case. Similar relationships hold among other comparisons for both the half-cylinder and glacier geometries.
In contrast to temperature changes, which uniformly have less effect with basal slip, fabric has a more varied, though still a muted, effect. For the half-cylinder geometry with slip, a concentrated single maximum in the transverse direction changes the flux from 109 to 79% of the respective reference cases. A concentrated longitudinal single maximum in a 100 m wide half-cylinder margin is 93% of the reference slipping experiment, compared with 413% in the no-slip case.
Combined temperature and fabric variation
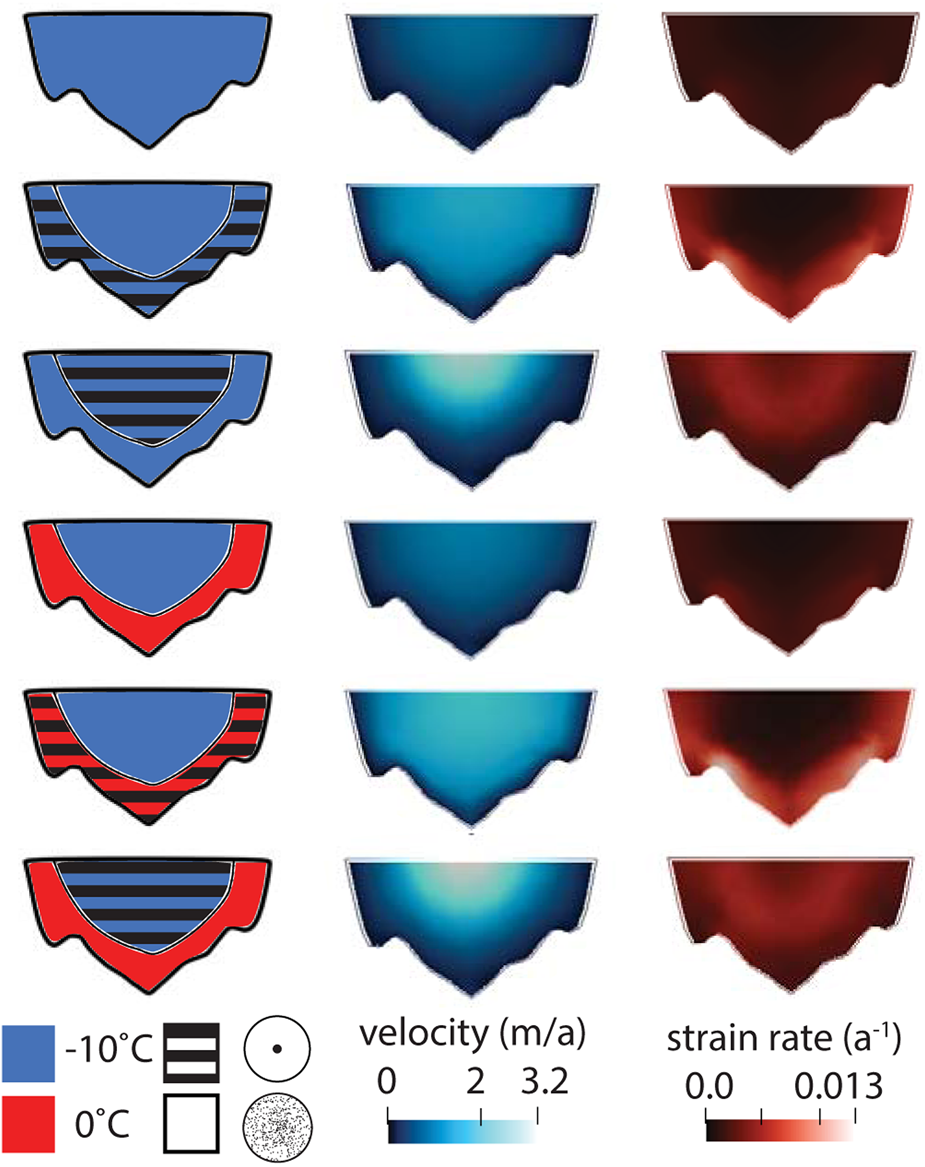
In addition to exploring the effect of single factors on flux, we evaluated instances where both fabric and temperature varied from the reference experiment. Again, we describe only a selection of parameter combinations; additional results are in line with those presented here (Table S1). For the glacier geometry, we report on four distributions of cold (−10°C) and warm (0°C) ice varying distribution independently with isotropic and concentrated longitudinal single maximum fabrics (Fig. 5; Table 4). The center of the glacier constitutes 55% of the cross-sectional area, whereas the border region is 45%; we do not adjust the results by area. For both warm and cold margins (with respective cold and warm interiors) and an isotropic margin (with an anisotropic interior), flux relative to a cold, isotropic reference experiment is ~200%. For both warm and cold margins (with respective cold and warm interiors) and an anisotropic margin (with an isotropic interior), flux relative to a cold, isotropic reference experiment is ~230%. Thus, the presence of a concentrated longitudinal single maximum fabric affected flux more than a 10°C temperature change. The highest strain rates and velocities track the placement of the anisotropic fabric (Fig. 5).
Results of selected glacier geometry experiments. Assigned temperature and fabric (left), calculated velocity (center) and strain rate (right) distributions along a cross section located as shown in Figure 2. No-slip conditions apply throughout the boundary. Flow is out of the page.
For the ice stream geometry, we describe several combinations of temperature and fabric in the margins (Table 5, Fig. 6). With uniformly −10°C ice and concentrated vertical single maximum fabric in the margin, flux is 96% of the reference. Making the margins 0°C overcomes the strengthening effect of the vertical single maximum fabric to induce a flux of 101% relative to the reference experiment. For 0°C margins with the remainder of the ice stream at −10°C, and transverse single maximum cone angles of 0°, 30° and 60° in the margins, fluxes are 123, 117 and 109% of reference fluxes. Strain rate patterns indicate that a concentrated fabric in the margin is more effective than temperate ice in localizing deformation (Fig. 7). The same patterns, albeit with different magnitudes, hold for ice stream experiments with a −30°C reference temperature (Table 5).
Effect of cone angle on ice stream, for a single maximum transverse fabric and selected temperature conditions. Model runs, temperature distributions and c-axis distributions are labeled above columns.

Results of selected ice stream geometry experiments. Assigned temperature and fabric (left), calculated velocity (center) and strain rate (right) distributions along half of a symmetrical cross section located as shown in Figure 2. No-slip conditions apply throughout the boundary. Flow is out of the page.

A common assessment of the impact of rheological parameters on ice mechanics is the enhancement factor, the ratio of the homogeneous viscous strength in a perturbed state to that in a reference state. Because our experiments cannot reasonably be considered homogeneous, we cannot report enhancement factors for the whole ice body. However, we can evaluate local enhancement factors. To do so for the ice stream, we calculated the element-level ratio of the strain rate in the experiment to that of the reference experiments (Fig. 8). A 0°C margin in a −30 to 0°C thermal gradient, isotropic ice stream yields enhancement factors <2. Adding concentrated transverse single maximum fabric in the margins, the enhancement factors are up to ~6. Our results are in strong agreement with the calculations on the margins of Rutford Ice Stream by Minchew and others (Reference Minchew, Meyer, Robel, Gudmundsson and Simons2018), who suggested that ice stream enhancement factors are much more sensitive to marginal fabric than to temperature.
Enhancement factor (E) at the element level for selected temperature-fabric combinations in the ice stream geometry. E is the ratio of strain rate in the calculated model to that in the reference model. In all cases, a −30 to 0°C vertical thermal gradient and isotropic ice exist in the center of the ice stream, while the margins vary to 0°C or a concentrated transverse single maximum (TSM) fabric (numbers refer to model runs; Table S1). Contour is at E = 4. The cross-section represents flow halfway along a 40 km long ice stream. Flow is out of the page.

Discussion
Effect of fabric anisotropy on flux and enhancement factor
In glacier geometries, an end member crystallographic fabric has the potential to more than triple ice flux, when a concentrated single maximum fabric is oriented parallel to flow (Table 3). This fabric permits nearly universal slip along the basal plane, analogous to the initial stages of sheath fold development. However, because c-axes rotate away from a longitudinal position with strain, this flow-parallel fabric must weaken as the ice deforms and therefore is not found in natural settings. More realistic fabrics in streaming ice have a wider cone angle and an average c-axis orientation at high angles to the margin and flow direction (e.g., Allen and others, Reference Allen, Kamb, Meier and Sharp1960; Alley, Reference Alley1988; Jackson and Kamb, Reference Jackson and Kamb1997; Shiraiwa and others, Reference Shiraiwa2001; Smith and others, Reference Smith2017). Maintaining these structural relationships requires the fabric to vary spatially in a glacier geometry, due to the curved bed. Our results using fabrics most likely representative of natural conditions suggest that fabric can reasonably affect flux by 20%.
In the glacier geometries, our experiments focused on frozen-bed conditions, leaving somewhat open the question of the impact of fabric and temperature for sliding glaciers. The few experiments we report with sliding indicate that the effect of both temperature and fabric is less significant if slip occurs at the ice/bed interface. Our slip experiments permitted sliding everywhere except at the headwall; we can consider this slip/no-slip distribution an end-member case. Without a more natural distribution of slip/no-slip conditions, we cannot quantitatively evaluate the importance of fabric and temperature in temperate settings. Qualitatively, we can be confident that with increased sliding, the englacial properties exert less control, largely due to the different stress distribution induced by slip.
Flux reduction from the end-member cases occurs when the fabric is not oriented to maximize flow everywhere across the ice body. The orientations leading to maximum strain rate vary with position relative to ice body boundaries and whether the boundaries are slipping or not. As examples, vertical or transverse concentrated single maximum fabrics in the glacier geometry lead to >10% reduction in flux from the reference experiments (Table 3), and a rotating, bed-normal fabric in the half-cylinder increases flux by approximately a factor of three (Table S1, Run #155). Even though the exact magnitude of the increase or decrease depends on the longitudinal position of the flux gate, particularly for the slipping case, the potential for fabric to affect overall flow is undiminished. Ice stream experiments also exhibit the range of behavior with changing fabric. For example, a change from a concentrated longitudinal single maximum in the ice stream margins to vertical reduces the flux from 143 to 96% of the reference. For the most part, fabric concentration affects only the magnitude of change, not whether the ice is stronger or weaker than in the reference experiments.
Although our experiments do not evolve fabric, they do indicate that strengthening effects due to fabric are more common in the glacier geometry than in the ice stream. In an idealized geometry, such as the half-cylinder, fabric that develops normal to the bed yields higher flux because of the longitudinal uniformity of the bed. However, in natural settings, the irregularity of the bed or merging of tributaries will commonly force fabrics out of alignment with the kinematics. That is, the relative orientation of stress and fabric can quickly change over an irregular bed forcing strengthening because of the obliquity between the stress components and the shear plane for the given fabric (e.g., Thorsteinsson and others, Reference Thorsteinsson, Waddington and Fletcher2003). Similar to our modeling, physical experiments on natural ice show that if a single-maximum fabric lies 22.5° and 45° off the shear plane, the flow enhancement factors are 0.4 and 0.2, respectively, whereas for c-axes normal to the shear plane, the enhancement is 2.78 (Lile, Reference Lile1978). Jackson and Kamb (Reference Jackson and Kamb1997) observed a similar result in their measurements of the Dragon margin of Whillans Ice Stream, in which the anisotropic ice was stronger than expected for the inferred kinematics. These results indicate the potential of variable orientation, due largely to bed roughness, to strengthen ice through a mismatch between local stress and fabric orientation.
Relative effects of temperature and fabric on ice kinematics
We now turn to the question of how much glaciologically reasonable crystallographic fabric anisotropy can influence ice kinematics relative to temperature, with a goal of providing some guidance on the importance of measuring one, the other, or both when trying to capture the essential physics of streaming ice flow. We begin by looking at the ice stream case in which the fabric is transverse, a concentrated single maximum fabric in the margins oriented normal to the inferred shear plane. In this situation, we found that fabric can increase flux by 15% (Table 3). When reducing the fabric concentration to a 30° cone angle, flux increases 10% above the reference case. For comparison, a 10°C temperature increase in the glacier, half-cylinder, and ice stream margins increase flux 7–23% (Table 2).
To explore one case in detail as an example of combined fabric-temperature effects, we consider the relative sensitivity of ice stream flux (Fig. 6, Tables 2, 3, 5). First, as a reminder, a 10° temperature increase (from −10 to 0°C) in the margin has more effect on flux than a transverse single maximum fabric with cone angles ~>60° and a thermal gradient, and with cone angles ~>40° without a thermal gradient (Fig. 9). These and previously described examples of fabric-temperature combinations, indicate that although the influences vary with the individual setting, temperature and fabric can have a comparable effect on streaming ice kinematics. Exploring further, the flux increases for ice stream margins at 0°C with a concentrated transverse single maximum and isotropic ice with a thermal gradient in the remainder of the ice stream, is 17% higher than with only a thermal gradient and isotropic ice. Flux variations by changing only the fabric or temperature in the margin are, respectively, 14 and 2%. Thus, the aggregate effect of changing both the temperature and fabric in the margins is slightly more than the sum of changing the components independently (17% vs 14% + 2% = 16%), indicating the potential for nonlinear interactions between the two parameters.
Relative effects of temperature and fabric concentration in the margins only for the ice stream geometry. Note that the dashed lines represent temperature variation only, hence they are constant with changing cone angle. The impact of a transverse single maximum in the margins is stronger than that of 0°C margins for cone angles tighter than ~40°–60°. Numbers refer to model runs; see Table S1.

Whether temperature or fabric perturbations exert more local effect on ice kinematics depends on the ice geometry, temperature distribution and fabric concentration, orientation and spatial distribution. Where geometric constraints require a high degree of nonplanar flow, or where fabric concentrations are weak, kinematics are more sensitive to temperature variation. These scenarios are more likely due to the higher spatial irregularity of the bed relative to the overall ice dimensions, such as in a mountain glacier. A glacier's geometry forces much of the flow in directions not optimized with the fabric, and typically does not provide much flow distance for a strong fabric to develop before boundary orientation changes, leading to highly heterogeneous fabric distribution (Thorsteinsson and others, Reference Thorsteinsson, Waddington and Fletcher2003; Gillet-Chaulet, Reference Gillet-Chaulet2006). Where flow is largely planar, such as in ice streams or high width-to-depth ratio mountain glaciers, kinematics can be most sensitive to fabric. This interpretation is consistent with that of Minchew and others (Reference Minchew, Meyer, Robel, Gudmundsson and Simons2018), who suggested that, at Rutford Ice Stream, temperature variations determine flow on a 10 km scale, while fabric variations dominate on a 100 km scale. Other comparisons yield similar equivalencies, suggesting the sensitivity of natural ice kinematics to both fabric and temperature.
With concentrated fabrics, anisotropy and temperature effects can either negatively or positively reinforce each other. If fabric development inhibits flow, warmer temperatures can overcome the strengthening effect and raise velocity magnitudes above that of an isotropic case. In contrast, where fabric enhances flow, the temperature distribution could reduce flux below that of an isotropic case. However, many recent studies suggest the presence of temperate ice in high-strain-rate domains (e.g. Suckale and others, Reference Suckale, Platt, Perol and Rice2014; Perol and Rice, Reference Perol and Rice2015), consistent with a positive compounding effect of temperature and fabric in those regions.
Limitations of the model
This study measures the impact of prescribed temperature and crystallographic fabric distributions on ice flux at the glacier and ice stream scale. For this initial inquiry, we purposely did not include or explore several other factors that may play a significant role in controlling kinematics. These include water content, thermal evolution, fabric evolution, more complex patterns of fabric distribution and a wider range of ice body geometries. Many of these factors, such as thermal evolution through shear heating and water content (cg. Suckale and others, Reference Suckale, Platt, Perol and Rice2014), interact nonlinearly. Explicitly incorporating conduction, shear heating, fabric development and geometry change (via a prescribed accumulation-ablation pattern) would allow more optimized 3-D distributions of fabric and temperature to develop. We could also assess the timescale of adjustment to changing environmental conditions. However, given the robust indications from our present study, additional levels of numerical sophistication are unlikely to change the conclusion that ice flux is sensitive to the local distribution and magnitude of temperature and crystallographic fabric. Accounting for other processes and parameters are most critical for individual case studies, where datasets are detailed enough that the numerical scheme can more convincingly investigate the operative glaciological processes.
Implications for field campaigns and future models
Given that fabric orientation and concentration, along with fabric distribution, temperature distribution and ice geometry, have the potential to play a significant controlling role in determining ice kinematics, studies aiming to reproduce or predict ice flow must account for all of these factors. Confidence levels in temperature and fabric measurements play a large role in determining the confidence in overall flux predictions. For temperature, our experiments suggest that uncertainties <±3°C are a reasonable target. For single maximum fabrics, cone angle uncertainty l<±10° will result in reasonable uncertainty in flux. At present, we have too few measurements to assess the generality of temperature and fabric distributions in the ice margins. With additional datasets, we may find sufficient commonalities to reduce the need for location-specific properties.
Ice kinematics depend most strongly on the mechanical properties of high stress sites, making measurements of temperature and fabric from those locations are particularly important. Even within streaming ice margins, which in general are higher stress than the interior, some locations are more influential than others. Sites of high convex bedrock curvature focus strain (Fig. 5), and are high value targets for field campaigns. Despite their importance, margin properties are relatively poorly represented in the observational record compared to those at divide and plateau sites. This is in part due to logistical challenges of gathering data in crevassed and high strain-rate locations. Fortunately, new technology and radar and seismic techniques, such as polarimetry and high-resolution attenuation measurements, should accelerate the pace of observations of both fabric and temperature throughout streaming ice bodies, with a particular emphasis on shear margins.
Conclusions
Complementing laboratory and theoretical studies, we show that crystallographic fabrics in streaming ice can inhibit or enhance flow, with the magnitude of strengthening or weakening depending on the concentration, orientation and location of the fabric, as well as the geometry and boundary conditions of the system. Fabric and temperature can influence ice flow by similar magnitude, though the relative effects vary with internal and boundary conditions. The largest realistic impact of fabric occurs when highly concentrated c-axes lie normal to the shear plane. In glacial settings, the boundary heterogeneity has a strong influence on whether fabrics can develop in that orientation. Along ice stream margins, with a more consistent flow structure, orientations that maximize strain rate appear to be more likely, but the few observations of marginal ice fabrics do not indicate the presence of highly concentrated single maximum fabrics.
Our numerical experiments clearly indicate the equivalent potential of both temperature and crystallographic fabric to influence ice kinematics, with particular effect from ice near the margins. However, the magnitude of the effects in natural settings will remain unresolved until we have more observations from glaciers and ice streams of temperature and crystallographic fabric distributions, as well as additional constraints on the rheological effect of other factors not included in our model.
Supplementary material
The supplementary material for this article can be found at https://doi.org/10.1017/jog.2020.44.
Acknowledgements
National Science Foundation award OPP-1503924 supported this work. Steven Bernsen, Karl Kreutz and Nicholas Richmond provided helpful feedback and technical assistance. Ralf Greve, Sandra Piazolo and an anonymous reviewer provided feedback that improved the quality of this contribution.


 Open access