


Ethiopia, a signatory of the United Nations Sustainable Development Goals, faces a growing food security challenge as its population is projected to reach 171.8 million by 2050 (Abebe and Lakew, Reference Abebe and Lakew2014). Agriculture remains the backbone of the economy, contributing 32.4% of GDP in 2023, providing 62.4% of total employment in 2024 and accounting for 80.4% of merchandise exports through food exports alone in 2023 (World Bank, 2024). According to a livestock survey by the Central Statistical Authority of Ethiopia (CSA, 2021), the country possesses 70.3 million cattle, 42.9 million sheep, 52.5 million goats and 8.1 million camels. Smallholder farmers dominate the livestock sector, which contributes about 46% of agricultural GDP (MoA, 2024). In Ethiopia, dairy production depends mainly on indigenous livestock genetic resources of cattle, camels and goats. Cattle are the largest contributors to the total national annual milk output, followed by camels (Central Statistical Authority (CSA), 2021; Legese et al., Reference Legese, Gelmesa, Jembere, Degefa, Bediye, Teka, Temesgen, Tesfu, Berhe and Gemeda2023). The dairy sector is predominantly traditional, with 98% of milk production from smallholder farmers (Ayza and Olikamo, Reference Ayza and Olikamo2020). The government prioritizes the sector to attract investments and improve food security (MoA, 2022), yet low productivity persists due to limited technology access.
According to the World Development Indicator, 19% of Ethiopia’s population was under severe food insecure in 2023 (World Bank, 2024). COVID-19 and internal conflicts further hindered food security efforts. Previous studies in the field have explored food insecurity trends (Fikre et al., Reference Fikre, Gezahegn, Fikadu and Adugna2017; Peng et al., Reference Peng, Hirwa, Zhang, Wang and Li2021), drivers (Fite et al., Reference Fite, Tura, Yadeta, Oljira and Roba2022; Assefa and Abide, Reference Assefa and Abide2023), policies (Brhanu et al., Reference Brhanu, Ayele and Gebreselassie2023; Gadiso et al., Reference Gadiso, Alemu and Shete2024) and intervention impacts (Taddese, Reference Taddese2019; Takele et al., Reference Takele, Birhanu, Wondimagegnhu and Ebistu2023).
Empirical evidence highlights the links between crop diversification and food security. While diversification is often seen as beneficial socially and environmentally, its outcomes depend on the agricultural system and local context (Waha et al., Reference Waha, Accatino, Godde, Rigolot, Bogard, Pedro, Santos, Gotor, Herrero and Martin2022). For subsistence farming, food security can be achieved at the farm scale through diverse production, while at the landscape scale, specialized farms trading surplus may suffice (Renard et al., Reference Renard, Bennett and Rhemtulla2016). Many studies document the positive impact of crop diversification on food security (Mengistu et al., Reference Mengistu, Degaga and Tsehay2021). For instance, Mango et al. (Reference Mango, Zmasiya, Makate, Nyikahadzoi and Siziba2014) found a positive correlation between crop diversification and Food Consumption Scores (FCS) and a negative correlation with the Household Food Insecurity Access Scale. However, the relationship between crop diversification and food security is complex. For example, a review of 45 studies across 26 countries by Sibhatu and Qaim (Reference Sibhatu and Qaim2018) found around 60% of the studies report positive associations between crop diversification (as measured by production diversity) and food security (as measured by dietary diversity) only for certain subsamples or indicators, the rest found no significant associations at all. Such variability demands context-specific investigations. On the other hand, different international studies documented the impact of dairy technology adoption (DTA) on food security in different parts of the world (Traoré et al., Reference Traoré, Reiber, Megersa and Zárate2018; Kumar et al., Reference Kumar, Mishra, Saroj, Sonkar, Thapa and Joshi2020). In Ethiopia, most studies focused on DTA are limited to investigating determinants of DTA such as Korir et al. (Reference Korir, Manning, Moore, Lindahl, Gimechu, Mihret, Berg, Wood and Nyokabi2023) and Tadese (Reference Tadese2020). Only few studies have examined the impacts of DTA on food security in Ethiopia including Feyisa et al. (Reference Feyisa, Haji and Mirzabaev2023a) and Habtewold and Heshmati (Reference Habtewold and Heshmati2023).
This study contributes to the literature by addressing two gaps. First, it examines DTA holistically as a package of four technologies – improved breeds, improved feeds, vaccines and housing – developing a comprehensive index. Second, it explores the interrelationships among DTA, crop diversification and food security through a system equation approach, recognizing their bidirectional causation in mixed farming systems. Therefore, this study investigates the nexus of these variables among rural households in the study area.
Materials and methods
Description of the study area and design
The study area, Basona Werana Woreda, is a district in the North Shewa Zone of the Amhara Region, surrounding Debre Berhan town, the zone’s capital (see Figure. 1). The study area is located 130 km north of Addis Ababa, Ethiopia’s capital, at coordinates 9°38′00″–9°41′00″ N latitude and 39°30′00″–39°32′00″ E longitude (Hurni et al., Reference Hurni, Berhe, Chadhokar, Daniel, Gete, Grunder and Kassaye2016). CSA projections for July 2023 estimate the population at 147,375, with 75,011 men and 72,364 women. Rural households in the study area predominantly practice mixed farming, combining crop and livestock farming.
Map of the study area.

Figure 1 Long description
The image consists of two maps. The top map shows the location of Basona Werana Woreda within the North Shewa Zone in Ethiopia. The legend indicates Basona Werana Woreda in red, North Shewa Zone in pink and other regions of Ethiopia in green. The bottom map details the road network within Basona Werana Woreda, highlighting Debreberhan town with a green dot. Roads are marked in black lines and the map includes a scale bar indicating distances up to 60 km. Coordinates are provided along the borders of the map, ranging from 39°30'00" to 39°32'00" E longitude and 9°38'00" to 9°41'00" N latitude.
The study employed primarily quantitative approach. Data collection methods include structured interviews and field observations. The target population consists of all rural households practicing mixed farming in Basona Werana Woreda. A multi-stage sampling technique was used. First, Basona Werana was purposively selected as a major milkshed; and, in the second stage, two rural kebeles, Bakelo (N = 934) and Birbisa (N = 300), were randomly chosen. Finally, households were systematically sampled proportional to each kebele's population. The sample size was determined using Yamane (Reference Yamane1967)’s formula:  $n = \frac{N}{{1 + N{e^2}}} = 227$, where n is the sample size, e is ±6% precision and N is the total population, 1234. To account for non-responses, a 15% contingency was added, yielding a final sample of 262 households.
Data analysis
The study utilized both descriptive and econometric methods of analysis. Descriptive statistical tools, including summary statistics, tabulation and graphical analysis, are used to enhance insights and complement regression results.
DTA is measured as a composite aggregated index of four technologies captured as categorical variables namely improved breeds, recommended feeds, vaccination and improved housing, and with weights assigned for each component using consensus-based experts’ judgment of the Lead Executive for Livestock and Fisheries Development, Ministry of Agriculture (see Section G of the Supplementary File for details).
Herfindahl Index (HI) is applied for measuring crop diversification among other competing methods, as it is the most widely used due to its simplicity, and minimal data requirements. The HI was further modified by Hirschmann (Reference Hirschmann1964) to compute the Crop Diversification Index (CDI) (see Section A of the Supplementary File for details). Following Nagpure et al. (Reference Nagpure, Deshmukh, Kumar Sharma and Ingole2017), CDI is further categorized into three levels: high diversification (CDI > 0.6) moderate diversification: (0.3 ≤ CDI ≤ 0.6) and low diversification (CDI < 0.3).
The FCS, developed by the World Food Program (WFP), is used to assess food security. It aggregates data on the diversity and frequency of food group consumption over the past 7 days, weighted by nutritional value (see Table B1 in the Supplementary File). Households are then classified into poor (FCS < 21), borderline (21 ≤ FCS < 35) or acceptable (FCS ≥ 35) categories following WFP (2008).
To examine the causal relationships between food security, DTA and crop diversification, various system-based models were considered. Two-stage least squares instrumental variable regression revealed strong causality and endogeneity between DTA and food security, while no significant relationships were found for crop diversification. Non-nested model tests indicated that an ordered probit model fits the food security equation, least squares regression fits DTA and a double-hurdle (truncated regression) model fits crop diversification. Accordingly, an endogeneity-corrected recursive conditional mixed process (CMP) model is preferred, as it accommodates mixed outcomes (ordered, continuous, and censored), recursive causality and potential correlation of errors across equations. The endogeneity-corrected recursive CMP system is estimated jointly as follows:
 \begin{equation*}\left\{ {DT{A_i}\begin{array}{*{20}{c}}
{FCS_i^*}&{ = {X_k}{\beta _k}}&{ + {\varepsilon _{i1}}}&{} \\
{ = {\alpha _0}}&{ + {\alpha _1}\widehat {FCS_i^*}}&{ + {Z_i}{\theta _i}}&{ + {\varepsilon _{i2}}} \\
{CDI_{i2}^*}&{ = {\gamma _0}}&{ + {\gamma _1}{W_{i2}}}&{ + {\mu _{i2}}} \\
{}&{}&{}&{}
\end{array}} \right.\end{equation*}
\begin{equation*}\left\{ {DT{A_i}\begin{array}{*{20}{c}}
{FCS_i^*}&{ = {X_k}{\beta _k}}&{ + {\varepsilon _{i1}}}&{} \\
{ = {\alpha _0}}&{ + {\alpha _1}\widehat {FCS_i^*}}&{ + {Z_i}{\theta _i}}&{ + {\varepsilon _{i2}}} \\
{CDI_{i2}^*}&{ = {\gamma _0}}&{ + {\gamma _1}{W_{i2}}}&{ + {\mu _{i2}}} \\
{}&{}&{}&{}
\end{array}} \right.\end{equation*} with  $\left( {{\varepsilon _{i1}},{\varepsilon _{i2}},{\mu _{i1}},{\mu _{i2}}} \right) N\left( {0,\sigma } \right)$
where  $FCS_i^*$ is the latent variable of the model capturing unobserved sentiment associated with FCS and ${X_k}$ represents exogenous factors in the food security equation. $DT{A_i}$ is DTA index, $\widehat {FCS_i^*}$captured food security effects corrected for endogeneity, ${Z_i}s$are adoption determinants of the DTA equation. $CDI_{i2}^*$is the latent variable for the intensity in crop diversification and ${W_{i2}}$denotes exogenous regressors in the crop diversification equation. Finally, ${\varepsilon _{i1}},{\varepsilon _{i2}},{\mu _{i1}}\;{\text{and}}\;{\mu _{i2}}$are error terms of the respective equations (see details of the models’ specifications and tests in Section C of the Supplementary File).
Results and discussion
Response rate and instrument validity
Of the 262 households sampled for data collection, 252 (96%) yielded data that were usable for analysis, with only 10 (4%) respondents excluded due to missing values. Therefore, the response rate is within acceptable margins, and the sample data are adequate for analysis.
The questionnaire was adapted from internationally recognized and validated instruments used for assessing DTA, food security and multidimensional poverty. Furthermore, the data collection tools underwent multiple phases of revisions and feedback from professionals and experts, ensuring the reliability and validity of the data.
Results of descriptive analysis
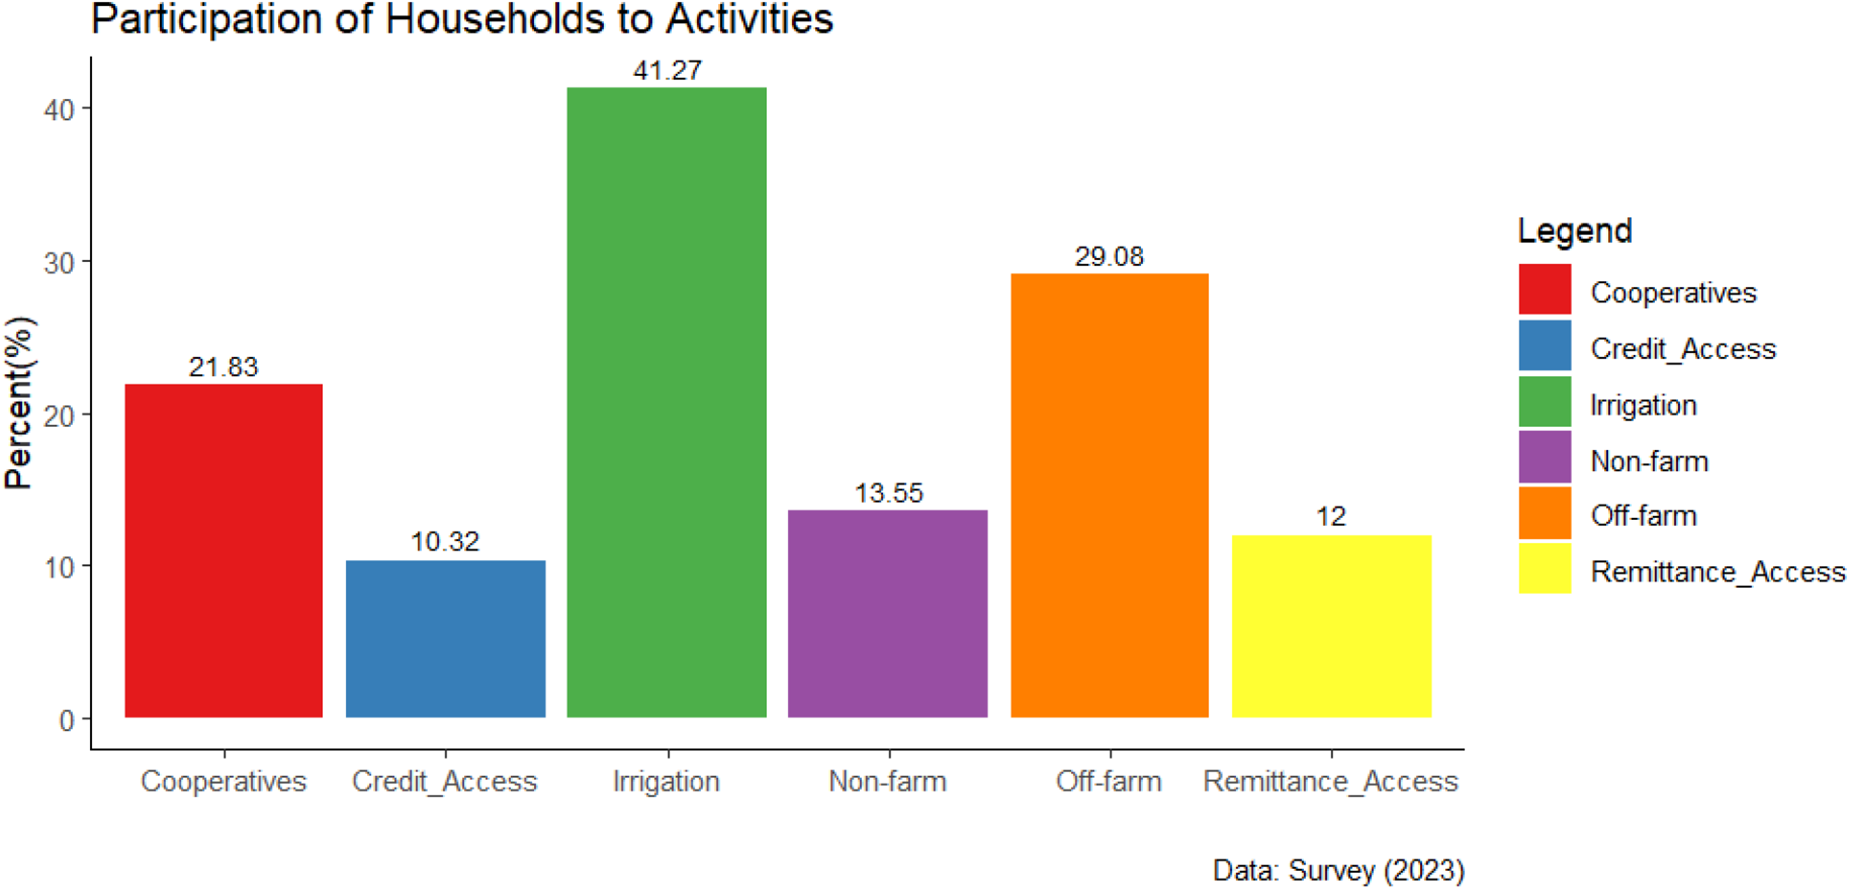
Household heads in the study area are predominantly male and married. More than 44% of household heads have some formal education, while 36.11% are illiterate, and 19.44% have some informal education. Households in the study area are largely involved in farming activities, although the participation in off-farm and non-farm activities is limited. The results show that fewer than 14% of households are involved in non-farm activities, while almost one-third of households engage in off-farm activities.
Participation in small-scale irrigation practices in Ethiopia is typically low. However, as shown in Figure. 2, 41.27% of households in the study area engage in irrigation, indicating that irrigation practices are relatively common in this region. Access to financial services is limited in the study area with only 10.32% of households accessed credit over the last 2 years, and just 12% received remittances in the year 2022/2023.
Participation of households in different engagements.

Figure 2 Long description
The bar graph title reads Part icipation of Households to Activities. The horizontal axis label reads Activities. The vertical axis label reads Percent left parenthesis percent right parenthesis, with tick labels 0, 10, 20, 30, 40. Six vertical bars are labeled on the horizontal axis as Cooperatives, Credit comma Access, Irrigation, Non comma farm, Off comma farm, Remittance comma Access. Values printed above the bars are 21.83 for Cooperatives, 10.32 for Credit comma Access, 41.27 for Irrigation, 13.55 for Non comma farm, 29.08 for Off comma farm and 12 for Remittance comma Access. A legend on the right lists Cooperative, Credit comma Access, Irrigation, Non comma farm, Off comma farm, Remittance comma Access. Text below the plot reads Data colon Survey left parenthesis 2023 right parenthesis.
Furthermore, close to 22% of the sample households are members of farmers’ cooperatives. The average household size is approximately five members, in line with the national average (ILO, 2021). Households in the study area own an average of 0.96 ha of crop land, in addition to smaller parcels for forage (0.12 ha), grazing (0.31 ha) and pasture (0.04 ha). The average cropping land size aligns with the national average of 0.96 ha per household, but slightly lower than the regional average of Amhara (1.09 ha) and Oromia (1.15 ha) (Headey et al., Reference Headey, Dereje and Taffesse2014).
The sample households own an average of 6.40 livestock units (see Tables D1 and E1 in the Supplementary File for conversion factors used and additional descriptive statistics results), which is higher than the 5.63 units in the West Amhara region (Teferra et al., Reference Teferra, Yeheyis, Nelson, Taylor, McNaughton, Sergeant and Sanders2019) and 4.52 units in Southern Tigray (Gebrehiwot et al., Reference Gebrehiwot, Kebede, Meaza, Hailu, Assefa and Demissie2024). On average, households take about 53 min to walk to the nearest market.
DTA and utilization
In Ethiopia, dairy production is predominantly based on smallholder subsistence farming, with relatively few small and medium-sized commercial dairy farms. In 2019, around 6.7 million dairy cows produced an estimated 3.6 billion litres of milk nationally, with over 95% of the milk coming from local breeds (CSA, 2019). However, dairy yields in Ethiopia are significantly lower than in other developing countries, making the adoption of advanced technologies crucial to meeting the growing demand for milk and dairy products in the country.
The study found that about 55% of the households own only local breeds, while nearly 45% own either improved breeds or a mix of local and improved breeds. In Basona Werana Woreda, approximately 55% of households adopt one or more recommended feed types, reflecting a relatively high level of awareness regarding the importance of feed in dairy production. Among the most commonly used feed technologies, standardized crop and hay supplements have adoption rates of 59.92% and 58.33%, respectively, while forage legumes are used by 33.73%. Additionally, over 46% of households combine two or more recommended fodder types for livestock feeding. However, the majority of households fall into the medium or low utilization categories, with only 5.16% of the households perceived very high levels of technology adoption.
Housing conditions were assessed based on three parameters: feeding trough (width, depth, smoothness), floor (slope, gutter) and roof and side wall (ventilation). A significant proportion of dairy producers have adopted improvements in these areas, though most households rate their housing conditions as poor, followed by moderate and good, respectively.
Additionally, most households reported access to regular vaccination services, with 26.59% lacking access. The majority rated their level of vaccination services’ utilization as moderate (36.90%) or poor (25.00%), with only 11.51% rating it as good (see Table F1 in the Supplementary File).
Results of the outcome variables: DTA, CDI and FCS
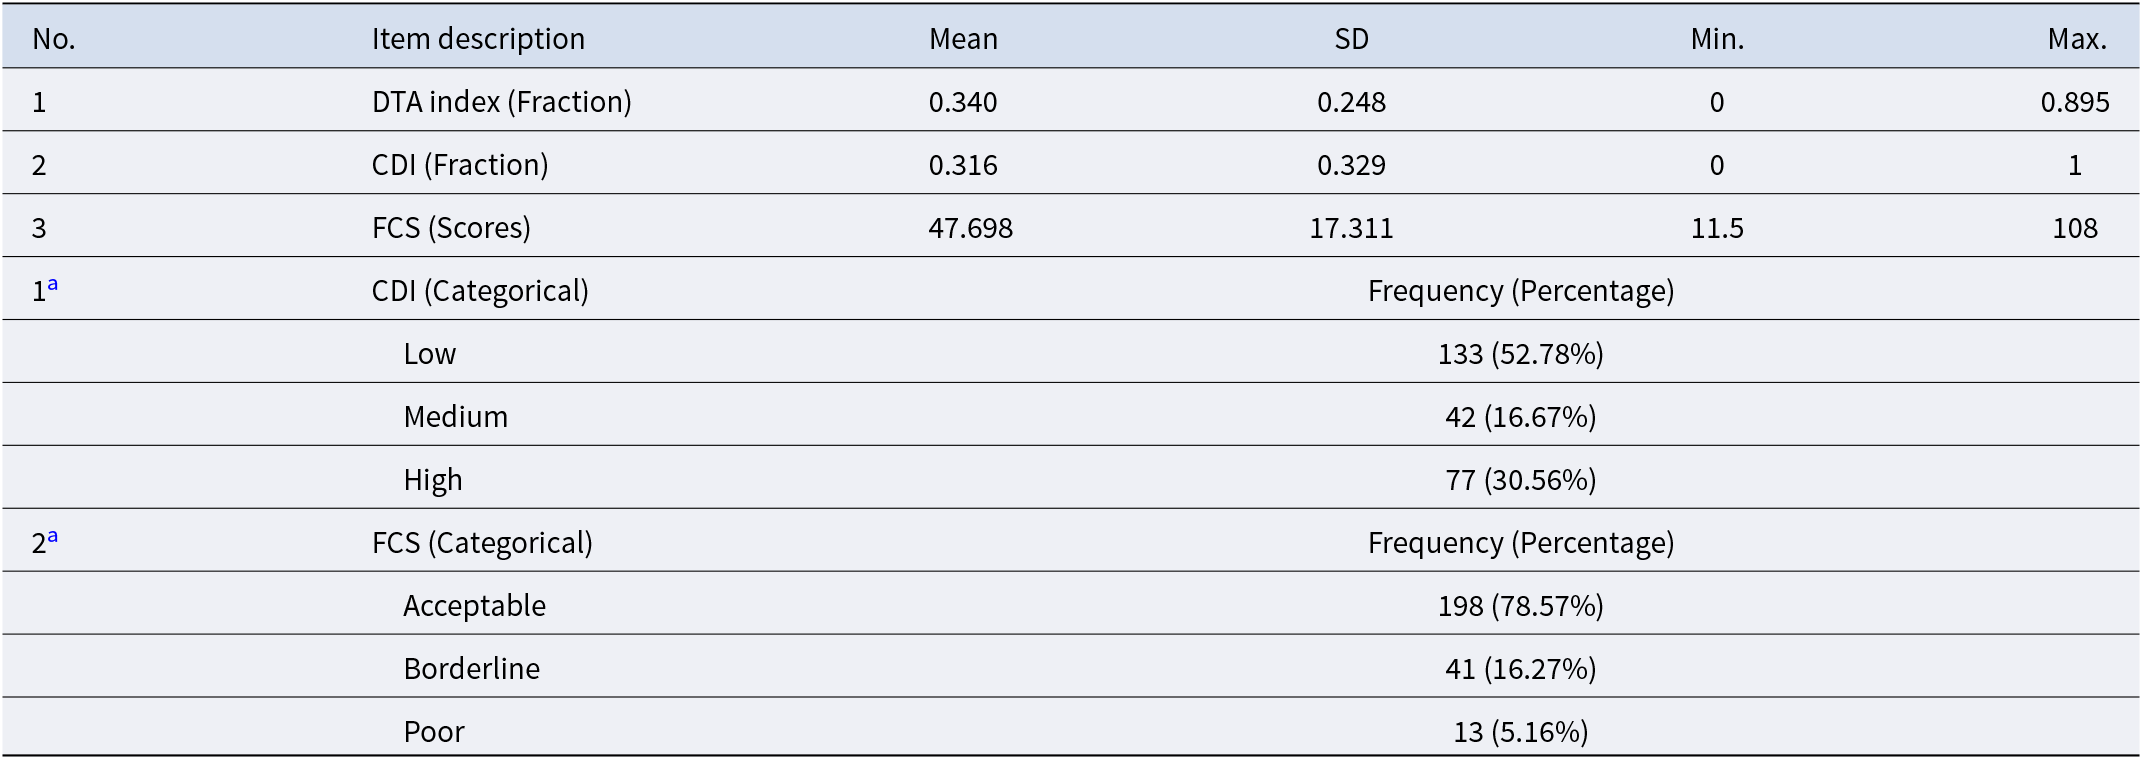
Table 1 presents the results of the outcome variables. The average DTA index, computed attaching appropriate weights to each component based on consensus-based expert judgment resulted in a lower overall DTA index of 0.34, indicating that only 34% of households effectively adopt the combined dairy technologies.
Dairy technology adoption (DTA), Crop Diversification Index (CDI) and Food Consumption Scores (FCS) of sampled households (N = 252)

Table 1 Long description
The table summarizes three household measures: a dairy technology adoption index, a crop diversification index, and a food consumption score, reported with mean, standard deviation, minimum, and maximum for 252 households. Average dairy technology adoption is 0.340 with values ranging from 0 to 0.895. Average crop diversification is 0.316 with a full range from 0 to 1, indicating some households had no diversification while others reached the maximum. Average food consumption score is 47.698, spanning from 11.5 to 108, showing substantial spread across households. In the categorical breakdown of crop diversification, low is most common at 133 households (52.78%), followed by high at 77 (30.56%) and medium at 42 (16.67%). For food consumption categories, acceptable dominates at 198 households (78.57%), while borderline is 41 (16.27%) and poor is 13 (5.16%). The categorical groupings provide distribution context but do not show how categories align with the continuous index values for individual households.
a denotes categorical forms of the outcome variables.
Applying the HI, the average CDI for the sample households is found to be 0.316, which is a lower-medium level of crop diversification. In its categorical form, the result shows that 53% of households exhibit low levels of crop diversification, suggesting that diversification is not a common strategy among smallholders in the study area. The level of crop diversification in the study area is lower compared to studies carried out in other parts of Ethiopia such as 0.413 in Sinana District, Bale Zone by Mengistu et al. (Reference Mengistu, Degaga and Tsehay2021) applying HI and 0.48 in Central and Southern Oromia by Gebiso et al. (Reference Gebiso, Ketema, Shumetie and Leggesse2023) using the Simpson Diversification Index.
As measured by FCS, the average score of the sample households was 47.7, which falls within the “acceptable” range according to Coates et al. (Reference Coates, Swindale and Bilinsky2007), indicating that most households in the study area are food secure. Based on the categorization of World Food Program (WFP) (2008), 78.57% of households are found to be food secure, while 16.27% and 5.16% are borderline and food insecure, respectively.
Results and discussion of the econometric analysis
This study examined the recursive causal relationship among DTA, crop diversification and food security using an endogeneity-corrected recursive CMP regression model. The DTA equation model meets identification conditions, ensuring reliable estimation of system equations as food security is endogenous in the system. All relevant model tests were carried out and the required convergence in the CMP system was achieved (see Section C of the Supplementary File for details). The endogeneity-corrected recursive CMP model results are presented in Table 2.
An endogeneity-corrected recursive conditional mixed process (CMP) model regression results

Table 2 Long description
Three linked regressions report effects on food consumption (ordered probit), dairy technology adoption (ordinary least squares marginal effects), and crop diversification (truncated regression), each based on 247 households. Dairy technology adoption shows a large, statistically strong positive association with food consumption (coefficient about 27.06). In the adoption model, higher food consumption is strongly and positively related to adoption (marginal effect about 0.2348), while crop diversification has a small, not statistically clear relationship with adoption (about 0.0365). For adoption, household size, land owned, and land fragmentation are positive and statistically supported, and favorable perceptions of dairy technology are also positive and statistically supported. In the crop diversification model, dependency ratio and land fragmentation are positive and statistically strong, while extension visits are negative and statistically supported; most other listed covariates are not clearly different from zero. Several membership and finance variables appear only in one model and are often imprecisely estimated, so comparisons across models should focus on variables reported in the same column. Results are presented with standard errors and significance markers, so statistical strength varies by variable and model.
Standard errors in parentheses.
*** p < 0.01.
** p < 0.05.
* p < 0.1.
The regression results show a significant bidirectional relationship between DTA and food security, consistent with Sibhatu et al. (Reference Sibhatu, Krishna and Qaim2015) for Indonesia and Malawi, and Taddese (Reference Taddese2019) for Ethiopia. In contrast, crop diversification has no causal link with these variables, aligning with Sibhatu et al. (Reference Sibhatu, Krishna and Qaim2015) and Waha et al. (Reference Waha, Accatino, Godde, Rigolot, Bogard, Pedro, Santos, Gotor, Herrero and Martin2022). This likely reflects post-1991 land redistribution in Ethiopia's central highlands, where households typically hold around 1 ha of land with plots of similar biophysical characteristics, limiting the role of diversification in enhancing food security or dairy adoption.
Other results from Model 1 indicate that access to irrigation and the amount of saving positively and significantly affect food security at the margins. The results confirm existing literature, such as Domenech (Reference Domenech2015) and Jambo et al. (Reference Jambo, Alemu and Tasew2021), that irrigation reduces production risk, enhances cropping intensity and facilitates a shift towards high-value crops, thereby positively affecting food security. Similarly, savings serve as a buffer against shocks and increase liquidity for timely food access, resulting in improved consumption smoothening and food security, consistent with previous studies including Dinegde et al. (Reference Dinegde, Bekele and Sima2022). On the contrary, both household size and access to credit are negatively and significantly associated with food security at 10% level of significance in line with Gebre and Deshmukh (Reference Gebre and Deshmukh2025) and Feyisa et al. (Reference Feyisa, Haji and Mirzabaev2023b). Household size increases consumption pressure and diminishes labour advantage as additional members are often children, elderly and non-working dependents – hence worsening food security. Similarly, credit is often distress-driven and not necessarily for productive investment by smallholder farmers risking credit diversion and repayment burdens affecting food security negatively.
In Model 2, DTA is positively influenced by the extent of land fragmentation, household size, total area of land owned and perception about improved dairy technology. Although the positive effect of land fragmentation on DTA may appear counterintuitive, in Central Ethiopian mixed crop–livestock systems, higher land fragmentation reduces the suitability of farmland for scale-based crop technologies, thereby encouraging households to reallocate investment towards dairy production and increasing the adoption of dairy technologies. Fragmented plots also generate diverse feed sources (e.g., crop residues, field borders and marginal lands), making improved dairy farming a strategic response to limited crop intensification opportunities. In addition, large farm size provides reliable feed supply and land buffers, thereby incentivizing households’ decision to adopt dairy technologies concurring with Derso et al. (Reference Derso, Tolossa and Seyoum2022). Dairy technologies are labour-intensive particularly for stall feeding, fodder collection, animal care and milk handling; hence, larger households will be encouraged to adopt dairy technology to intensify dairy production as household size reduces their labour constraints, in agreement with the results of Tadese (Reference Tadese2020). Moreover, positive attitude towards improved dairy technologies creates behavioural readiness for farmers to perceive profitability and trust in technology and serves as triggering mechanism for households to translate capacities into actual adoptions in line with Korir et al. (Reference Korir, Manning, Moore, Lindahl, Gimechu, Mihret, Berg, Wood and Nyokabi2023). However, households with access to irrigation are associated with lower levels of DTA indicating that such households gear their resources and investment to crop production than DTA.
Model 3 results indicate that extension visits and access to irrigation are found to negatively impact crop diversification, while dependency ratio and land fragmentation positively influence it. In Ethiopia, agricultural extension has historically emphasized placing priority on high-value crops, yield maximization packages and improved input bundle utilizations, hence promoting crop intensification over diversification, concurring with Mesfin et al. (Reference Mesfin, Fufa and Haji2011) although studies indicate mixed effects. Similarly, irrigation serves as a risk-coping strategy for farmers and hence discourages the room for diversification resulting from production risk. This result is contrary to previous studies such as Mekuria and Mekonnen (Reference Mekuria and Mekonnen2018). However, in rural Ethiopia where many rural smallholder farmers have limited resources, high fixed costs of irrigation and complexity of input coordination with many crops triggers farmers to opt for high-value crop intensification than diversification. Moreover, the promotion of winter wheat irrigation practices by the Government of Ethiopia and orientation of extension development on crop intensification and yield improvement further supports the result of this study. Dependency ratio promotes crop diversification as labour shortage binds households to allocate the scarce labour more efficiently by planting diversified crops that have different planting, weeding and harvesting calendars, in line with Derso et al. (Reference Derso, Tolossa and Seyoum2022), who found higher crop diversification with households having higher dependency ratios. On the other hand, land fragmentation creates multiple plots with different soils, slopes and moisture as well as heterogenous production environments thereby structurally enforcing crop diversification, supporting previous studies such as Ndip et al. (Reference Ndip, Molua, Mvodo, Nkendah, Tabetando and Akem2023).
In conclusion, the overall findings highlight a reinforcing and positive relationship between food security and DTA, whereas crop diversification does not emerge as an important strategy for enhancing food security or advancing dairy farming, and vice versa. Expansion of irrigation and promotion of a savings are central to addressing food insecurity. However, efforts to improve food security should re-examine the roles of family planning and rural credit policies and their implementation. Inadequate borrower screening, weak follow-up and high microfinance interest rates may undermine the effectiveness of rural credit interventions.
Results on the drivers of crop diversification indicate that policy variables such as access to irrigation and extension services tend to work against crop diversification. In contrast, household level covariates such as land fragmentation and dependency ratio are strongly associated with increased crop diversification. Considering the insignificant role of crop diversification in enhancing food security and promoting DTA in the study area, the findings point out the need to identify and address household-level factors that run counter to government policies aimed at improving food security and advancing agricultural development in Central Ethiopia.
While access to irrigation strongly shifts mixed-farming smallholders away from dairy intensification towards crop intensification – as irrigation is also found to significantly reduce crop diversification in Model 3 – land fragmentation, household size, farm size and positive perceptions strongly favour DTA. These results underscore the importance for policymakers of identifying and promoting context-specific and locally optimal agricultural policies that better align policy orientations with household-level characteristics to advance agricultural development and improve smallholder welfare in Ethiopia. Moreover, the insignificance of formal education across the models, coupled with the strong role of farmers’ perceptions in driving modern dairy adoption, suggests the need to prioritize experiential learning approaches. These include targeted extension programs, experience sharing and pilot demonstrations that foster favourable mindsets and attitudes towards dairy technologies among smallholder farmers in Central Ethiopia.
Supplementary material
The supplementary material for this article can be found at https://doi.org/10.1017/S0022029926102064.
Acknowledgements
The study was funded by the Research Office of Addis Ababa University under the Adaptive and Problem-solving Research Fund of the 2022/2023 academic year.


 Open access