


Introduction
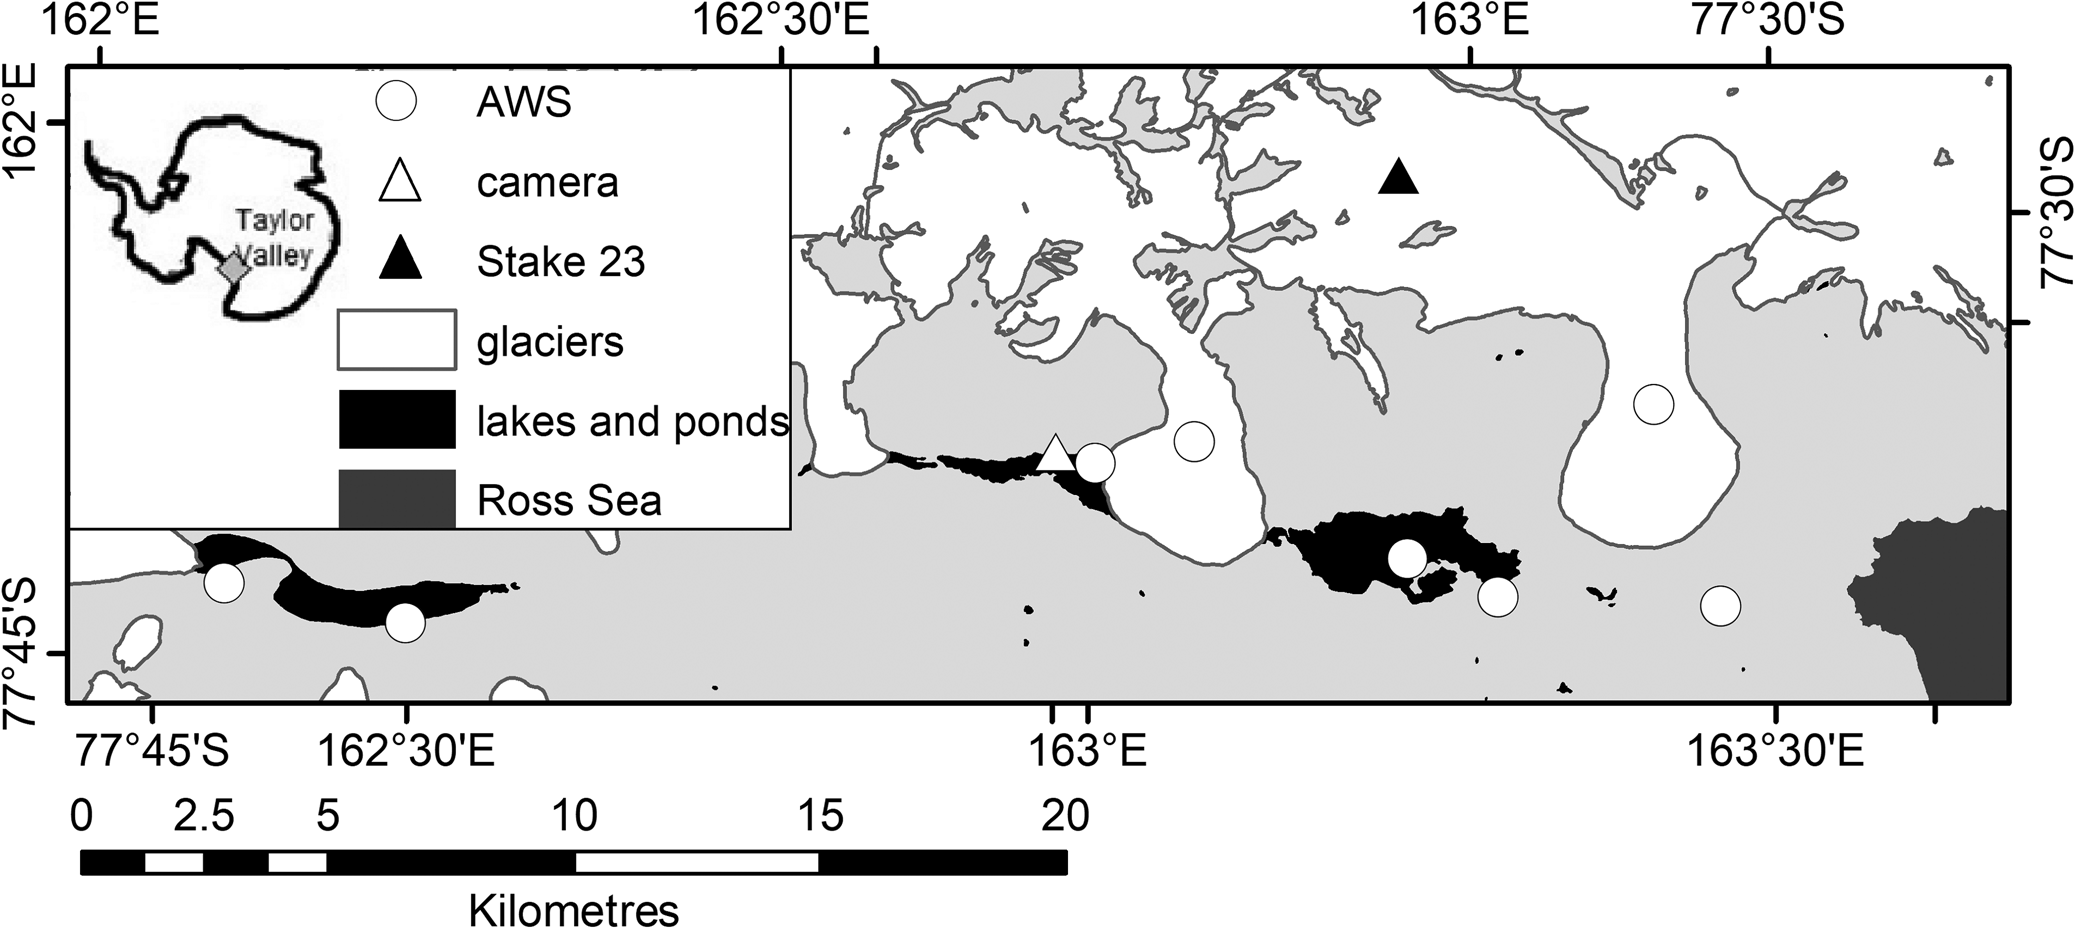
Taylor Valley (TV) lies within the McMurdo Dry Valleys (MDVs), which are located along the coast of Antarctica in southern Victoria Land (Fig. 1). TV is bounded by the Ross Sea to the east and Taylor Glacier to the west. The Transantarctic Mountains buffer TV from the East Antarctic Ice Sheet (Chinn Reference Chinn1990) and exert a precipitation shadow on the MDVs (Monaghan et al. Reference Monaghan, Bromwich, Powers and Manning2005), thereby allowing them to remain ice free and with little snow accumulation. Previous work (Fountain et al. Reference Fountain, Nylen, Monaghan, Basagic and Bromwich2010) found that TV only receives 3–50 mm snow water equivalent (w.e.) annually, with greater accumulation nearest the coast. The average annual valley bottom air temperature of TV is -18.5°C (Obryk et al. Reference Obryk, Doran, Fountain, Myers and McKay2020). When temperatures exceed 0°C, ephemeral streams convey glacial melt to closed-basin lakes along the valley bottom. Water input from the glaciers is balanced by evaporation/sublimation from the lake and lake ice (Doran et al. Reference Doran, Wharton and Lyons1994, Dugan et al. Reference Dugan, Obryk and Doran2013). Seasonal melting of ground ice and snowpacks provides moisture to the soil and transports a nearly equivalent amount of nutrients to the lakes as to the streams (Levy et al. Reference Levy, Fountain, Gooseff, Welch and Lyons2011).
Location of Taylor Valley in Antarctica (inset) with automatic weather stations (AWS), ablation stake 23 and camera site indicated.
The McMurdo Dy Valleys Long Term Ecological Research (MCM LTER) project has supported research in TV since 1992. TV ecosystems are highly sensitive to small climatic fluctuations due to the limited availability of liquid water and energy (Moorhead & Priscu Reference Moorhead and Priscu1998). Microbial productivity peaks during the summer months when light availability drives photosynthesis in the lakes (Fritsen & Priscu Reference Fritsen and Priscu1999) and melt from the surrounding alpine glaciers and snowpacks supports primary productivity in the streams (McKnight et al. Reference McKnight, Niyogi, Alger, Bomblies, Conovitz and Tate1999) and soils (Gooseff et al. Reference Gooseff, Barrett, Doran, Fountain, Lyons and Parsons2003, Levy et al. Reference Levy, Fountain, Gooseff, Welch and Lyons2011). Snow cover reduces solar radiation that would be used for photosynthesis by underlying organisms (Hawes Reference Hawes1985, Bolsenga et al. Reference Bolsenga, Evans, Vanderploeg and Norton1996) by as much as 60% under only 0.5 cm of snow (Perovich Reference Perovich2007). It increases the albedo of the dark, rocky landscape, including icy surfaces (Bergstrom et al. Reference Bergstrom, Gooseff, Myers, Doran and Cross2020), and thereby reduces melt generation during sunlit months (Fountain et al. Reference Fountain, Lyons, Burkins, Dana, Doran and Lewis1999). Additionally, summer snow cover functions as an important moisture source for soil ecosystems during the melt season (Zeglin et al. Reference Zeglin, Sinsabaugh, Barrett, Gooseff and Takacs-Vesbach2009, Gooseff et al. Reference Gooseff, Barrett and Levy2013).
Upon deposition, snow can persist for weeks (Eveland et al. Reference Eveland, Gooseff, Lampkin, Barrett and Takacs-Vesbach2013) and is redistributed by wind and lost to the atmosphere by sublimation and evaporation. Windy conditions can redistribute snow from the surrounding mountain peaks to the valley floor and appear as snowfall events (Fountain et al. Reference Fountain, Nylen, Monaghan, Basagic and Bromwich2010). Nearest the coast, the Lake Fryxell basin experiences cooler temperatures, higher relative humidity (RH) and lower wind speeds than the 20 km inland Lake Bonney (Doran et al. Reference Doran, McKay, Clow, Dana, Fountain, Nylen and Lyons2002a). The RH and wind speed gradients drive higher sublimation rates inland (Doran et al. Reference Doran, McKay, Clow, Dana, Fountain, Nylen and Lyons2002a). Although ablation is dominated by sublimation and evaporation (Hoffman et al. Reference Hoffman, Fountain and Liston2016), snow patches may melt and percolate into the soil. Gooseff et al. (Reference Gooseff, Barrett, Doran, Fountain, Lyons and Parsons2003) observed that subnivean soil moisture was 9.0% compared to exposed soils at 0.5%.
Previously, Fountain et al. (Reference Fountain, Nylen, Monaghan, Basagic and Bromwich2010) discussed the snow in TV from 1995 to 2006. This record covered the climate cooling period identified by Doran et al. (Reference Doran, Priscu, Lyons, Walsh, Fountain and McKnight2002b). Recently, Obryk et al. (Reference Obryk, Doran, Fountain, Myers and McKay2020) employed the non-parametric Mann-Kendal test and revealed a cooling trend (-0.7°C decade-1) ending in 2006 and shifting to no statistically significant trend through 2017. Snowfall in TV has not been re-evaluated since the observed temperature shift.
Under warming conditions, snowfall is expected to increase in polar coastal regions due to the increased evaporation potential of nearby water bodies under reduced sea-ice conditions (Bintanja & Selten Reference Bintanja and Selten2014). In TV, snowfall is controlled by both moisture availability and prevailing wind patterns (Patterson et al. Reference Patterson, Bertler, Naish and Morgenstern2005). When the Amundsen Sea Low (ASL), a low-pressure centre, is positioned north of the Ross Ice Shelf, air masses are carried across the Ross Sea (Patterson et al. Reference Patterson, Bertler, Naish and Morgenstern2005), which allows the sea-ice extent in the Ross Sea to potentially impact snowfall in TV. At other times, the ASL is positioned in the Amundsen Sea and air masses are transported across the West Antarctic Ice Sheet (Patterson et al. Reference Patterson, Bertler, Naish and Morgenstern2005), and snowfall in TV might not be affected by moisture availability in the Ross Sea. Bertler et al. (Reference Bertler, Naish, Oerter, Kipfstuhl, Barrett, Mayewski and Kreutz2006) demonstrated that El Niño Southern Oscillation-Antarctic teleconnections can influence the position of the ASL. During La Niña, the ASL encourages moisture transport across the Ross Sea and El Niño encourages the opposite. Turner (Reference Turner2004) discussed how the teleconnection strength varies on monthly to decadal timescales. Fogt & Bromwich (Reference Fogt and Bromwich2006) demonstrated that the teleconnection is strongest in spring and summer and insignificant in autumn and winter.
One of the key objectives of the MCM LTER is understanding the ecosystem's response to a changing climate (Iwaniec et al. Reference Iwaniec, Gooseff, Suding, Samuel Johnson, Reed and Peters2021). We set out to understand the seasonal and annual variability and short-term trends in snow accumulation and persistence in TV. Due to data limitations, analyses are restricted to the period from August to May when the sun rises above the horizon (i.e. excluding winter). This study was partly motivated by a recent (2006) change in temperature trend from cooling to no statistically significant trend identified by Obryk et al. (Reference Obryk, Doran, Fountain, Myers and McKay2020) and the anticipated increase in polar coastal snowfall as warmer temperatures increase liquid water availability and the local evaporation potential. The dataset is supplemented by 1) changepoint analyses to identify potential changes in snow accumulation at approximately the same time as the temperature shift, 2) regression analyses to better understand the relationship between sea ice and snow accumulation and persistence and 3) an intercomparison of snow-monitoring techniques to provide insights into monitoring snow in a polar desert.
Methods
Automated weather stations
Precipitation has been recorded at four automated weather stations (AWSs) in TV run by Campbell Scientific CR10X dataloggers. Snow accumulation was measured every 15 min by Campbell Scientific SR50 Sonic Ranging Sensors and precipitation, both liquid and solid, was measured by weighing bucket gauges (Belfort) and an antifreeze tipping bucket (Texas Electronics TE525MM) since 1994 (Doran & |Fountain Reference Doran and Fountain2019a, Reference Doran and Fountain2019b, Reference Doran and Fountain2019c, Fountain & Doran Reference Fountain and Doran2019). Precipitation rarely falls as rain in the MDVs (Keys Reference Keys1980). We therefore assume all precipitation recorded by the weighing bucket gauges and tipping buckets fell as snow. Weighing bucket gauges and tipping buckets employ a Nipher wind shield. For windspeeds < 5 m s-1, the Nipher wind shield captures 95–111% of snowfall (Goodison Reference Goodison1978). We processed data in accordance with the methods established by Fountain et al. (Reference Fountain, Nylen, Monaghan, Basagic and Bromwich2010), who calculated snowfall from the difference in accumulation between adjacent days when the difference exceeded 0.5 mm w.e. They converted sonic ranging sensor measurements of snow depth to w.e. using episodic measurements of density. Accumulation during wind speeds > 5 m s-1 is termed ‘wind drift’ and accumulation under lower wind speeds is termed ‘direct precipitation’ (Fountain et al. Reference Fountain, Nylen, Monaghan, Basagic and Bromwich2010). We focus on ‘direct precipitation’ and will refer to it as ‘snowfall’ for the remainder of the manuscript. More details on station setup and data processing are described in detail by Fountain et al. (Reference Fountain, Nylen, Monaghan, Basagic and Bromwich2010). Data are accessible from the MCM LTER website (https://mcm.lternet.edu/meteorology-data-sets).
Similar to a water year in hydrological analyses, a ‘snow year’ was defined from 1 May (which approximately coincides with the final sunset before winter) to 30 April of the following year. The key difference between a snow year and a calendar year is spring snowfall. For example, the 2007 calendar year includes spring snowfall from the 2006 snow year and the 2007 snow year includes snowfall from spring of the 2007 snow year. Total measured snowfall was calculated for each snow year as the sum of differences in daily averages that exceeded the 0.5 mm w.e. threshold defined above. This puts the seasonal and interannual variability of direct snowfall in the context of primary productivity and melt generation, which are governed by available solar radiation (Moorhead & Priscu Reference Moorhead and Priscu1998, Fountain et al. Reference Fountain, Lyons, Burkins, Dana, Doran and Lewis1999). Spring begins on 1 August and ends at the start of summer on 5 November. The end of summer and beginning of autumn is 20 February, and autumn ends on 1 May. Total accumulation was calculated for each season and snow year with over 75% data available. The winter season rarely included > 75% reliable measurements and has been excluded from our analyses. To test the hypothesis of local sea ice influencing snow in TV, we conducted a regression analysis of snow depth by season with distance to the sea-ice edge from Kim et al. (Reference Kim, Daly, Ainley and Ballard2017). Where > 10 years of continuous data were available, we applied non-parametric Pettitt test statistics to determine pivot points (Pettitt Reference Pettitt1979). If three or fewer consecutive years were missing, data were linearly interpolated. The Pettitt test statistic is commonly used to identify changepoints in continuous climate and hydrologic timeseries (Kundzewicz & Robson Reference Kundzewicz and Robson2000). Where changepoints were detected, a non-parametric Mann-Kendall test was run before and after pivot points to characterize the trend. Statistically significant trends were then characterized by Sen's slope, which is the median slope through pairs of points and is insensitive to outliers (Sen Reference Sen1968).
Snow persistence
Ground-based images represent a valuable data source for monitoring snow cover (Härer et al. Reference Härer, Bernhardt, Siebers and Schulz2018, Salzano et al. Reference Salzano, Salvatori, Valt, Giuliani, Chatenoux and Ioppi2019, Portenier et al. Reference Portenier, Hüsler, Härer and Wunderle2020). We utilize a Campbell Scientific CC640 camera that has been taking digital photographs every 6 h at Lake Hoare since October 2007 to evaluate the AWS snow record (Fig. 2). Total number of days with snow on bare ground was determined from visual inspection of the camera record. Any new accumulation of snow on the ground was considered a snow event. The persistence of each event was calculated by subtracting the end date from the initial date with snow on the ground for that event. Images when the camera lens was covered by snow were excluded as missing data. Data were broken into seasons and statistically evaluated in a similar manner to the meteorological record. For calculating uncertainty, we use a resolution of ± 0.5 days.
Frames from the camera on the north shore of Lake Hoare facing east towards Canada Glacier and the coast. The ground used to derive snow-cover persistence is outlined in red. The snow event captured here had a persistence of 3 days, which is the amount of time between a. the last image before snow was seen on the ground and c. the first image in which there was no longer any snow on the ground. b. An example of snow cover on the ground.

For the purposes of regression, changepoint and trend analyses, the fraction of summer days with snow on the ground at Lake Hoare was reconstructed for the years prior to the establishment of the camera from nearby glacier accumulation data. Of the nearby glaciers, Commonwealth Glacier has the longest record of accumulation measurements (since 1993; Gooseff & Fountain Reference Gooseff and Fountain2019). This study utilizes data from stake 23 in the accumulation zone. We chose Commonwealth Glacier stake 23 because of its strong correlation with this dataset compared to the other accumulation stakes throughout TV (Fig. S5). Accumulation is typically measured between November and January each year. Here, we use the percentage of days with snow on the ground derived from the camera between summer accumulation measurements on Commonwealth Glacier. The relationship between accumulation and the percentage of snow-covered days during the summer at Lake Hoare is derived from simple linear regression. Regression analysis was then conducted on snow-covered days and sea-ice extent. To test the effects of local controls on snow persistence, we also conducted a regression analysis against average values for the following meteorological conditions during the period when snow was on the ground: temperature, RH, wind speed, wind direction, shortwave radiation and snowfall amount. All statistical analyses were conducted using SPSS Statistics Software (version 24) unless specified otherwise.
Results
Snowfall
Snowfall from August to May averaged 11 mm w.e. across all TV stations and years. The standard deviation was 11 mm w.e., highlighting the strong interannual and spatial variability of snowfall in TV. Annual snowfall ranged from 1 to 58 mm w.e. and the standard deviation ranged from 3 to 17 mm w.e. The greatest annual snowfall and interannual variability occurred nearest the coast in the Lake Fryxell basin.
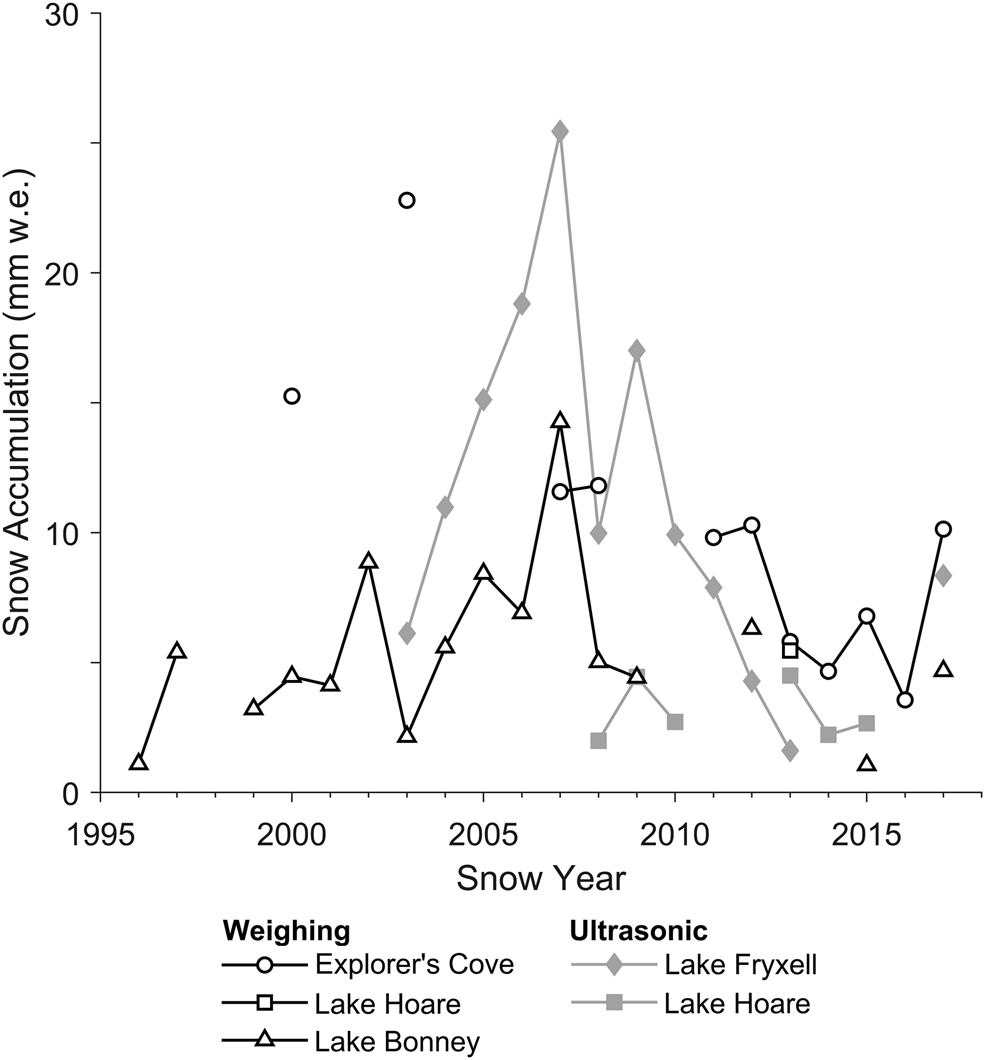
Snowfall from August to May at all stations typically trends similarly but at different magnitudes (Fig. 3). The more inland Lake Bonney AWS and the coastal Lake Fryxell AWS are the only correlated stations (r 2 = 0.66; P < 0.05). All stations plotted against each other are reported in Fig. S1. Over the course of the record, snowfall at both Lake Bonney and Lake Fryxell reached maximums in 2007, although the Pettitt changepoint test did not identify any significant changepoints in either dataset. The Mann-Kendall test identified significantly increasing snowfall (4.5 mm w.e. yr-1; P < 0.05) at Lake Fryxell prior to 2007 and significantly decreasing snowfall (-3.5 mm w.e. yr-1; P < 0.01) from 2007 to 2013. The highest mean snow accumulation was at Lake Fryxell, which received an average of 11.5 mm w.e. from August to May, closely followed by the more coastal Explorer's Cove, which received 10 mm w.e. The Lake Hoare sonic ranging sensor recorded the lowest snowfall (3.5 mm w.e.), but the weighing bucket gauges at both Lake Hoare and Lake Bonney recorded 5.5 mm w.e. From August to May, TV received an average of 7.5 mm w.e. (range: 1.0–25.5 mm w.e.).
August–April snowfall at each station recorded by sonic ranging sensors and weighing bucket gauges. Snow years with > 75% of data missing are excluded. Station locations are provided in Fig. 1. w.e. = water equivalent.
For all stations, the lowest accumulation occurred during the summer and was reasonably consistent at ~0.5 mm w.e. (Fig. 4). However, during spring and autumn there was a pronounced spatial difference in snowfall. Near the coast, Explorer's Cove and Lake Fryxell, respectively, received 4.5 and 5.5 mm w.e. in spring and 4.0 and 4.5 mm w.e. in autumn. Further inland, Lake Hoare and Lake Bonney, respectively, received 1.5 and 2.0 mm w.e. in spring and 1.0 and 2.0 mm w.e. in autumn. Consequently, two-thirds of the snowfall in TV occurred in the Lake Fryxell basin, which includes the Explorer's Cove station, during the spring and autumn.
Snow accumulation (mm water equivalent (w.e.)) recorded at all stations followed by box plots showing the data distribution. Years listed are as snow years. Data are separated by season, which is indicated by shade. Plotted values can be found in Table S1. Weighing bucket data are shown for a. Explorer's Cove and d. Lake Bonney. Sonic data are shown for b. Lake Fryxell and c. Lake Hoare. Note the difference in y-axis scale in b. from the rest of the graphs. No data occur for a. from 1994 through summer 1999 (i.e. November 1999–April 2000); for b. from 1994 through 2002, from autumn 2013 through spring 2014 and for spring 2016; for c. from 1994 through summer 2006, for autumn 2011 through spring 2012 and for summer 2014; and for d. for spring 1995 and 1998, from summer 2010 through summer 2011, from summer 2013 through spring 2014, for spring 2016 and for summer 2017. Years listed indicate snow years.

Lake Bonney (Fig. 4d) experienced consistently low seasonality and high interannual variability of snowfall. Individual large (> 2 mm w.e.) snow events can govern the season-scale variability of snowfall for that year, as we see in 2007 when summer snowfall (9.5 mm w.e.) was nearly double that of spring (5.0 mm w.e.). Low average snowfall and the occurrence of large snow events were probably responsible for the large interannual variability. We did not see any statistically significant season-specific trend in snowfall at Lake Bonney, although our analyses excluded winter. Lake Hoare experienced the weakest seasonality of all stations (Fig. 4c & Table I) and did not show any detectable trends in snowfall for any season, although data availability is limited to the last decade.
Mean seasonal snowfall (± standard error of the mean) recorded at each weather station. Seasons with < 75% data available are excluded.

w.e. = water equivalent.
Closer to the coast, Lake Fryxell experienced the greatest frequency of anomalously high total seasonal snowfall (Fig. 4b). Prior to 2007, Lake Fryxell received consistently high snowfall during the spring and autumn and exceeded the seasonal means for 5 out of the 7 years (spring) and in every year with available data in the autumn. In 2007, snowfall during the spring was 15.5 mm w.e. higher than the mean. Following 2007, Lake Fryxell showed reduced seasonality and snowfall in general. Six of the eight springs experienced below average snowfall. The Lake Fryxell basin experienced the greatest seasonality of snowfall (Fig. 4a & Table I).
We found no correlation between snowfall and distance to the sea-ice edge for nearly all stations and seasons. When sea ice was regressed against cumulative accumulation for the spring, summer and autumn, only Lake Fryxell showed a (very weak) negative correlation (r 2 = -0.27; P < 0.05; Fig. S2).
Snow persistence
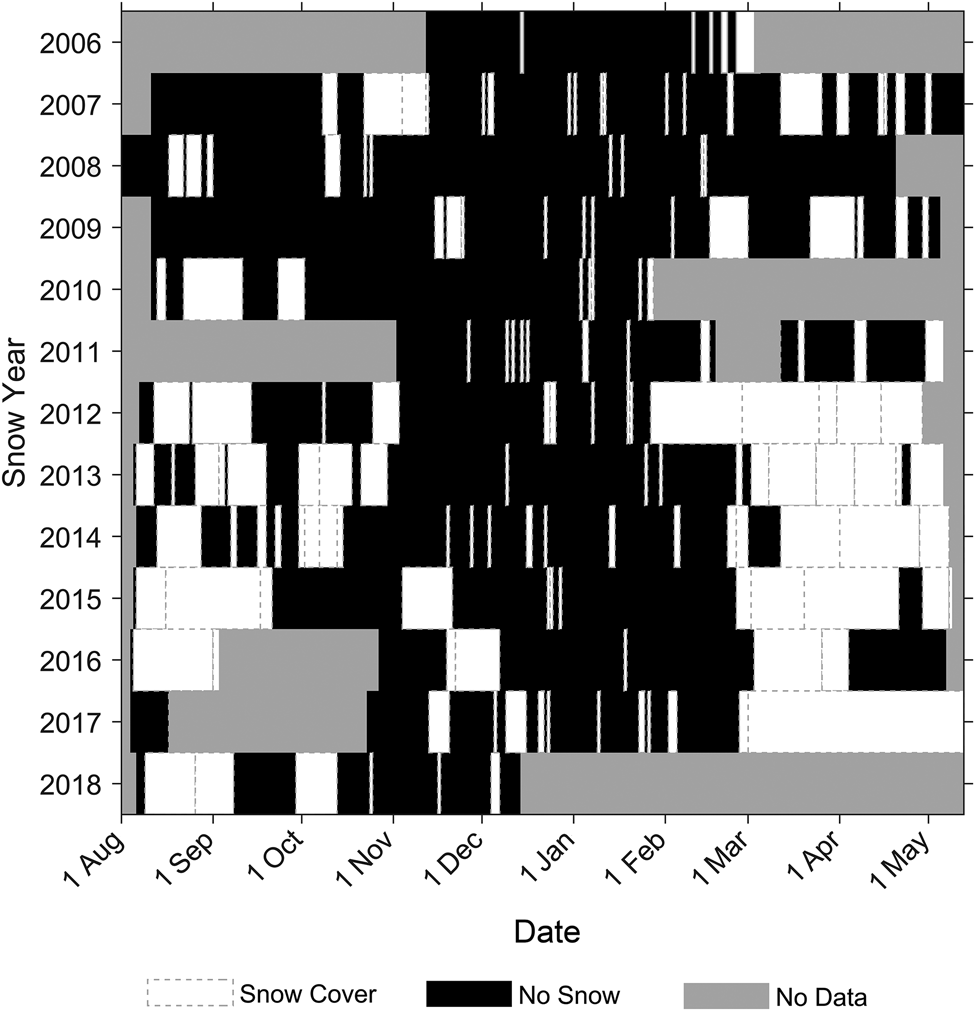
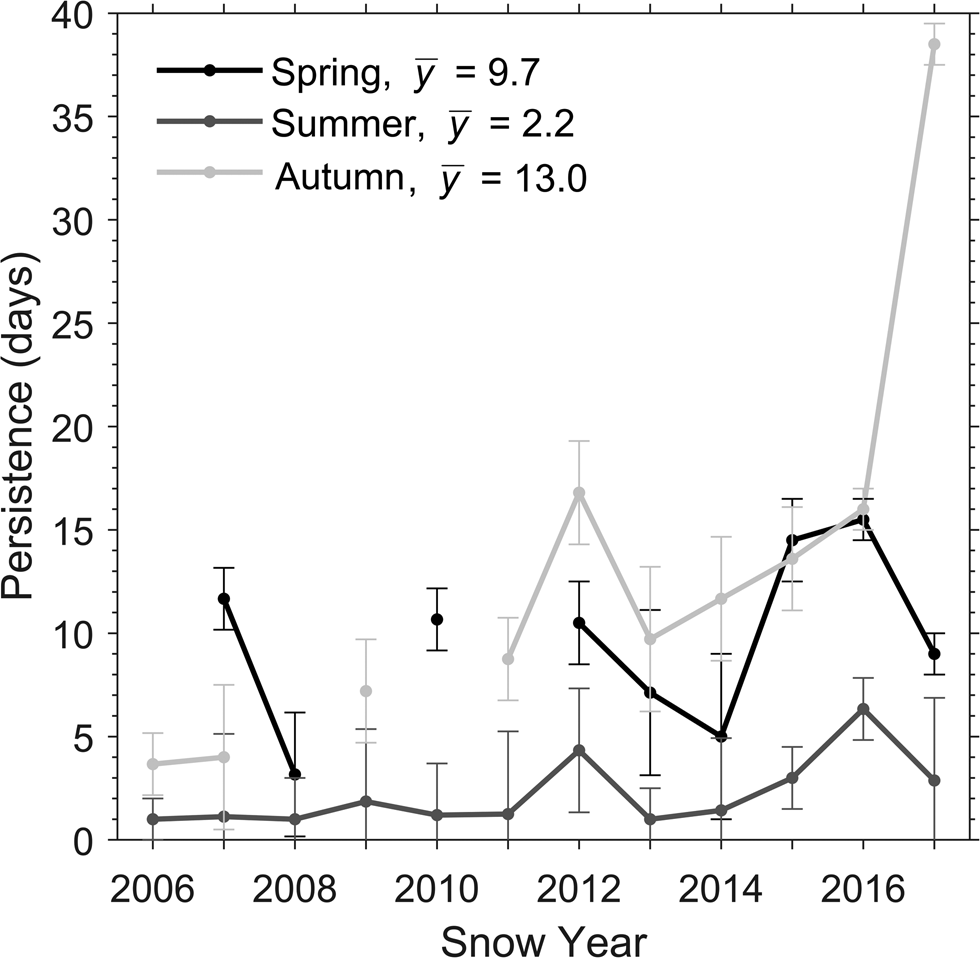
Data from the camera at Lake Hoare revealed that the average number of snow-covered days from August to May tripled from 37 ± 14 days before the 2012 snow year to 106 ± 15 days from 2012 to 2017 (Table S2). Figure 5 suggests that the increase in days with snow cover is primarily due to an increase during the spring and autumn; however, > 25% of data are missing during the spring and autumn seasons of 2006, 2010, 2011, 2016 and 2017. Average snow persistence was derived by dividing the number of snow-covered days by the number of snow events. When broken down by season (Fig. 6), it is clear that snow persistence has been increasing, but only during the autumn. On average, autumn snow cover in the Lake Hoare camera scene lasted 3 days longer than spring snow cover and 10 days longer than summer snow cover (~2 days). Average persistence in the autumn of 2017 was anomalously long due to snowfall on 1 March that lasted through the final sunset. The Mann-Kendall trend test indicates that autumn persistence increased by 1.1 day each year (P < 0.01) over the full record. Fall persistence was correlated with distance to the sea-ice edge (r 2 = 0.69; P < 0.05; Fig. S2), but did not correlate strongly with any of the local meteorological variables (Figs S3 & S4).
Daily snow persistence record derived from the Lake Hoare camera. Dashed lines around white boxes denote individual events.
Snow persistence derived from the Lake Hoare camera. Seasons with < 75% data available are excluded. Error bars are representative of the resolution of the photographs (± 0.5 days per event). Season means are indicated in the legend.
Linear regression analysis revealed a strong correlation between accumulation at Commonwealth Glacier stake 23 and the percentage of days with snow cover at the camera station at Lake Hoare (r 2 = 0.74; P < 0.001; Fig. 7a). The long-term record revealed that the fraction of days with snow on the ground during the summer at Lake Hoare was highly variable (Fig. 7b). Multi-year statistically significant trends were present prior to 2005, followed by increased interannual variability up until 2013. The most recent 5 years of data showed an increase in the fraction of days with snow cover.
a. Percentage of days with snow on the ground between November and January derived from the Lake Hoare camera plotted against snow accumulation measured between the same dates on Commonwealth Glacier. b. Timeseries of summer accumulation and summer snow-cover record.

Data processing and type intercomparison
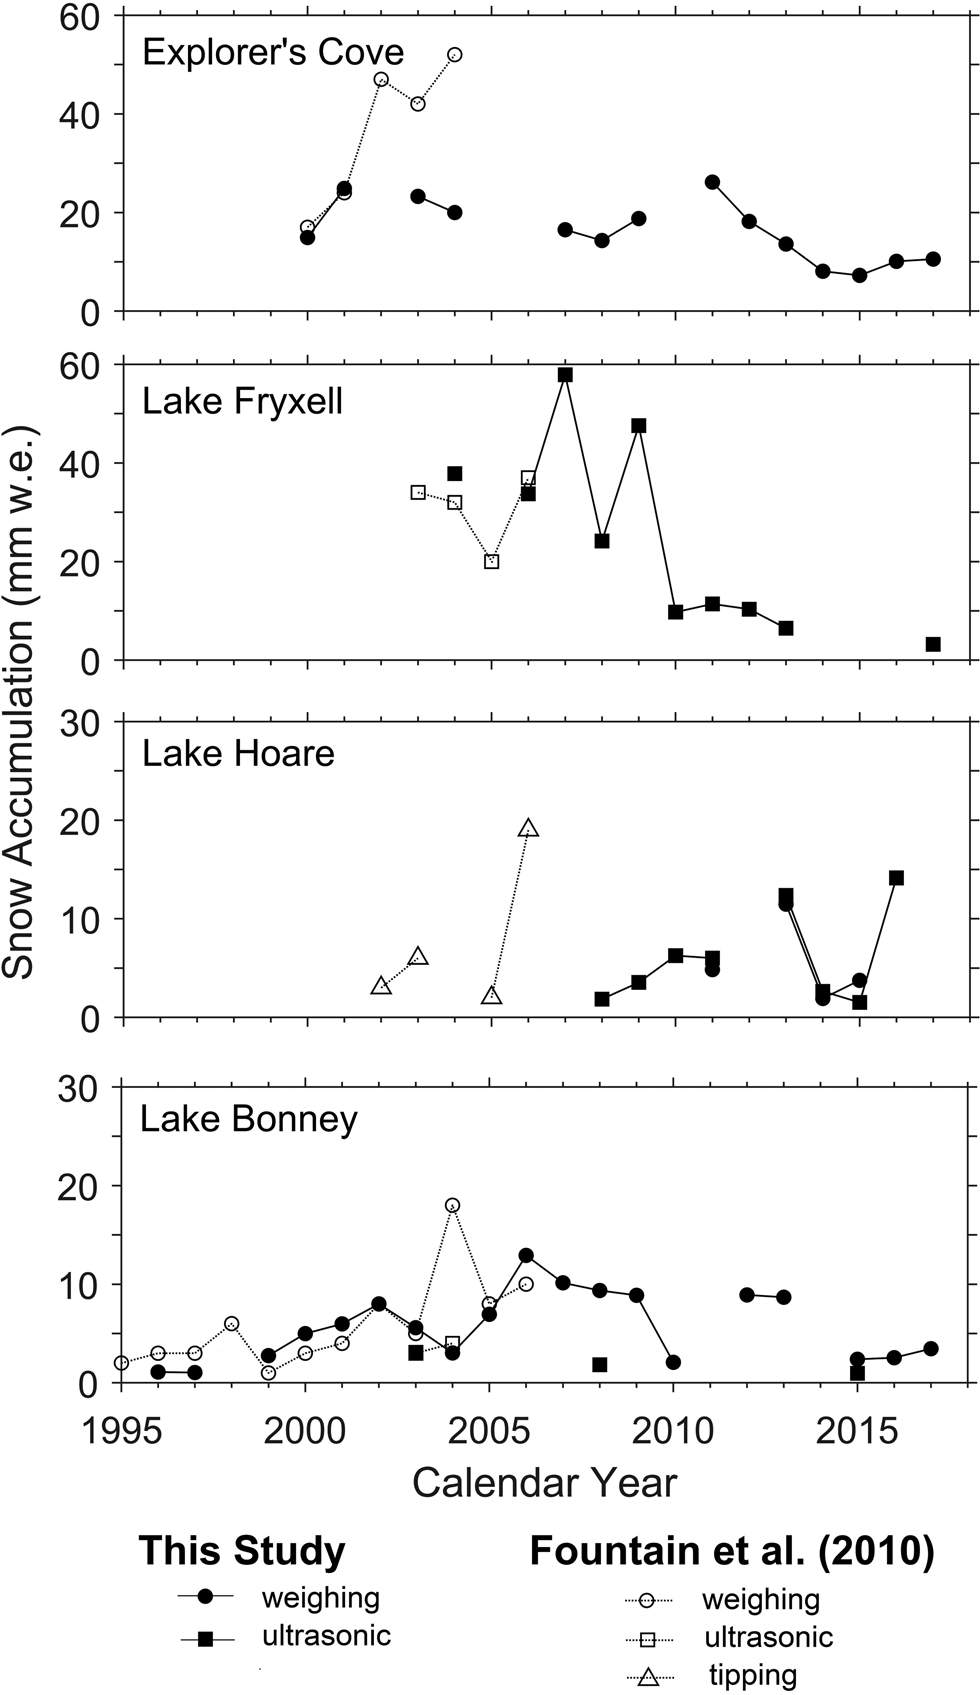
Comparison with the previously published record allowed for interpretation of AWS data in a historical context (Fig. 8). The dataset is the same LTER dataset except for the additional 10 years included in this study and a different analytical approach. Overlapping measurement types agree within ~7 mm w.e. across all stations. The data at Lake Hoare were too sparse to compare with the historical record. Annual snow accumulation derived from the sonic ranging sensor only overlapped with previous measurements twice at Lake Fryxell, and both measurements agree within 3 mm w.e. Agreement varied at Explorer's Cove, and the difference ranged from 0.5 mm w.e. (2001) to 31.0 mm w.e. (2004). The greatest disagreement in data processing between studies was with the weighing bucket gauges, especially in 2003 at Explorer's Cove and in 2004 at both Explorer's Cove and Lake Bonney. The Fountain et al. (Reference Fountain, Nylen, Monaghan, Basagic and Bromwich2010) measurements exceeded those in this study by 15–30 mm w.e. At Explorer's Cove, there are a few apparent accumulation events that Fountain et al. (Reference Fountain, Nylen, Monaghan, Basagic and Bromwich2010) reported, but a closer examination of the 15 min data reveals sustained windspeeds that exceeded 10 m s-1 and lasted 12 h or more during part of those days' records. This resulted in 14.1 mm w.e. being flagged as false accumulation in 2003 and 35.2 mm w.e. in being flagged as false accumulation in 2004. At Lake Bonney, Fountain et al. (Reference Fountain, Nylen, Monaghan, Basagic and Bromwich2010) reported a 15 mm w.e. snow event on 30 January 2004. The 15 min data show an increase by 15 mm w.e. from 10h45 to 11h00 rather than a gradual rise throughout the day, so we have removed this as a false accumulation. Across all stations and measurement types, data processing at Lake Bonney shows the greatest agreement (± 2 mm w.e.) with Fountain et al. (Reference Fountain, Nylen, Monaghan, Basagic and Bromwich2010) probably due to the infrequency of snowfall events and low snow cover, which would reduce the possibility of erroneous accumulation measurements.
Snow accumulation by calendar year from Fountain et al. (Reference Fountain, Nylen, Monaghan, Basagic and Bromwich2010) and this study. Years with < 75% data available are excluded. Table S3 contains a table of errors for the snow accumulations derived in this study and plotted values are shown in Table S4. w.e. = water equivalent.
Sonic ranging sensor measurements only exceeded weighing bucket gauge measurements by up to 1 mm w.e., which is within the error of the instrument, although it may underestimate annual accumulation by as much as 7.5 mm w.e. (Fig. 8). We attribute this underestimate at Lake Bonney in 2008 to two 4 mm w.e. events recorded by the weighing bucket gauge on 10 and 11 January. The camera confirmed that Lake Hoare received a few centimetres of snow on both days, which disappeared within the same day. Annual accumulation calculations from sonic ranging sensor data based on daily averages may underestimate those years with snow accumulation events that persist for < 1 day. It also speaks to the effectiveness of windspeeds < 5 m s-1 at redistributing centimetres of snow.
Upon reanalysis in terms of a snow year, snowfall ranged from 1 to 43 mm w.e. and averaged 8.5 mm w.e. Pettitt's test revealed a changepoint in 2011 at Lake Fryxell (P < 0.05). It also identified a changepoint in 2007 at Explorer's Cove, although this is not statistically significant (P < 0.1). The Pettitt test identified a changepoint in 2007 (P < 0.05) for average accumulation across all stations in TV between 2004 and 2017. From the Mann-Kendall test, the only significant trend is increasing average snowfall in TV by 3 mm w.e. yr-1 (P < 0.05) prior to 2007. Following 2007, the Mann-Kendall test reveals decreasing snowfall by 1 mm w.e. yr-1, although the trend is not statistically significant (P = 0.06).
Discussion
Sources of uncertainty
Campbell Scientific reports the SR50 sonic ranger instrument accuracy at ± 0.5 cm, which is also the average summer accumulation across all stations. The low signal-to-noise ratio and instrument sensitivity to high wind speeds mean that light, low-persistence snowfall recorded by sonic sensors may be filtered out when using current data-processing methods where the difference in daily average distance readings must exceed 0.5 cm for the snowfall to be recorded. Because daily averages are used, if snow both accumulates and ablates within 1 day, then the perceived daily average accumulation is probably approximately half of the actual accumulation recorded by the sonic ranging sensor. Depending on the rate of accumulation and ablation, snowfall based on sonic sensors could be underestimated where accumulation is derived from the difference in daily averages.
Data filtering removes both low-accumulation events (< 0.5 mm w.e. or < 0.5 cm snow depth) and low-persistence (< 1 day) snowfall events. Low-persistence events are filtered out of the sonic sensor data but not the weighing bucket data. We see an example of this at Lake Bonney in 2008, where the measurement derived from the sonic sensor was 80% less than the weighing gauge. A portion of the difference is attributable to a low-persistence 4 mm w.e. snowfall event. Windblown sand could also account for this difference.
Temperature impacts both the sonic ranging sensor and weighing bucket measurements of accumulation. The distance reported by the sonic ranging sensor is calculated based on the speed of sound at the measured air temperature. The accuracy of the sonic measurements depends on the accuracy of the air temperature measurements. Fountain et al. (Reference Fountain, Nylen, Monaghan, Basagic and Bromwich2010) saw that warmer temperatures associated with katabatic wind events in winter and solar heating in summer caused expansion of the weighing bucket and appeared as false snowfall events, but these events were temporary.
The weighing bucket gauge measures w.e. directly, whereas measurements from the distance ranger are converted to w.e. using a fixed density (83 kg m-3) for all snowfall measurements. We found that the accumulation in mm w.e. derived from the sonic sensor on average exceeded that measured by the weighing bucket by 0.1 mm w.e. at Lake Hoare when data are available in 2011, 2013 and 2014 (Fig. 8). Agreement between annual mm w.e. as derived from the sonic sensor measurements and as measured directly by the weighing bucket gauge suggests that the density used to convert snow depth to mm w.e. is suitable for annual values at Lake Hoare.
In contrast to measurements made at Lake Hoare, mm w.e. accumulation derived from the sonic sensor at Lake Bonney was on average 3.8 mm w.e. less than the accumulation measured by the weighing bucket when data are available in 2003, 2008 and 2015. In the years 2003 and 2015, the calculation from the sonic sensor underestimated accumulation by 44% (2.5 mm w.e.) and 59% (1.4 mm w.e.), respectively (Table S1). Snow density cannot be the only source of error. Calculating snow density from differences in measurement types yields 160 and 218 kg m-3 for the years 2003 and 2015, respectively. Both are high values for the MDVs, which average 100 kg m-3 (Keys Reference Keys1980). A detailed analysis comparing measurement types on daily timescales with regular measurements of snow density would benefit future studies of snow in TV. An analysis of the spatial variability of snow density and meteorological controls on snow density could explain a portion of the differences we see in sonic sensor and weighted gauge measurements at Lake Bonney and Lake Hoare.
Instrument limitations, conservative data filtering and the climatic setting of TV mean that we do not capture all of the snowfall events. Wind-blown snow is removed because of the reduced accuracy of the automated measurements during high wind speeds, which could lead to an underrepresentation of snow accumulation at the valley floor. Additionally, the AWS and camera used in this study record accumulation on the rock and soil, which means that our estimates might not reflect accumulation and persistence on the colder icy surfaces (lake ice and glacier ice). Ideally, AWS measurements should be coupled with daily digital photographs to aid in data processing.
Limitations and opportunities
This study excludes winter snowfall aside from the comparison with the Fountain et al. (Reference Fountain, Nylen, Monaghan, Basagic and Bromwich2010) dataset. Low temperatures and strong winds lead to poor data quality during winter, and accumulation cannot be validated or measured from the camera at Lake Hoare, which depends on visible light. Fountain et al. (Reference Fountain, Nylen, Monaghan, Basagic and Bromwich2010) reported that snowfall is greatest in winter. Winter snowfall as well as other physical and biological processes are understudied in polar regions but are gaining attention (Vick-Majors & Priscu Reference Vick-Majors and Priscu2019, Hampton et al. Reference Hampton, Powers, Devlin and McKnight2020, Adusumilli et al. Reference Adusumilli, Fish, Fricker and Medley2021). A timelapse camera with infrared capabilities could offer a solution for future measurements of winter snow accumulation in cold, windy regions, although that method has not been tested.
We filter out snowfall when daily average wind speed exceeds 5 m s-1, thereby excluding blowing snow. Fountain et al. (Reference Fountain, Nylen, Monaghan, Basagic and Bromwich2010) compared automated precipitation measurement types in detail and noted their sensitivity to high wind speeds. High wind speeds increase the noise level of the sonic ranging sensor and can shake the weighing bucket gauge, both appearing as false precipitation events.
Our snow dataset only begins in 1995, which makes it too short for the establishment of a 30 year climatological normal as defined by the World Meteorological Organization (Arguez & Vose Reference Arguez and Vose2011), and the data presented here are subject to high variability from anomalously high- or low-snowfall years or seasons. These considerations are particularly important in interpreting the analysis, which identified a changepoint in annual valley-wide snowfall in the 2007 snow year but no changepoint when based on the calendar year. For example, at Lake Bonney when the data are analysed in terms of a snow year, snowfall increases gradually to 2007, which is followed by less snowfall (Fig. 3).
Snow persistence inferred from the camera at Lake Hoare may overestimate persistence at other locations in TV. Eveland et al. (Reference Eveland, Gooseff, Lampkin, Barrett and Takacs-Vesbach2013) mapped aerial ablation rates throughout TV over the 2009–2010 snow year. They found that 72% of the area covered by snow in October 2009 completely ablated by January 2010 in the Lake Hoare basin. Some 93% and 97% of the snow-covered area in the Lake Fryxell and Lake Bonney basins, respectively, ablated during the same time period.
Snowfall and persistence in other ice-free Antarctic areas such as the Larsemann Hills and Vestfold Hills tend to be dominated by local processes (Gehring et al. Reference Gehring, Vignon, Billault-Roux, Ferrone, Protat, Alexander and Berne2022). Recently, Turner et al. (Reference Turner, Phillips, Thamban, Rahaman, Marshall and Wille2019) demonstrated the dominance of extreme precipitation events in controlling interannual variability of precipitation across the continent. Coupled with the importance of local processes, the trends presented in this study may not apply to other ice-free areas. However, Bracegirdle et al. (Reference Bracegirdle, Krinner, Tonelli, Haumann, Naughten and Rackow2020) concluded that coastal precipitation will increase by 8–31% in the twenty-first century depending on the Representative Concentration Pathway (RCP) scenario. Continued monitoring of snowfall in the Dry Valleys and other Antarctic regions is necessary to determine whether snowfall is indeed increasing.
Snowfall in TV is influenced by the ASL (Patterson et al. Reference Patterson, Bertler, Naish and Morgenstern2005), and the connection between the ASL and snowfall is greatest in the autumn (Fogt & Bromwich Reference Fogt and Bromwich2006). Under increasing greenhouse gas concentrations, the ASL is expected to continue to deepen, although there is some model disagreement in all seasons except the autumn (Bromwich et al. Reference Bromwich, Rogers, Kållberg, Cullather, White and Kreutz2000). A deeper ASL would lead to increased air mass transport over West Antarctica (Bromwich et al. Reference Bromwich, Rogers, Kållberg, Cullather, White and Kreutz2000) and cooler, drier, windier conditions (Patterson et al. Reference Patterson, Bertler, Naish and Morgenstern2005). Sea-ice extent has also been linked to the ASL (Patterson et al. Reference Patterson, Bertler, Naish and Morgenstern2005, Turner et al. Reference Turner, Hosking, Bracegirdle, Marshall and Phillips2015). This could explain the weak correlation of snowfall at Lake Fryxell and snow persistence at Lake Hoare with the distance to the sea-ice edge. We hypothesize a decrease in snowfall and increase in snow persistence during the spring, summer and autumn as the ASL deepens under increased-emissions scenarios. Fogt & Bromwich (Reference Fogt and Bromwich2006) demonstrated that there is no statistically significant correlation between the ASL and TV snowfall during the winter. This hypothesis presumes that the linkages between snowfall and persistence and sea-ice extent are due to their links with ASL depth and position. Previously, Fountain et al. (Reference Fountain, Nylen, Monaghan, Basagic and Bromwich2010) did not observe a correlation between snow and sea-ice extent, but their analysis was conducted on annual rather than seasonal timescales. We propose that the correlation is significant in the autumn because the strength of the influence of the ASL on sea-ice extent and snowfall is also greatest in the autumn. This correlation could be impacted by other factors that were not included in our study, such as the time during which distance to the sea-ice edge was at a minimum for each year.
Conclusions
This paper updates the spring, summer and autumn snowfall record in the MDVs, adding more than a decade of observations to the published dataset. Average snowfall across these three seasons in TV and across all stations from 1995 to 2017 was 11 mm w.e. and ranged from 1 to 58 mm w.e. There was an increase in August–April snowfall between 1995 and 2007 of 3 mm w.e. yr-1; however, from 2007 to 2017 snowfall decreased by 1 mm w.e. yr-1. This follows the shift in ca. 2006 when temperature switched from cooling to there being no detectable trend (Obryk et al. Reference Obryk, Doran, Fountain, Myers and McKay2020). We were unable to determine whether the changepoints were related, but we hypothesize that both are related to the ASL depth and position. The greatest average snowfall (3.6 mm w.e.) for all stations occurs during the spring and the least average snowfall (0.9 mm w.e.) occurs during the summer. During the spring and autumn, coastal stations (Explorer's Cove and Lake Fryxell; average = 4.4 mm w.e.) received twice as much snowfall as inland stations (Lake Hoare and Lake Bonney; average = 1.8 mm w.e). During the summer, there was no discernible spatial gradient with distance from the coast.
Using ground-based imagery, we were able to build a new snow persistence record from 2006 to 2017 during the sunlit periods of the year. The average fraction of days with snow cover tripled from 37 to 106 days at Lake Hoare from 2012 to 2017. On average, both the greatest fraction of days with snow on the ground (50%) and the greatest persistence occurred during the autumn. Additionally, snow persistence increased during the autumn by ~1 day each year since the start of the record in 2006 to the end of the record in 2017. The summer demonstrated the lowest average snow persistence (2 days) and the lowest fraction of days with snow on the ground (12%). The coupling of sonic and weighing gauge measurements with daily imagery revealed shortfalls in snow-monitoring and data-processing techniques. Data processing only included accumulation exceeding 0.5 mm w.e. day-1 due to instrumental and environmental limitations. For sonic sensors, accumulations lasting < 1 day were not captured by the current processing technique. Ground-based imagery is able to capture these low-persistence, low-accumulation events. During the summer months, when temperatures are near freezing, these events can impact surface albedo and the energy available for snow melting.
We hypothesize that August–April snowfall will decrease and persistence will increase under future warming conditions and with a deeper ASL. A continued increase in snow persistence could increase the albedo of TV, slowing glacial melt and thereby slowing the ecologic connectivity predicted by the MCM LTER, although the increase in persistence could be offset by a decline in snowfall. Future analyses seeking to quantify the relationship between the ASL and snow processes would improve climate projections for the MDVs.
Supplemental material
Five supplemental figures and four supplemental tables will be found at https://doi.org/10.1017/S0954102022000256.
Acknowledgements
The authors wish to thank the contractors and Petroleum Helicopters, Inc., for their support in the field. Thanks are also extended to the field parties for reporting snowfall observations during the field season. Extensive comments provided by external reviewers greatly improved the quality of the manuscript. Any opinions, findings, conclusions or recommendations expressed in the material are those of the authors and do not necessarily reflect the views of the National Science Foundation. The authors also wish to thank two anonymous reviewers for their feedback.
Financial support
This research is funded by the National Science Foundation Grant #OPP-1637708 for Long Term Ecological Research. Support was also provided by the Louisiana State University John Franks Chair Fund.
Author contributions
MEM processed all of the data, conducted the statistical analyses and wrote the manuscript. PTD and KFM were responsible for data-processing methods and the inclusion of the statistical analyses. PTD and KFM also aided in manuscript editing and field data collection.


 Open access