


1 Introduction
Evidence continues to accumulate on the significance of early childhood education in improving children’s long-term development and well-being. Studies in neuroscience, education, and social science indicate that improvements in early education can have meaningful impacts on the lives of children (Heckman, Reference Heckman2008; Camilli et al., Reference Camilli, Vargas, Ryan and Barnett2010; Shonkoff, Reference Shiroiwa, Fukuda, Ikeda and Shimozuma2010; McCoy et al., Reference McCoy, Yoshikawa, Ziol-Guest, Duncan, Schindler, Magnuson, Yang, Koepp and Shonkoff2017; Reynolds & Temple, Reference Reynolds, Ou and Topitzes2019) as well as for taxpayers and society-at-large (Reynolds et al., Reference Reynolds, Temple, Robertson and Mann2002; Belfield et al., Reference Belfield, Nores, Barnett and Schweinhart2006; Heckman et al., Reference Heckman, Moon, Pinto, Savelyev and Yavitz2010; Cannon et al., Reference Cannon, Kilburn, Karoly, Mattox, Muchow and Buenaventura2017, Reference Cannon, Kilburn, Karoly, Mattox, Muchow and Buenaventura2018; van Huizen et al., Reference van Huizen, Dumhs and Plantenga2019). However, despite this research, the level of public investments in early childhood education has been relatively low, leaving parents to shoulder the heaviest financial burden in a phase of life when they are less able to afford it (Council of Economic Advisers, 2016).
Some states in the U.S. fund preschool, but on average, among all 4-year-olds across the USA, before the pandemic only a third were enrolled in state preschool programs, and the states spend only a little over $5000 per child in preschool as compared to over $12,000 per year in elementary and secondary school (US Census Bureau, 2017; Friedman-Krauss et al., Reference Friedman-Krauss, Barnett, Garver, Hodges, Weisenfeld and DiCrecchio2019). Good quality early care and education are expensive, with the average full-time childcare costs exceeding the average cost of in-state college tuition in the USA (Schulte & Durana, Reference Schochet2016). Thus, conducting rigorous benefit-cost analysis to assess the magnitude of benefits relative to costs of early childhood programs can be of great importance to ongoing discussions of how many public resources to devote to these programs.
While a few notable studies have investigated impacts on health outcomes in adolescence and adulthood, the majority of the cost-benefit research so far has focused on outcomes such as educational attainment, earnings, and involvement in criminal activity (Reynolds et al., Reference Reynolds, Temple, Robertson and Mann2002, Reference Reynolds, Temple and Ou2011 b; Heckman et al., Reference Heckman, Moon, Pinto, Savelyev and Yavitz2010). The economic impact of early childhood education on health outcomes in adulthood remains understudied, despite the adverse effects of poor health on state and federal budgets and the quality of life. Previous studies of the Chicago Child-Parent Center (CPC) program have identified pathways through which early education programs can impact the health-related outcomes through adulthood (Topitzes et al., Reference Topitzes, Godes, Mersky, Ceglarek and Reynolds2009; Reynolds & Ou, Reference Reynolds2016). To the extent that future health benefits of early childhood programs are overlooked in economic evaluations, the total benefits to society are undercounted.
Through this study, we wish to examine the following research questions:
-
(i) Is there a sustained impact of the Chicago CPC preschool program on physical and mental health outcomes through the mid-thirties?
-
(ii) How large are the monetized benefits of improved health relative to program costs?
In our cost-benefit analyses, we follow the standards expected for conducting and reporting economic evaluations for preventive interventions (Crowley et al., Reference Crowley, Dodge, Barnett, Corso, Duffy, Graham, Greenberg, Haskins, Hill and Jones2018) and specifically early childhood interventions (Karoly, Reference Karoly2012). We estimate the impact of the program on each outcome and use recommended methods in statistical inference for multiple comparisons to adjust p-values. We carefully define the health outcomes of interest to avoid the double-counting of benefits and then perform sensitivity analysis including Monte Carlo analysis and use a range of discount rates to test the robustness of our results. Moreover, our analysis differs from prior CPC work in two major ways. First, this report only examines the preschool component of CPC while the two prior studies also assessed school-age services from first to third grade and the extended (preschool to third grade) program for 4–6 years versus fewer years. In the present study, however, the estimates for preschool impacts are adjusted for participation in the school-age program for which both groups were eligible. Analyzing all program contrasts was beyond the scope of the present study. Second, we only examine impacts for physical and mental health outcomes, not all domains of well-being as the prior studies did. Such a study, which is now underway, would have greatly increased the length and complexity of the report.
2 Literature review
One reason for the underinvestment in good quality early education programs may be that while many studies report strong effects, the evidence is not entirely positive. Some well-publicized research shows that the early gains especially in terms of test scores that are evident in kindergarten may not be discernible by second or third grade. Two notable examples employing random assignment include the U.S. Department of Health and Human Services (HHS)’s Head Start Impact Study and the Tennessee Pre-Kindergarten (VPK) Program. In the Head Start Impact Study, families were randomly assigned an offer for enrollment in Head Start, a federally funded preschool program for children in low-income families. While the first report from the study in 2005 found small but improved effects on cognitive skills, the subsequent report in 2010 found that the effects had mostly faded out by the end of first grade and there was no impact on test scores by the end of third grade (Puma et al., Reference Puma, Bell, Cook, Heid, Broene, Jenkins, Mashburn and Downer2005, Reference Puma, Bell, Cook, Heid and Lopez2010, Reference Peterson, Florence and Klevens2012; Bauer, Reference Bauer2019). Subsequent researchers have reanalyzed these data to incorporate significant heterogeneity in the counterfactual care settings available to study participants and found sizeable effects of Head Start participation for children who would otherwise have not attended preschool (Feller, Grindal, Miratrix, & Page,Reference Feller, Grindal, Miratrix and Page2016; Kline & Walters, Reference Kline and Walters2016).
In the evaluation of the Tennessee Pre-Kindergarten (VPK) Program, Lipsey et al. (Reference Lipsey, Farran and Durkin2018) found that while the program had what Kraft (Reference Kraft2020) describes as a large impact (effect size >0.25) on achievement measures in pre-k, none of these effects of the program on children’s academic achievement and behavior persisted through the third grade. Some evidence indicates that the VPK program participants ended up performing worse than the comparison group on Mathematics (effect size: −0.23) and Science (ES: −0.20) scores in third grade. The authors did note that the quality score of the VPK program (4.15) was below the average of other state pre-k programs (4.35) when measured using the Early Childhood Environmental Rating System-Revised (ECERS-R). Subsequent research by other researchers found that the VPK participants who had attended high-quality elementary schools with high-quality teachers had significant gains in math and language lasting through third grade (Pearman et al., Reference Shonkoff2020).
While there have been numerous studies on the benefits of early intervention, only a subset of these studies has looked at the long-term impacts of early childhood education in later adulthood, well beyond high-school graduation. In this article, we limit our focus to studies that have evaluated the impact of an early childhood education program beyond 20 years. Further, we review the studies that investigate the long-term impact on health outcomes or have conducted cost-benefit analyses that may or may not include benefits accruing to improved health outcomes.
2.1 Long-term evaluations of major early childhood programs on non-health outcomes
The long-term effects of various early childhood education programs have been evaluated by multiple researchers using a variety of research designs. Estimates of the long-term effects of the Head Start program, which is a nationally offered federally funded preschool program for poor children in the US, tend to come from studies that leverage historical regional differences in program availability to estimate effects by comparing participants in national surveys who were more or less likely to have participated. Carneiro & Ginja (Reference Carneiro and Ginja2014), Barr & Gibbs (Reference Barr and Gibbs2019), and Bailey et al. (Reference Bailey, Timpe and Sun2020) are examples of studies that find significant effects of Head Start on educational attainment and crime. Additionally, sibling comparison studies have found that children who attended Head Start were significantly more likely to complete high school by approximately 9 percentage points (Garces et al., Reference Garces, Thomas and Currie2002; Deming, Reference Deming2009), and attend college by 6–12 percentage points (Deming, Reference Deming2009; Bauer & Schanzenbach, Reference Bauer and Schanzenbach2016). These findings, however, should be interpreted with caution since these studies rely on retrospective reports of participation from data sets whose original purpose was not to assess the effects of Head Start. Prospective longitudinal cohorts studies of early childhood programs provide more interpretable estimates of impact given that participation and implementation is measured fully in real time.
More direct evidence of other early childhood programs comes from several longitudinal studies employing randomized trials or strong non-experimental study designs that follow participants into adulthood. Three early childhood education programs have been extensively evaluated by following a cohort of program and comparison group children over more than three decades – the HighScope Perry Preschool ProgramFootnote 1 (PPP), the Abecedarian ProjectFootnote 2 (ABC), and the Child Parent-Center ProgramFootnote 3 (CPC). Although the three programs differ in their scale of operation, location and time of the offering, target population, and programming, evidence of improved outcomes in later-life associated with early education intervention are found in studies of each of these programs, including but not limited to higher high school graduation rates, adult employment, earnings, and lower involvement in criminal activities (Campbell et al., Reference Campbell, Pungello, Burchinal, Kainz, Pan, Wasik, Barbarin, Sparling and Ramey2012; Schweinhart, Reference Schweinhart2013; Reynolds et al., Reference Reynolds and Ou2018; Heckman & Karapakula, Reference Heckman and Karapakula2019; García et al., Reference García, Heckman, Leaf and Prados2020).
2.2 Study of health outcomes of early childhood programs
Evaluations of the Head Start program have found the program to be associated with increased access to preventative health services (Currie & Thomas, Reference Currie and Thomas1995), improved measure of self-reported health status (Deming, Reference Deming2009), lower incidence of depression (Bauer & Schanzenbach, Reference Bauer and Schanzenbach2016), lower incidence of behavioral problems, and reduction in obesity among adolescents (Carneiro & Ginja, Reference Carneiro and Ginja2014). Englund et al. (Reference Englund, White, Reynolds, Schweinhart, Campbell, Reynolds, Rolnick and Temple2014) investigated the effects of early childhood education on adult health (age 21) using data from the longitudinal studies of the PPP, ABC, and CPC programs. They measured outcomes such as alcohol, tobacco, and drug use, two or more indicators of these health-compromising behaviors, and depressive symptoms. The study found significant differences in outcomes for drug use (ABC, CPC), tobacco use (CPC), depressive symptoms (CPC), and on two or more indicators of health-compromising behaviors (CPC, PPP).
In the age-37 follow-up study of PPP, Muennig et al. (Reference Muennig, Schweinhart, Montie and Neidell2009) found statistically significant improvements in the health status of program participants. However, the observed differences in rates of self-reported medical conditions as diabetes, hypertension, obesity, asthma, and arthritis were either not significantly different or in the opposite direction of that expected. In a further follow-up at age 55, Heckman & Karapakula (Reference Heckman and Karapakula2019) found health effects of the program in form of lower excessive cholesterol and lesser likelihood of being bedridden for males, and lower rates of diabetes and substance abuse among the females, as compared to the control group.
Muennig et al. (Reference Muennig, Robertson, Johnson, Campbell, Pungello and Neidell2011), in their age-21 follow-up study of the Abecedarian program, found that the program participants had improved health outcomes (consisting of depression index, health problems, and hospitalizations), and reduced chances of behavioral risk factors. Interestingly, a later study at age 30 by Campbell et al. (Reference Campbell, Pungello, Burchinal, Kainz, Pan, Wasik, Barbarin, Sparling and Ramey2012) found no significant effects of the program on mental health, substance abuse, and self-reported health status. However, the study could be limited by its small sample size to have enough power to detect small effects of the program which could also be significant. In a further follow-up study with a specific focus on health outcomes in mid-thirties, using medical exam data on blood pressure, hypertension, BMI, and cholesterol, Campbell et al. (Reference Campbell, Conti, Heckman, Moon, Pinto, Pungello and Pan2014) found that the program was associated with a significantly lower prevalence of health risk factors. In the most recent reanalysis of the study data, García et al. (Reference García, Heckman and Ziff2018) found that the ABC/CARE (Carolina Approach to Responsive Education) program had a significant effect on a composite health index of both male and female participants. The index included health outcomes and health behaviors including smoking, body mass index (BMI), psychological distress, asthma, high blood pressure, heart disease, cancer, lung disease, and diabetes, among others, at age 30. While the effect was statistically significant, it was not practically large with an effect size of 0.06.
Dietrichson et al. (Reference Dietrichson, Kristiansen and Nielsen2018) conducted a meta-analysis of 26 studies that evaluated long-term outcomes of universal early childhood programs across the world and found mixed effects on long-term health outcomes. However, a detailed reading of the study revealed that only three of the 26 studies included in the analysis actually reported measures of health and well-being. Nonetheless, these studies contribute to a small set of literature that evaluates a variety of health outcomes much later into adulthood.
2.3 Benefit-cost analyses of early childhood programs into adulthood
Ramon et al. (Reference Puma, Bell, Cook, Heid, Shapiro, Broene, Jenkins, Fletcher, Quinn and Friedman2018) conducted an economic review of 11 studies that evaluated early childhood education programs in the US across the district, state, and federal levels, and found median returns of $4.19 in total benefits for every dollar invested in a program. While the estimated benefits did not include health measures, the study argued from a health equity perspective that the benefits from a more productive labor force could provide cost savings for government health care programs and private health insurers.
Using data from the Head Start Impact Study (HSIS), Kline & Walters (Reference Kline and Walters2016) estimated a benefit-cost ratio of the Head Start program to be in the range of 1.10–1.84 including only the effects on adult earnings. It is worth noting that the benefits of the program could be much higher if the impacts on crime, health, or other externalities were also incorporated into the analysis.
Two major cost-benefit analyses of the Perry program were conducted at age 27 and age 40, where, the program was estimated to provide a return of $7.16 and $12.90 for every dollar invested in the program in the age-27 and age-40 follow-up respectively (Schweinhart, Reference Schulte and Durana1993; Barnett, Reference Barnett1996; Nores et al., Reference Nores, Belfield, Barnett and Schweinhart2005). While the study accounted for benefits accruing from the reduction in schooling and welfare costs, reduction in the justice system and victim costs from the crime reduction, and increase in taxes paid resulting from higher earnings, health benefits were not included in the analysis. Belfield et al. (Reference Belfield, Nores, Barnett and Schweinhart2006) estimated the benefit-cost ratio going further higher to 12.90 in the age-40 follow-up. However, most benefits were accrued from lower criminal justice system expenditures, higher tax revenues, and lower welfare payments. While the study measured some health outcomes such as smoking, frequency of drug use, and drinking, these were not included in the benefit calculation due to a lack of significant impacts. A reanalysis of the benefits of the program by Heckman et al. (Reference Heckman, Moon, Pinto, Savelyev and Yavitz2010) produced a similar benefit-cost ratio of 12.20.
Barnett & Masse (Reference Barnett and Masse2007) conducted a benefit-cost analysis of the ABC program at age 21 and found the program to repay $2.5 for every $1 invested. While they included the benefits from cost savings related to smoking, other health measures were not evaluated in this study. In the most recent follow-up of this sample, García et al. (Reference García, Heckman, Leaf and Prados2020) estimated the full life-cycle benefits and costs of the ABC/CARE (Carolina Approach to Responsive Education) programs by forecasting its full array of benefits such as labor income, parental income, health, and reduced crime. They estimate a benefit/cost ratio of 7.3 after adjusting for the welfare cost of taxation to society to fund the programs.
In benefit-cost analyses of the CPC program at ages 21 and 26, Reynolds et al. (Reference Reynolds, Temple, Robertson and Mann2002, Reference Reynolds, Temple and Ou2011) found the program to provide returns in the range of $7–11 for every dollar invested. However, these studies did not measure the effect of the program on health outcomes, with the majority of the benefits accruing from increased earnings and tax revenues, and averted criminal justice system costs. While the effect on smoking was estimated in the age 26 study, the benefits were not included in the analysis as a statistically significant impact on smoking was not found. A partial CBA comparing the preschool program costs to the benefit solely arising from reduced expenditures on special education has been reported in Temple & Reynolds (Reference Temple and Reynolds2015). The study reports that the benefits in terms of special education cost savings amount to approximately 60 % of the preschool costs.
3 CPC program and pathways to long-term impact
The CPC program is a center-based early childhood intervention that provides comprehensive, continuous educational and family support services to economically disadvantaged children from preschool through third grade (Figure 1). As noted earlier, due to space limitations and clarity in reporting, we focus on the preschool component with adjustment for differential participation in the school-age program. The CPC program focused on five key features: providing an early education intervention no later than age 4, a structured learning approach for language and basic skills, increased parent involvement, provision of health and social services, and program continuity between preschool and elementary school (first to third grades) (Reynolds et al., Reference Reynolds and Temple2003). See also Reynolds & Ou (Reference Reynolds2016) for a historical account and manual for current implementation.
Child-parent center program model. Reprinted from “Success in early intervention: The Chicago child-parent centers” by Reynolds (Reference Ramon, Chattopadhyay, Barnett and Hahn2000, p. 33). Copyright 2000 by the University of Nebraska Press.
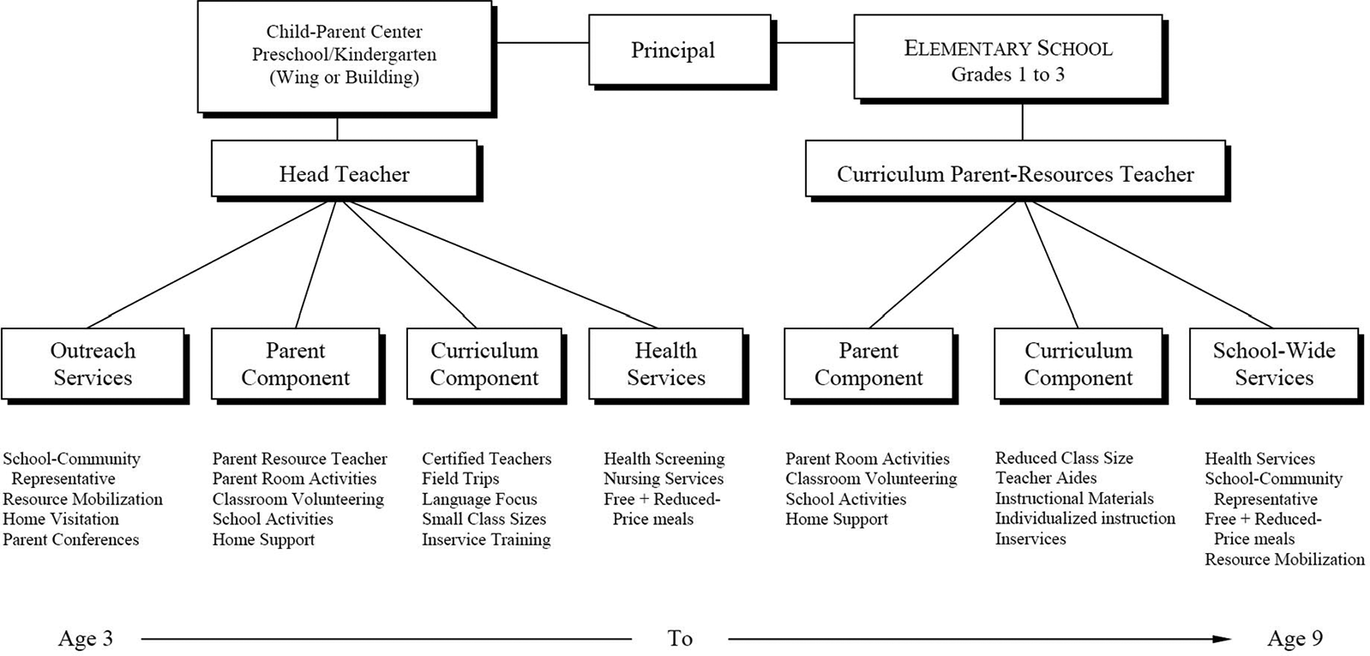
The program operated 3 hours daily for 5 days a week. To ensure individual attention for each child, the centers had a low child-to-staff ratio of 17:2. There was a special focus within the program on increasing the involvement of parents in the school, requiring them to participate at least one-half day per week in activities such as going on field trips or trips to the library, and supervising reading and play sessions at the school. The promotion of health and good nutrition was a component of the CPC program, with physical health and psychological development being one of the important goals of the program during its inception (Reynolds, Reference Ramon, Chattopadhyay, Barnett and Hahn2000, p. 27). After enrolling in the CPC program, children were provided a health screening from a registered nurse on-site and given tests for vision and hearing. Medical and immunization histories of children were obtained from parents and they were required to have a physical and dental examination. Children who needed preventative services were then referred to appropriate service agencies (Reynolds, Reference Ramon, Chattopadhyay, Barnett and Hahn2000, p. 43). The program also made available special medical and educational services such as speech therapists and school psychologists to the participants (Reynolds, Reference Ramon, Chattopadhyay, Barnett and Hahn2000, p. 47).
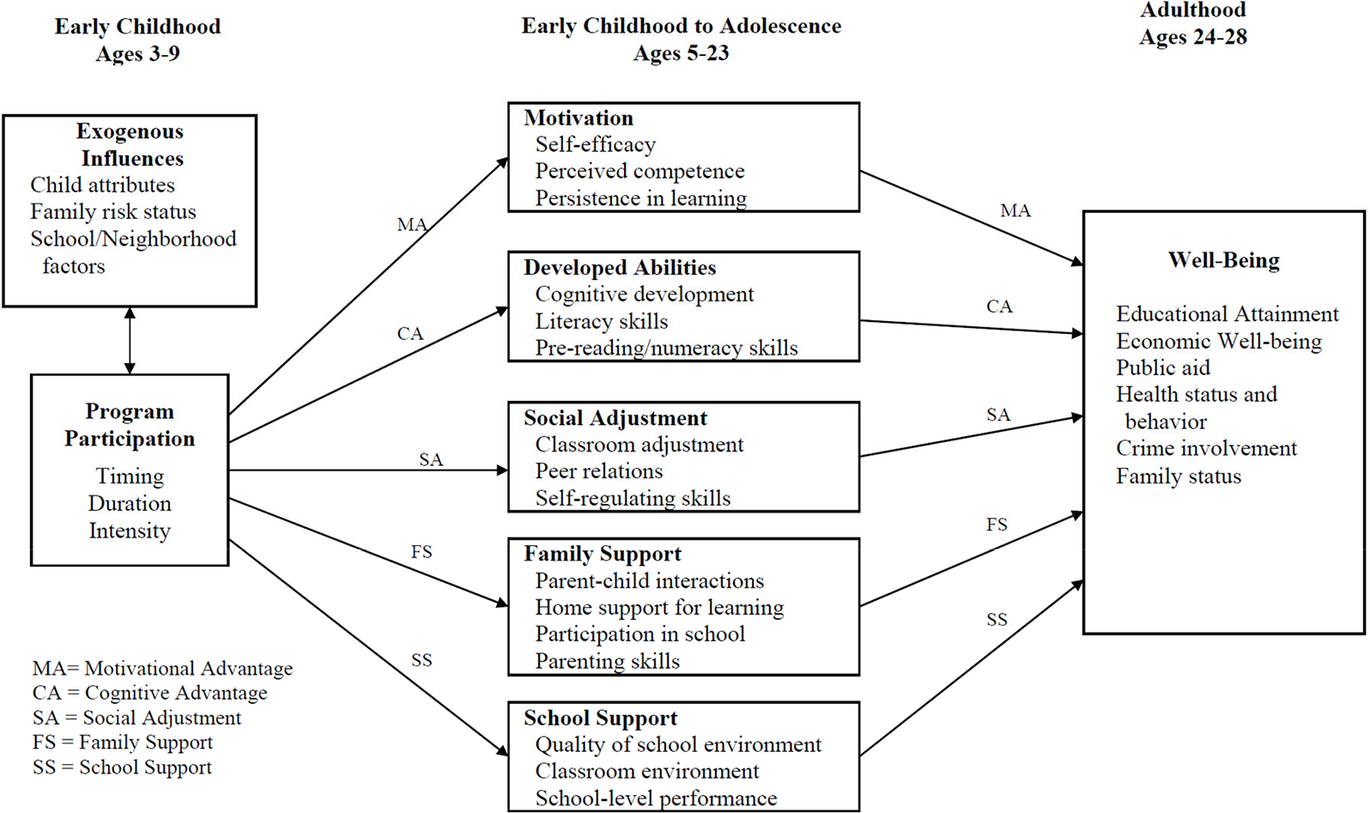
To promote understanding of how early intervention can affect later outcomes, Reynolds (Reference Ramon, Chattopadhyay, Barnett and Hahn2000) developed the 5-Hypothesis Model (5HM) (Figure 2), where the promotion of cognitive and scholastic advantages, motivational advantages, social adjustment, family support behaviors, and school supports accounted for a majority of the estimated direct effect of preschool on adult well-being (Reynolds & Ou, Reference Reynolds2016). The school support hypothesis was recently broadened to the school and community support hypothesis (Reynolds et al., Reference Reynolds, Ou, Mondi and Giovanelli2019). These pathways suggest the mechanisms through which the effects of an early childhood program are sustained into adulthood. In another study of the pathways of effects of the CPC program, Reynolds et al. (Reference Reynolds, Ou and Temple2004) found that higher attendance in high-quality elementary schools, lower mobility, increased literacy skills in kindergarten, avoidance of grade retention, and increased parent involvement in school as a result of CPC participation, mediated the long term effects on educational attainment and reduction in crime. Topitzes et al. (Reference Topitzes, Godes, Mersky, Ceglarek and Reynolds2009) conducted an exploratory path analysis of the CPC program to identify the effects of several education-related experiences on health-related outcomes through age 24 and found that the benefits of health-related outcomes in early adulthood can be attributed back to participation in a high-quality, comprehensive preschool program. They found that the program participants were 22 % less likely to smoke tobacco daily and were 20 % more likely to carry health insurance.
Five-hypothesis model depicting the path from early childhood intervention to adult well-being. Reprinted from “Generative Mechanisms in Early Childhood Interventions: A Confirmatory Research Framework for Prevention” by Reynolds & Ou (Reference Reynolds2016, p. 798). Copyright 2015 by the Society for Prevention Research.
Thus, the focus on physical and mental health during the preschool program and the habits inculcated since early childhood days may have long-term effects on health outcomes in adults in addition to the impact on educational outcomes. In this study, we evaluate whether the CPC program impacts the adult health outcomes in mid-thirties and whether the benefits accrued from these improved health outcomes outweigh the program costs.
4 Data
This study makes use of data from the Chicago Longitudinal Study (CLS), which follows a same-age cohort born in 1979–1980 and surveyed most recently at age 35–37. All participants in the CLS attended early childhood programs in public schools located in high-poverty neighborhoods in Chicago. The quasi-experimental study design was created by including the complete cohort of 989 children who enrolled in the federally-funded Title I CPCs beginning in at ages 3 and 4 (1983–1985). The remaining one-third of the study sample of 550 were children of the same age who attended the usual early childhood programs in the district, primarily full-day kindergarten in randomly selected schools. These schools participated in the Chicago Effective Schools Project (CESP), the existing government-funded alternative intervention designed to improve student achievement. Full-day kindergarten was the common early childhood intervention for economically disadvantaged students at that time. Nearly 15 % of the comparison group also attended Head Start preschool. Thus, the comparison group in this study received alternate intervention rather than no intervention and matched the poverty characteristics of the CPCs (Reynolds, Reference Ramon, Chattopadhyay, Barnett and Hahn2000; Reynolds et al., Reference Reynolds, Temple, Robertson and Mann2011 a). CPC participants could continue their participation up to third grade for a total of six years if they began at age 3. Any study participant who enrolled or moved to a CPC school received services. Our focus in this study is CPC preschool and we controlled for later school-age participation, of which 55% of the study sample enrolled for at least one year (n = 850).
Considering the non-randomized assignment of the children to the program or comparison group, there could be a possibility of selection bias challenging the group comparability. We use a rich array of data on demographic characteristics as statistical control for self-selection on observables and reweight the individual observations to achieve covariate balance in both treatment assignment and attrition as in Reynolds et al. (Reference Reynolds, Temple, Robertson and Mann2011 a).
A summary of the characteristics of the CPC and comparison groups is shown in Table 1. The study participants were predominantly African American (93 %) and resided in the most disadvantaged neighborhoods of Chicago that had nearly double the neighborhood poverty rate as compared to the city average. Children in the program group and comparison group were equivalent on child and family characteristics such as gender, single-parent family status, enrollment as 3-year-olds, and receipt of special education services. We account for the difference in some of the child and family risk characteristics between the intervention and the control group by including these as covariates in the main analysis, including CPC school-age program participation.
Baseline characteristics of the study sample by the program status. a

Significance level: ***p < 0.01, **p < 0.05, and *p < 0.1.
a Data are presented as a percentage of individuals. Administrative records (birth certificates and school records) were used for information on the child and family background indicators from birth to 5 years of age. Home environment problems and adverse childhood experiences were obtained from retrospective reports.
b Family risk indicators.
c Children in school areas in which more than 60 % of children reside in low-income families.
The data were collected through numerous sources including but not limited to birth and school records; child maltreatment and justice system records; educational attainment, adult earnings, employment, and public aid; and participant and family surveys. Data collected from these sources has been used in the past research of the CPC program (Reynolds et al., Reference Reynolds, Temple and Ou2011 a, Reference Reynolds and Ou2018). The data on health outcomes were collected as part of a comprehensive interview during the follow-up at age 35–37 which included 130 questions about physical and mental health, economic well-being, life history, and more. The survey was conducted between 2012 and 2017 and over 80 % of the respondents completed the interview via telephone. Ou et al. (Reference Ou, Mondi, Yoo, Park, Warren and Reynolds2020) provide a detailed description of the approach that was used to locate and interview the participants in this study.
Follow-up data at age 35 were available for a total of 1125 participants (retention rate = 73 %), 741 across the program group (75 % retention), and 384 across the comparison group (70 % retention). As reported in Ou et al. (Reference Ou, Mondi, Yoo, Park, Warren and Reynolds2020), the retention rate in our study is higher than other large-sample (>200 participants) early childhood intervention studies such as the Infant Health and Development Program (65 % up to age 18), the Houston Parent-Child Development Center (63 % up to age 18), the Early Head Start Research and Evaluation Project (54 % up to age 10), and the Consortium for Longitudinal Study (55 % up to age 22).
Table 2 compares the child and family characteristics of the in-sample and attrition groups. Non-respondents were more likely to be males, were born into a family that participated in the AFDC program, had mothers who did not complete high school or were teenage at birth, and did not participate in the CPC program. The right-hand side of the table shows the results of using the Inverse Propensity Score Weighting (IPW) procedure, described in the next section. Table 3 reports the covariate means for those students who attended the CPC program in preschool and those who did not. A few differences are apparent, specifically for sex, maternal education, and residence in a very high-poverty neighborhood. In Tables 2 and 3, calculating the means after the reweighting of observations via the IPW procedure results in close covariate balance as might be expected if treatment assignment and attrition were random.
Means of covariates without and after inverse probability weighting for attrition.
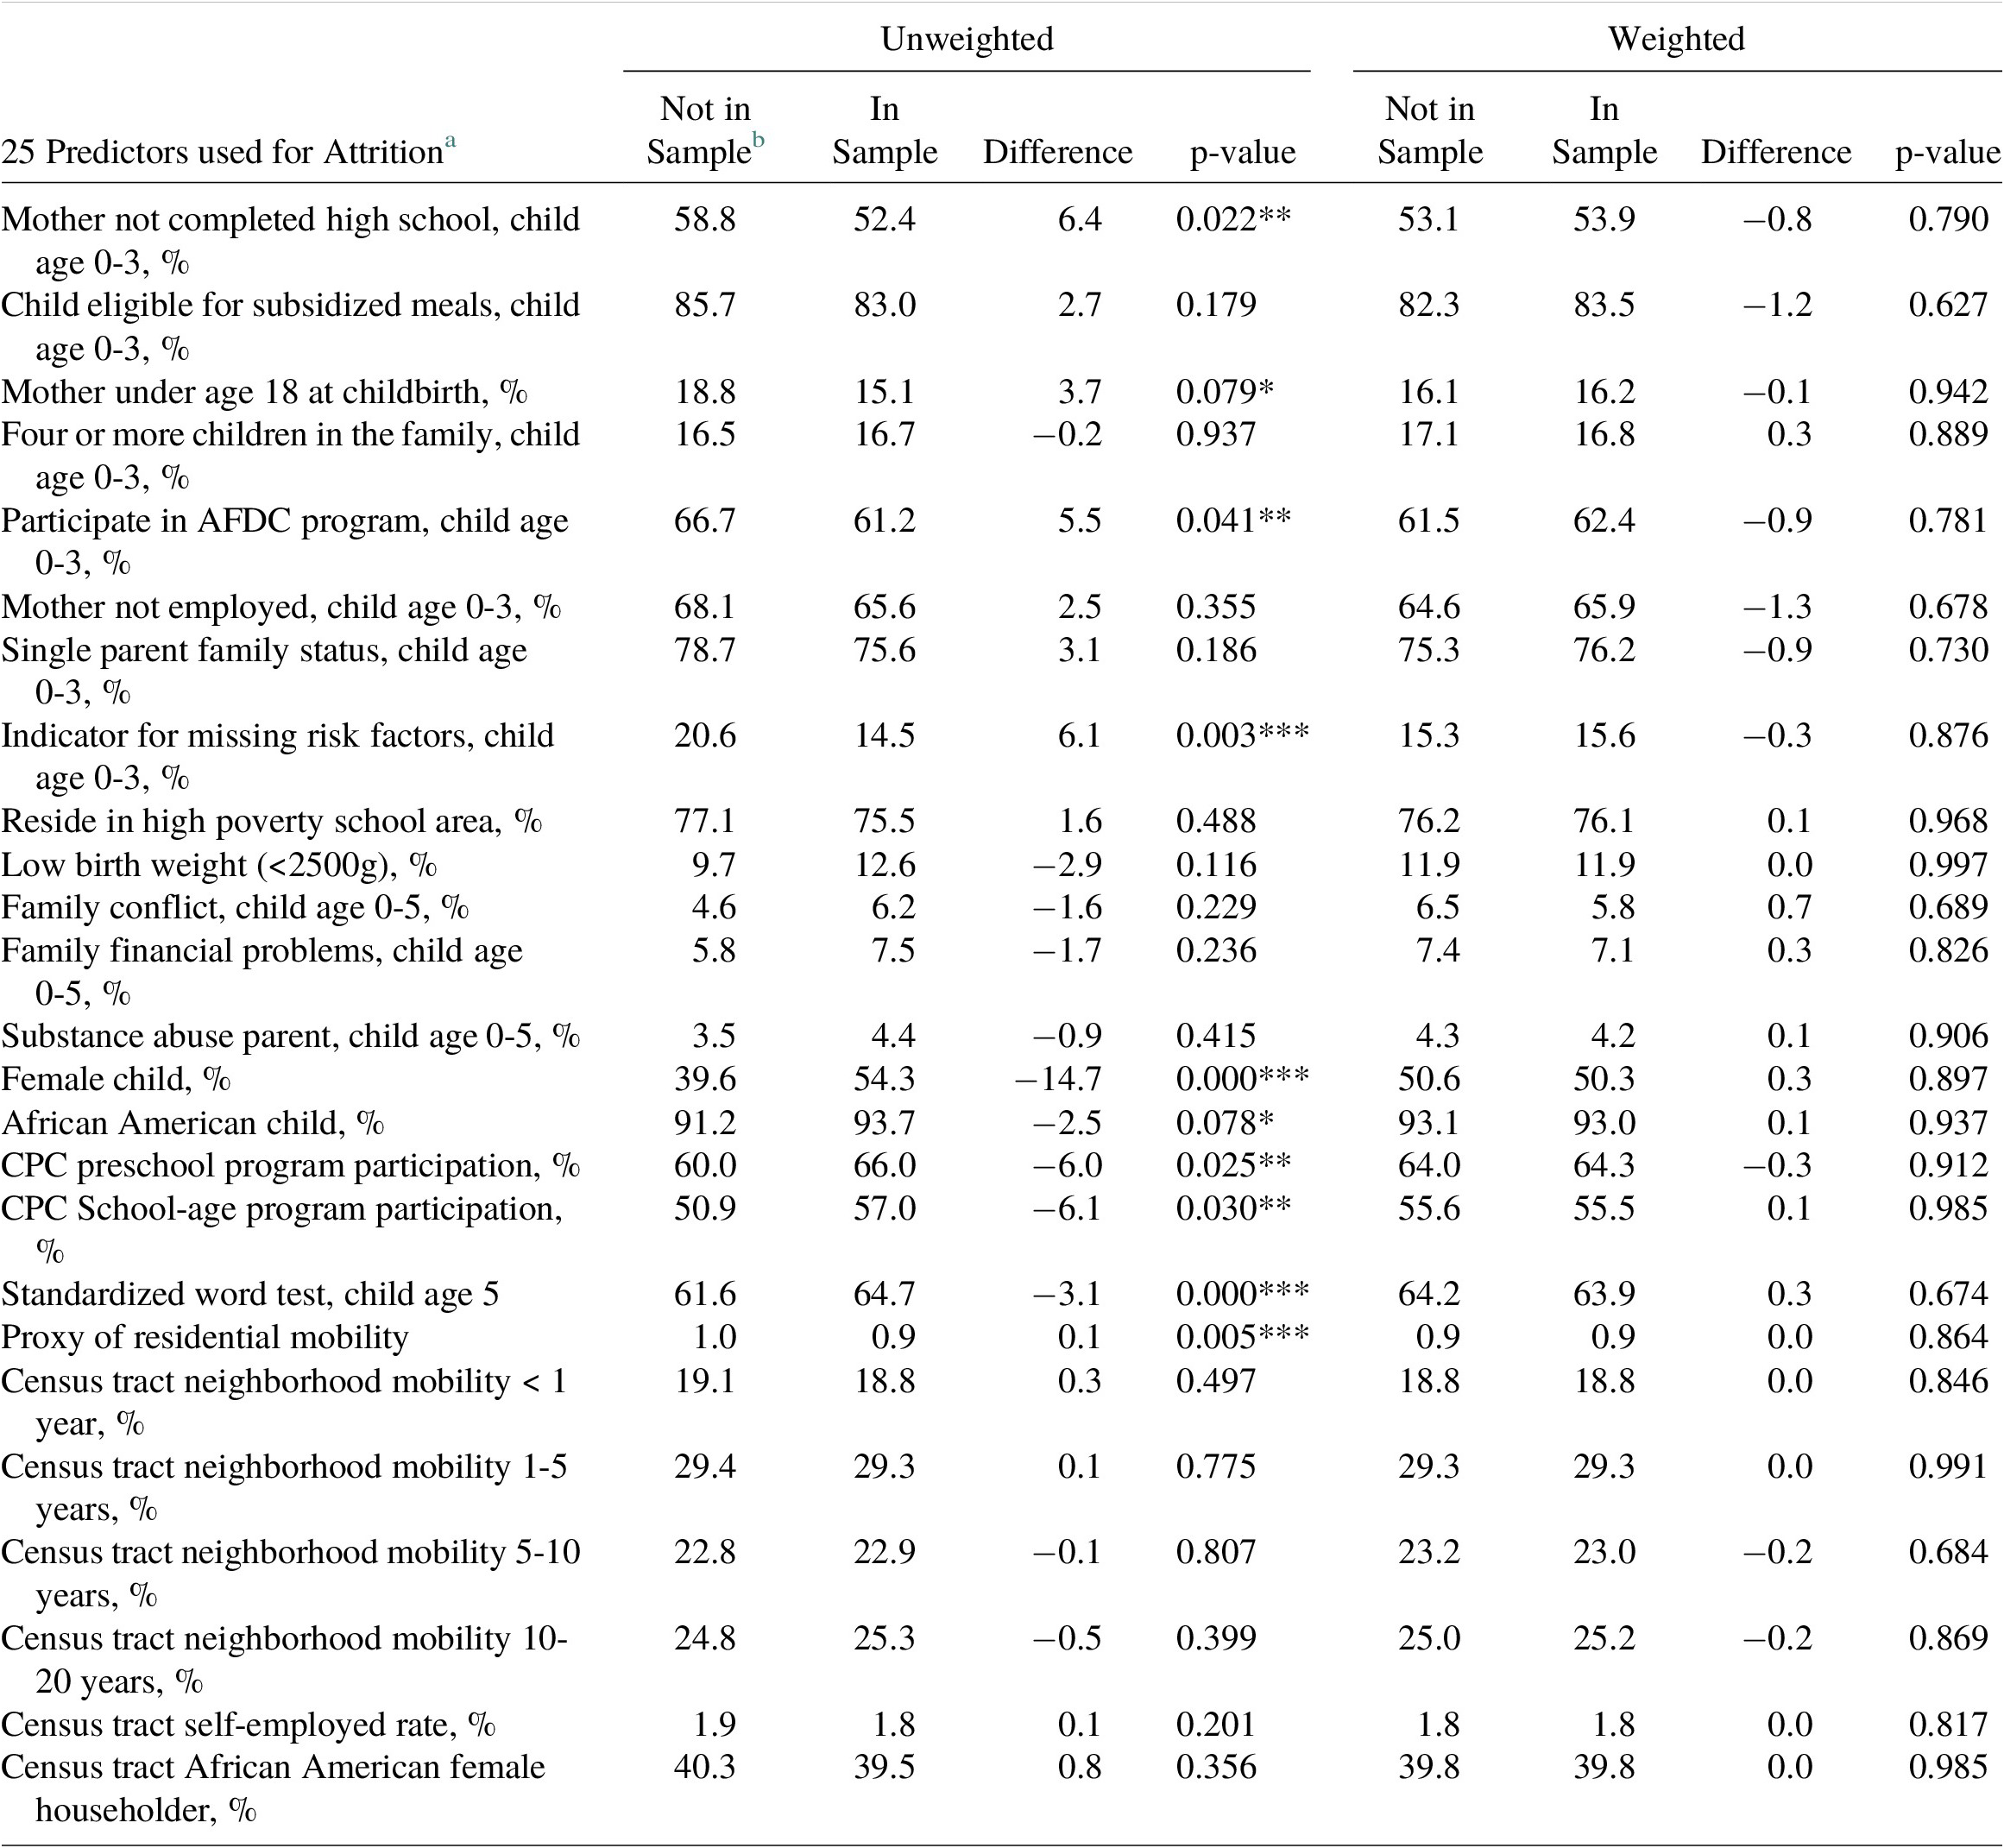
Significance Level: *** p<0.01, ** p<0.05, * p<0.1.
a Data are presented as a percentage of individuals except for standardized word test and proxy of residential mobility.
b Health outcomes data for 414 participants out of the original sample of 1539 were not available. In-sample group consisted of 1125 participants (program: 741, comparison: 384).
Means of covariates without and after inverse probability weighting for program selection

Significance Level: *** p<0.01, ** p<0.05, * p<0.1.
a Data are presented as a percentage of individuals.
b Out of 1539 study participants, 989 participants were in the CPC group and 550 participants in the comparison group.
The use of self-reported measures of health outcomes is common in early childhood research as conducting medical exams for all participants could be extremely challenging and expensive. Muennig et al. (Reference Muennig, Schweinhart, Montie and Neidell2009) used self-reported data on health conditions including diabetes, hypertension, obesity, asthma, and arthritis in their age-37 follow-up study of Perry Preschool. Similarly, Campbell et al. (Reference Campbell, Pungello, Burchinal, Kainz, Pan, Wasik, Barbarin, Sparling and Ramey2012) used self-reported health status and measures of drug, alcohol, and tobacco consumption in their age-30 follow-up study of the Abecedarian program. Although in a later study, Campbell et al. (Reference Campbell, Conti, Heckman, Moon, Pinto, Pungello and Pan2014) were able to use clinical measures of outcomes such as blood pressure, hypertension, BMI, and cholesterol, the study had a limitation of a lower response rate (~61 %). Additionally, in our study, the measure of BMI created using self- reported height and weight data obtained from the survey was highly correlated (r = 0.85) with an in-person BMI measurement conducted with a participant subsample (Eales et al., Reference Eales, Reynolds and Ou2020). We consider the self-reported data used in our study to be a reliable source for health outcomes data and for a subsample of participants these measures can be compared to outcomes obtained through in-person exam data.
4.1 Outcome measures
We analyze the physical and mental health outcomes for participants interviewed as of age 37. First, we created a dichotomous variable for smoking which indicates whether the participants currently smoke any tobacco product more than once a day. Similarly, we created an indicator of drug use based on whether they have ever used drugs harder than marijuana. Next, we used the self-reported information on height and weight to calculate the body mass index (BMI), which is then used to create an indicator of obesity (obesity = 1, if BMI > 30). Finally, we create an indicator for each of diabetes, hypertension, and depression using the self-reported survey responses of whether the respondent was ever diagnosed with these conditions.
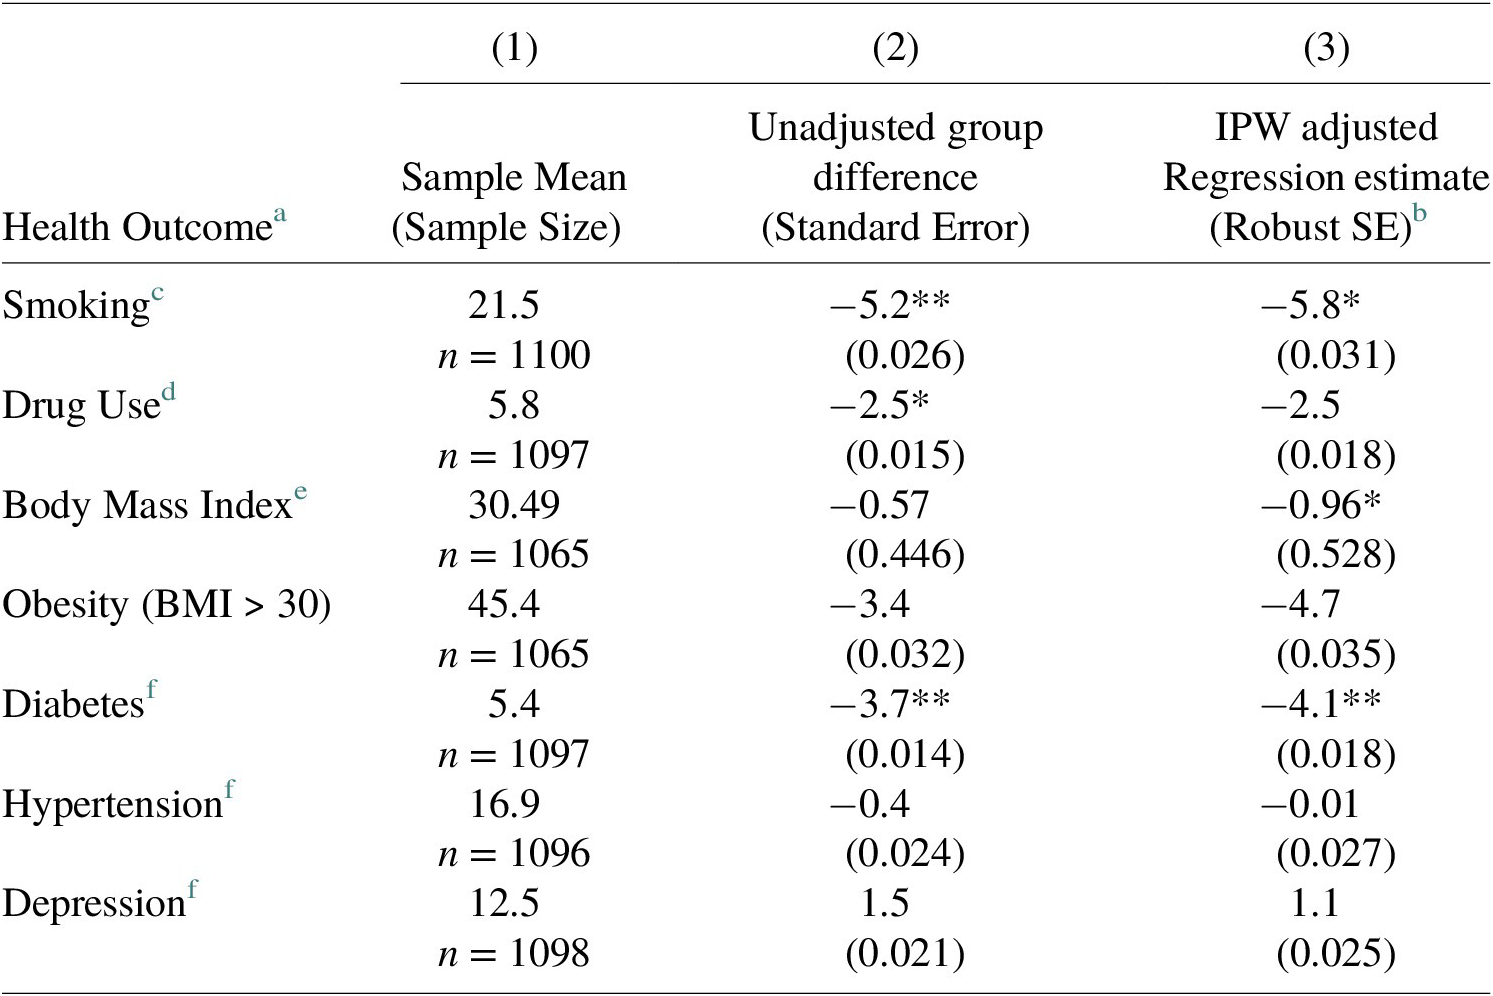
Table 4 provides information on the outcomes examined and how their means vary across the CPC participants and the comparison group. As shown in Table 4, there are significant differences with respect to smoking, drug use, and diabetes between the CPC and comparison groups.
Unadjusted Mean Comparison of Health Outcomes

Significance Level: *** p<0.01, ** p<0.05, * p<0.1.
a Data are presented as percentage of individuals except for Body Mass Index.
b CPC = Child-Parent Center program.
c The comparison group was created from a matched set of similar high-poverty schools.
d The response was coded as 1 if currently smoke any tobacco product more than once a day.
e The response was coded as 1 if used drugs harder than Marijuana.
f BMI measure was created using self-reported measures of height and weight.
g The response was coded as 1 if the participant was ever diagnosed with the condition.
5 Method
Consistent with impact evaluations previously conducted with this sample (Reynolds et al., Reference Reynolds, Temple and Ou2011 a, Reference Reynolds and Ou2018) we used probit and linear regression to estimate the marginal effects of CPC participation on the health outcomes. The covariates include child and family characteristics such as race/ethnicity, gender, childbirth weight, receipt of child welfare services, parent education, single-parent family status, teen parenthood, employment, four or more children in the family, and school-poverty rate of the kindergarten sites, among others. With the exception of public aid receipt and eligibility for subsidized meals, these control variables were measured from birth to age 3. To estimate the effect of the different components of the preschool and school-age intervention through third grade, indicators for participation in these components of the PK-3 intervention were included in the regressions.
A key threat to internal validity in any longitudinal study is non-random attrition, where the concern is that participants who leave the sample can have different observed and unobserved characteristics than those who remain, and non-random assignment, where the program participants have different characteristics than the comparison group, which can affect the program estimates. To avoid these concerns of non-random program assignment and attrition, we use Inverse Probability Weighting (IPW), a method of weighting the observations by the inverse probability of each observation being missing conditional on covariates as a regression weight for both attrition and program assignment. Impact evaluations using observational data are increasingly incorporating propensity score methods for estimation of program effects (Austin & Stuart, Reference Austin and Stuart2015). An advantage of weighting over matching is that the latter often discards observations and researchers have suggested that IPW methods may have efficiency advantages (Hirano et al., Reference Hirano, Imbens and Ridder2003) as long as the trimming of extreme weights is undertaken (Austin & Stuart, Reference Austin and Stuart2015).
The IPW results make use of the larger analytic sample to better understand and control for the differences in characteristics of students for whom we have data on health outcomes compared to those who are missing this data (Seaman & White, Reference Schweinhart and Weikart2013). To do this, we first run a probit regression using the larger sample of students with and without health outcomes data at age 37 to generate predicted probabilities for each student of having this information using observable characteristics assumed to influence attrition. Being able to predict the missingness of the dependent variable is important. Hence the prediction model includes a comprehensive set of child and family risk variables that also will be included in the main outcomes regressions as well as a set of additional variables that are listed in Table 10 of the Appendix. With the results of the probit estimation, we then assign a weight of 1/p1 to each child, where p1 is the predicted probability of the child being in the recovery sample (R = 1; otherwise 0). The first propensity score is estimated as P1i = Pr(R = 1/X). Similarly, we estimate a propensity score for participation in the program (T = 1; otherwise 0) as P2i = Pr(T = 1/X). As a double adjustment, the weights were multiplied together to produce a combined propensity score model as P3i = P2i × P1i following the previous research (Reynolds et al., Reference Reynolds, Temple and Ou2011a). Further, we used robust standard errors including the clustering of standard errors at the school level to account for within-site correlation in errors.
Students with characteristics associated with a lower predicted probability of being included in the analysis, but who actually have information for the health outcome, are rarer and consequently are given larger weight. Students with characteristics associated with a higher predicted probability of being in the regression are assigned smaller weights. In a sense, the use of IPW reweights the sample to better resemble a sample in which the outcome is missing at random. Since extreme probability scores (close to 0 or 1) producing large weights can yield unstable estimates, we set a floor and ceiling of weights by trimming them at 0.05 and 0.95 (Austin & Stuart, Reference Austin and Stuart2015).
The underlying idea behind the IPW approach is that the reweighting to remove systematic differences between the baseline mean observed characteristics of the program and comparison groups with a rich set of covariates creates a study design that more closely resembles a randomized trial (Austin & Stuart, Reference Austin and Stuart2015). While creating group equivalence for participants and controls (and for the retained participants versus those with missing outcomes) on covariates is the intended result, researchers may hope that the groups also are balanced on unobservable baseline traits, even though Austin et al. (Reference Austin, Mamdani, Stukel, Anderson and Tu2005) point out that this is not necessarily the case. We test for balancing of observed covariates in our subsamples, as presented in the columns to the right side of Tables 2 and 3 and find no significant differences between the treatments and controls, and between the retained and dropped samples after weighting.
Once the estimates of CPC effectiveness are obtained in the regression analyses, the economic benefit is estimated by multiplying the marginal effect with the respective monetary estimate of the outcome. The present values of the monetized benefits are then compared to the costs of the intervention to compute the benefit-cost ratio, and the costs are subtracted from the benefits to calculate the net benefit.
6 Results
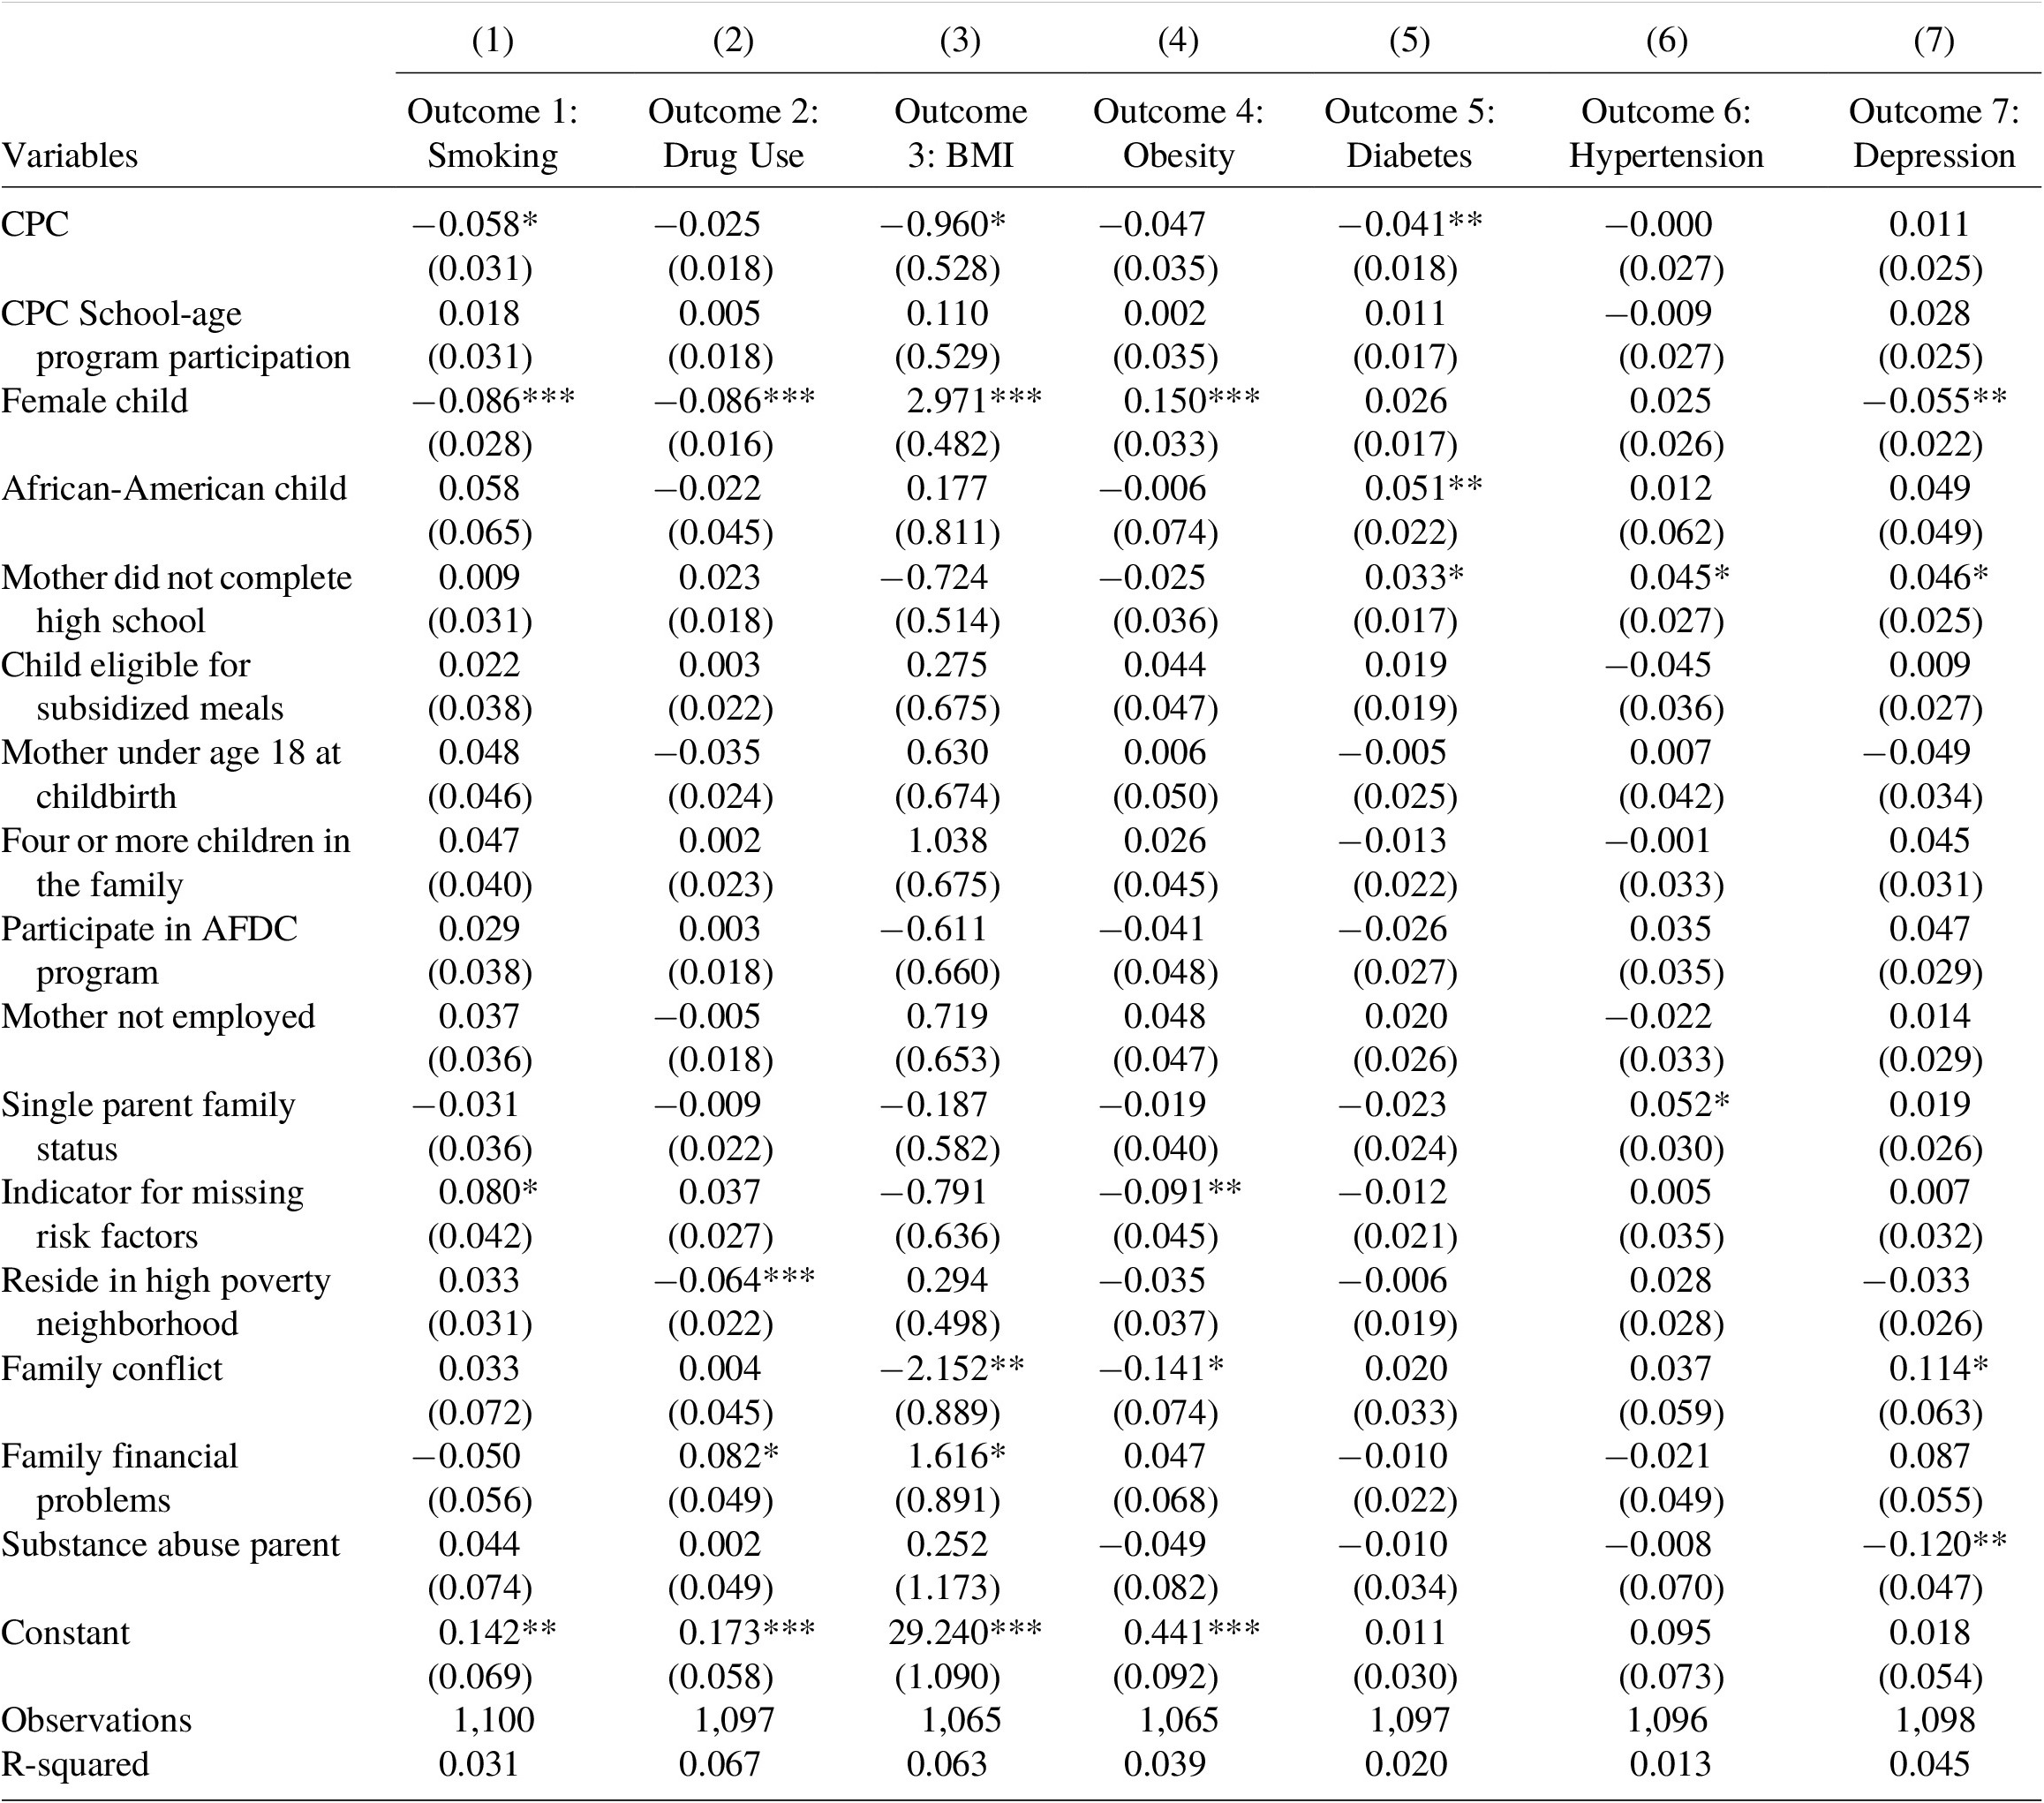
Results from our inverse propensity score weighted estimation approach (Table 5 and Table 11 of the Appendix) suggest a relationship between preschool participation and smoking, diabetes, and BMI. The CPC program group was 5.8 percentage points less likely to smoke daily as compared to the comparison group. The prevalence of diabetes was 4.1 percentage points higher among the participants in the comparison group as opposed to the CPC program participants. There was also a statistically significant association between program participation and the body mass index. The differences in prevalence for diabetes were statistically significant at 5 % level, while the results on smoking and BMI were significant at 10 % level. No significant differences were found in drug use, the prevalence of obesity, hypertension, or depression.
Effect of CPC on health outcomes after adjustments
Statistical Significance Levels *** p<0.01, ** p<0.05, * p<0.1.
a Health outcome data was obtained from self-reported surveys between ages 35 to 37. Data are presented as the percentage of individuals except for Body Mass Index.
b Regression with covariates adjusted with Inverse Probability Weighting (IPW) for program selection and attrition. Standard errors clustered at the preschool site in parentheses.
c The response was coded as 1 if currently smoke any tobacco product more than once a day.
d The response was coded as 1 if used drugs harder than Marijuana.
e BMI measure was created using self-reported measures of height and weight.
f The response was coded as 1 if the participant was ever diagnosed with the condition
In the economic evaluation that follows, we focus on the estimated effects of participation in the preschool program on reductions in the prevalence of diabetes and the rate of smoking. While the effect of program participation on BMI is marginally significant, we expect that the health consequences of having diabetes overlap in important ways with the consequences of being overweight. To avoid double-counting, we focus solely on reductions in smoking and diabetes diagnoses.
6.1 Controlling for multiple hypothesis testing
Since we test multiple non-independent health outcomes in our analysis, there could be a possibility of finding statistically significant results (false positives) for some of the outcomes merely by chance. We apply the Benjamini-Hochberg (BH) procedure (Benjamini & Hochberg, Reference Benjamini and Hochberg1995) to control for multiple hypothesis testing as it has been used in other early childhood education studies (Knight et al., Reference Knight, Landry, Zucker, Merz, Guttentag and Taylor2019) and as Schochet (Reference Rhodes, Prosser, Hoerger, Lieu, Ludwig and Laffel2008) points out, can have more statistical power than the Bonferroni method if any positive impacts of program participation truly exist. The BH procedure is easy to perform as it is based entirely on individual p-values. To perform the BH procedure, we first arrange the individual p-values associated with the results in the final column of Table 5 in ascending order and rank-order them from i = 1 to m (where i is the rank-order of the p-value from smallest to largest, and m is the total number of significance tests performed). Then we compare each individual p-value to the adjusted significance value, which is equal to (i/m)Q, where Q is the chosen false-discovery rate. The largest p-value for which p < (i/m)Q is considered to be statistically significant, including all the p-values that are smaller than it.
The choice of the false-discovery rate Q is subjective and depends on the researchers’ tolerance for the proportion of false positives, specifically the share of declared positives that are truly negative. Because prior studies based on RCTs of high-quality early childhood programs have reported positive health outcomes in adulthood (Muennig et al., Reference Muennig, Schweinhart, Montie and Neidell2009, Reference Muennig, Robertson, Johnson, Campbell, Pungello and Neidell2011; Campbell et al., Reference Campbell, Conti, Heckman, Moon, Pinto, Pungello and Pan2014), an expectation of 7 truly null hypotheses for the complete set of health outcomes seems overly conservative. As discussed above, even though 3 of the 7 outcomes were statistically significant in Table 5, the economic evaluation is only based on 2 of the 3 significant findings. Ex ante, we chose a false-discovery rate of Q = 0.20, which in essence means we are willing to allow 20 % of the three significant findings in Table 5 to be false positives. Table 6 shows the BH corrected critical p-value for each of the outcomes using a false-discovery rate Q = 0.2 and m = 7. We find that the program’s effect on diabetes, smoking, and BMI is statistically significant even after using this correction for multiple hypothesis testing.
Benjamini-Hochberg corrected critical p-value.

Note: The table uses the value of Q = 0.2 (False Discovery Rate) and m = 7 (number of outcomes).
7 Benefit-cost analysis
Following the standard procedure employed in most benefit-cost analysis studies, the main steps in calculating costs and benefits of participation in the CPC program in terms of health outcomes were as follows: (a) the costs and health benefits of the program are calculated in dollar terms, (b) to adjust for inflation, estimates are converted to 2021 dollars using the Bureau of Labor Statistics’ Consumer Price Index for All Urban Consumers (CPI-U), (c) a discount rate of 3 % was applied to calculate the present value of the costs and benefits at age 3 (start of the program), and (d) the net present value of the program per participant was calculated by subtracting the present value of program costs from the present value of program benefits. Additionally, the program benefits were divided by costs to obtain the benefit-cost ratio (return for every 1 dollar invested). While previous studies (Barnett, Reference Barnett1996; Reynolds et al., Reference Reynolds, Temple, Robertson and Mann2011 b; Cannon et al., Reference Cannon, Kilburn, Karoly, Mattox, Muchow and Buenaventura2018) focusing on adult earnings projected the benefits through age 65, we use the Centers for Disease Control and Prevention (2017) estimates which peg the average life expectancy of African-Americans born in the 1980s to be 68 years, since our sample consists of participants born in 1979 or 1980 who are primarily (93 %) Black. Further, we use 62 years as the age of retirement, as people can begin receiving their social security retirement benefits at that age. We used alternative discount rates (1, 5, and 7 %) as part of the sensitivity analysis.
7.1 Program costs
Two previous cost-benefit analyses have calculated the benefits and costs associated with the Chicago CPC program (Reynolds et al., Reference Reynolds, Temple, Robertson and Mann2002, Reference Reynolds, Temple, Robertson and Mann2011 b). The costs were primarily calculated using the operational budget of the program for the year 1985–1986 including the costs of instructional staff, staff for family and community support, administration, operations and maintenance, program materials, transportation, food, and community services, school-wide services, and school district support. Additionally, the cost of parent’s time was estimated using the minimum wage for 10 hours of participation in the program per month. Imputed costs of capital depreciation and interest was also taken into account as suggested by Levin et al. (Reference Levin, McEwan, Belfield, Bowden and Shand2017). Based on the cost estimates presented in these studies, the present value cost for 1 year of the CPC preschool intervention provided in 1986 was estimated to be $7233 per student in 2021 dollars.
All of the preschool participants received 1 year of preschool while 55 % received an additional year of intervention. Assuming the students that received only 1 year of preschool intervention entered the program at age 4, while those who received 2 years of the program started at age 3, the per participant present value of the average cost of the preschool program evaluated at age 3 is (0.55)($7233) + (1.00)($7233/1.03) = $11,000.
7.2 Program benefits
The benefits from reduction in diabetes and smoking can be estimated using two methods: first, through adding the costs of medical expenditure, lost productivity, and the cost of premature mortality attributable to the condition, and second, through accounting for the economic costs of a reduction in quality of life in addition to the healthcare costs.
7.2.1 Benefits from reduced diabetes
Medical expenditure, lost productivity, and premature mortality cost of diabetes
We first estimate the benefits of reduced medical expenditures associated with a diabetes diagnosis using information from the recent study by the American Diabetes Association (2018). In 2017, the additional annual per-capita health care expenditures for people diagnosed with diabetes was $9601 or $10,342 in 2021 dollars. Because medical expenditures rise over time as diabetics age (Trogdon & Hylands, Reference Trogdon and Hylands2008), we adjust the estimates of the health care expenses to allow for this annual increase. Trogdon & Hylands (Reference Trogdon and Hylands2008) found that after controlling for several medical conditions that develop over time with diabetes, annual health care costs associated with diabetes rise by $75 per year (or $93 in 2021 US dollars). Therefore, we adjust the cost of health care expenses by applying an age-based escalator of $93 per year to account for higher health care costs among older diabetics to estimate the life-cycle benefits from the reduction in diabetes.
The ADA report also includes estimates of the lost productivity due to a diabetes diagnosis. In 2017 dollars, they report an annual per-capita loss of $2830 associated with reduced productivity at work including the inability to work, or $3048 in 2021 dollars.
We make several assumptions in order to estimate the present value at age 3 of a future stream of improved productivity due to reductions in the probability of a diabetes diagnosis. As discussed above, we take the average life expectancy of our sample to be 68 years, and the retirement age as 62 years. Additionally, among our sample, the survey responses suggest that the average age of diabetes diagnosis was 28. We calculate the stream of benefits over the life course of the individual using the above estimates at a 3 % discount rate from age 28 to age 68 for health care costs, and up to age 62 for reduced productivity. These present value estimates of a lifetime of higher health care costs and reduced productivity associated with a diabetes diagnosis come out to be $136,207 and $32,218 respectively. For a 4.1 percentage point reduction in diabetes estimated to arise from participation in the CPC program, the present value of these benefits at age 3 is estimated to be $5584 and $1321 respectively.
The next step is to include the economic costs of early mortality due to diabetes. American Diabetes Association (2018) used the data from CDC National Vital Statistics Reports for total deaths to estimate the number of deaths primarily attributable to diabetes, and the proportion of deaths due to renal disease, cerebrovascular disease, and cardiovascular disease attributable to diabetes. They then estimated the present value of their foregone future earnings. While the average cost of premature mortality declines with age, American Diabetes Association (2018) estimated it to average $71,700, or $77,234 in 2021 dollars. Discounting this cost to the present value at age 3, and multiplying it with the program impact of 4.1 %, we find the benefits from averted premature deaths to be $554 due solely to CPC participation.
Adding together the present values of reduced medical expenditures, improved productivity, and reduced premature mortality due to diabetes, we estimate the present value of the effect of the preschool program on the probability of being diagnosed with diabetes to be $7459.
Reduction in quality of life/utility value due to diabetes
A second way of monetizing the preschool impacts on diabetes is to consider the effect of diabetes on the quality of life in addition to the healthcare costs. Narayan et al. (Reference Narayan, Boyle, Thompson, Sorensen and Williamson2003) estimated the quality-adjusted life years (QALY) lost due to diabetes across a range of age of diagnosis, gender, and race. Their study highlighted significant racial disparities in health outcomes. For the non-Hispanic Black population diagnosed with diabetes at age 30, they estimated an average loss of 26.15 QALYs (24.2 for men and 28.1 for women) and an average loss of 18.5 total life years lost. While these estimates are almost two decades old, they are still relevant for our sample population, as in a more recent study, Rhodes et al. (Reference Reynolds, Temple, White, Ou and Robertson2012) estimated 22.44 QALYs lost due to Type 2 diabetes in a cohort of 15–24-year-old adolescent Americans. Using the commonly used monetary value of $50,000 per QALY (Grosse, Reference Grosse2008), for a 4.1 percentage point reduction in diabetes attributable to the program, we estimate the benefits from the avoided loss of QALYs at age 30, discounted to the present value at age 3, to be $24,134.Footnote 4
An alternate set of literature estimates the QALYs lost due to Diabetes using utility values obtained from using EuroQol five-dimensional (EQ-5D) valuation questionnaire. As opposed to an ideal utility value of 1 for perfectly healthy individuals, researchers have estimated the utility value for individuals diagnosed with diabetes in the range of 0.74 (Clarke et al., Reference Clarke, Gray and Holman2002; Neumann et al., Reference Neumann, Schoffer, Norström, Norberg, Klug and Lindholm2014) to 0.80 (Huang et al., Reference Huang, Brown, Ewigman, Foley and Meltzer2007; Zhang et al., Reference Zhang, Brown, Bilik, Ackermann, Li and Herman2012). In a meta-review that assessed 61 studies evaluating the utility values corresponding to diabetes complications, Beaudet et al. (Reference Beaudet, Clegg, Thuresson, Lloyd and McEwan2014) recommend a proposed utility value of 0.785. Using the utility value of 0.785 and a QALY estimate of $50,000 we estimate the life-cycle benefits from the aversion of reduced utility values between age 28 and 68 to be $5076 after discounting to the present value at age 3.
Adding the additional healthcare costs attributable to diabetes of $5584 as obtained above, the QALY approach yields a range of estimates of the economic benefits of a reduced rate of diabetes diagnoses due to preschool between $10,660 to $29,718 (or a mean of $19,935).
The discussion above suggests two approaches to monetizing the benefits of preschool participation in terms of its estimated impact on a diagnosis of diabetes by age 30 specifically tailored to this population of Black study participants born four decades ago. The first approach is to include averted costs from medical expenditure, reduced productivity, and premature mortality. The second approach is to include averted medical costs and improvements in QALYs. As explained by Shiroiwa et al. (Reference Seaman and White2013), it is important not to add the improvement in terms of QALYs to the improved productivity estimates. Combining the two estimates would result in overcounting the benefits to the extent that the estimated utility value of 0.785 for diabetes includes concerns by the survey respondents that this medical condition would reduce work productivity. For our cost-benefit analysis, we use the more conservative value of benefits from the reduction in diabetes to be $7459.
7.2.2 Benefits from reduced smoking
The approach to estimating the economic benefits associated with a reduction in smoking is similar to that used above for diabetes. We use the relevant results from a variety of studies that have estimated the economic benefits accruing from a reduction in the rates of smoking in adults in the form of savings in direct medical costs, lost productivity, and reduced mortality costs, and also consider the improvement in QALYs.
Medical costs, lost productivity, and premature mortality costs of smoking
Centers for Disease Control and Prevention (2008) estimated the average annual healthcare expenditure attributed to smoking to be $96 billion per year between 2000 and 2004. Another Centers for Disease Control and Prevention (2005) report estimated that approximately 44.5 million U.S. adults were smokers in 2004. Using the above two pieces of information,Footnote 5 we calculate the per capita annual incremental medical cost of smoking to be $2157, equivalent to $3047 in 2021 US dollars after adjusting for inflation.
Centers for Disease Control and Prevention (2008) also reports annual productivity losses from smoking-attributable diseases to be approximately $97 billion. Similar to the calculations above, we obtain the per-capita annual productivity losses attributable to smoking to be $2180 or $3079 in 2021 US dollars.
We use similar assumptions for estimating the cost of smoking as used in the section above while estimating the cost of diabetes. The average age around which Americans begin to smoke daily is estimated to be 18 years (U.S. Department of Health and Human Services, 2014). Additionally, studies have found that smokers lose at least 10 years of life expectancy as compared to non-smokers (Jha et al., Reference Jha, Ramasundarahettige, Landsman, Rostron, Thun, Anderson, McAfee and Peto2013; U.S. Department of Health and Human Services, 2014). Taking the normal life expectancy of our sample as 68 years as explained in the previous section, we assume the average life expectancy of smokers in our sample to be 58 years. Therefore, we estimate the stream of benefits over the life course of the individual due to averted medical costs and reduced productivity estimates attributable to smoking over the ages of 18–58, discounted to its present value at age 3. Using the discount rate of 3 %, the present value estimates of a lifetime of increased medical expenses and reduced productivity associated with smoking come out to be $47,163 and $47,658 respectively. For a 5.8 percentage point reduction in smoking-attributable to CPC program participation, the present value of these benefits at age 3 is estimated to be $2735 and $2764 respectively.
While the above estimates include medical costs and productivity losses, they do not include the cost of premature mortality attributable to smoking. We use two methods to estimate a range of benefits accrued from reduced mortality costs attributable to smoking. First, we estimate the foregone earnings due to premature death as the mortality cost. Based on our survey estimates, the average earnings for the preschool participants group at age 34 is $20,887 as compared to the average earnings of the comparison group which is $18,248 in 2017 US dollars. Among our response sample, 65.6 % of participants attended the CPC program, which brings the weighted average earnings of our sample to be $19,979 (equivalent to $21,521 in 2021 US dollars). We then estimate a stream of this earning up to the retirement age of 62 by allowing it to grow at 2 % per year. We assume that due to premature mortality, smokers will lose 10 years of life, however, they will lose only 5 years of earnings before retirement (between ages 58 to 62). The present value at age 3 of the last 5 years of earnings is estimated to be $33,401, which translates to a mortality-cost savings worth $1937 corresponding to a 5.8 percentage point reduction.
The alternate method to estimate the mortality costs is using the value of statistical life (VSL). VSL estimates vary depending on the characteristic of a disease, and due to a shortage of condition-specific VSL studies in the literature it is relatively uncommon to be able to use them in studies of cost of a particular illness (Peterson et al., Reference Pearman, Springer, Lipsey, Lachowicz, Swain and Farran2018). However, there exists a smoking-specific VSL study by Viscusi & Hersch (Reference Viscusi and Hersch2007) who used the variation in smoking rates and fatality rates over the life-cycle to estimate the mortality costs (in 2000 US dollars) of smoking to be $1,538,631 for males and $563,299 for females, respectively. Taking the average of these values, we find the mortality cost of smoking to be $1,050,965 using the VSL estimates, which is equivalent to $1,628,635 in 2021 US dollars. We then discount the average present value mortality cost from age 58 to age 3: $1,628,635/(1.0355) = $320,462. So, the estimated mortality cost savings from a 5.8 percentage point reduction in smoking is expected to be $18,587.
Adding together the present values of reduced costs of medical expenditure, lost productivity, and premature mortality attributable to smoking, we estimate the present value of the effect of participation in the CPC program on the prevalence of smoking to be in the range of $7436 to $24,086.
Reduction in quality of life due to smoking
We also estimate the economic impact of smoking using the QALY method. In a recently published study, Xu et al. (Reference Xu, Fiacco, Rostron, Homsi, Salazar, Levine, Ren and Nonnemaker2021) estimated that cigarette smokers aged 35–39 years lost an average of 7.4 QALYs as compared to non-smokers. Using the monetary value of $50,000 per QALY as in the section above, we estimate the savings at age 37 discounted to the present value at age 3 to be $7855.Footnote 6 Adding the additional healthcare costs attributable to smoking of $2735 as obtained above, the QALY approach yields a benefit of $10,591 from a reduced rate of smoking due to preschool participation.
As above for diabetes, we use the more conservative estimates of $7437 as the benefit from reduced smoking in our cost-benefit analysis. In Table 7, we report the benefits by category, and in Table 8, we report the total health benefits obtained using a variety of methods of estimation as described above.
Distribution of benefits by category.

Note: All benefit estimates are in 2021 US dollars.
Total health benefits and benefit-cost ratio by estimation method.
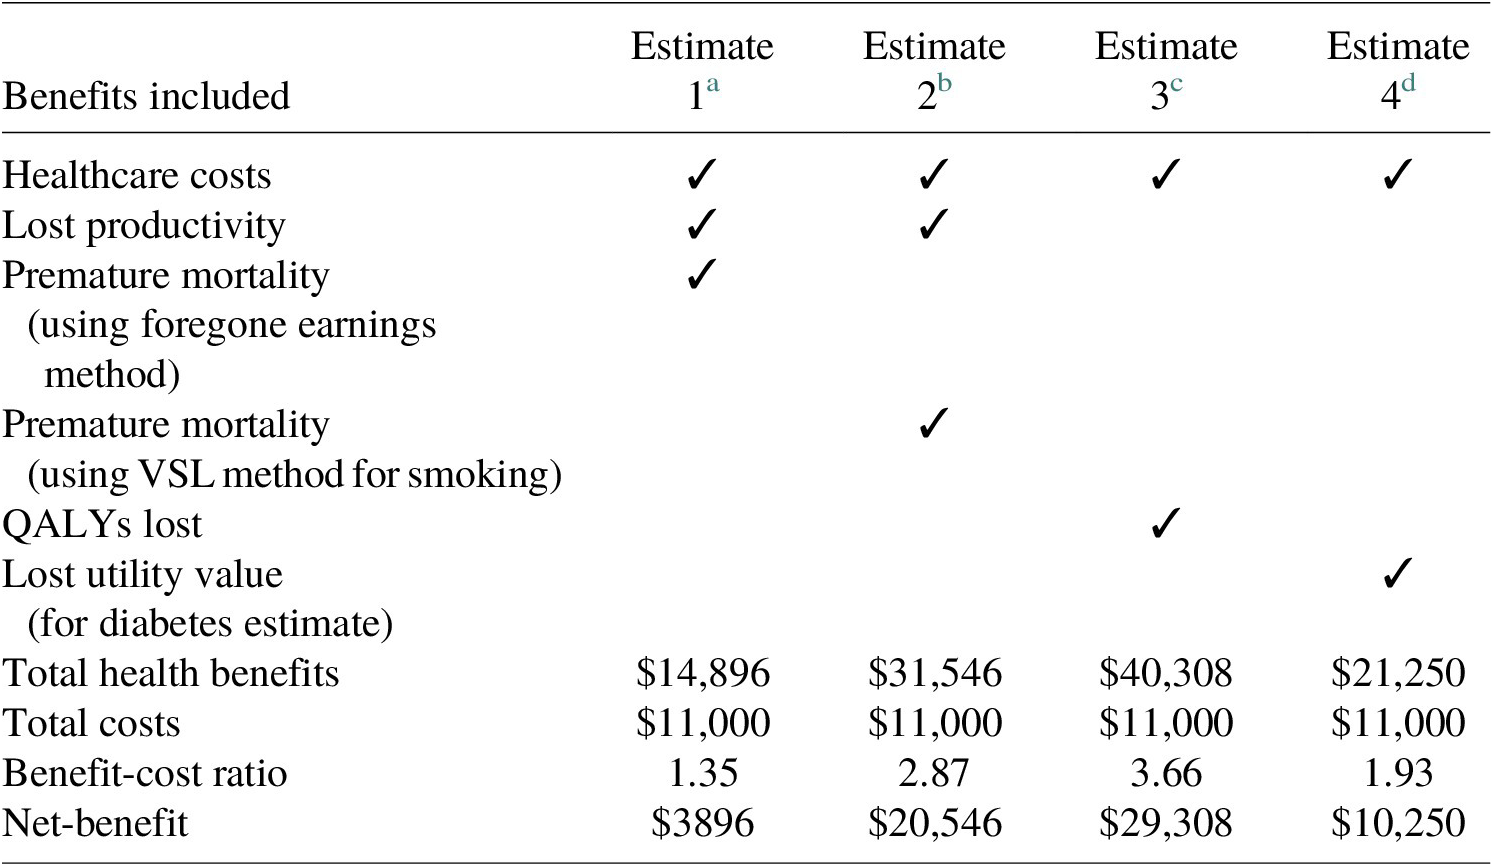
a In this estimate, we add the healthcare costs, lost productivity costs, and premature mortality costs calculated through the foregone earning method for both diabetes and smoking.
b In this estimate, we add the premature mortality costs calculated through the foregone earning method for diabetes and VSL method for smoking to the healthcare costs and lost productivity costs.
c In this estimate, we add the healthcare costs to the economic cost of QALYs lost due to diabetes and smoking.
d In this estimate, we add the healthcare costs to the economic cost of QALYs lost due to smoking and lost utility value due to living with diabetes.
7.3 Sensitivity analysis
There are various sources of uncertainty in our analysis, such as those associated with the coefficients of estimated health benefits from participating in the CPC program, discount rates used in our calculation, and the dollar estimate of benefits from the reduction in adverse health outcomes. We tested the robustness of economic benefits by using alternate discount rates and conducted a Monte Carlo simulation to estimate the likelihood of getting positive returns on investment considering the uncertainty in impact estimates and economic values.
7.3.1 Alternate discount rates
The discount rate reflects the worth of the dollar in the distant future as compared to the present. Since the choice of an appropriate discount rate can have an impact on the economic estimates, we used alternative discount rates of 1, 5, and 7 % as part of sensitivity analysis. Table 9 and Figure 3 compare the estimates of various cost and benefit components and the associated benefit-cost ratios and the net benefits for each of the discount rate values. Because the benefits are accrued much later in life, the net benefits of the program decrease with the increase in discount rates.
Economic estimates based on the discount rate.

a We use the most conservative estimates of diabetes and smoking benefits in this table.
Sensitivity analysis for estimated costs and health benefits for the CPC program.

7.4 Monte Carlo analysis
We conducted a Monte Carlo analysis to account for uncertainty in the estimated effect of the program on outcomes. We ran 10,000 simulations based on the assumption of a normal distribution of the effect size and accounting for a 10 % margin in the dollar estimate of the health benefits. We found the benefit-cost ratio to be in the range of 0.30–2.72 with a mean of 1.36. We also find that in ~77 % of the simulations, the benefit-cost ratio was greater than one, indicating a positive economic return.
8 Discussion
In this study, we follow a cohort of students born in 1980 who attended kindergarten in high-poverty neighborhoods of Chicago, nearly two-thirds of who also attended a center-based preschool program. Making use of extensive information collected over more than three decades from the study participants, we evaluate the impact of the preschool program on the long-term health outcomes in adulthood.
We employ the inverse probability weighting approach to ensure comparability of the program and comparison groups and address missing data concerns and conduct a benefit-cost analysis. While there may be threats to internal validity due to non-observables predicting both participation and the outcome, we showed that the weights work well to ensure covariate balance. Our results indicate that participation in the CPC program is associated with a significantly lower prevalence of diabetes (effect sizeFootnote 7: −0.17) and smoking (effect size: −0.31) in adulthood as well as lower body mass index. The effect size may be interpreted as small to medium, but they are nonetheless practically important considering that the effects are sustained over three decades (Kraft, Reference Kraft2020). In our study, we did not find any significant impacts of the program on depression, which could be attributed to the self-reported measure of diagnosis, as opposed to a multiple-item measure of symptoms. Indeed, a recent study by Mondi et al. (Reference Mondi, Reynolds and Richardson2020) found that the CPC program was associated with a 7.1 percentage point reduction in one or more depressive symptoms.
Based on the calculations in the previous section, we obtain the total health benefits to be in the range of $14,896–40,308 depending on the preferred method of estimation of program benefits. Dividing by the cost of the program, which is estimated to be $11,000, we obtain a range of benefit-cost ratios from 1.35 to 3.66. A benefit-cost ratio of greater than one indicates that the health benefits of the program by themselves outweigh its costs. On subtracting the cost of the program from the total health benefits, we obtain the net benefit of the program to be in the range of $3896–29,308. While the health benefits of $1.35 per dollar invested are smaller than benefits from savings in crime reduction which were $4.99 per dollar invested, and benefits from increased earnings and tax revenues which were $3.39, they are higher than benefits from the reduction in spending on child welfare which was $0.86, and on special education, which was estimated to be $0.62 per dollar invested (Reynolds et al., Reference Reynolds, Temple, Robertson and Mann2011 b).
We also conducted a Monte Carlo analysis to account for uncertainty in the estimated effect of the program on outcomes. This is important for two reasons; one, our estimates of the impact of the program on the health benefits could be imprecise, and second, the dollar value of benefits we use from the literature could vary based on the assumptions. From a simulation of 10,000 iterations, we found the Benefit-Cost Ratio to be in the range of 0.3–2.72 with the average ratio coming to 1.36 and a ratio of greater than one, in 77 % of the simulations.
This study is strengthened by its use of correction for multiple hypothesis testing which reduces the false-discovery rates of multiple outcomes back to the level of an individual significance test. This procedure is rarely adopted in the literature while testing multiple outcomes at once but is important to ensure that the statistical significance of each outcome is not achieved merely by chance. In addition to the range of methodologies employed for robustness check, another major strength of this study which adds to the validity of the results is its low attrition, with nearly three-fourth of the original participants still being followed-up after over 30 years, which is uncharacteristic of studies with a large sample greater than 1500.
On the lines of previous findings by Belfield et al. (Reference Belfield, Nores, Barnett and Schweinhart2006), Muennig et al. (Reference Muennig, Schweinhart, Montie and Neidell2009), and García et al. (Reference García, Heckman, Leaf and Prados2020) in their cost-benefit analyses of the Perry Preschool, as well as a previous cost-benefit analysis of the CPC intervention (Reynolds et al., Reference Reynolds, Temple, Robertson and Mann2011 a,b; Temple & Reynolds, Reference Temple and Reynolds2015), the results suggest that the health impacts of early educational intervention are significant and may by themselves offset the costs of the intervention, even if no other benefits were observed.
Evidence that participation in school-based education intervention from preschool to third grade can have an impact on health outcomes in adulthood is of great importance to the current debate of how much resources to devote to publicly funded preschool and early elementary school programs. While most of the longer-term research evidence on the impacts of early education focus on outcomes such as earnings and involvement in criminal activity (e.g., Heckman et al., Reference Heckman, Moon, Pinto, Savelyev and Yavitz2010), this study adds to a much smaller set of recent studies on the potential for early investments in education to have long-lasting health effects. Certainly, some of the health benefits found in the CPC intervention are driven by the intervention’s effect on educational attainment. While crime and violence reduction has been an important contributor to the large social benefits calculated for high-quality preschool investments in studies based on the Perry Preschool program and the CPC program, the new results reported in this article are likely to further amplify the rationale for government investments in early education by focusing more attention on the significant and economically important health savings that may accrue from these public investments.
9 Limitations and future directions
In this partial benefit-cost analysis, we focused solely on the health outcomes at age 37 for the preschool component of the CPC program. The results suggest that the health impacts of early educational intervention are significant and may by themselves offset the costs of the intervention, even if no other benefits were observed. However, a future study may look at incorporating benefits across a domain of outcomes such as gain in income and reduction in crime, in addition to health. This will help in calculating a comprehensive benefit-cost ratio of the program. A limitation of our study is that we rely on the self-reported data of health outcomes by the participants. However, the in-person health examination of CLS participants reported moderate to high correlations between self-reports and exams for BMI, hypertension, and diabetes (Reynolds, Eales et al., Reference Reynolds, Eales, Ou, Mondi and Giovanelli2021; Reynolds, Ou et al., Reference Reynolds, Ou, Eales, Mondi and Giovanelli2021). The Framingham Risk Score, which includes obesity and hypertension, in a broader index, provides complementary outcome data for further analysis. A future study could look at the health data collected through physical health exams which could enhance the range of outcomes studied and improve the validity of the outcomes. Some recent studies have also gone on to evaluate the impact of early childhood education programs such as the Perry preschool program on mortality (Heckman & Karapakula, Reference Heckman and Karapakula2019). Further research would be needed to evaluate the impact of the CPC program on the premature mortality of participants. In a prior benefit-cost analysis of this sample, a small induced cost (or negative benefit) was reported in terms of the higher required costs to taxpayers if preschool participation induces greater enrollment in public universities (Reynolds et al., Reference Reynolds, Temple and Ou2011 b). However, this current health study does not report additional costs or negative benefits arising from better health and longevity. Higher expenditures on social security retirement benefits might be an example of such an induced cost.
While the estimation of the effects of program participation on the various health outcomes suggested significant effects on diabetes, smoking, and BMI, our corrections for multiple inferences led to these results holding at a seemingly high false discovery rate of 0.2. McDonald (Reference McDonald2009) and Lee & Lee (Reference Lee and Lee2018) have recommended using an FDR value of 0.2 when the cost of false positives (missing potentially important findings) is high. However, if we were to use a more conservative FDR value of 0.1 or lower, then these estimates of program impact would no longer be statistically significant at conventional levels. Finally, we only examined depressive symptoms as a measure of mental health outcomes. Mondi et al. (Reference Mondi, Reynolds and Richardson2020) examined a broader measure of midlife psychological well-being in which CPC participants fared better. Other indicators such as life satisfaction warrant further investigation and potential inclusion in economic returns. Future studies in this field also can increase the focus on mental health by studying other determinants of mental health. This will help us get a better understanding of the impact on overall health including physical and mental health.
Competing Interests
The authors declare none.
Appendix
Variables included as covariates in the regression and inverse probability weighting (IPW) models for program selection and attrition.
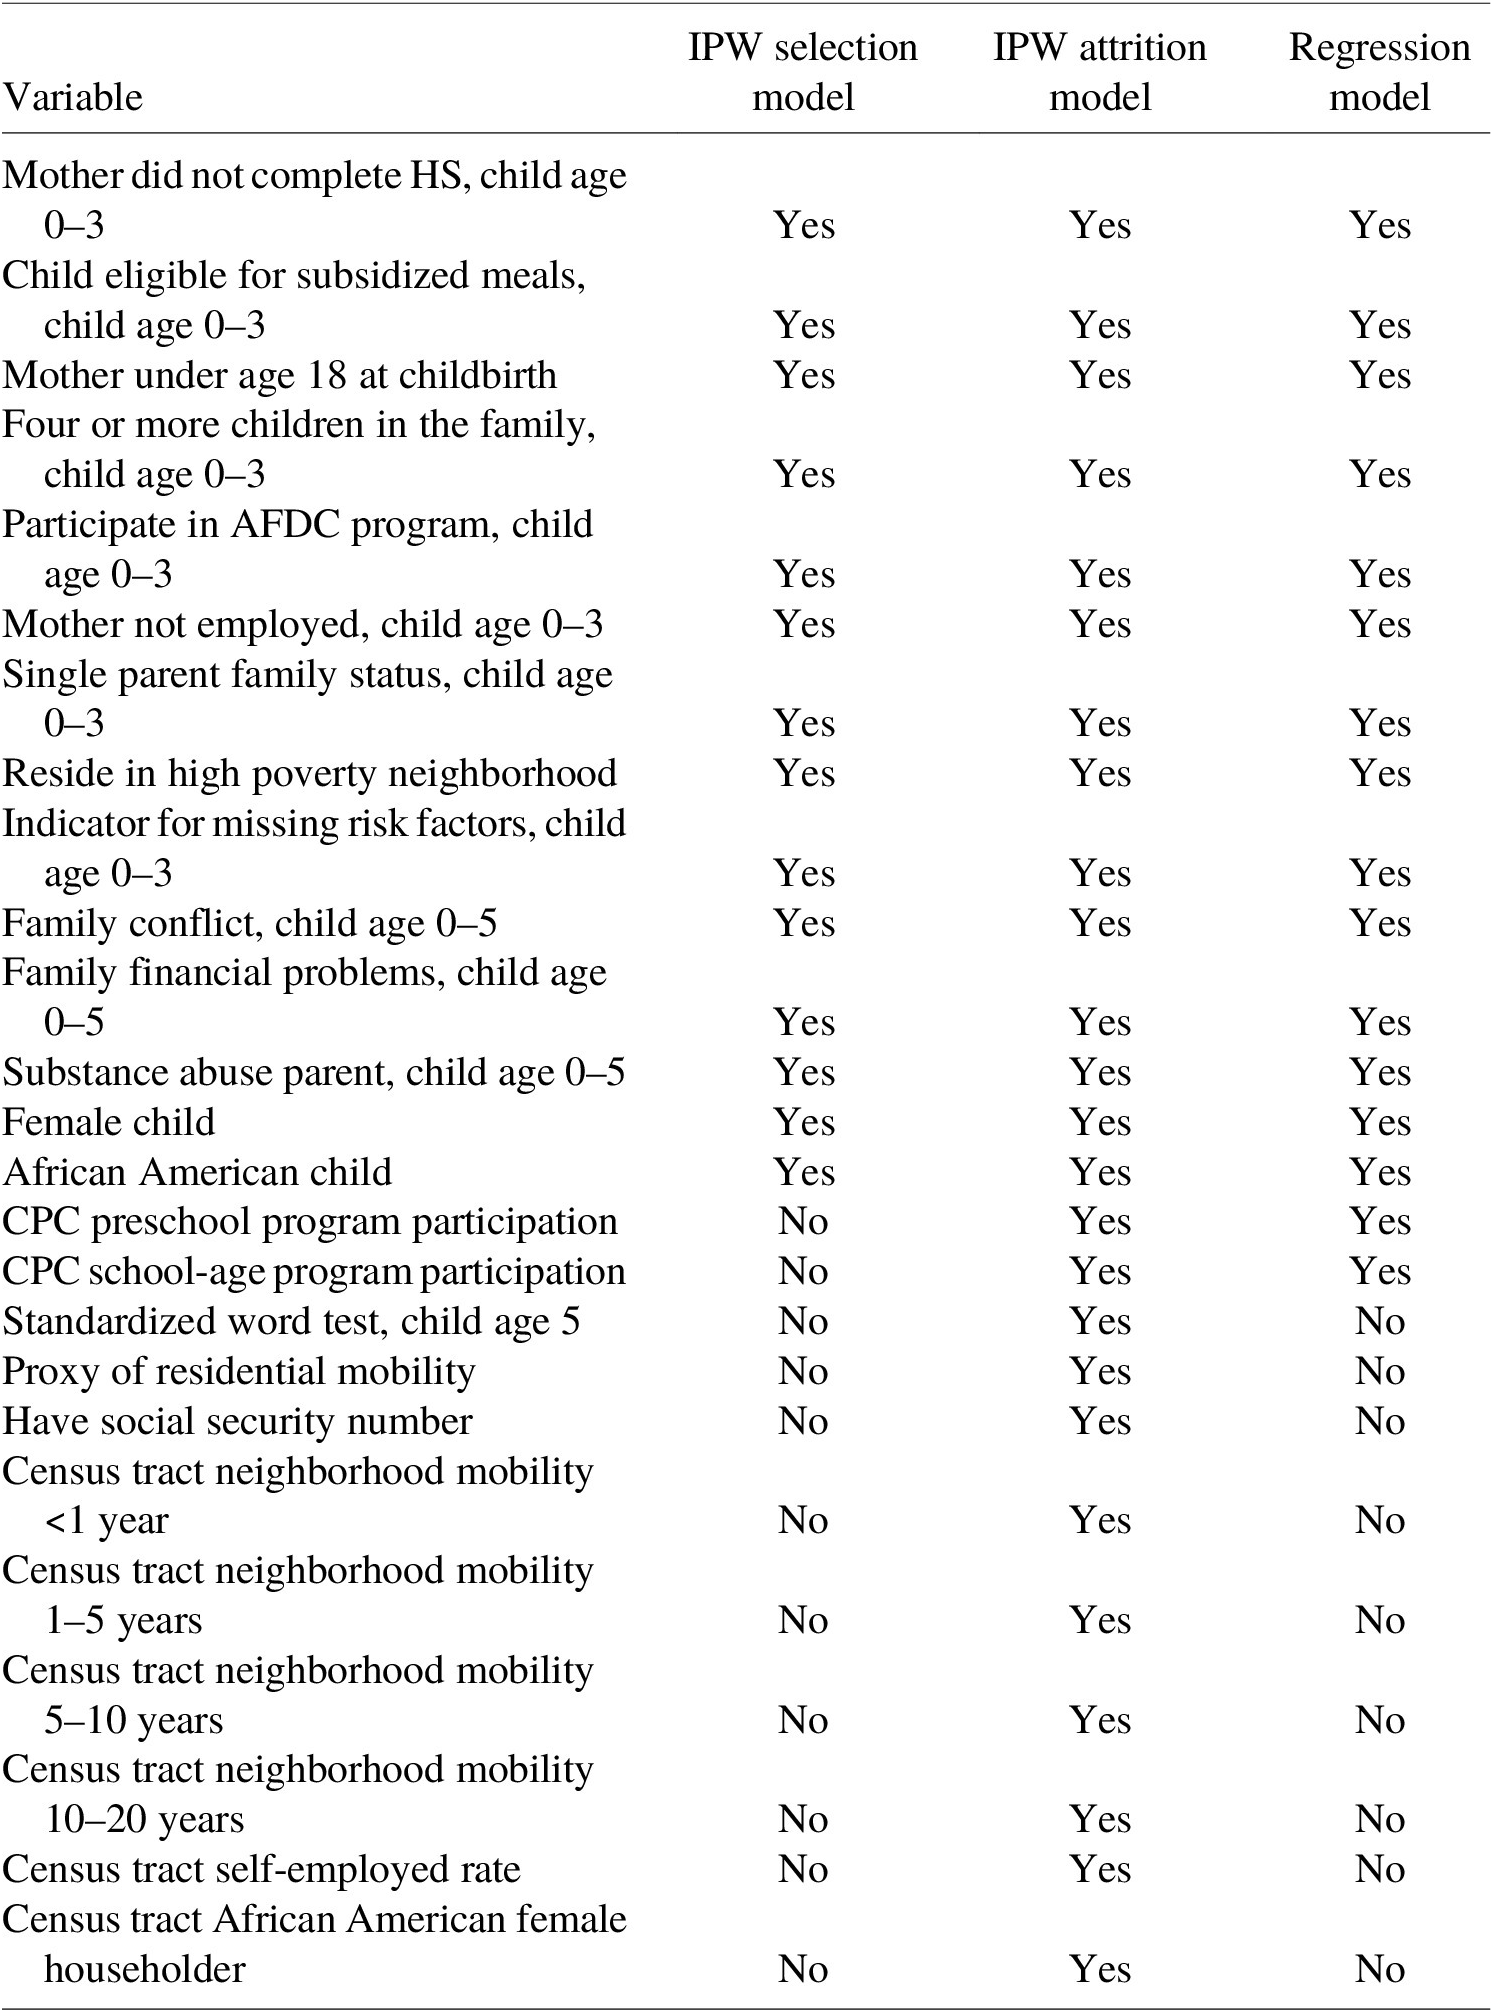
Note: Data on these variables were collected from school administrative records and parent surveys.
IPW adjusted regression outcomes.
Statistical Significance Levels *** p<0.01, ** p<0.05, * p<0.1


 Open access