


In July of 2024, signatures for placing an anti-gerrymandering initiative on the November ballot were certified by the Ohio Secretary of State. The proposed constitutional amendment would have replaced the bipartisan redistricting commission made up of elected officials with a citizens’ commission, much like what was done in Michigan through a ballot initiative in 2018. The coalition in favor of redistricting reform submitted well above the required 413,487 signatures needed for the issue to appear on the ballot. Prior to the campaign to reform redistricting, the Ohio Supreme Court had ruled seven different district maps unconstitutional (Tebben Reference Tebben2024b).
Appearing on the ballot as Issue 1, the amendment would have created a non-partisan citizens’ commission to do redistricting of the state legislature and congressional districts. Issue 1 would have created a redistricting commission of five Democrats, five Republicans, and five Independents chosen by a panel of retired judges. Decisions would have required a bipartisan nine-member majority, and would have required that the partisanship of districts match the party preferences of voters statewide.
In the Fall of 2024, Ohio voters could see yard signs calling for the elimination of gerrymandering. This is not surprising given that Ohioans were making up their minds on how to vote on the constitutional amendment. What might be surprising is that some of the signs calling for the elimination of gerrymandering urged a Yes vote on the amendment, while others urged a No vote for the same reason (Pelzer Reference Pelzer2024). This confusing messaging may have contributed to the ultimate defeat of the amendment and was the broader context in which voters made their decisions. However, Ohioans’ vote choices were also likely influenced by their partisanship and issue salience.
On November 5, 2024, Ohio voters made a decision regarding redistricting reform. The issue failed to win voter approval with 46.29% voting yes and 53.71% voting no (Ballotpedia 2024). In the weeks leading up to the election, polls showed that Ohio voters strongly supported redistricting reform. Sixty percent of respondents said they would vote yes on the issue, with 20% saying they would vote no and another 20% unsure about the issue (Rees Reference Rees2024). While polls showed that Ohioans strongly supported reform, complicated ballot language that included the assertion that the redistricting commission would be required to gerrymander likely contributed to the disconnect between polling and the election outcome.
This article examines the anti-gerrymandering initiative fight in Ohio in 2024 through the lenses of both partisanship and issue salience. While there is a strong body of research on redistricting, the research presented here is unique because the survey data come from likely voters during an actual redistricting reform campaign. Data from a survey of Ohio voters indicate that dissatisfaction with Ohio redistricting, identifying threats to democracy as the most important election issue, awareness of the redistricting issue, identification with the Democratic Party, and liberal ideology are all important indicators of support for redistricting reform. We conclude with informed speculation about the impact of the confusion around the election, as well as then-former President Trump’s potential influence.
Partisanship, salience, and redistricting reforms
Democratic outcomes depend on the structure of political institutions (March and Olsen Reference March and Olsen1983). Politicians support or oppose changes to electoral institutions based in part on their electoral success under those institutions and on their attitudes about democracy (Bowler, Donovan, and Karp Reference Bowler, Donovan and Karp2006). Electoral reforms are likely to be viewed through a partisan lens as voters have become more polarized and rely on cues from elites on electoral reforms (Abramowitz and Webster Reference Abramowitz and Webster2016; Bowler and Donovan Reference Bowler and Donovan2016). Cues are information provided that allows people to make evaluations on policy issues without comprehensive knowledge of the issue (Eagly and Chaiken Reference Eagly and Chaiken1993). Political parties can be the source of cues that move public opinion (Cohen Reference Cohen2003). Political parties have also been found to provide important cues to voters that influence support for ballot initiatives (Smith and Tolbert Reference Smith and Tolbert2001).
Research specific to redistricting reforms aligns with the research on other electoral reforms. Voters, like politicians, are more likely to support independent redistricting reforms when current redistricting practices result in losses for the party they support (Biggers and Bowler Reference Biggers and Bowler2022; Tolbert, Smith, and Green Reference Tolbert, Smith and Green2009). They view redistricting as fair when it advantages their party (Fougere, Ansolabehere, and Persily Reference Fougere, Ansolabehere and Persily2010). Recent research using survey experiments finds a similar influence of partisanship on support for redistricting reform (McLaughlin Reference McLaughlin2025).
Redistricting reforms are often adopted through direct democracy. Not only is partisanship important when measuring support for reforms, but issue salience matters too. Issue salience is a concept ill-defined in political science research. An analysis of articles about issue salience published since 1955 found that 62% of articles provided no definition for the term at all, and the remaining defined the term in various ways (Miller, Krosnick, and Fabrigar Reference Miller, Krosnick, Fabrigar, Krosnick, Chiang and Stark2017). Though there are varying definitions of salience in political science, common themes in definitions include issue importance, issue concern, and the weight an individual gives to an issue when making electoral choices (Dennison Reference Dennison2019). Issue awareness is a component of issue salience, as part of issue salience is that a person thinks frequently about an issue (Jenke and Munger Reference Jenke and Munger2022; Miller, Krosnick, and Fabrigar Reference Miller, Krosnick, Fabrigar, Krosnick, Chiang and Stark2017). Research shows that issue salience can drive turnout in elections (Biggers Reference Biggers2011; Lacey Reference Lacey2005). It is important to consider support for redistricting reforms in the context of ballot initiatives because framing and negativity bias can give an advantage to the “no” side when voters consider reforms (Dyck and Pearson-Merkowitz Reference Dyck and Pearson-Merkowitz2019). Considering issue salience through measures of dissatisfaction with redistricting, democracy as an important issue, and redistricting issue awareness is important because negativity bias would be stronger in cases where voters do not care about or know much about an issue. Further, ballot initiatives are not independent of party influence. Evidence suggests that partisanship is a strong predictor of support for ballot initiatives (Smith and Tolbert Reference Smith and Tolbert2001).
The research presented here uses data from a public opinion poll of likely voters in Ohio in 2024, an election cycle where redistricting reform was on the ballot. The data provide a unique opportunity to measure and test the influence of partisanship and issue salience on support for redistricting reform. While previous research has effectively used survey experiments, this research benefits from measuring support for reforms while they were on the ballot and not as a hypothetical scenario. The advantage of this approach is that this research measures factors that explain support for the redistricting during a time when salience should be high because the issue is on the ballot during the election cycle. Partisan differences identified in the results related to issue salience are particularly strong because it would be expected that salience among all groups would be higher during an active campaign than at other times.
Data and methods
Data from a survey of 1,000 likely voters in Ohio in October of 2024, administered by YouGov and commissioned by the Democracy and Public Policy Research Network at Bowling Green State University, are used to identify factors that determine support for redistricting reform. The data presented in this analysis are not weighted. While weighting samples is useful for top-line results and for attempting to predict election outcomes, the goal of this research is to explain the factors leading a voter to say they plan to vote yes on redistricting reform rather than to predict. The explanatory factors in the model related to partisanship, ideology, and control variables allow us to explain support for redistricting reform without using sample weights. The results of the survey capture the views of Ohioans during the month prior to the 2024 general election in which voters considered a state-wide ballot initiative that proposed placing the power of redistricting in the hands of a citizens’ redistricting commission. The proposal appeared on the ballot as Issue 1.
Two versions of the support for redistricting reform question appeared on the survey. Each was viewed by different halves of the respondents. The first version provided a short summary of the redistricting reform that would be established if voters approved Issue 1, while the second version provided the same language as the first but with additional information about how redistricting in Ohio currently works under the bipartisan Ohio Redistricting Commission. In both versions, respondents were asked if they would favor the proposal of a citizens’ redistricting commission to replace the current bipartisan redistricting commission. Both versions of the question yielded similar results in the survey, with those receiving the shorter wording favoring redistricting reform 57%–34%, and with those receiving the longer wording favoring redistricting reform 56%–32%. The remaining responded that they were not sure (Alexander, et al. Reference Alexander, Miller, Jackson, Kalaf-Hughes and Boston2024a). For the research presented here, the two versions of the question are combined into one dependent variable measuring support for redistricting reform, because after each version of the question, respondents were asked the same question: If the election were held today, would you vote “Yes” in favor of Issue 1 or “No” to reject Issue 1 – the Citizens Redistricting Commission Initiative. A control variable is included to measure any influence the question wording may have on support for the reform. Below is the full wording of the short version of the question.
This November, voters will be asked whether they approve or reject Issue 1. Issue 1 is an amendment to the Ohio Constitution to change the redistricting process in the state. A ‘Yes’ vote would establish a new bipartisan redistricting commission composed of 15 members equally divided between Democrats, Republicans, and Independents. All members and family members of the Commission will not have held a local, state, or federal elected position for the previous six years. Commissioners cannot have been registered as a lobbyist in Ohio or the federal government for the preceding six years as well. The amendment seeks to ban partisan gerrymandering that favors one political party and disfavors others. If the election were held today, would you vote ‘Yes’ in favor of Issue 1 or ‘No’ to reject Issue 1—the Citizens Redistricting Commission Initiative (Alexander, et al. Reference Alexander, Miller, Jackson and Boston2024b, 3).
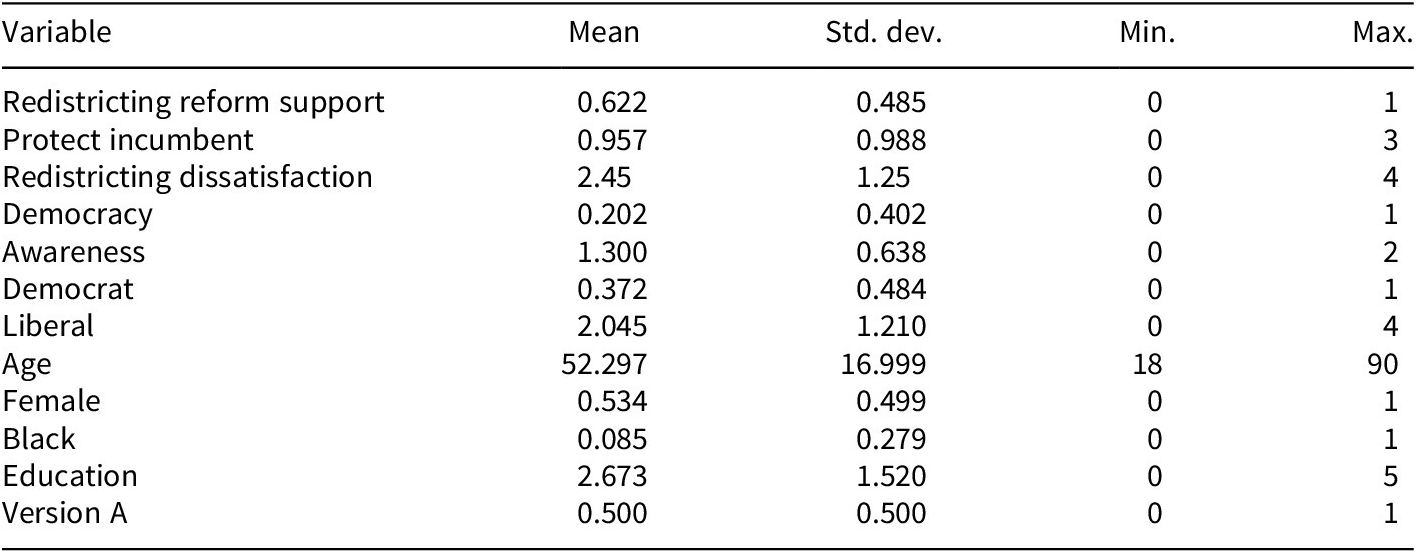
The model in this research accounts for several factors that are expected to influence support for redistricting reform. A measure of the importance of protecting the incumbent is included because previous research shows that voters are rational about redistricting and people view the redistricting process as fair when their party is in control of the state government (Fougere, Ansolabehere, and Persily Reference Fougere, Ansolabehere and Persily2010). Similarly, a measure of redistricting dissatisfaction is included because voters have rational views about redistricting reform based on their satisfaction with the redistricting process (Fougere, Ansolabehere, and Persily Reference Fougere, Ansolabehere and Persily2010). The Democracy variable represents whether respondents chose threats to democracy as the most important issue for them entering the general election. Polls show throughout the election cycle that voters were concerned with political extremism and threats to democracy (Young Reference Young2025). It is important to include this measure for determining support for redistricting reform because gerrymandering is an issue directly related to how democracy functions. Awareness is a measure of how aware respondents are of the redistricting reform ballot initiative. It is included in the model along with redistricting dissatisfaction and democracy as an important issue because previous research shows that issue salience influences voter turnout (Biggers Reference Biggers2011; Lacey Reference Lacey2005). Respondents could indicate that they had heard or read a lot, a little, or nothing at all in regard to the initiative. Measures of partisanship and ideology are also included in the model because previous research shows that voters have become more polarized and electoral reforms are often viewed through a partisan lens (Abramowitz and Webster Reference Abramowitz and Webster2016; Bowler and Donovan Reference Bowler and Donovan2016). Democrat is a dichotomous variable, and Liberal is a five-point scale of ideology. Control variables for age, gender, race, education, and which version of the redistricting reform initiative question respondents viewed are also included. Details of the original questions used to construct these variables can be found in the Democracy and Public Policy Research Network codebook (Democracy and Public Policy Research Network 2024a, 2024b). We show descriptive statistics for the variables in our model in Table 1.
Descriptive statistics for variables

Table 1. Long description
The table header lists columns as Variable, Mean, Standard deviation, Minimum, and Maximum. From top to bottom, the rows are: Redistricting reform support with mean 0.622, standard deviation 0.485, minimum 0, maximum 1. Protect incumbent with mean 0.957, standard deviation 0.988, minimum 0, maximum 3. Redistricting dissatisfaction with mean 2.45, standard deviation 1.25, minimum 0, maximum 4. Democracy with mean 0.202, standard deviation 0.402, minimum 0, maximum 1. Awareness with mean 1.300, standard deviation 0.638, minimum 0, maximum 2. Democrat with mean 0.372, standard deviation 0.484, minimum 0, maximum 1. Liberal with mean 2.045, standard deviation 1.210, minimum 0, maximum 4. Age with mean 52.297, standard deviation 16.999, minimum 18, maximum 90. Female with mean 0.534, standard deviation 0.499, minimum 0, maximum 1. Black with mean 0.085, standard deviation 0.279, minimum 0, maximum 1. Education with mean 2.673, standard deviation 1.520, minimum 0, maximum 5. Version A with mean 0.500, standard deviation 0.500, minimum 0, maximum 1.
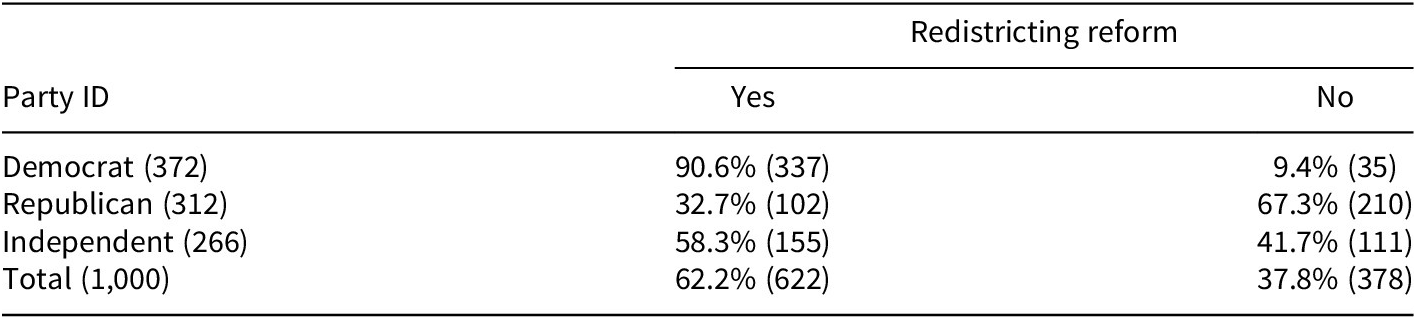
The primary variables of interest are party identification and awareness of the redistricting issue. Looking at support for redistricting reform shows an incredibly strong percentage of Democrats support redistricting reform (90.6%) while a strong, but less convincing, majority of Republicans (67.3%) oppose redistricting reform. The divide in support by party is larger than in national surveys. For example, an NBC News Decision Desk poll in 2025 showed 92% of Democrats and 76% of Republicans in favor of non-partisan redistricting commissions (Lapinski, Clinton, and Trussler Reference Lapinski, Clinton and Trussler2025). Support for reform among Democrats in the data used for this research is very similar to the national poll, but Republicans in the data are much less supportive of reform than in the national poll. This discrepancy is consistent with the discussion of the influence of partisan cues during a campaign.
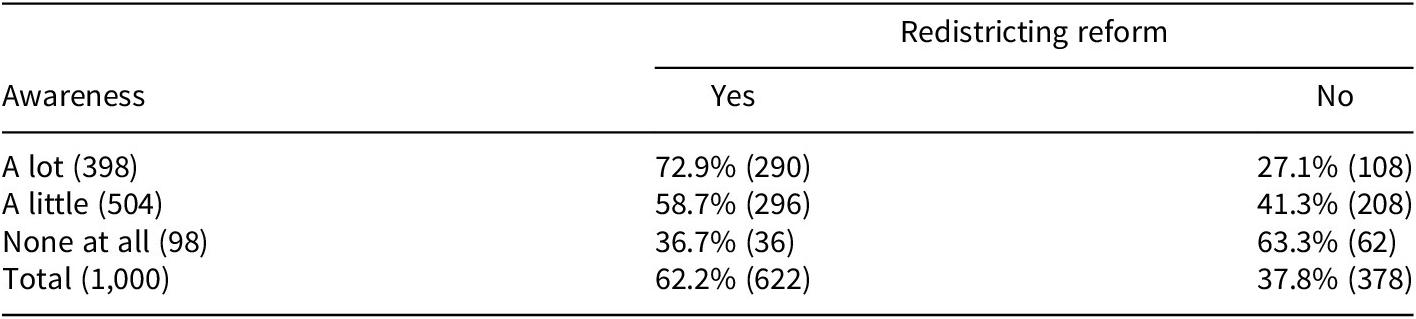
Respondents who reported that they had heard a lot about the redistricting reform issues overwhelmingly supported the reform (72.9%), those who had heard a little about the issue supported the reform by a slimmer margin (58.7% in favor), and a small number who reported not knowing anything at all about the issue opposed the reform (63.3%). The survey results displayed in Tables 2 and 3 show support for redistricting reform by party identification and levels of awareness. Pearson chi-square results show statistically significant differences between the categories.
Support for redistricting reform by party identification
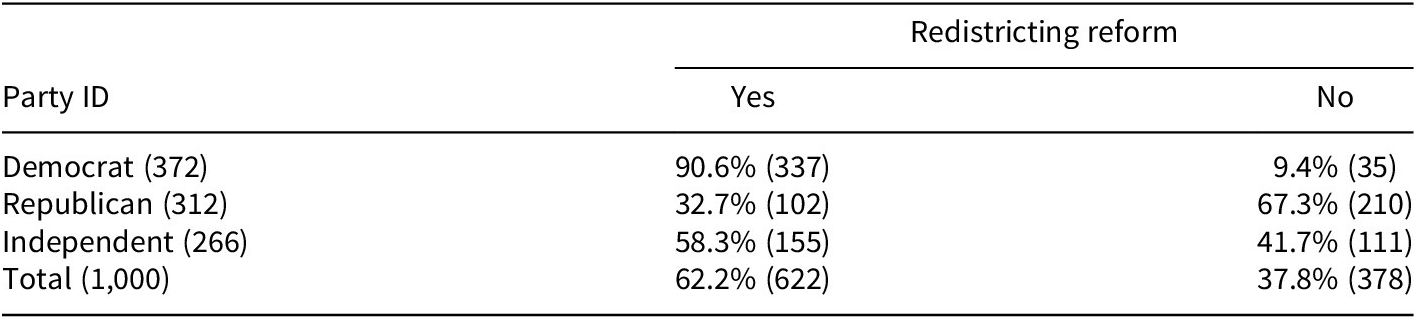
Table 2. Long description
From top to bottom, the first column lists party identification: Democrat with 372 respondents, Republican with 312, Independent with 266, and Total with 1,000. The second column shows the percentage and count supporting redistricting reform: Democrats 90.6 percent (337), Republicans 32.7 percent (102), Independents 58.3 percent (155), and Total 62.2 percent (622). The third column shows those not supporting reform: Democrats 9.4 percent (35), Republicans 67.3 percent (210), Independents 41.7 percent (111), and Total 37.8 percent (378). A note below the table states: Pearson chi-squared equals 248.0508, probability equals 0.000. Fifty respondents who answered ‘other’ or ‘not sure’ are not included in the table but are included in the total.
Note: Pearson chi2 = 248.0508; Pr = 0.000. Fifty respondents who answered “other” or “not sure” are not included in the table but are included in the total.
Support for redistricting reform by levels of awareness

Table 3. Long description
From top to bottom, the table lists four awareness categories: A lot, A little, None at all, and Total. For ‘A lot’ awareness, 72.9 percent or 290 respondents support reform, 27.1 percent or 108 do not. For ‘A little’, 58.7 percent or 296 support, 41.3 percent or 208 do not. For ‘None at all’, 36.7 percent or 36 support, 63.3 percent or 62 do not. The total row shows 62.2 percent or 622 support, 37.8 percent or 378 do not. The note states Pearson chi-squared equals 48.8622, probability equals 0.000. One non-respondent is included in the ‘None at all’ category.
Note: Pearson chi2 = 48.8622; Pr = 0.000. One respondent who did not answer the awareness question is placed in the not at all category.
Logistic regression models are used to determine support for redistricting reform. The first model provides a base that accounts for all of the variables previously described. The second model includes an interaction between the Democrat and Awareness variables.
Results
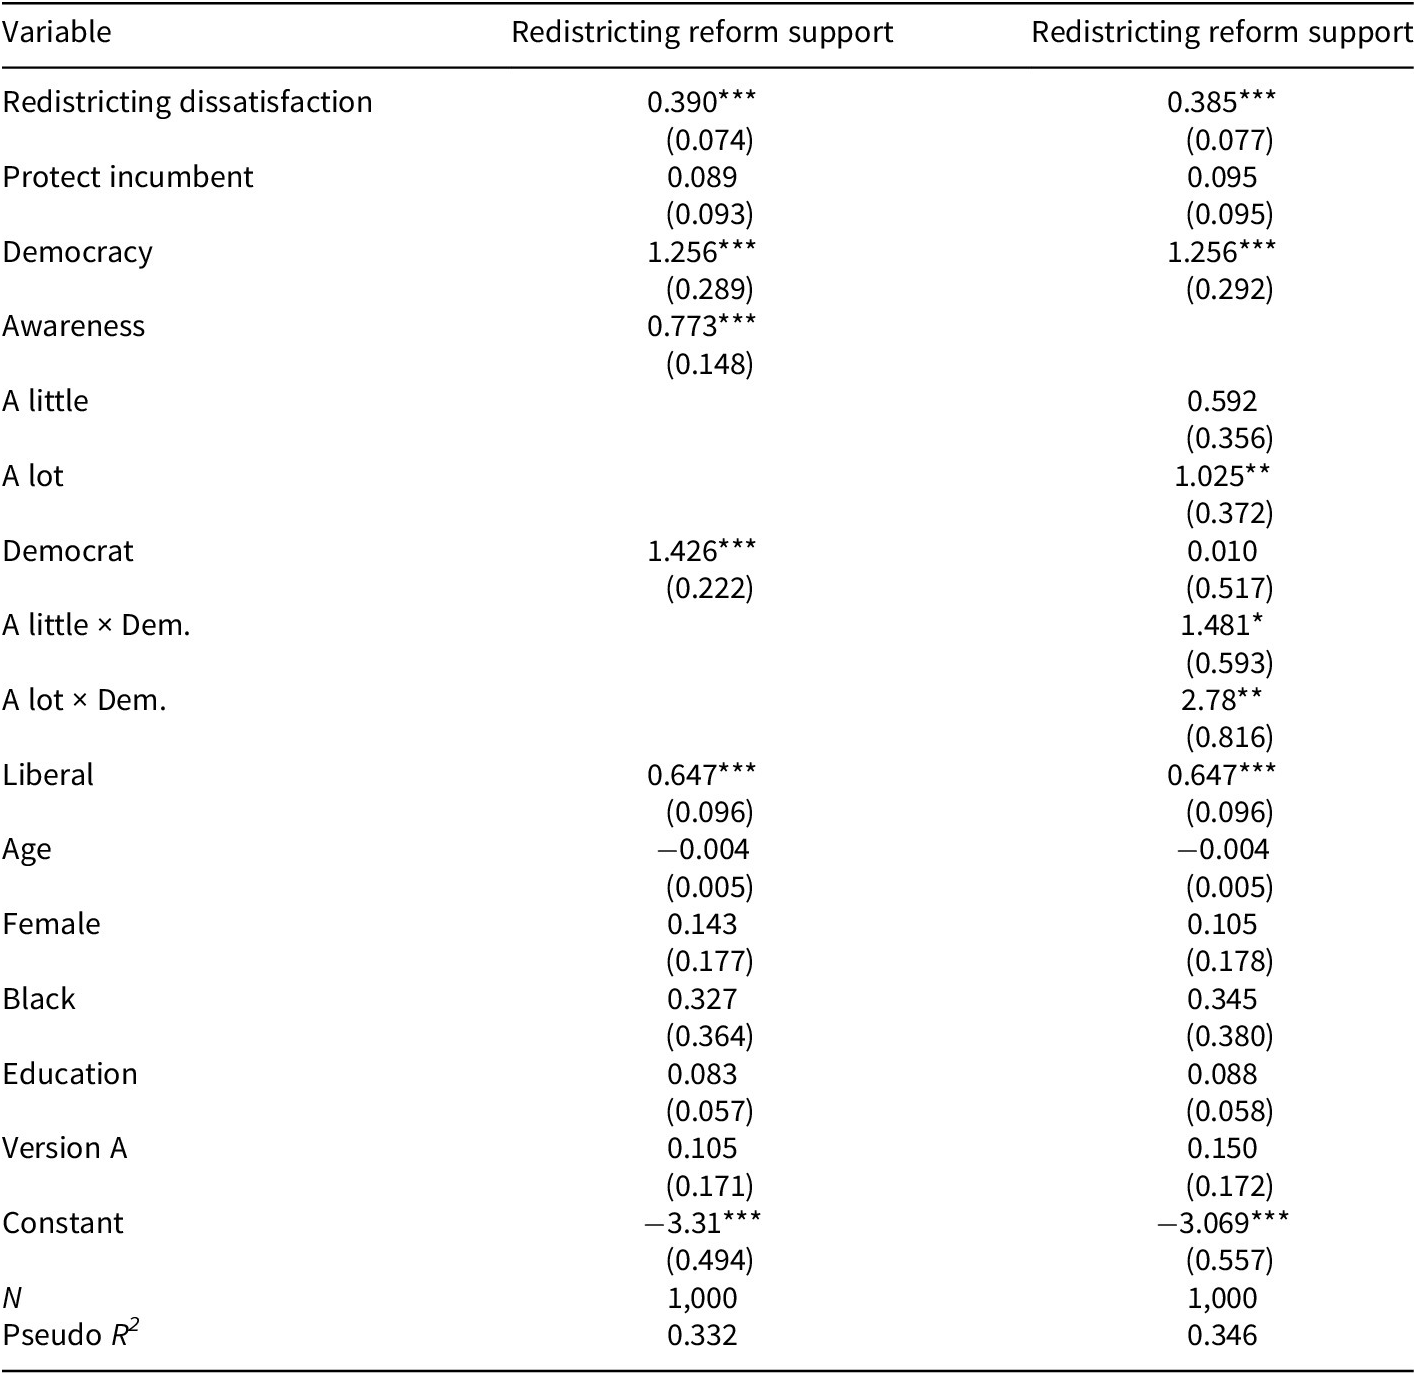
The results indicate that dissatisfaction with redistricting, identifying threats to democracy as the most important election issue, awareness of the redistricting issue, identification with the Democratic Party, and liberal ideology are all important indicators of support for redistricting reform. Of the variables of interest, only the importance of protecting the incumbent is not statistically significant.
The models include several control variables, none of which is statistically significant. In Table 4 we show the results of the logistic regression models, one without an interaction and one with an interaction between Awareness and Democrat.
Logistic regression: support for redistricting reform
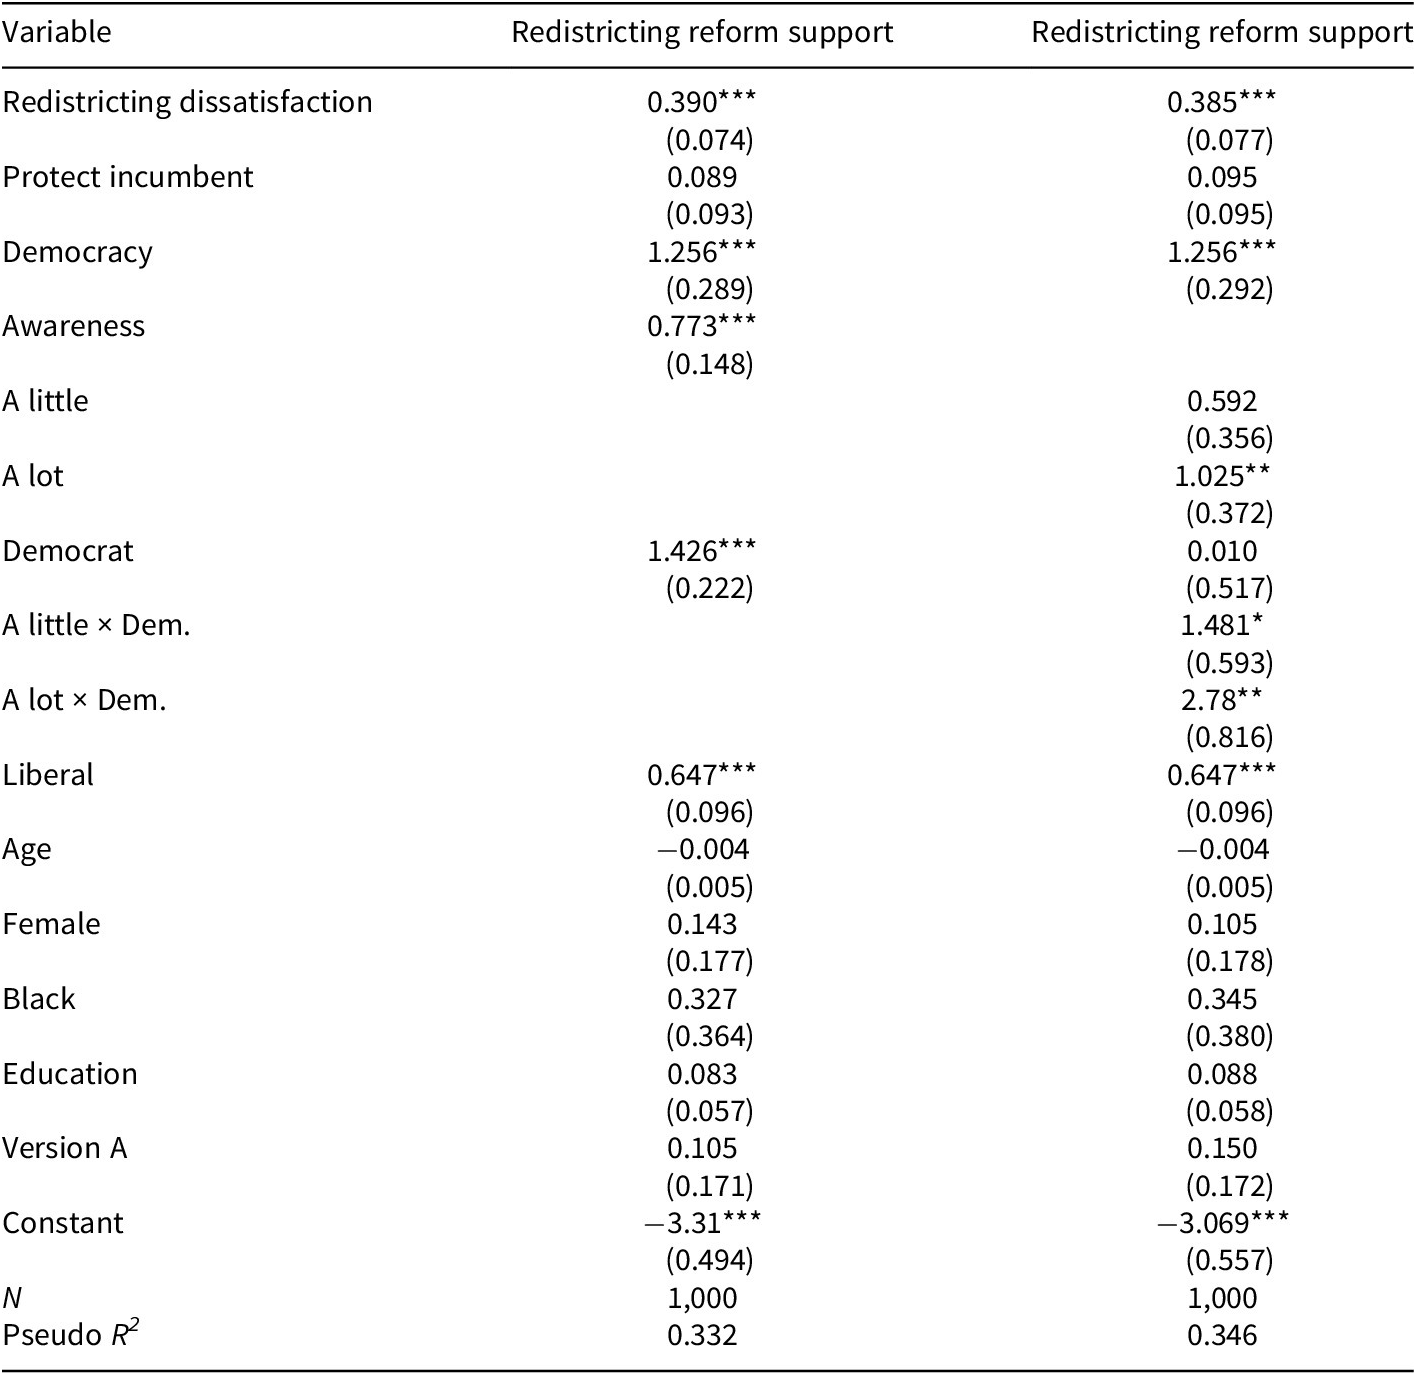
Table 4. Long description
The table has three columns: Variable, Redistricting reform support (Model 1), and Redistricting reform support (Model 2). From top to bottom, the variables and their coefficients with standard errors are as follows. Redistricting dissatisfaction: 0.390 triple asterisk (0.074) in Model 1, 0.385 triple asterisk (0.077) in Model 2. Protect incumbent: 0.089 (0.093) in Model 1, 0.095 (0.095) in Model 2. Democracy: 1.256 triple asterisk (0.289) in Model 1, 1.256 triple asterisk (0.292) in Model 2. Awareness: 0.773 triple asterisk (0.148) in Model 1, blank in Model 2. A little: blank in Model 1, 0.592 (0.356) in Model 2. A lot: blank in Model 1, 1.025 double asterisk (0.372) in Model 2. Democrat: 1.426 triple asterisk (0.222) in Model 1, 0.010 (0.517) in Model 2. A little times Dem.: blank in Model 1, 1.481 single asterisk (0.593) in Model 2. A lot times Dem.: blank in Model 1, 2.78 double asterisk (0.816) in Model 2. Liberal: 0.647 triple asterisk (0.096) in both models. Age: negative 0.004 (0.005) in both models. Female: 0.143 (0.177) in Model 1, 0.105 (0.178) in Model 2. Black: 0.327 (0.364) in Model 1, 0.345 (0.380) in Model 2. Education: 0.083 (0.057) in Model 1, 0.088 (0.058) in Model 2. Version A: 0.105 (0.171) in Model 1, 0.150 (0.172) in Model 2. Constant: negative 3.31 triple asterisk (0.494) in Model 1, negative 3.069 triple asterisk (0.557) in Model 2. N: 1,000 in both models. Pseudo R squared: 0.332 in Model 1, 0.346 in Model 2. Coefficients are reported with standard errors in parentheses. Asterisks indicate significance: single asterisk for p less than 0.05, double asterisk for p less than 0.01, triple asterisk for p less than 0.001.
Note: Coefficients reported with standard errors in parentheses; models reported with robust standard errors. *p < 0.05; **p < 0.01; ***p < 0.001.
Predicted probabilities help with interpreting the effects of variables in the models. The marginal effects presented are the average of all of the marginal effects from observations in the data. These marginal effects show the influence of a change in one variable in the model. For example, the change from very satisfied with redistricting to very dissatisfied with redistricting increases the probability of supporting redistricting reform from 0.49 to 0.73, respectively. The predicted probability for supporting redistricting reform increases from 0.60 to 0.78 for respondents who stated that the most important election issue was threats to democracy. Similarly, ideology has a strong influence with a predicted probability of 0.43 for very conservative respondents and 0.84 for very liberal respondents.
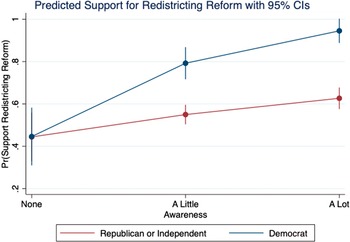
The results reveal interesting findings regarding partisanship and awareness of the redistricting issue. A change from non-Democrats (i.e., Independents and Republicans) to Democrats results in an increase in the probability of supporting redistricting reform from 0.56 to 0.79, respectively. The average marginal effects at the different levels of awareness are 0.48 for no awareness at all, 0.60 for a little awareness, and 0.71 for a lot of awareness of the redistricting issue. Importantly, our results show an interaction effect between these two variables. Figure 1 is a graph of the interaction effect showing the predicted probability of support for redistricting reform by party at different levels of awareness of the issue. The figure shows that there is no difference between Democrats and non-Democrats in support for redistricting reform among respondents with no awareness of the issue at all. Both Democrats and non-Democrats are below the 0.50 threshold (0.45) at the lowest level of awareness. As awareness rises, both groups have increased probabilities for supporting redistricting reform, but Democrats are significantly more likely to support. While Democrats are stronger supporters, both Democrats and non-Democrats break the 0.50 threshold with even just a little awareness of redistricting reform.
Predicted probabilities for support for redistricting reform.

Figure 1. Long description
The x axis is labeled Awareness with three categories from left to right None, A Little, A Lot. The y axis is labeled P R open parenthesis Support Redistricting Reform close parenthesis and ranges from 0.2 to 1. Two lines are plotted. The red line represents Republican or Independent and the blue line represents Democrat. At None, both groups start near 0.4 probability. As awareness increases, the Democrat line rises steeply, reaching about 0.8 at A Little and nearly 1 at A Lot, with visible 95 percent confidence intervals at each point. The Republican or Independent line increases gradually, reaching just above 0.6 at A Lot. The legend at the bottom identifies the red line as Republican or Independent and the blue line as Democrat.
Replacing the Democratic measure of partisanship with the Republican in the interaction with awareness yields similar results. Predicted probabilities for Republican support for redistricting reform at different levels of awareness of the issue show support above 0.50 at all levels. Interestingly, Republicans are above the 0.50 threshold with no awareness, while Democrats and non-Democrats are below, but the difference is not statistically significant. The differences are stark, with a little awareness and a lot of awareness where Democrats have much higher support for reform than Republicans (0.79 vs 0.63 and 0.94 vs. 0.60, respectively).
Robustness checks indicate that the results of this analysis are not highly sensitive to changes in the models. In terms of direction and statistical significance, the results remain the same for the base model and the interaction model when any one of the non-control variables is dropped. Also, a Variance Inflation Factor (VIF) test of multicollinearity shows a mean VIF of 1.27, which is well below the standard threshold for multicollinearity. No individual VIF score is above 1.85. Interaction terms often yield higher VIF scores, and when the interactions are included in the model, the mean VIF score is 3.45, still well below the typical threshold of 10 (O’Brien Reference O’Brien2007). Only one subset of the interaction exceeds 10 with Democrats, with no awareness having a VIF score of 11.27. It is worth noting that this is a small subset of respondents (n = 32), and overall, the model performs well. The results of the research presented here are robust. Issue awareness and partisanship are strongly related to support for redistricting reform.
Discussion, context, and conclusion
The results demonstrate the importance of partisanship and issue salience. While Democrats strongly supported redistricting reform in Ohio, Republicans strongly opposed. The reforms were vigorously supported by respondents with a lot or a little information about the issue and opposed by those who knew nothing at all. The results show no difference in support by partisanship for those with no awareness of the issue. With a little or a lot of awareness, there are significant differences in support among Democrats and non-Democrats. As previous research has shown, voters take cues from partisan elites. For those unaware of the redistricting issue, they are unable to take cues from the party elites because they do not know enough about the issue. As voters learn more about the redistricting issue, they are better able to take cues about what positions they should support. Ultimately, partisanship only matters if voters have at least a little awareness about the issue of redistricting reform.
Democrats, left-leaning interest groups, and organized labor supported Issue 1. Nearly $51 million was spent on Issue 1, with supporters outraising opponents by six to one (Ballotpedia 2024). Polls, including the one published with the data from this research, showed that Ohioans supported redistricting reform. However, a number of factors worked against the reform. Framing and negativity bias may have helped defeat the ballot initiative, but even more important would be the influence of the party. When Ohioans vote on an initiative, they view a summary of the Issue. They can also read the entire proposal at the polling station, but the summary they actually see on their voting machine is very important.
In August of 2024, the Ohio Ballot Board approved the controversial summary language of the proposal. For example, Republican state senator and Ballot Board member Teresa Gavarone proposed an amendment that passed the five-member board by a 3–2 vote along party lines to read that the commission would be “required to gerrymander.” Further, the summary language said Issue 1 would eliminate “the longstanding ability of Ohio citizens to hold their representatives accountable for establishing fair state legislative and congressional districts,” and that the Issue would “repeal constitutional protections against gerrymandering approved by nearly three-quarters of Ohio electors participating in the statewide elections of 2015 and 2018” (Tebben Reference Tebben2024a). After some court challenges, the final summary language left the confusing substance of the synopsis unchanged.
Case study research has shown that institutional factors have contributed to different political outcomes in recent years in Michigan and Ohio (Wells and Jackson Reference Wells and Jackson2023). Voting and registration laws, redistricting processes, and ballot measures influence electoral outcomes. When Michigan voters adopted a nonpartisan citizen redistricting commission, they did so in a non-presidential election year. In addition to potentially deceptive question wording, Ohio voters’ consideration of redistricting reform during a high turnout presidential election year may have contributed to the defeat of the reform.
Then-former President Trump also inserted himself into the campaign and used his popularity in Ohio to help defeat Issue 1. On September 21, 2024, Donald Trump posted the following on his Truth Social Network: “Ohio Democrats and left-wing special interest groups are spending more than $26 million to rig Elections through the Issue 1 redistricting scam. Issue 1 would guarantee that unqualified redistricting commissioners are not accountable to Ohio voters, and would be impossible to remove them if they abuse their power—Issue 1 will cost Ohio taxpayers millions of dollars, and would force the State to pay redistricting commission lawyers unlimited legal expenses, with no accountability. Ohio voters need to stop this Democrat takeover of legislative redistricting.” In a state Trump carried by eight points in 2016 and 2020 and would go on to carry by 11 points in 2024, the endorsement of the then-former president likely carried a lot of weight. Note that the former president made claims that the commissioners would be impossible to remove and that the process would cost taxpayers money. These concerns were also raised in the Ballot Board language. The messaging by Republicans was clear and consistent.
The September 2024 BGSU Democracy and Public Policy Research Network poll was in the field from September 18 to September 27. Results of that poll showed 60% of likely voters planned to vote Yes on Issue 1 (Alexander, et al. Reference Alexander, Miller, Jackson, Kalaf-Hughes and Boston2024a). The October Poll showed support falling to about 57%. In the September Poll, 82% of Democrats, 41% of Republicans, and 57% of Independents said they planned to vote Yes on Issue 1. In the October poll, Democratic support reached about 91%, while Republican support had fallen to about 30%, and Independent support had fallen to about 56% (Alexander, et al. Reference Alexander, Miller, Jackson and Boston2024b). This suggests President Trump’s position-taking mattered, at least among Republicans who appear to have followed his lead, and Democrats who evidently rejected it.
This leads to the issue of the timing of the referendum. Ohio voters went to the polls three times in 2023. First, in August of that year, they voted 57%–43% against a Republican effort to make it harder to change the Ohio constitution by increasing the threshold from 50% + 1 of voters to 60%. Then in November, they voted overwhelmingly to protect abortion rights and to legalize recreational marijuana. Perhaps supporters of gerrymandering reform thought it best to strike while the iron was hot, but in retrospect, having the referendum on the presidential ballot may have been a mistake. What if they had waited until 2025? Turnout would likely have been much lower, potentially giving an advantage to the more energized side. Trump’s endorsement, had it even happened, would almost certainly have meant less without his name on the ballot and with his approval ratings tanking in the summer of 2025 (Brenan Reference Brenan2025).
Future research on support for redistricting reform should try to account for election cycles and institutional factors that influence turnout, along with the factors examined here. This can be done quantitatively, but it would also benefit from actors in the campaign explaining why choices were made, which may be more difficult to obtain. On the other hand, then-Ohio Republican Party Chair Alex Triantifilou seemed to suggest that confusing the voters was a deliberate strategy, or at least beneficial to the cause of defeating Issue 1, when he told Sandusky County Republican Party leaders, “A lot of people were saying, ‘We’re confused! We’re confused by Issue 1.’ Did you all hear that? Confusion means we don’t know, so we did our job.” He added, “Confusing Ohioans was not such a bad strategy” (LaPointe Reference LaPointe2025). There is definitely a story here worth telling.
Data availability statement
Replication materials are available on SPPQ Dataverse at https://doi.org/10.7910/DVN/LHEUZJ (Wells and Jackson 2026).
Funding statement
The authors received no financial support for the research, authorship, and/or publication of this article.
Competing interests
The authors declare no potential competing interests with respect to the research, authorship, and/or publication of this article.
Author biographies
Dominic D. Wells is an Associate Professor of Political Science at Bowling Green State University in Ohio. He is the author of the book From Collective Bargaining to Collective Begging: How Public Employees Win and Lose the Right to Bargain.
David J. Jackson is a Professor of Political Science at Bowling Green State University in Ohio. His major research interests include the links between young people’s entertainment media use habits and their political preferences, as well as celebrity involvement in politics.

 Open access

