


Introduction
Tuberculosis (TB) is the ninth leading cause of death worldwide and the leading cause of death from a single infectious agent in 2016 [1]. The estimated years of life lost with TB were 40 718.8 thousands in 2016 [Reference Naghavi2]. An estimated 10.4 million people (incident cases) fell ill with TB in 2016 worldwide [1]. China ranks fifth among the 30 TB high-burden countries during the period 2016–2020 [1]. Globally, the TB incidence is falling at about 2% per year, and this needs to improve to 4–5% per year by 2020 to reach the first milestones of the End TB Strategy [1]. In China, TB is categorised to class B notifiable diseases, and the incidence ranks second among all of the class B notifiable diseases [3]. The seasonal autoregressive integrated moving average (SARIMA) model is widely used to predict the incidence of infectious diseases [Reference Yu4–Reference Liu7], and also adopted as the main method in TB prediction around the world [Reference Zhang8]. However, TB seasonality in China was mainly reported in local areas and the recent nationwide trend has not been reported [Reference Zhang8, Reference Wang9]. Analysis of the seasonality is critical to identify the emerging concerns and provide evidence for prevention and control strategies on TB [Reference Zhang8]. In addition, in recent years, nationwide TB prediction in other countries was mainly based on the SARIMA model that only considers linear information [Reference Korthals Altes10–Reference Bras12]. Therefore, in this study, we adopted the SARIMA model and the generalised regression neural network (GRNN) model that considers both linear and non-linear information to assess the nationwide TB seasonality in China.
Materials and methods
Data collection
The monthly and annual notification data for notifiable diseases including TB from 2005 are released by the National Health and Family Planning Commission of the People's Republic of China [3]. In China, all TB cases verified by the clinical or laboratory diagnosis must be reported within 24 h, and then must be checked by professionals from local centres for disease control and prevention. Duplicate cards from the same case must be checked and addressed by the end of each month. The monthly notification rate of TB from 2005 to 2017 is included in this study. Ethical approval is not required for this study because these are secondary data for public access.
Statistical analysis
Smoothing was first conducted to discern underlying patterns because of the high-frequency variations of the time series. Monthly TB notification rate from 2005 to 2016 was used as the modelling dataset, and data from 2017 were used as the forecasting dataset. The basic structure of a SARIMA model represents as SARIMA (p, d, q) (P, D, Q)S, where p, d and q are the autoregressive order, number of difference and moving average order, respectively; P, D and Q are the seasonal autoregressive order, number of seasonal difference and seasonal moving average order, respectively; and S is the length of the seasonal period. SARIMA was modelled with the Box and Jenkins strategy [Reference Box13] including the following four stages. First, the Augmented Dickey–Fuller (ADF) method was used to determine whether the sequence was stationary, and logarithmic transformation and/or differencing could be adopted if the sequence was not stationary. In addition, the stationary sequence should not be a white noise, which was assessed with Ljung–Box portmanteau test. Second, the autocorrelation coefficient (ACF) and partial autocorrelation coefficient (PACF) of the above stationary sequence were employed to identify the optional model parameters (p, d, q and P, D, Q) to establish one or more alternative models. Third, goodness-of-fit tests of the Akaike information criterion (AIC) and Bayesian information criterion (BIC) were used to select the best SARIMA model from competing alternatives, which should comply with the parametric test and the Ljung–Box portmanteau test that its residual series should be a white noise. Finally, mean error rate (MER) and determination coefficient (R 2) were used to evaluate the accuracy of the most preferred model [Reference Anwar14].
After SARIMA model was established that considers the linear part of the actual data, the GRNN model was used to capture the non-linear information [Reference Specht15]. Among the various artificial neural network models, the GRNN model shows the advantage of strong ability for non-linear mapping, good learning ability skills and forecasting performance. Furthermore, construction of the GRNN model is straightforward and only has a regulation parameter, the smoothing factor. Therefore, the GRNN model is also adopted to predict the incidence of infectious diseases [Reference Zhang16]. The estimated monthly notification rate from SARIMA and corresponding original values were used as two inputs, while there is one output that was the reported monthly notification rate from the GRNN model. The smoothing factor was chosen with the method proposed by Specht [Reference Specht15] that the best smoothing factor was chosen at which the root mean square error (RMSE) of the network was the lowest.
An average of decreasing trend per year was performed using a weighted linear regression on the year-specific incidence, using year as the independent variable and year-specific number of population as weights. All analyses were conducted with Stata 10.0, except for the GRNN model for which Matlab 7.0 software package (Math Works Inc., Natick, MA, USA) was used.
Results
SARIMA model
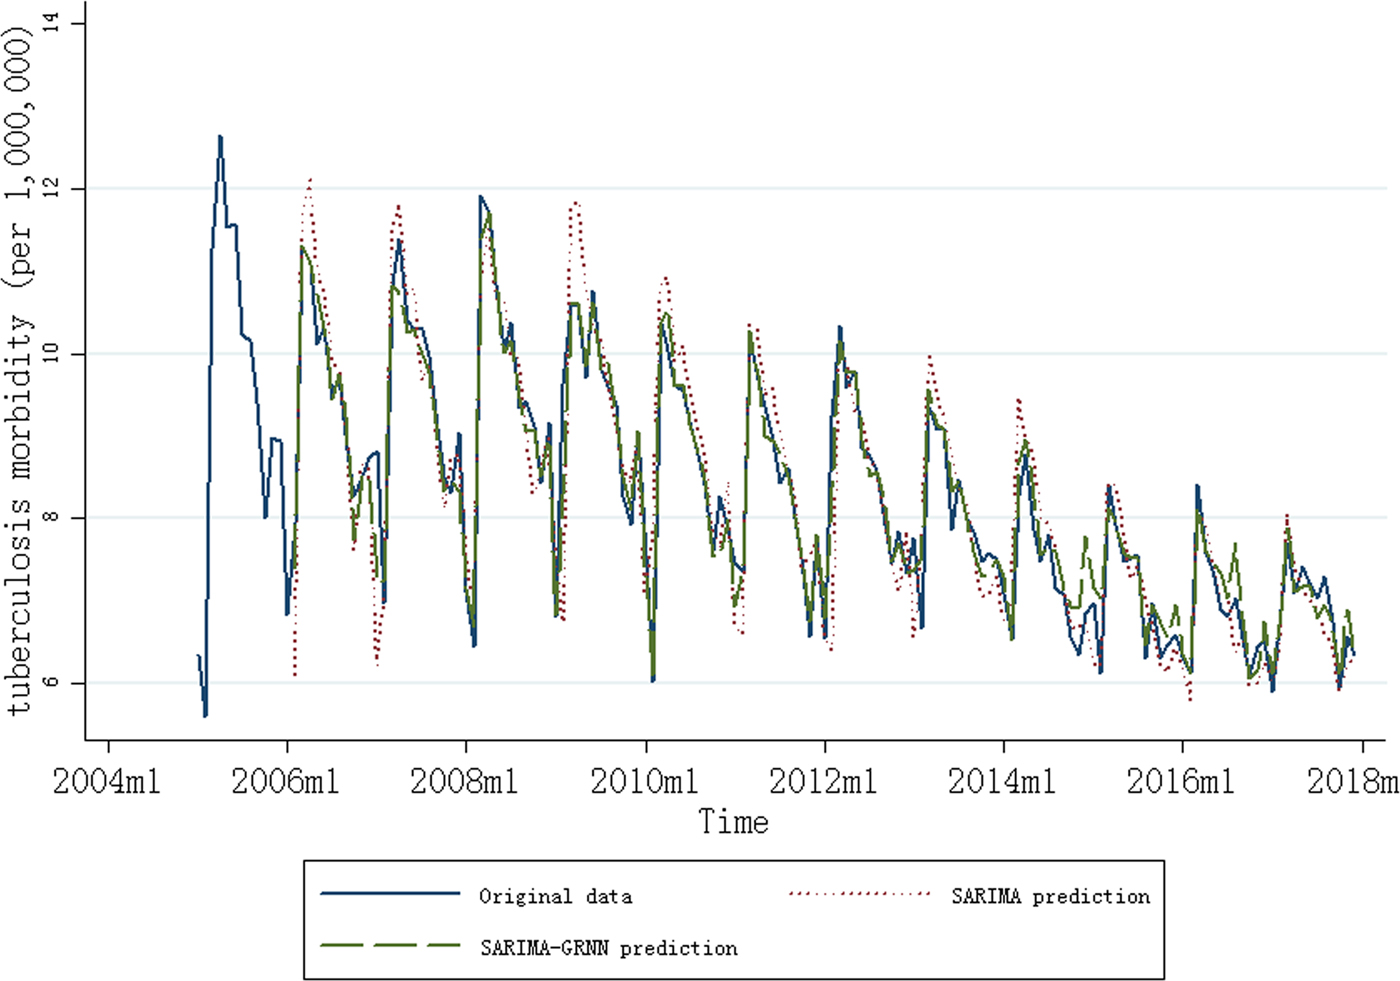
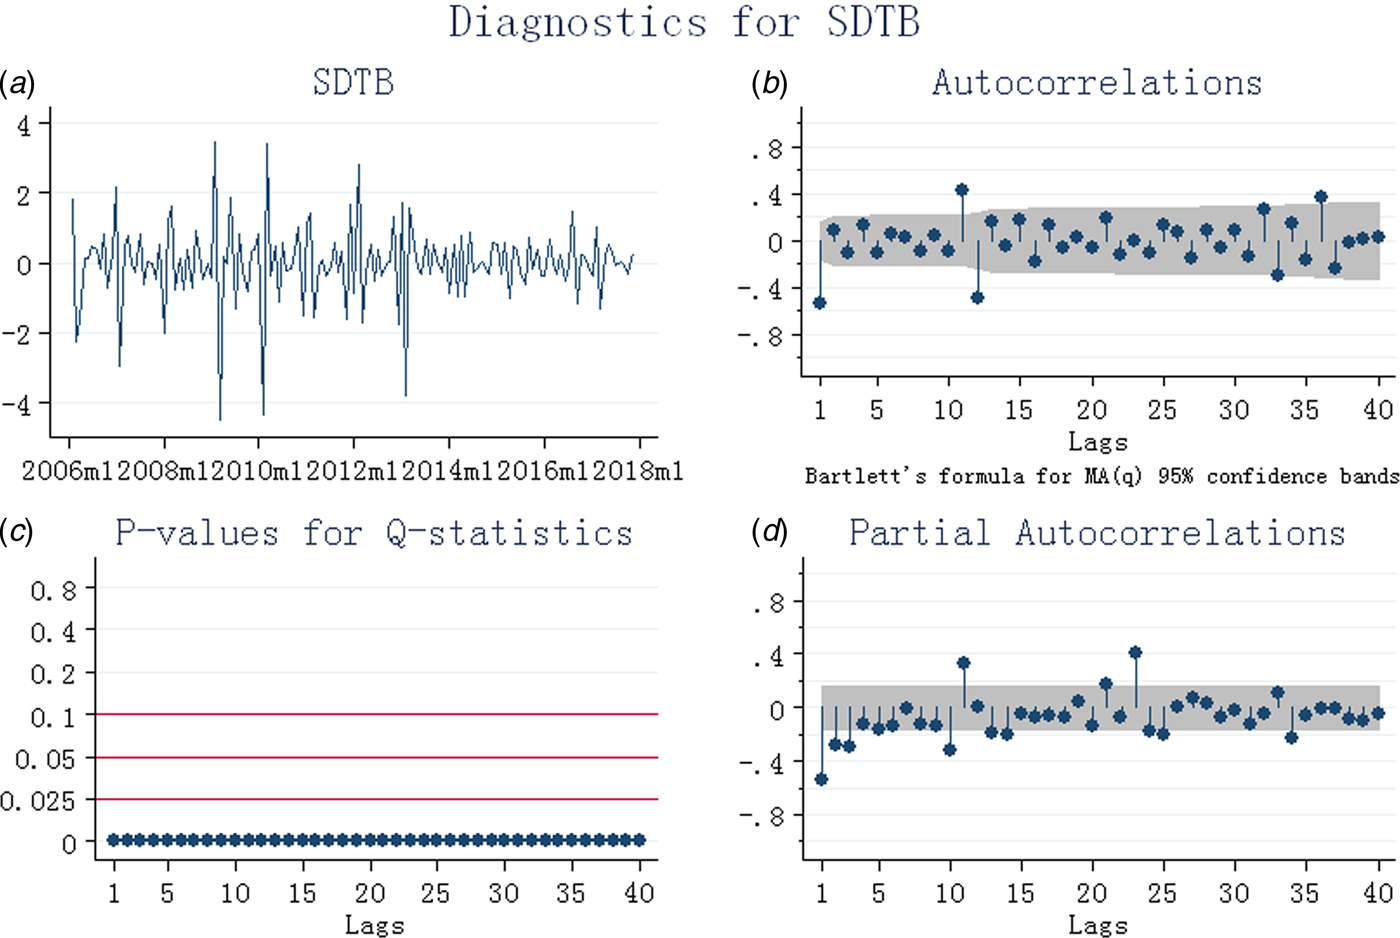
A decreasing trend (3.17% per years, P < 0.01) and seasonal variation of TB notification rate were found from 2005 to 2016 in China. The seasonal pattern showed that the peak was observed during the spring season (March, April and May) and June (Fig. 1, Supplementary Fig. S1). The time series was stationary (ADF test: t = −21.88, P < 0.001) after the first-order regular difference and the first seasonal difference (Fig. 2). In addition, the stationary sequence was not a white noise (P < 0.01) (Fig. 2). The ACF and PACF graphs (Fig. 2) were used to explore the parameters of the ARIMA model, and several candidate models were identified accordingly (Supplementary Table S1). As described above, the most preferred model must show the minimum values of AIC and BIC, and also should comply with the parametric and residual tests. Finally, SARIMA (0,1,1) (0,1,1)12 was identified as the most appropriate forecasting model, and the monthly TB notification rates in 2017 were then forecasted. Diagnostics for residual series are shown in Supplementary Figure S2.
Monthly notification rate of tuberculosis (January 2005 to December 2017) and results of the SARIMA and SARIMA–GRNN models (February 2006 to December 2017).
Diagnostics for tuberculosis after first-order regular difference and the first seasonal difference (SDTB). (a) Stationary test; (b) autocorrelation coefficient graph; (c) white noise test; (d) partial autocorrelation coefficient graph.
SARIMA–GRNN model
After first-order regular difference and the first seasonal difference, 13 samples were lost in the SARIMA–GRNN model construction. The smoothing factor between 0.01 and 1.00 with an interval of 0.01 was used to identify the minimum RMSE, because higher RMSE was found when smoothing factor was <0.01 or >1.00 (Supplementary Fig. S3). The best smoothing factor was chosen at 0.02 for which the RMSE (0.28) of the network was the lowest (2014m10 and 2016m5 were randomly chosen as the testing samples). The forecasting outcomes of the SARIMA model from January 2017 to December 2017 were selected as the entry value of the GRNN model, and the output values were the predictive values of the SARIMA–GRNN model. Both the fitting and forecasting performances of the models are shown in Table 1, and the SARIMA–GRNN model showed both higher R 2 and lower MER than SARIMA. The results of the SARIMA and SARIMA–GRNN models are shown in Figure 1.
The fitting and forecasting performance of the two models

SARIMA, seasonal autoregressive integrated moving average; GRNN, generalised regression neural network; MER, mean error rate; R 2, determination coefficient.
Discussion
To our knowledge, this is the first study to report the trend of TB notification rate in recent years in China with the SARIMA–GRNN model. In this study, a decreasing trend of TB notification rate was found (3.17% per years), and there was a seasonality of TB notification rate from 2005 to 2017 in China, with a predominant peak observed during the spring season. The SARIMA (0,1,1) (0,1,1)12–GRNN model performed better than the single SARIMA model in forecasting TB notification rate in China.
A previous review based on 12 studies conducted between the period 1971 and 2006 from 11 countries/regions around the world except for China found that the seasonal pattern of TB in most of the subject countries is predominant during the spring and summer seasons [Reference Fares17]. Seasonality of TB before 2011 in China was assessed in a previous paper [Reference Cao18], and a SARIMA (1, 0, 0) (1, 0, 1)12 model was identified. In addition, the hybrid model also showed better forecasting of TB notification rate than the SARIMA model [Reference Cao18]. However, monthly notification cases were included without considering the yearly number of population in China [Reference Cao18]. In addition, the seasonality and forecasting model of TB in recent years in China has not been assessed. In recent years, country-level seasonality and model construction of TB with time-series analysis have been reported. A time-series decomposition analysis of TB cases reported from 1993 through 2008 found that TB is a seasonal disease in the USA, with a peak in spring and a trough in late fall [Reference Willis19]. In the Netherlands [Reference Korthals Altes10], the time-series analysis of TB cases between 1993 and 2008 showed a seasonal pattern, with a peak in spring and a trough in winter, and the best-fit SARIMA model was SARIMA (0,1,1) (1,0,1)12. Retrospective time-series analysis with TB data collected from 1995 to 2011 in Singapore found that the peak of TB risk was observed in the month of July with relatively more cases reported in March, July and October, but the seasonal difference was not substantial [Reference Wah11]. Singapore is one degree north of the equator, so would be unlikely to exhibit the same seasonal trends as other non-equatorial countries. In addition, a SARIMA (1,0,0) (2,0,0)12 model was identified, and TB risk among the non-resident population was significantly linearly decreasing at a rate of 3% per year [Reference Wah11]. Based on the TB cases diagnosed in 2000–2010 in Portugal [Reference Bras12], the time series showed a downward trend (0.41% per month) in the seasonality of TB diagnosis, with a peak in March and a trough in December [Reference Bras12], and the model that best fits the data was SARIMA(0,1,1)(0,1,1)12. A longitudinal time series from March 2001 to March 2011 in the north of Iran [Reference Moosazadeh20] showed that the highest number of cases was registered in May, and the best model was SARIMA (0, 1, 1)(0, 1, 1)12. Therefore, the seasonality and forecasting model found in this study was comparable to most of the data available. Although the above-mentioned country-level TB prediction was based on SARIMA, the SARIMA–GRNN had been adopted in other circumstances. Based on the data in Hubei province, the hybrid model was found to outperform the traditional SARIMA model in TB prediction [Reference Zhang16], and the hybrid SARIMA–GRNN model also showed better hepatitis incidence forecasting than the single SARIMA model [Reference Wei21].
The exact reason why TB notification rates vary by season is unclear; however, the observation of seasonality leads to assume that TB transmission appears to be the greatest during the winter months. A meta-analysis of observational studies indicated a probability of 70% that a random-chosen healthy individual would have higher serum vitamin D level than an individual with TB [Reference Nnoaham22], although reduced winter sunlight and its potential effect on vitamin D levels did not appear to contribute significantly to seasonality in the USA [Reference Willis19]. Overcrowding, increased humidity, low airflow and diminished amounts of natural ultraviolet light arising from indoor activities contribute to the TB transmission in winter. In addition, the annual Spring Festival in winter (the most important traditional festival in China) witness huge population flows throughout the country by train or bus, which could sharpen the shortcomings of winter related to TB transmission. Therefore, this fact is in accordance with the preclinical period of TB from infection to the development of active TB, i.e. few weeks to several months. Furthermore, TB disease resulting from recent infection with early progression to disease appears to be more influenced by season than disease that results from the activation of latent TB [Reference Willis19]. Other factors also have been suggested to give a plausible explanation including seasonal change in immune function and health care-seeking behaviours [Reference Fares17]. In addition, changes in monthly moving average concentrations of PM2.5, PM10, NO2 and SO2 in China conform to U-shaped patterns with the highest in the winter (December to February) and the lowest in the summer (June to August) [Reference Song23]. Limited data also showed positive associations between ambient air pollution and risk of TB [Reference You24–Reference Lai26]. Therefore, the impact of air pollution on TB warrants further investigation.
In China, vaccination, timely detection and effective treatment may account for the steady decline in TB notification rate in concert. First, the Bacille Calmette–Guerin vaccination coverage in China is more than 99% [1]. Second, all suspected TB cases who seek for healthcare will be confirmed by clinical or laboratory diagnosis, and the confirmed cases must be reported via the reporting system within 24 h. In addition, a nationwide scale-up policy on ‘school TB prevention and control work’ has been launched since 2010, and China already has a policy to screen individuals with human immunodeficiency virus for TB. Third, during the past several decades of steady economic growth, China has made significant progress in combating TB, including three national TB prevalence surveys done in 1990, 2000 and 2010, scaling up the TB control programme (based on the directly observed treatment, short-course strategy) to cover the entire population after 2000, and expanding its free treatment policy to all patients with active TB [Reference Wang27]. Globally, the TB incidence is falling at about 2% per year and 16% of TB cases die from the disease, and these figures need to improve to 4–5% per year and 10%, respectively, to reach the first (2020) milestones of the End TB Strategy. Specific targets include a 90% reduction in TB deaths and an 80% reduction in TB incidence by 2030, compared with 2015. Achieving these targets requires the provision of TB care and prevention within the broader context of universal health coverage, multisectoral action to address the social and economic determinants and consequences of TB and technological breakthroughs. A new vaccine and novel diagnostics and medicines for treatment are key advances needed to end TB transmission. In addition, achieving 90–90–90 targets (i.e., 90% of vulnerable populations screened, 90% diagnosed and started on treatment and at least 90% cured) will help accelerate progress towards reductions in mortality [Reference Suthar28]. In addition, as the seasonality showed a peak of TB cases during spring in China, fully understanding the reasons underlying the seasonality would be very helpful to control TB in China in future.
The strengths of this study included that we included nationwide TB data from 2005 to 2017, and validity of these data was supported by the mandatory notification system in China. However, there are also several limitations. First, the data included all cases verified by clinical or laboratory diagnosis, and it may miss infected individuals that have no access to healthcare professionals leading to under-reporting. However, the influence of un-notified cases on our results could not be of a major concern because the size of gap between the notifications of incident TB cases and the best estimates of TB incidence has been decreasing since the year of 2008 in China [1]. Second, detailed information for TB cases are missing, such as age and sex, which preclude further analysis in this study. Third, other factors that may influence TB transmission and improve the accuracy of prediction model are not available, such as climate and socio-economic parameters. Fourth, using notification date instead of date of diagnosis or onset of TB could influence the seasonality variation. Finally, China is also one of the 20 countries with the highest estimated numbers of incident multidrug-resistant TB cases. However, these data are not available to us, thus further studies are warranted to assess the incidence trends and seasonality of multidrug-resistant TB in China.
In conclusion, TB is a seasonal disease in China, with a predominant peak in spring, and the notification rate of TB decreased by 3.17% per year. The SARIMA–GRNN model may be more effective than the widely used SARIMA model. The presence of risk factors in winter should be considered in decision-making processes.
Supplementary material
The supplementary material for this article can be found at https://doi.org/10.1017/S0950268818001115.
Acknowledgement
This work was supported by Kunshan Special Fund for Social Development and Science & Technology (No.: KS1452).
Conflict of interest
None.


